
Opinion of Residents about the Freight Transport and Its Influence on the Quality of Life: An Analysis for Brasília (Brazil)

 ,
,  and
and 
Abstract
:1. Introduction
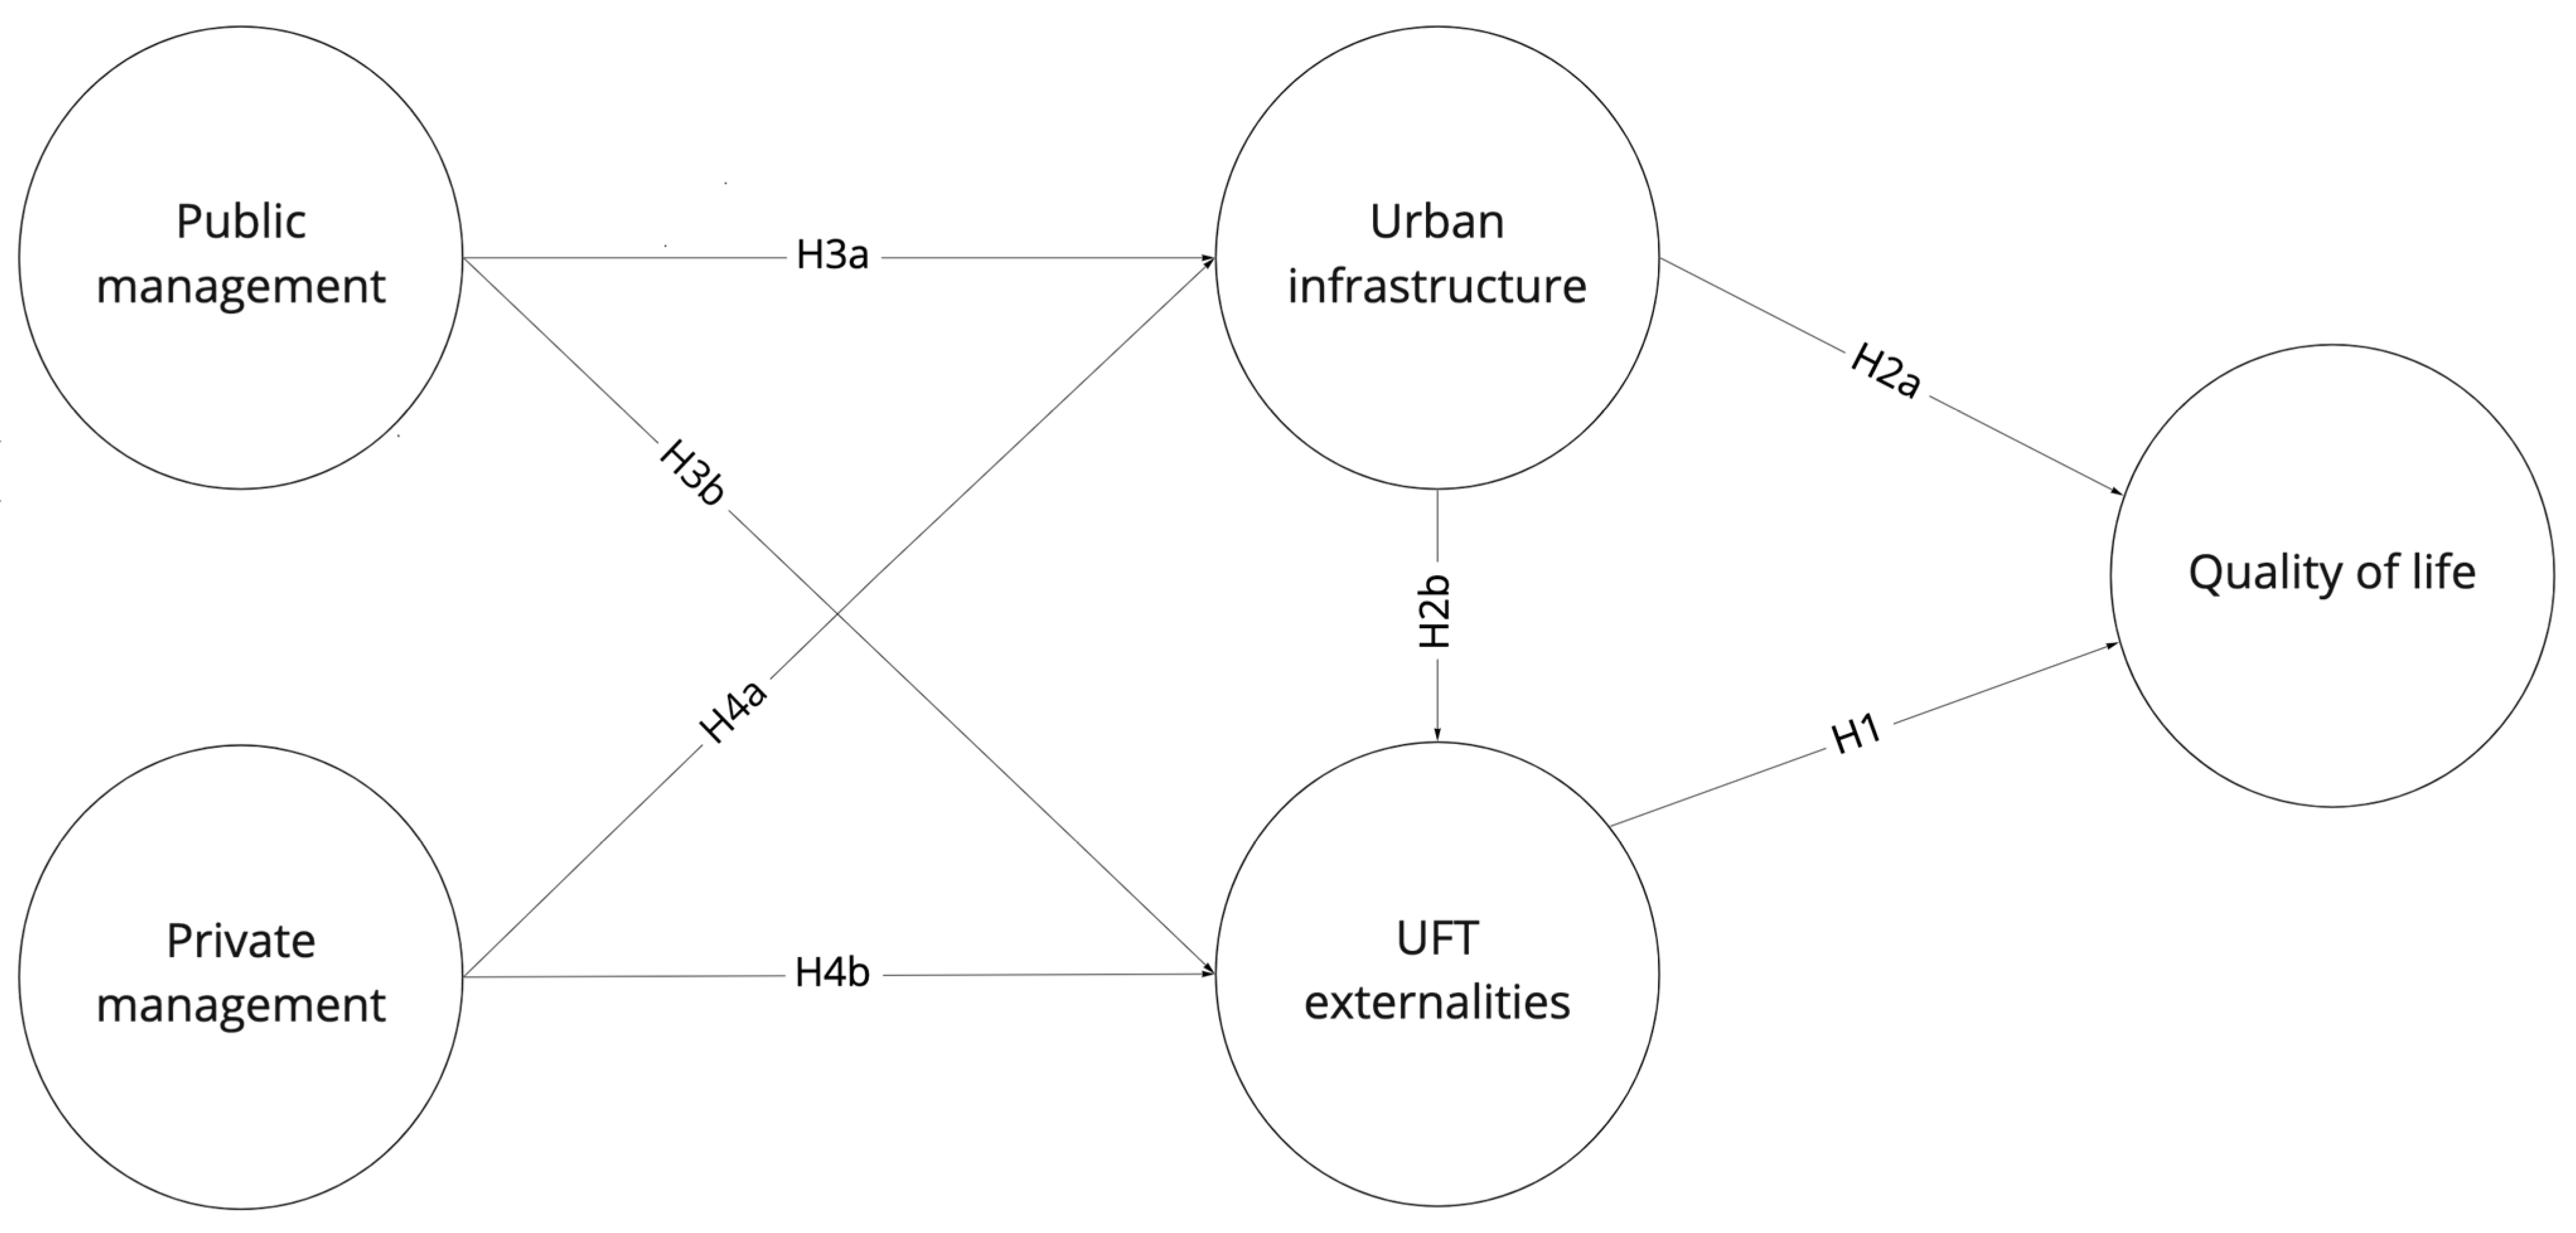
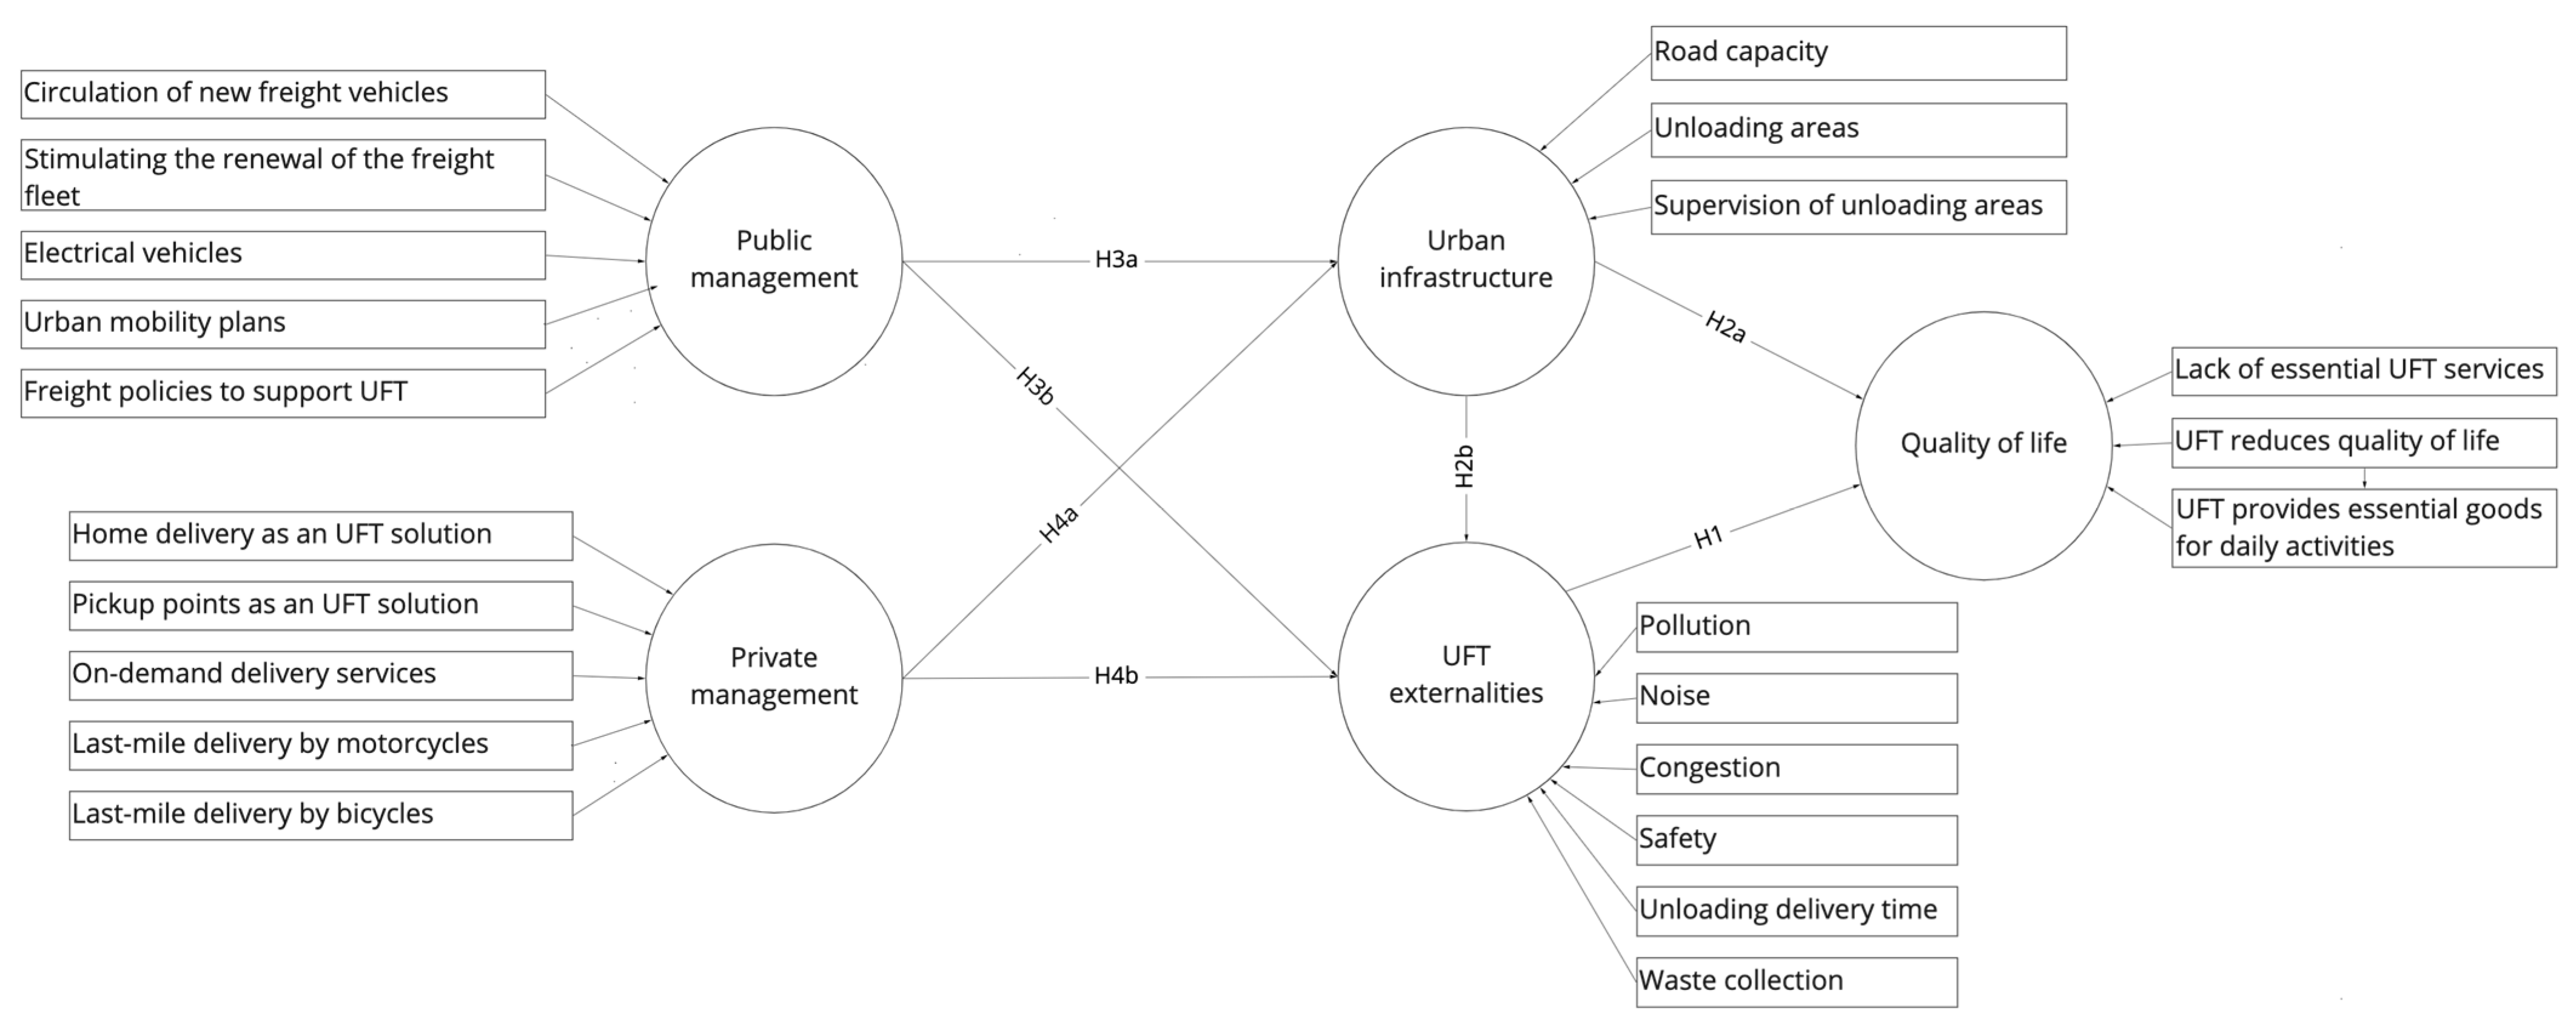
2. Hypotheses and Conceptual Model
3. Research Method
- External collinearity.
- Significance of the structural weights of the variables’ indicators.
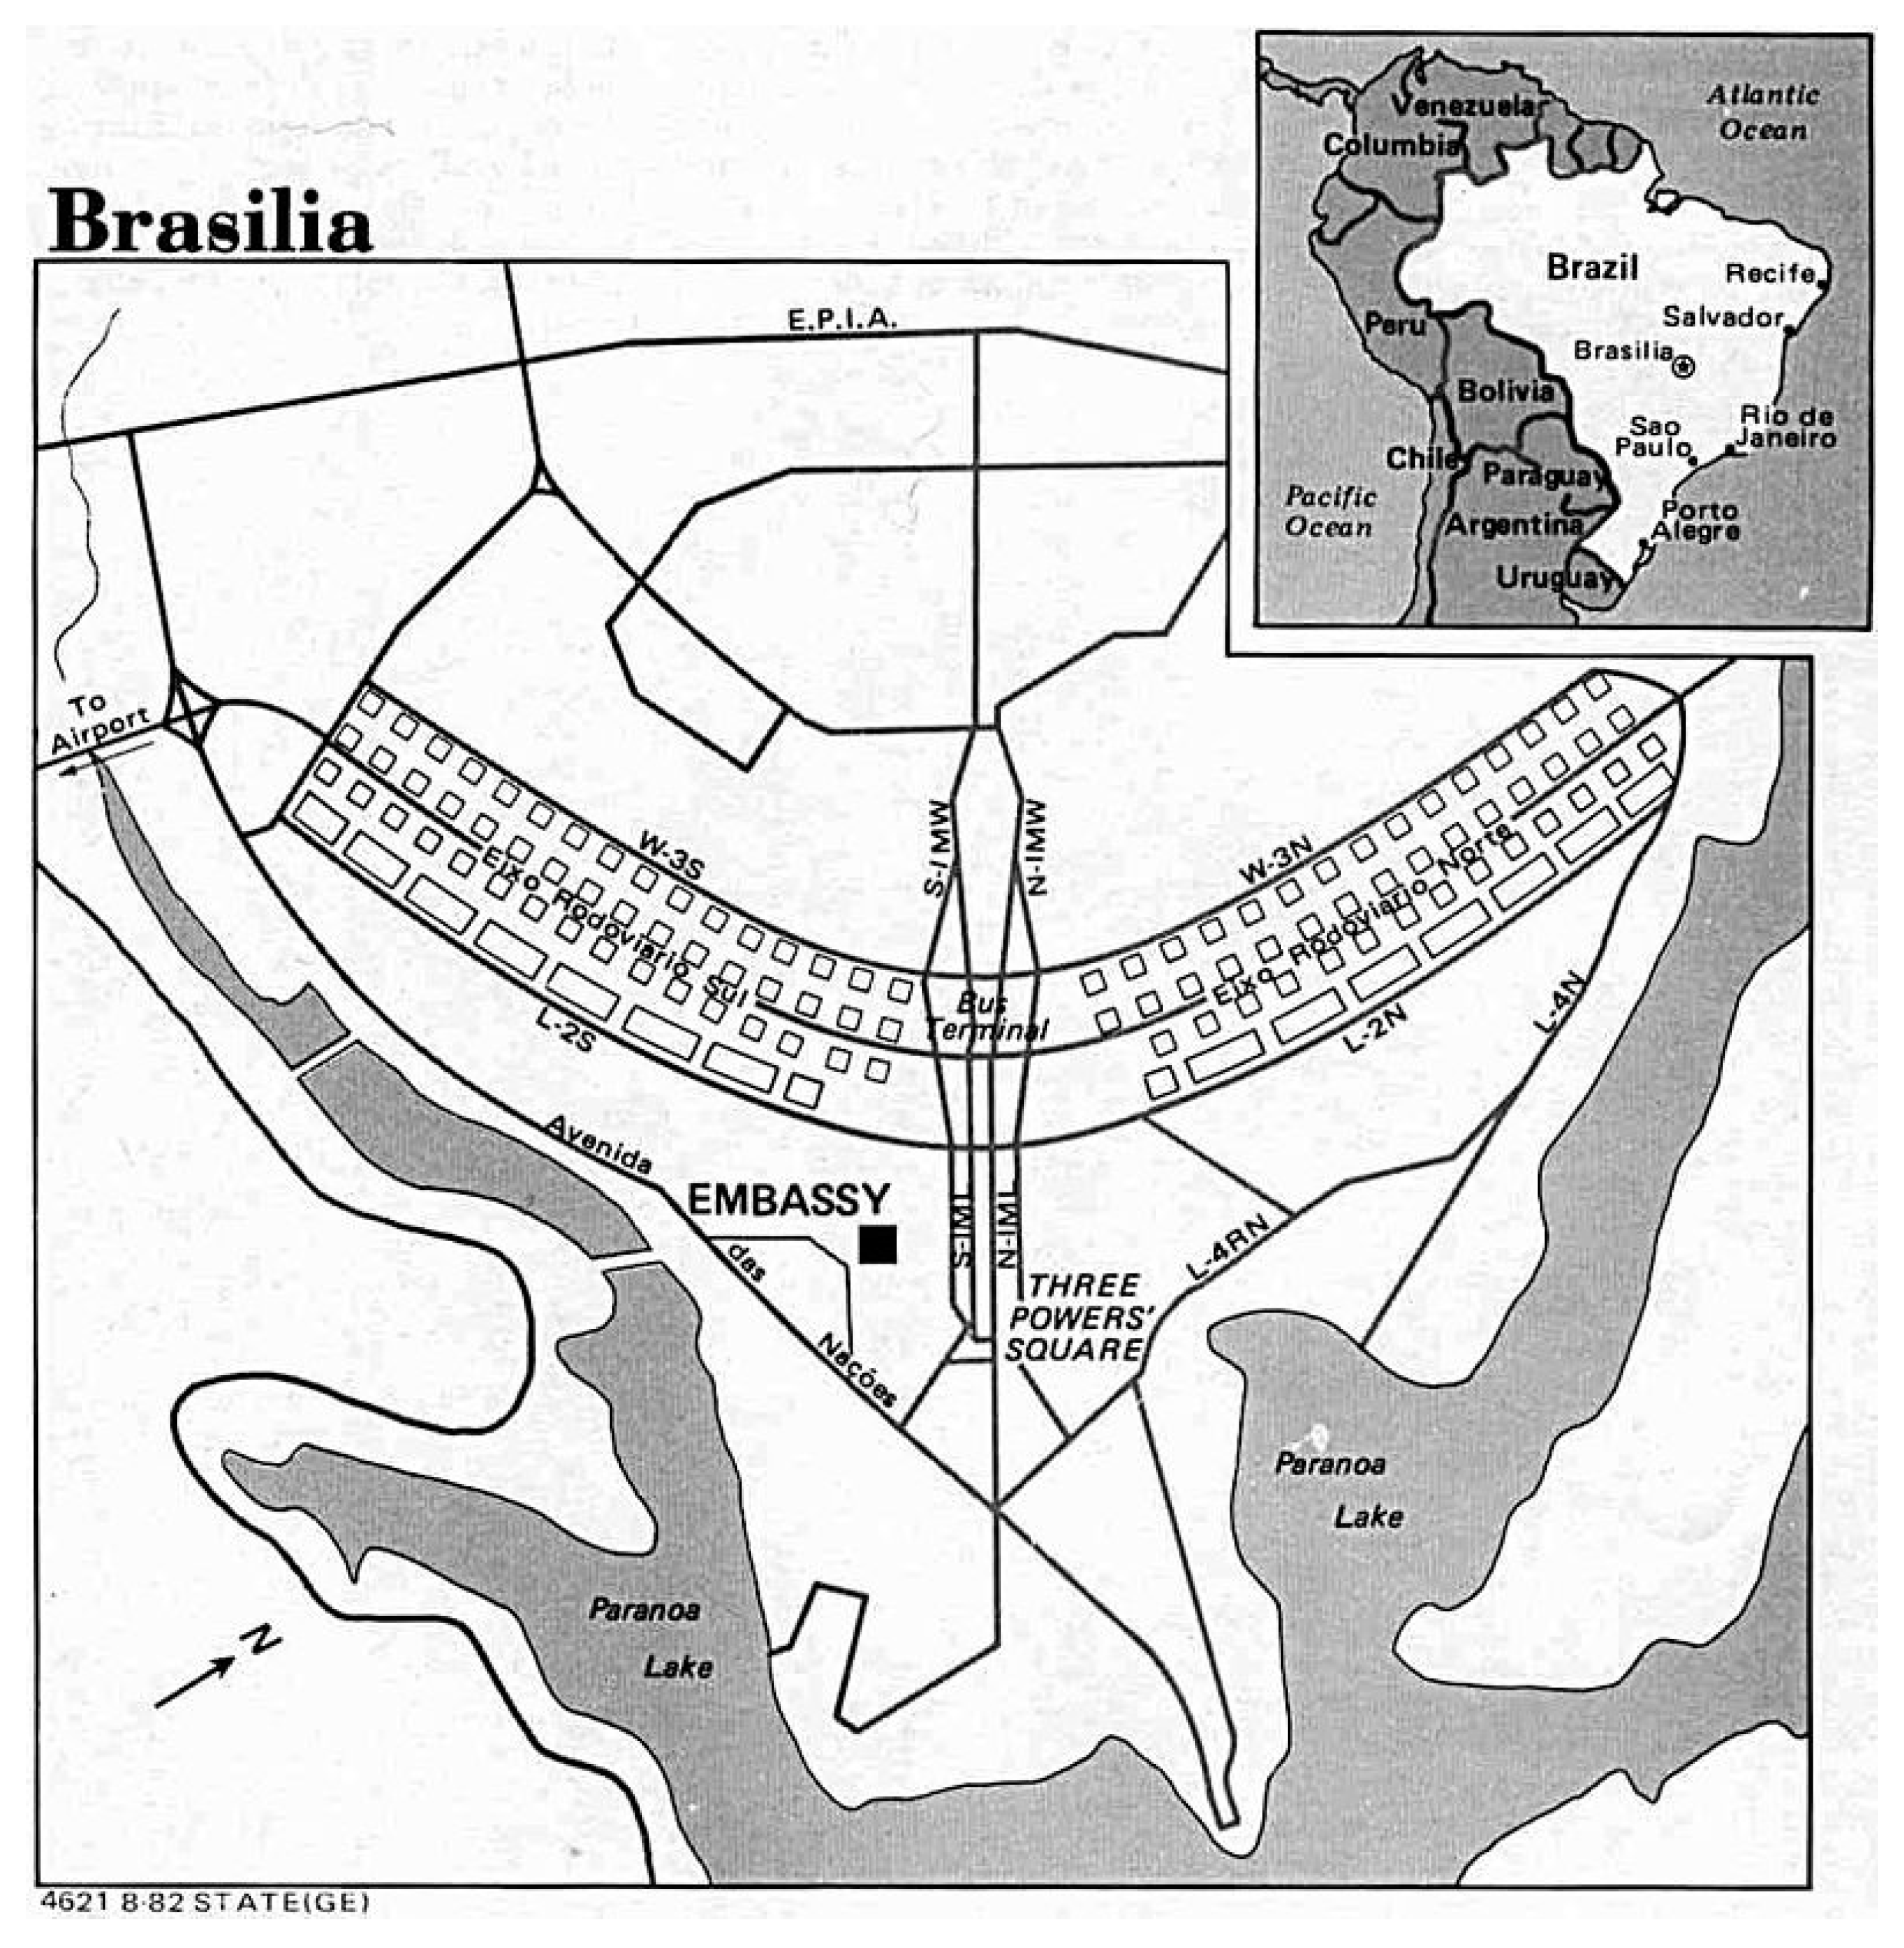
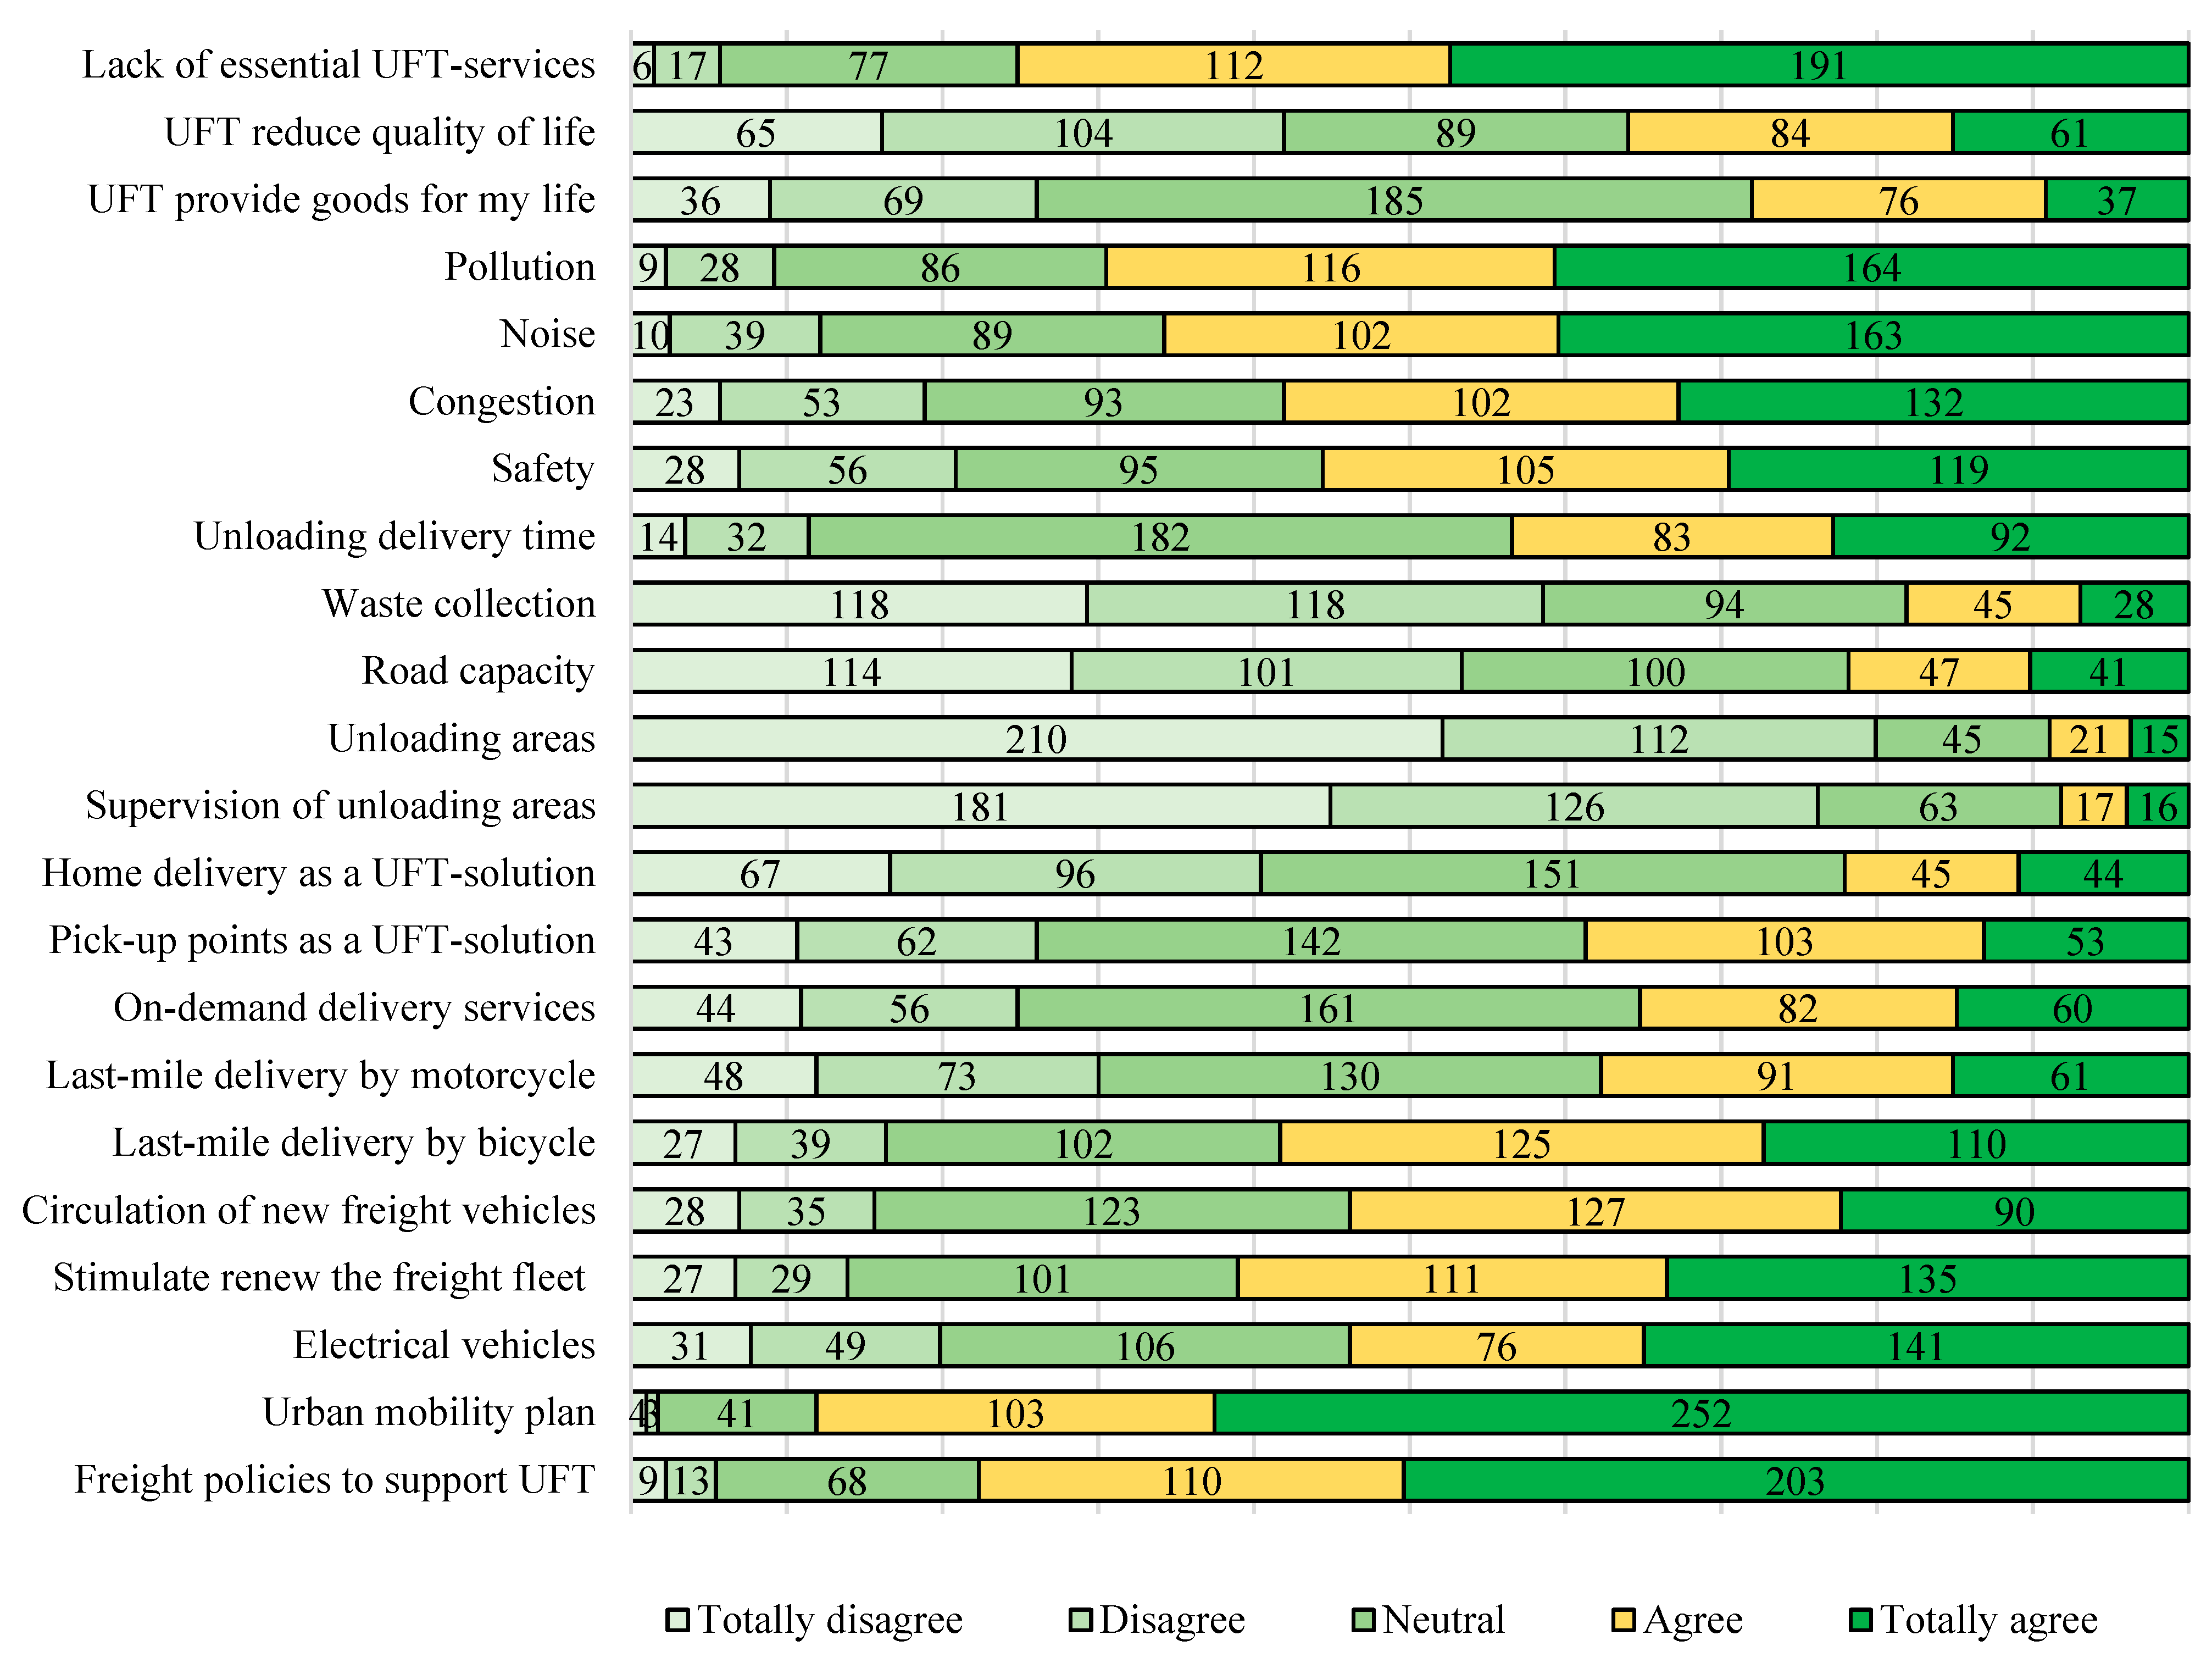
4. Study Area and Results
5. Conclusions
Author Contributions
Funding
Institutional Review Board Statement
Informed Consent Statement
Data Availability Statement
Conflicts of Interest
References
- Pietrzak, K.; Pietrzak, O.; Montwiłł, A. Light Freight Railway (LFR) as an Innovative Solution for Sustainable Urban Freight Transport. Sustain. Cities Soc. 2021, 66, 102663. [Google Scholar] [CrossRef]
- Jiang, Y.; Lai, P.; Chang, C.-H.; Yuen, K.F.; Li, S.; Wang, X. Sustainable Management for Fresh Food E-Commerce Logistics Services. Sustainability 2021, 13, 3456. [Google Scholar] [CrossRef]
- Tanco, M.; Escuder, M. A Multi-Perspective Analysis for the Better Understanding of Urban Freight Transport Challenges and Opportunities in Montevideo. Case Stud. Transp. Policy 2021, 9, 405–417. [Google Scholar] [CrossRef]
- Muñoz-Villamizar, A.; Santos, J.; Montoya-Torres, J.R.; Velázquez-Martínez, J.C. Measuring Environmental Performance of Urban Freight Transport Systems: A Case Study. Sustain. Cities Soc. 2020, 52, 101844. [Google Scholar] [CrossRef]
- García-Gallego, J.M.; Kang, T.; Lacoba, S.R.; Genovese, A. Lorry Park Selection Criteria and Drivers’ Preferences: A Study from the UK. Sustainability 2019, 11, 5214. [Google Scholar] [CrossRef] [Green Version]
- de Gusmão, A.C.S.; Ribeiro, P.C.M. Guidelines for the Efficiency of Urban Goods Distribution: The Brazilian Case. Case Stud. Transp. Policy 2020, 8, 1478–1488. [Google Scholar] [CrossRef]
- de Oliveira, L.K.; França, J.G.d.C.B.; Nascimento, C.D.O.L.; de Oliveira, I.K.; Meira, L.H.; Rabay, L. Evaluating Problems and Measures for a Sustainable Urban Freight Transport in Brazilian Historical Cities. Sustain. Cities Soc. 2021, 69, 102806. [Google Scholar] [CrossRef]
- Holguín-Veras, J.; Leal, J.A.; Sanchez-Diaz, I.; Browne, M.; Wojtowicz, J. State of the Art and Practice of Urban Freight Management Part II: Financial Approaches, Logistics, and Demand Management. Transp. Res. Part A Policy Pract. 2020, 137, 383–410. [Google Scholar] [CrossRef]
- Holguín-Veras, J.; Encarnación, T.; Ramírez-Ríos, D.; He, X.; Kalahasthi, L.; Pérez-Guzmán, S.; Sanchez-Díaz, I.; González-Calderón, C.A. A Multiclass Tour Flow Model and Its Role in Multiclass Freight Tour Synthesis. Transp. Sci. 2020, 54, 631–650. [Google Scholar] [CrossRef]
- Cassiano, D.R.; Bertoncini, B.V.; de Oliveira, L.K. A Conceptual Model Based on the Activity System and Transportation System for Sustainable Urban Freight Transport. Sustainability 2021, 13, 5642. [Google Scholar] [CrossRef]
- Oliveira, L.K.; Nascimento, C.D.O.L.; de Sousa, P.R.; de Resende, P.T.V.; da Silva, F.G.F. Transport Service Provider Perception of Barriers and Urban Freight Policies in Brazil. Sustainability 2019, 11, 6890. [Google Scholar] [CrossRef] [Green Version]
- Holguín-Veras, J.; Leal, J.A.; Sánchez-Diaz, I.; Browne, M.; Wojtowicz, J. State of the Art and Practice of Urban Freight Management: Part I: Infrastructure, Vehicle-Related, and Traffic Operations. Transp. Res. Part A Policy Pract. 2020, 137, 360–382. [Google Scholar] [CrossRef]
- Diana, M.; Pirra, M.; Woodcock, A. Freight Distribution in Urban Areas: A Method to Select the Most Important Loading and Unloading Areas and a Survey Tool to Investigate Related Demand Patterns. Eur. Transp. Res. Rev. 2020, 12, 40. [Google Scholar] [CrossRef]
- Bebber, S.; Libardi, B.; Moschen, S.D.A.; da Silva, M.B.C.; Fachinelli, A.C.; Nogueira, M.L. Sustainable Mobility Scale: A Contribution for Sustainability Assessment Systems in Urban Mobility. Clean. Eng. Technol. 2021, 5, 100271. [Google Scholar] [CrossRef]
- Shee, H.K.; Miah, S.J.; De Vass, T. Impact of Smart Logistics on Smart City Sustainable Performance: An Empirical Investigation. Int. J. Logist. Manag. 2021, 32, 821–845. [Google Scholar] [CrossRef]
- Russo, F.; Comi, A. Sustainable Urban Delivery: The Learning Process of Path Costs Enhanced by Information and Communication Technologies. Sustainability 2021, 13, 13103. [Google Scholar] [CrossRef]
- Russo, F.; Comi, A. Investigating the Effects of City Logistics Measures on the Economy of the City. Sustainability 2020, 12, 1439. [Google Scholar] [CrossRef] [Green Version]
- Amaya, J.; Delgado-Lindeman, M.; Arellana, J.; Allen, J. Urban Freight Logistics: What Do Citizens Perceive? Transp. Res. Part E Logist. Transp. Rev. 2021, 152, 102390. [Google Scholar] [CrossRef]
- Kijewska, K.; França, J.G.; de Oliveira, L.K.; Iwan, S. Evaluation of Urban Mobility Problems and Freight Solutions from Residents’ Perspectives: A Comparison of Belo Horizonte (Brazil) and Szczecin (Poland). Energies 2022, 15, 710. [Google Scholar] [CrossRef]
- Rose, W.J.; Ralston, P.M.; Autry, C.W. Urbanness and Its Implications for Logistics Strategy: A Revised Perspective. Transp. J. 2020, 59, 165–199. [Google Scholar] [CrossRef]
- Montwiłł, A.; Pietrzak, O.; Pietrzak, K. The Role of Integrated Logistics Centers (ILCs) in Modelling the Flows of Goods in Urban Areas Based on the Example of Italy. Sustain. Cities Soc. 2021, 69, 102851. [Google Scholar] [CrossRef]
- Oliveira, L.K.; Oliveira, R.L.M.; Sousa, L.T.M.; Caliari, I.P.; Nascimento, C.O.L. Analysis of Accessibility from Collection and Delivery Points: Towards the Sustainability of the e-Commerce Delivery. Urbe Rev. Bras. Gest. 2019, 11, e20190048. [Google Scholar] [CrossRef] [Green Version]
- Erdogan, S. Analyzing the Environmental Kuznets Curve Hypothesis: The Role of Disaggregated Transport Infrastructure Investments. Sustain. Cities Soc. 2020, 61, 102338. [Google Scholar] [CrossRef]
- Chen, H.-K.; Chou, H.-W.; Hung, S.-C. Interrelationships between Behaviour Intention and Its Influential Factors for Consumers of Motorcycle Express Cargo Delivery Service. Transp. A Transp. Sci. 2019, 15, 526–555. [Google Scholar] [CrossRef]
- Ewbank, H.; Vieira, J.G.V.; Fransoo, J.; Ferreira, M.A. The Impact of Urban Freight Transport and Mobility on Transport Externalities in the SPMR. Transp. Res. Procedia 2020, 46, 101–108. [Google Scholar] [CrossRef]
- Yildirim, Y.; Allen, D.J.; Albright, A. The Relationship between Sound and Amenities of Transit-Oriented Developments. Int. J. Environ. Res. Public Health 2019, 16, 2413. [Google Scholar] [CrossRef] [Green Version]
- Comi, A.; Schiraldi, M.M.; Buttarazzi, B. Smart Urban Freight Transport: Tools for Planning and Optimising Delivery Operations. Simul. Model. Pract. Theory 2018, 88, 48–61. [Google Scholar] [CrossRef]
- Croce, A.I.; Musolino, G.; Rindone, C.; Vitetta, A. Route and Path Choices of Freight Vehicles: A Case Study with Floating Car Data. Sustainability 2020, 12, 8557. [Google Scholar] [CrossRef]
- Seliverstov, S.; Seliverstov, Y.; Gavkalyk, B.; Fahmi, S. Development of Transport Infrastructure Organization Model for Modern Cities with Growing Effectiveness. Transp. Res. Procedia 2020, 50, 614–625. [Google Scholar] [CrossRef]
- Hou, R.; Lei, L.; Jin, K.; Lin, X.; Xiao, L. Introducing Electric Vehicles? Impact of Network Effect on Profits and Social Welfare. Energy 2022, 243, 123002. [Google Scholar] [CrossRef]
- Zhang, X.; Li, Z.; Luo, L.; Fan, Y.; Du, Z. A Review on Thermal Management of Lithium-Ion Batteries for Electric Vehicles. Energy 2022, 238, 121652. [Google Scholar] [CrossRef]
- Musolino, G.; Rindone, C.; Vitetta, A. Passengers and Freight Mobility with Electric Vehicles: A Methodology to Plan Green Transport and Logistic Services near Port Areas. Transp. Res. Procedia 2019, 37, 393–400. [Google Scholar] [CrossRef]
- Pašalić, I.N.; Ćukušić, M.; Jadrić, M. Smart City Research Advances in Southeast Europe. Int. J. Inf. Manag. 2021, 58, 102127. [Google Scholar] [CrossRef]
- Jardas, M.; Hadžić, A.P.; Tijan, E. Defining and Measuring the Relevance of Criteria for the Evaluation of the Inflow of Goods in City Centers. Logistics 2021, 5, 44. [Google Scholar] [CrossRef]
- Davidich, N.; Galkin, A.; Iwan, S.; Kijewska, K.; Chumachenko, I.; Davidich, Y. Monitoring of Urban Freight Flows Distribution Considering the Human Factor. Sustain. Cities Soc. 2021, 75, 103168. [Google Scholar] [CrossRef]
- Kijewska, K.; de Oliveira, L.K.; dos Santos, O.R.; Bertoncini, B.V.; Iwan, S.; Eidhammer, O. Proposing a Tool for Assessing the Level of Maturity for the Engagement of Urban Freight Transport Stakeholders: A Comparison between Brazil, Norway, and Poland. Sustain. Cities Soc. 2021, 72, 103047. [Google Scholar] [CrossRef]
- Serrano-Hernandez, A.; Ballano, A.; Faulin, J. Selecting Freight Transportation Modes in Last-Mile Urban Distribution in Pamplona (Spain): An Option for Drone Delivery in Smart Cities. Energies 2021, 14, 4748. [Google Scholar] [CrossRef]
- Siqueira, A.J.; Almo, P.M.; Cicerelli, R.E.; Machado, R.F.C.; Almeida, T.d. Mapping the Usability and Quality of Bicycle Paths Using a Terrain-Inclination-Based Classification, Study Case: Darcy Ribeiro Campus, University Of Brasília, Brazil. In Proceedings of the 2020 IEEE Latin American GRSS & ISPRS Remote Sensing Conference (LAGIRS), Santiago, Chile, 21–26 March 2020; pp. 78–81. [Google Scholar]
- Mucowska, M. Trends of Environmentally Sustainable Solutions of Urban Last-Mile Deliveries on the E-Commerce Market—A Literature Review. Sustainability 2021, 13, 5894. [Google Scholar] [CrossRef]
- Oliveira, C.M.; Albergaria De Mello Bandeira, R.; Vasconcelos Goes, G.; Schmitz Gonçalves, D.N.; D’Agosto, M.D. Sustainable Vehicles-Based Alternatives in Last Mile Distribution of Urban Freight Transport: A Systematic Literature Review. Sustainability 2017, 9, 1324. [Google Scholar] [CrossRef] [Green Version]
- Akyol, D.E.; Koster, R.B.M. Determining Time Windows in Urban Freight Transport: A City Cooperative Approach. Transp. Res. Part E Logist. Transp. Rev. 2018, 118, 34–50. [Google Scholar] [CrossRef]
- Alam, P.; Ahmad, K.; Afsar, S.; Akhter, N. Noise Monitoring, Mapping, and Modelling Studies—A Review. J. Ecol. Eng. 2020, 21, 82–93. [Google Scholar] [CrossRef]
- Amaya, J.; Arellana, J.; Delgado-Lindeman, M. Stakeholders Perceptions to Sustainable Urban Freight Policies in Emerging Markets. Transp. Res. Part A Policy Pract. 2020, 132, 329–348. [Google Scholar] [CrossRef]
- Dong, X.; Wu, Y.; Chen, X.; Li, H.; Cao, B.; Zhang, X.; Yan, X.; Li, Z.; Long, Y.; Li, X. Effect of Thermal, Acoustic, and Lighting Environment in Underground Space on Human Comfort and Work Efficiency: A Review. Sci. Total Environ. 2021, 786, 147537. [Google Scholar] [CrossRef]
- He, Z.; Haasis, H.-D. A Theoretical Research Framework of Future Sustainable Urban Freight Transport for Smart Cities. Sustainability 2020, 12, 1975. [Google Scholar] [CrossRef] [Green Version]
- Holguín-Veras, J.; Wang, C.; Browne, M.; Hodge, S.D.; Wojtowicz, J. The New York City Off-Hour Delivery Project: Lessons for City Logistics. Procedia-Soc. Behav. Sci. 2014, 125, 36–48. [Google Scholar] [CrossRef] [Green Version]
- Ranieri, L.; Digiesi, S.; Silvestri, B.; Roccotelli, M. A Review of Last Mile Logistics Innovations in an Externalities Cost Reduction Vision. Sustainability 2018, 10, 782. [Google Scholar] [CrossRef] [Green Version]
- Hair, F.J.; Hult, G.T.M.; Ringle, C.M.; Sarstedt, M. A Primer on Partial Least Squares Structural Equation Modeling (PLS-SEM); Sage Publications, Inc.: Thousand Oaks, CA, USA, 2017. [Google Scholar]
- Thakkar, J.J. Procedural Steps in Structural Equation Modelling. In Structural Equation Modelling: Application for Research and Practice (with AMOS and R); Thakkar, J.J., Ed.; Springer: Singapore, 2020; pp. 29–34. ISBN 978-981-15-3793-6. [Google Scholar]
- Hair, F.J.; Sarstedt, M.; Hopkins, L.; Kuppelwieser, V.G. Partial Least Squares Structural Equation Modeling (PLS-SEM). Eur. Bus. Rev. 2014, 26, 106–121. [Google Scholar] [CrossRef]
- Hair, J.F.; Black, W.C.; Babin, B.J.; Anderson, R.E.; Tatham, R.L. Multivariate Data Analysis; Cengage: Hampshire, UK, 2019. [Google Scholar]
- Henseler, J.; Ringle, C.M.; Sarstedt, M. Testing Measurement Invariance of Composites Using Partial Least Squares. Int. Mark. Rev. 2016, 33, 405–431. [Google Scholar] [CrossRef]
- Henseler, J. Bridging Design and Behavioral Research With Variance-Based Structural Equation Modeling. J. Advert. 2017, 46, 178–192. [Google Scholar] [CrossRef]
- Ringle, C.M.; Sarstedt, M. Gain More Insight from Your PLS-SEM Results. Ind. Manag. Data Syst. 2016, 116, 1865–1886. [Google Scholar] [CrossRef]
- Ramírez, P.E.; Mariano, A.M.; Salazar, E.A. Propuesta Metodológica Para Aplicar Modelos de Ecuaciones Estructurales Con PLS: El Caso Del Uso de Las Bases de Datos Científicas En Estudiantes Universitarios. Rev. ADMPG 2014, 7, 133–139. [Google Scholar]
- Becker, J.-M.; Klein, K.; Wetzels, M. Hierarchical Latent Variable Models in PLS-SEM: Guidelines for Using Reflective-Formative Type Models. Long Range Plan. 2012, 45, 359–394. [Google Scholar] [CrossRef]
- Cenfetelli, R.T.; Bassellier, G. Interpretation of Formative Measurement in Information Systems Research. MIS Q. 2009, 33, 689–707. [Google Scholar] [CrossRef]
- Cenfetelli, R.T.; Bassellier, G.; Posey, C. The Analysis of Formative Measurement in IS Research: Choosing between Component-and Covariance-Based Techniques. SIGMIS Database 2013, 44, 66–79. [Google Scholar] [CrossRef]
- Hair, J.F.; Ringle, C.M.; Gudergan, S.P.; Fischer, A.; Nitzl, C.; Menictas, C. Partial Least Squares Structural Equation Modeling-Based Discrete Choice Modeling: An Illustration in Modeling Retailer Choice. Bus. Res. 2019, 12, 115–142. [Google Scholar] [CrossRef] [Green Version]
- Falk, R.F.; Miller, N.B. A Primer for Soft Modeling; University of Akron Press: Akron, OH, USA, 1992. [Google Scholar]
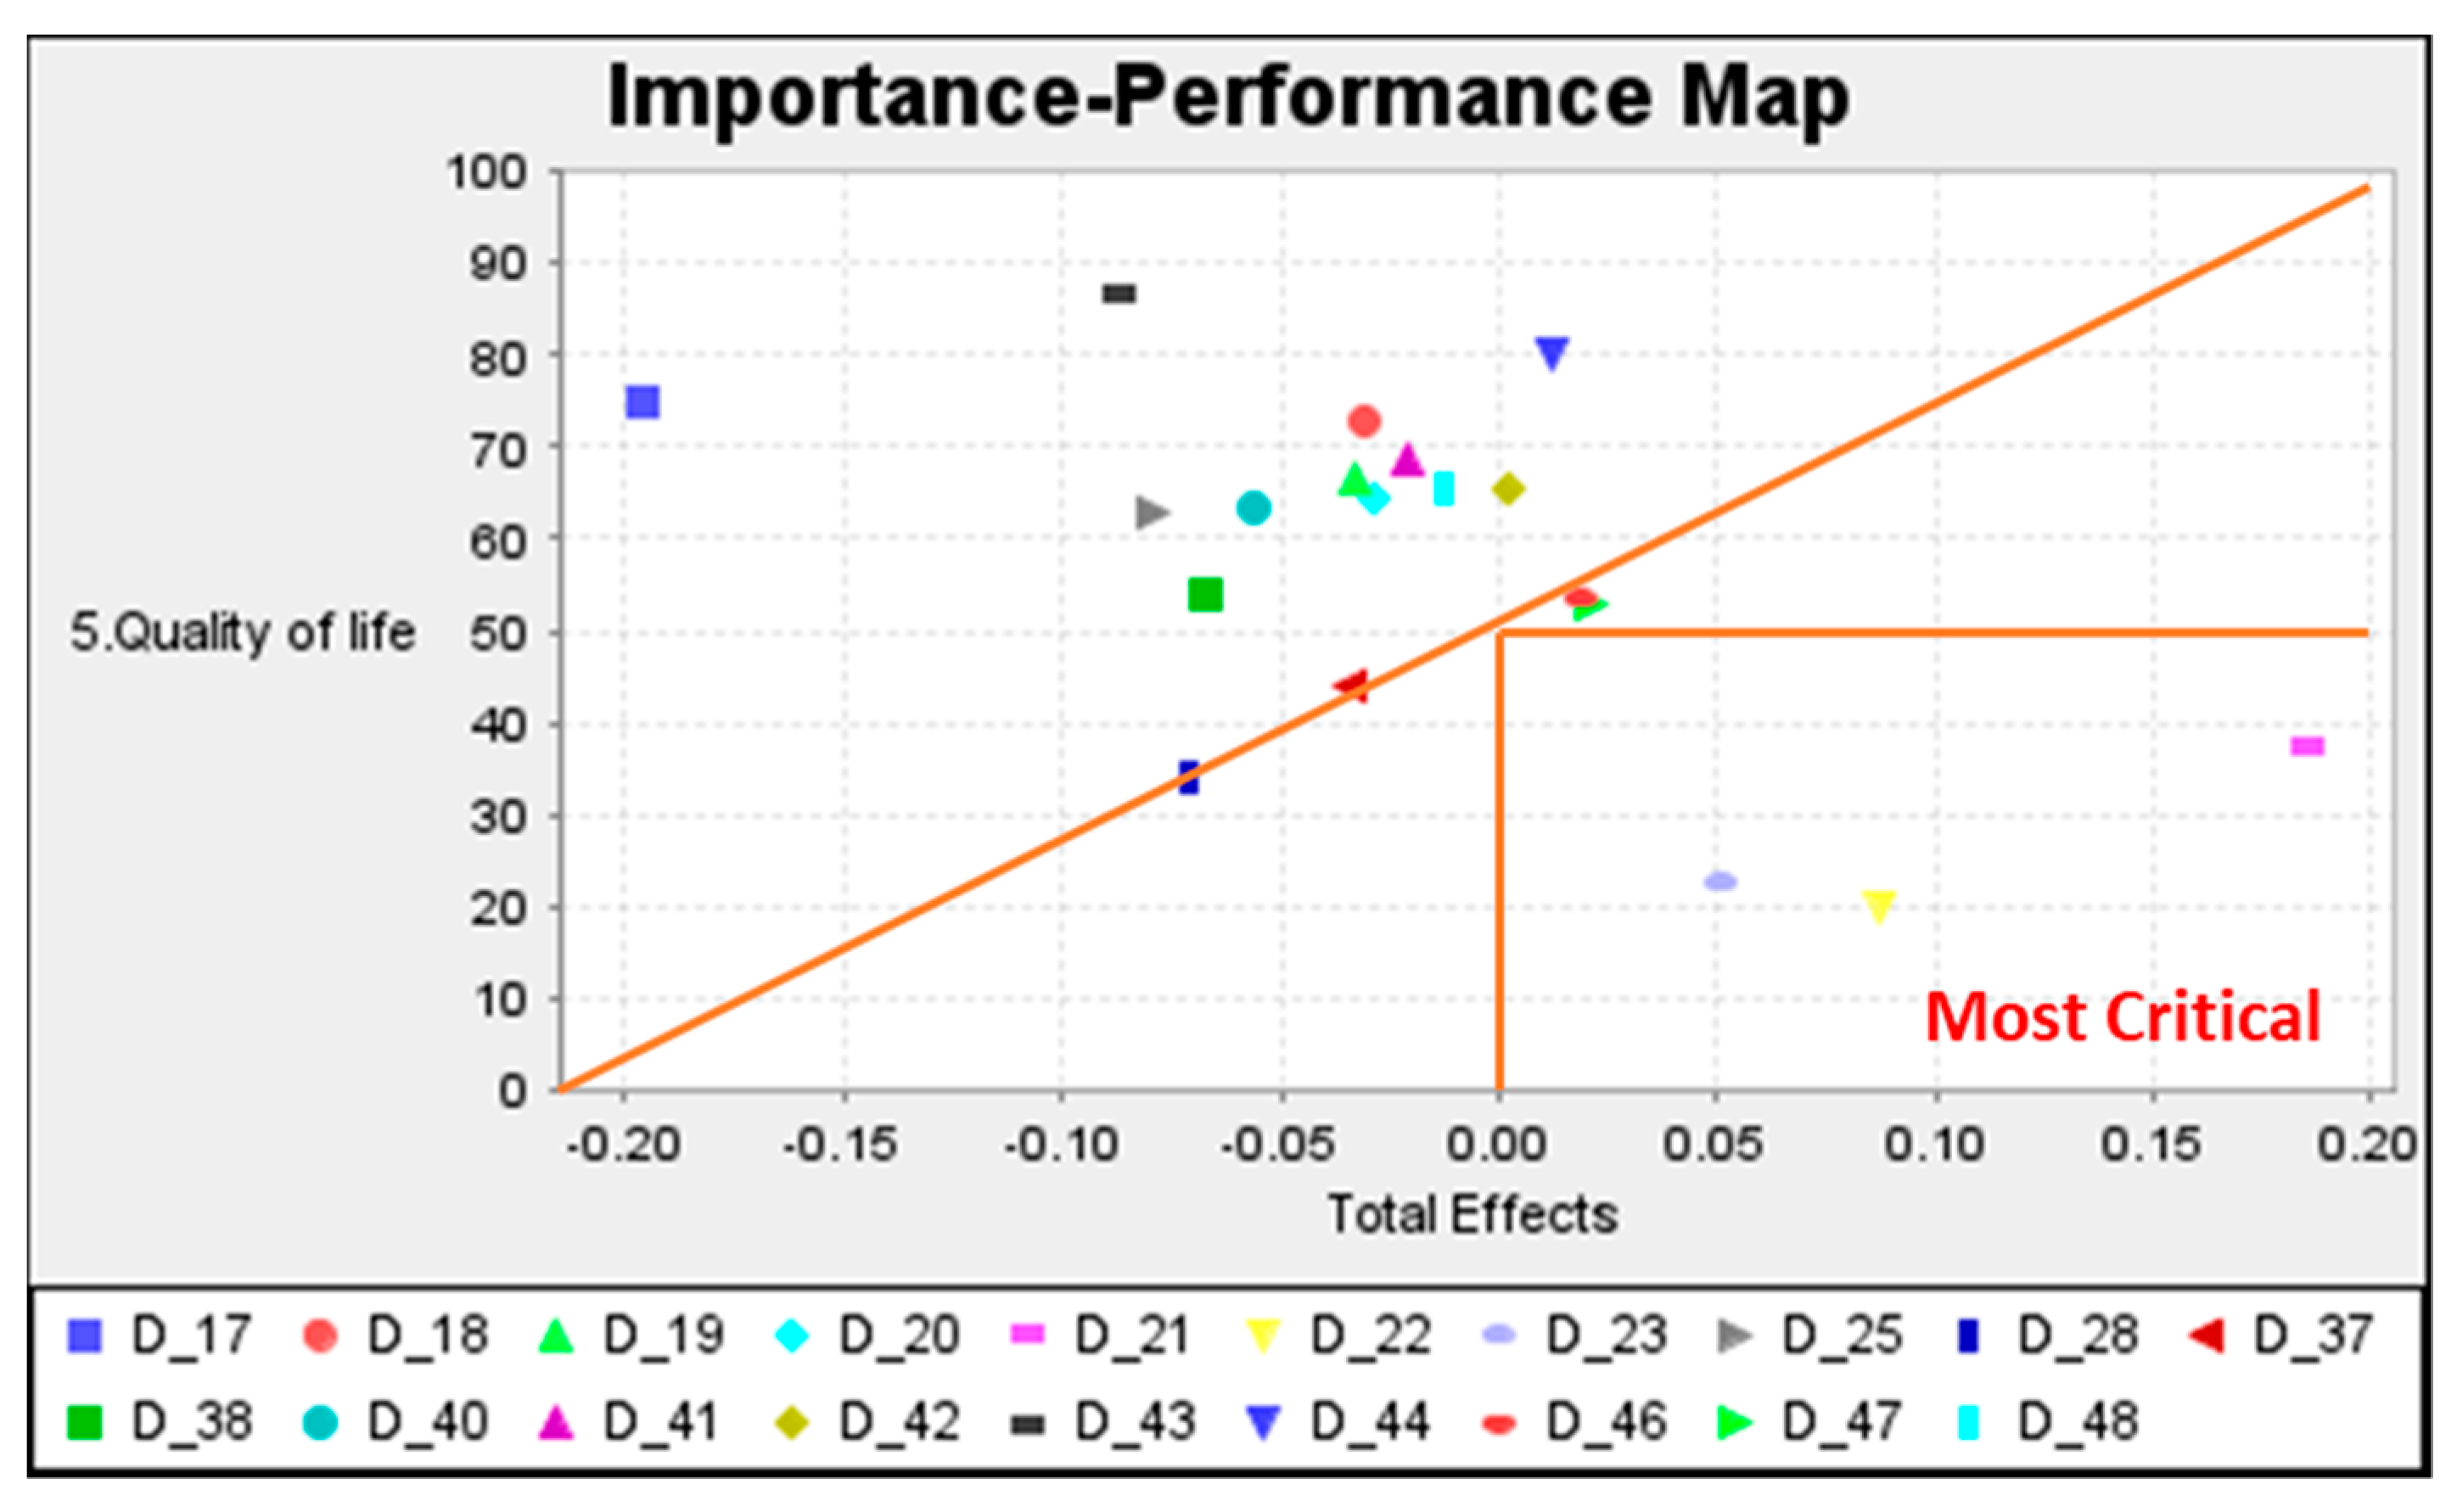
- Ramayah, T.; Chiun, L.M.; Rouibah, K.; May, O.S. Identifying Priority Using an Importance-Performance Matrix Analysis (IPMA): The Case of Internet Banking in Malaysia. Int. J. E-Adopt. IJEA 2014, 6, 1–15. [Google Scholar] [CrossRef]
- Ahmad, S.; Afthanorhan, W.M.A.B.W. The Importance-Performance Matrix Analysis in Partial Least Square Structural Equation Modeling (PLS-SEM) with Smartpls 2.0 M3. Int. J. Math. Res. 2014, 3, 1–14. [Google Scholar] [CrossRef]
- Shafaei, A.; Razak, N.A. Importance-Performance Matrix Analysis of the Factors Influencing International Students’ Psychological and Sociocultural Adaptations Using SmartPLS. In Proceedings of the 2nd International Symposium on Partial Least Squares Path Modeling—The Conference for PLS Users, Seville, Spain, 16–19 June 2015. [Google Scholar]
- Silva, A.L.; Silva, M.G.J.P.V.; Pantoja, J.C. Levantamento Patológico Das Calçadas Que Interligas as Superquadras 300 Sul. Rev. Arquitetura Cid. Habitaç. 2021, 1, 152–170. [Google Scholar] [CrossRef]
- Souza, A.C.S.; Bittencourt, L.; Taco, P.W.G. Women’s Perspective in Pedestrian Mobility Planning: The Case of Brasília. Transp. Res. Procedia 2018, 33, 131–138. [Google Scholar] [CrossRef]
- Kallas, L.M.E.; da Silva, E.A.S.; Guillen-Salas, J.C. O Patrimônio Edificado e Urbanístico Do Plano Piloto de Brasília [DF]: Documentação, Valorização e Resgate Por Meio Dos ‘Sketches’. Labor Eng. 2020, 14, e020014. [Google Scholar]
- Derntl, M.F. O Plano Piloto e Os Planos Regionais Para Brasília Entre Fins Da Década de 1940 e Início Dos Anos 60. Rev. Bras. Estud. Urbanos Reg. 2019, 21, 26–44. [Google Scholar] [CrossRef]


| Variables | Reference | |||||||||||||||||||||||||||||
|---|---|---|---|---|---|---|---|---|---|---|---|---|---|---|---|---|---|---|---|---|---|---|---|---|---|---|---|---|---|---|
| [1] | [2] | [3] | [4] | [5] | [6] | [7] | [8] | [9] | [10] | [11] | [13] | [14] | [18] | [21] | [24] | [25] | [34] | [35] | [39] | [40] | [36] | [41] | [42] | [43] | [44] | [45] | [46] | [47] | ||
| Quality of Life | Lack of essential UFT services | X | X | X | X | X | X | X | X | X | X | X | X | X | X | X | X | X | ||||||||||||
| UFT reduces quality of life | X | X | X | X | X | X | X | X | X | X | X | X | X | X | X | X | X | |||||||||||||
| UFT provides essential goods for daily activities | X | X | X | X | X | X | X | X | X | X | X | X | X | X | X | X | X | |||||||||||||
| UFT Externalities | Pollution | X | X | X | X | X | X | X | X | X | X | X | X | X | X | X | X | X | X | X | X | X | ||||||||
| Noise | X | X | X | X | X | X | X | X | X | X | X | X | X | X | X | X | X | X | X | X | X | X | ||||||||
| Congestion | X | X | X | X | X | X | X | X | X | X | X | X | X | X | X | X | X | X | X | X | X | X | X | X | X | |||||
| Safety | X | X | X | X | X | X | X | X | X | X | X | X | X | X | X | X | X | X | ||||||||||||
| Unloading delivery time | X | X | X | X | X | X | X | X | X | X | X | X | X | X | X | |||||||||||||||
| Waste collection | X | X | X | X | X | X | X | X | X | X | ||||||||||||||||||||
| Urban Infrastructure | Road capacity | X | X | X | X | X | ||||||||||||||||||||||||
| Unloading areas | X | X | X | X | X | X | X | |||||||||||||||||||||||
| Supervision of unloading areas | X | X | X | X | X | X | ||||||||||||||||||||||||
| Private Management | Home delivery as a UFT solution | X | X | X | X | X | X | X | ||||||||||||||||||||||
| Pick-up points as a UFT solution | X | X | X | X | X | |||||||||||||||||||||||||
| On-demand delivery services | X | X | X | X | ||||||||||||||||||||||||||
| Last-mile delivery by motorcycles | X | X | X | X | X | X | X | X | X | X | X | |||||||||||||||||||
| Last-mile delivery by bicycles | X | X | X | X | X | X | X | X | X | X | X | |||||||||||||||||||
| Public Management | Circulation of new freight vehicles | X | X | X | X | X | X | X | X | X | X | |||||||||||||||||||
| Stimulating the renewal of the freight fleet | X | X | X | X | X | X | ||||||||||||||||||||||||
| Electrical vehicles | X | X | X | X | X | X | X | X | X | X | X | X | X | |||||||||||||||||
| Urban mobility plans | X | X | X | X | X | X | ||||||||||||||||||||||||
| Freight policies to support UFT | X | X | X | X | X | |||||||||||||||||||||||||
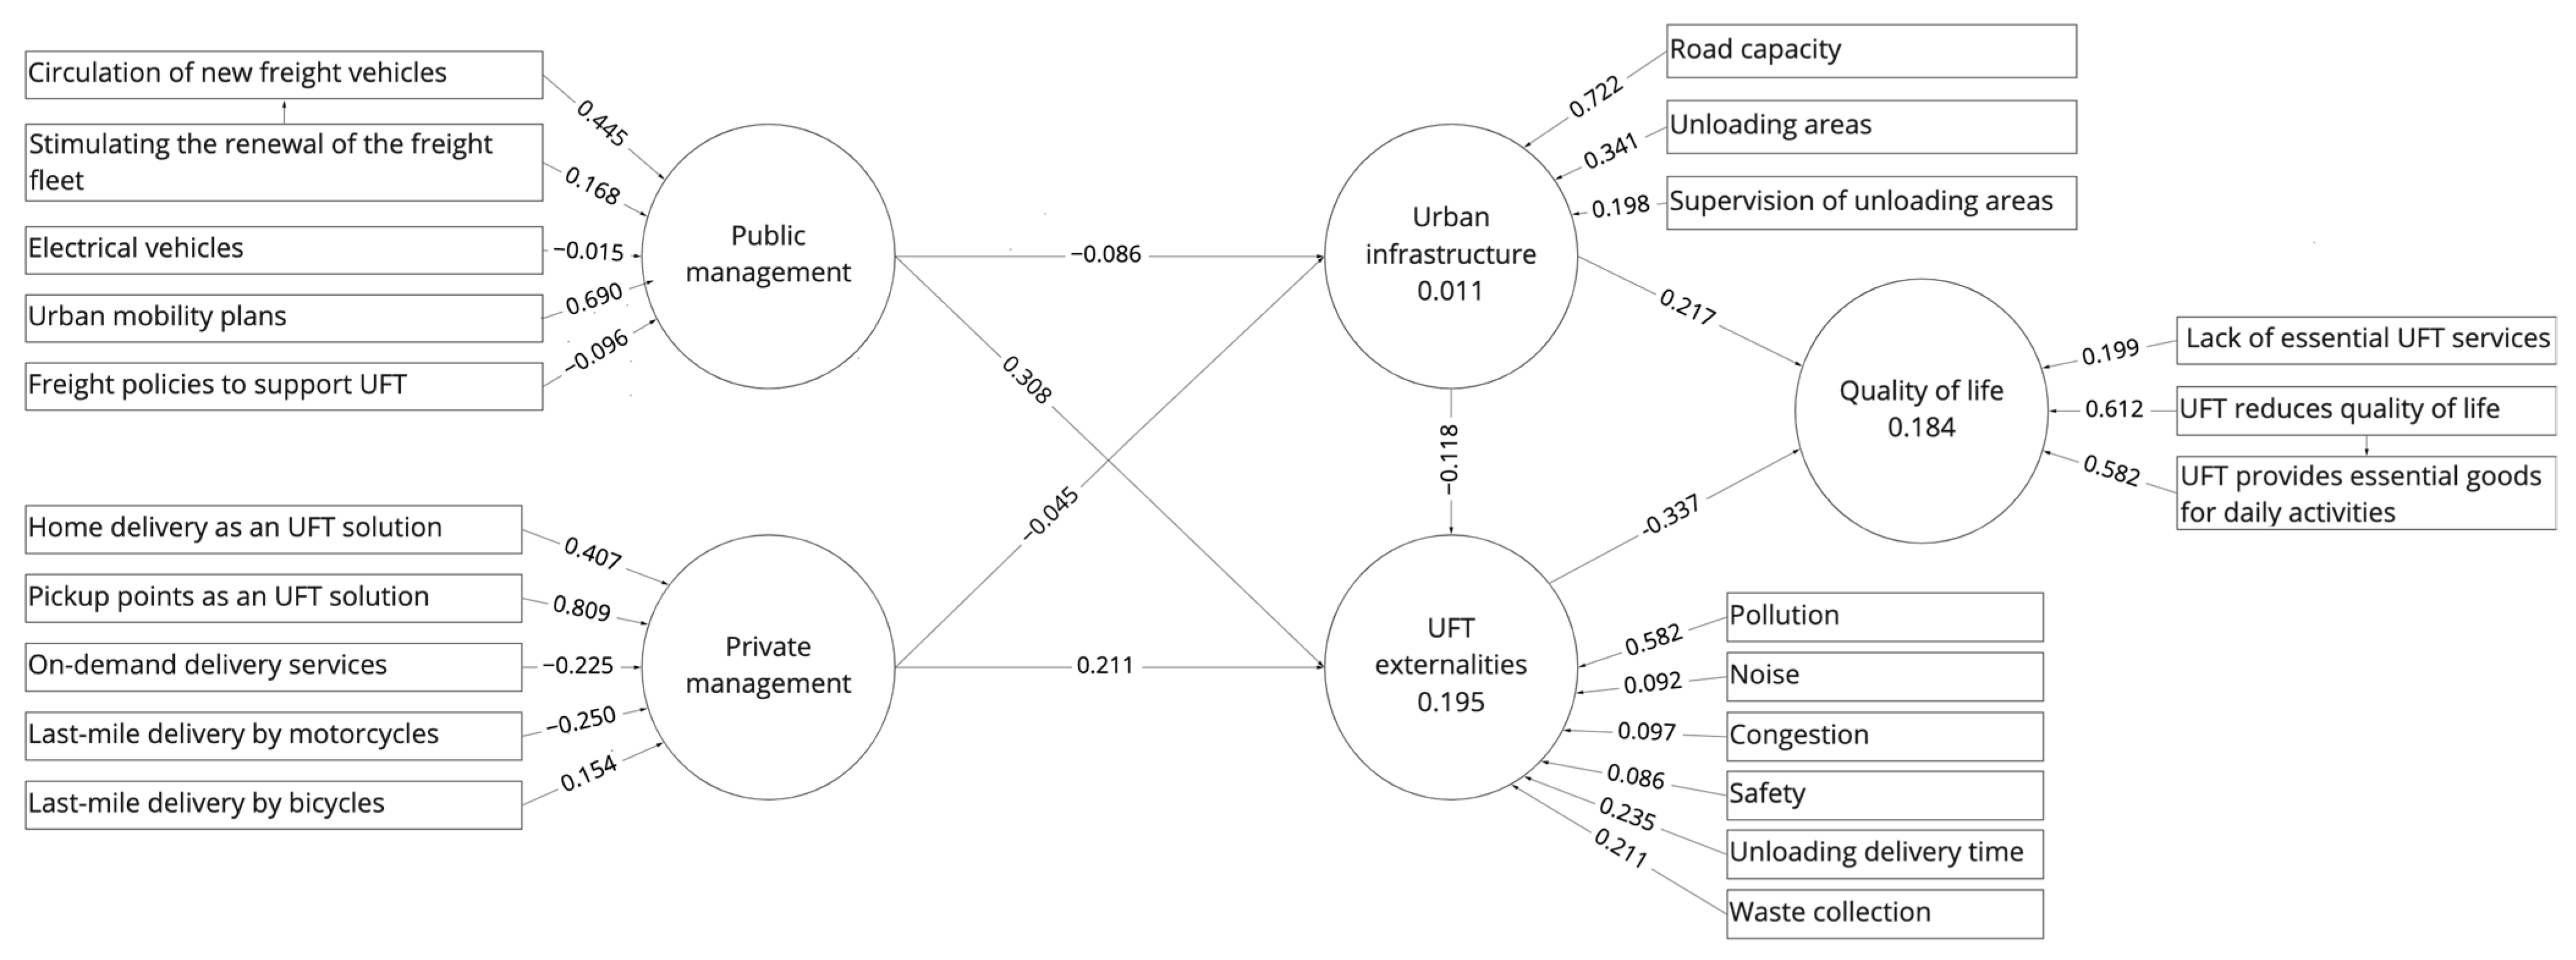
| Formative Measurement | Path | t-Value | p-Value |
|---|---|---|---|
| Lack of essential UFT services → Quality of life | 0.199 | 0.896 | 0.371 |
| UFT reduces quality of life → Quality of life | 0.612 | 4.828 | 0.000 |
| UFT provides essential goods for daily activities → Quality of life | 0.582 | 3.836 | 0.000 |
| Pollution → Externalities | 0.582 | 3.252 | 0.001 |
| Noise → Externalities | 0.092 | 0.517 | 0.605 |
| Congestion → Externalities | 0.097 | 0.561 | 0.575 |
| Safety → Externalities | 0.086 | 0.535 | 0.592 |
| Unloading delivery time → Externalities | 0.235 | 2.156 | 0.031 |
| Waste collection → Externalities | 0.211 | 1.371 | 0.170 |
| Road capacity → Infrastructure | 0.722 | 2.242 | 0.025 |
| Unloading areas → Infrastructure | 0.341 | 1.270 | 0.204 |
| Supervision of unloading areas → Infrastructure | 0.198 | 0.599 | 0.549 |
| Home delivery as a UFT solution → Private Management | 0.407 | 1.415 | 0.157 |
| Pick-up points as a UFT solution → Private Management | 0.809 | 1.722 | 0.085 |
| On-demand delivery services → Private Management | −0.225 | 0.676 | 0.499 |
| Last-mile delivery by motorcycles → Private Management | −0.250 | 0.636 | 0.525 |
| Last-mile delivery by bicycles → Private Management | 0.154 | 0.646 | 0.519 |
| Allow circulation of new freight vehicles → Public Management | 0.445 | 2.238 | 0.025 |
| Stimulate the renewal of the freight fleet → Public Management | 0.168 | 0.746 | 0.456 |
| Electrical vehicles → Public Management | −0.015 | 0.074 | 0.941 |
| Urban mobility plans → Public Management | 0.690 | 3.310 | 0.001 |
| Freight policies to support UFT → Public Management | −0.096 | 0.432 | 0.666 |
| Formative Measurement from Latent Variables | VIF |
|---|---|
| Externalities → Quality of life | 1.027 |
| Public Management → Externalities | 1.069 |
| Public Management → Urban infrastructure | 1.062 |
| Private Management → Externalities | 1.064 |
| Private Management → Urban infrastructure | 1.062 |
| Urban infrastructure → Externalities | 1.011 |
| Urban infrastructure → Quality of life | 1.027 |
| Hypotheses | Beta | Percentage | t-Value | p-Value | Supported? |
|---|---|---|---|---|---|
| H1: UFT-Externalities → Quality of life | −0.337 | 12.54% | 5.059 | 0.000 | Yes |
| H2a: Urban infrastructure → UFT-Externalities | −0.118 | 1.91% | 1.853 | 0.064 | No |
| H2b: Urban infrastructure → Quality of life | 0.217 | 5.90% | 2.599 | 0.009 | Yes |
| H3a: Public Management → Urban infrastructure | −0.086 | 0.83% | 1.237 | 0.216 | No |
| H3b: Public Management → UFT-Externalities | 0.308 | 11.40% | 5.195 | 0.000 | Yes |
| H4a: Private Management → UFT-Externalities | 0.211 | 6.18% | 1.498 | 0.134 | No |
| H4b Private Management → Urban infrastructure | −0.045 | 0.30% | 0.313 | 0.754 | No |
Publisher’s Note: MDPI stays neutral with regard to jurisdictional claims in published maps and institutional affiliations. |
© 2022 by the authors. Licensee MDPI, Basel, Switzerland. This article is an open access article distributed under the terms and conditions of the Creative Commons Attribution (CC BY) license (https://creativecommons.org/licenses/by/4.0/).
Share and Cite
Leite, C.E.; Granemann, S.R.; Mariano, A.M.; de Oliveira, L.K. Opinion of Residents about the Freight Transport and Its Influence on the Quality of Life: An Analysis for Brasília (Brazil). Sustainability 2022, 14, 5255. https://0-doi-org.brum.beds.ac.uk/10.3390/su14095255
Leite CE, Granemann SR, Mariano AM, de Oliveira LK. Opinion of Residents about the Freight Transport and Its Influence on the Quality of Life: An Analysis for Brasília (Brazil). Sustainability. 2022; 14(9):5255. https://0-doi-org.brum.beds.ac.uk/10.3390/su14095255
Chicago/Turabian StyleLeite, Cesar Eduardo, Sérgio Ronaldo Granemann, Ari Melo Mariano, and Leise Kelli de Oliveira. 2022. "Opinion of Residents about the Freight Transport and Its Influence on the Quality of Life: An Analysis for Brasília (Brazil)" Sustainability 14, no. 9: 5255. https://0-doi-org.brum.beds.ac.uk/10.3390/su14095255