
Experimental Study on the Mechanical Characteristics of Saturated Granite under Conventional Triaxial Loading and Unloading Tests


School of Civil Engineering, Central South University, Changsha 410075, China
*
Author to whom correspondence should be addressed.
Sustainability 2022, 14(9), 5445; https://0-doi-org.brum.beds.ac.uk/10.3390/su14095445
Submission received: 2 March 2022
/
Revised: 28 April 2022
/
Accepted: 29 April 2022
/
Published: 30 April 2022
(This article belongs to the Topic Mining Safety and Sustainability)
Abstract
:It is essential to study the mechanical properties of saturated rock under different loading and unloading paths for strength calculation, safety assessment and disaster prevention; however, current literature rarely mentions conventional triaxial loading and unloading conditions. To analyze the mechanical properties, strain energy evolution characteristics and failure mode, a series of conventional triaxial unloading tests (with axial loading rate va of 0.06–6 mm/min and circumferential unloading rate vu of 0.1–10 MPa/s) and conventional triaxial compression tests were carried out on saturated granite. The test results showed that the damage sources of specimens in the conventional triaxial unloading test were mainly related to circumferential deformation, while in the conventional triaxial compression test, it was related to the axial deformation. Under the same va, the confining pressure and axial stress at the failure point decreased with the increase of vu, and the stress coordinate of the failure point was located outside the conventional triaxial compression envelope of σ1–σ3. As vu increases, except for the variation of circumferential strain energy ΔUc decreasing slowly, the trend of strain energy changes must be determined together with va. As va increases, the relationship between the magnitude of each energy changes from ΔUa > ΔU > ΔUd > ΔUe > ΔUc to ΔUd > ΔUa > ΔU > ΔUe > ΔUc, while the change of dissipated energy is dominated by vu and va together to become dominated by va. In addition, with the increase of vu and va, the damage pattern of the specimen also changes from shear damage in a single shear plane to mixed damage with tensile strain failure and shear plane during which the dilation angle of the specimen increases in total except for vu = 10 MPa/s, va = 0.6 mm/min and 6 mm/min.
1. Introduction
With the expansion of granite mining to deeper mines and the construction of large hydropower stations with high slopes, the stability of granite excavation under high stress has become an essential issue in engineering [1,2,3,4]. The final failure state of granite depends not only on the stress state of the rock, but also on the stress path and loading rate as well as geothermal, groundwater and other environmental factors [5,6,7,8]. There are apparent differences in the mechanical properties of granite under the loading and unloading paths, which is one of the crucial reasons for the lack of uniformity in the laws obtained from the current unloading test studies [9,10]. Since the underground deposits are excavated and unloaded, studying the rock damage under the unloading path may seem more meaningful than relying on the loading test [11].
The excavation of underground rocks is divided into blasting or mechanical crushing [12,13,14]. Accordingly, the rocks are damaged under different unloading rates. Many scholars have studied the mechanical properties, failure modes, and energy dissipation characteristics of rocks under different unloading rates, and the specific objects and stress paths are shown in Table 1. This paper mainly discusses the conventional triaxial rather than the true triaxial [15]. In [16], the author first proposed the virtual uniaxial compressive strength considering the unloading problem. He found that the Hoek–Brown material parameters of the rock specimens before the peak load after unloading changed more than the loading test. The virtual uniaxial compressive strength increased, and the Hoek–Brown material constant m decreased. Before the peak load, a larger unloading rate responds to a smaller axial strain and cohesion c and a larger lateral strain and a slight increase in the angle of internal friction φ. In contrast, the deformation modulus increases gradually after the peak load and decreases rapidly with the increasing unloading rate [13,14]. The stress adjustment hysteresis mainly affected the unloading rate, and additional unloading stress affects the rock strength, c and φ values. Higher unloading rates may lead to more dramatic damage. The Hoek–Brown criterion can predict the damage-confining pressure when the rock is unloaded laterally at lower unloading rates but may overestimate the stress value at higher unloading rates [17]. In addition, some authors [18,19,20,21] have also further analyzed the damage evolution law of rocks under unloading conditions after high temperatures. Furthermore, it is worth mentioning that some researchers [22,23,24,25] have employed theoretical or numerical methods to evaluate the characteristics of deeply buried rock masses.
During the triaxial unloading test, the rock’s two failure modes are the tensile–shear failure and the shear failure, and the volume strain changes from compression to expansion [9]. In addition, the higher the initial confining pressure, the more severe the failure of the specimen at the same unloading stress path, and the degree of rupture of the specimen becomes more complicated as the unloading rate increases [26]. The failure evolution characteristics vary for different types of rock [27,28,29]. For example, shale [27] exhibits obvious elastic–plastic characteristics under conventional triaxial compression tests, while it shows apparent elastic–brittle features under triaxial unloading tests, and the brittle failure characteristics increase with the increase of unloading rate and initial confining pressure. Columnar jointed rock masses [30] exhibit strong volume expansion during unloading, which becomes more severe and the damage pattern becomes more complex with an increasing unloading rate, while unloading relaxation can be observed by decreasing the unloading rate. The later the inflection point of negative volume strain growth occurs when the unloading level is closer to the peak load, the damage caused by tensile cracking in the specimen is more severe than the damage caused by compression shear during unloading. In general, the corresponding expansion rate decreases with increasing confining compression at the same axial stress and increases with increasing axial stress at the same confining compression [10]. The expansion boundary of the unloading test starts from the unloading point, which is different from the expansion rate of the uniaxial and triaxial compression tests. Rapid unloading promotes the growth of cracks, and larger inelastic strains appear at lower unloading rates [31,32], which will increase the permeability of the rock [33,34,35,36]. In addition, the response of the ratio of height to diameter [37] and the acoustic emission behaviour [38] are also investigated, and the damage process can be observed by CT technique [39] and nuclear magnetic resonance technique [40,41].
From the view of energy conversion, the energy changes from the three principal stress directions in the test acted together to damage the rock. Wang [42] conducted triaxial unloading tests and post-test CT scan analysis on fine-grained marble and found that the specimens’ total energy, elastic energy and dissipated energy almost all increased with the increase of deformation, and the elastic energy and dissipated energy decreased slightly before increasing again. After the unloading point, the dissipated energy increased sharply, and the elastic energy increment rate lowered; the crack pattern and energy dissipation and release in CT images depend on the unloading rate and time. The strain energy absorbed in the axial direction of the rock is mainly transformed into circumferential dilation to consume strain energy [43]. The degree of dilation is: reduce axial stress and confining pressure > maintain axial stress and reduce confining pressure > increase axial stress and reduce confining pressure. In contrast, it is transformed into less dissipated energy, and the dissipated energy increases significantly only near the time of destruction. The dissipation energy is significantly influenced by the unloading path and the initial confining pressure. The initial confining pressure has a considerably more significant influence on the axial strain energy, the circumferential expansion strain energy and the elastic strain energy than the unloading path; all of them increase approximately linearly with the increase of the initial confining pressure. This also indicates that the dissipated strain energy determines the damage during the unloading test. In contrast, the damage during the triaxial compression test is mainly determined by the released elastic strain energy [44,45,46]. In addition, the magnitude of the initial confining pressure and the unloading rate have significant effects on the strain energy conversion, rock burst and limited storage energy [11], while at the same initial confining pressure and unloading rate, the variation of the axial stress has little effect on the ultimate storage energy of the rock. The higher the unloading rate, the smaller the ultimate storage energy.
As one of the most common rocks in underground rock engineering, granite is usually saturated in deep water-bearing environments. However, the existing literature mainly focuses on studying specimens in their natural state. This study conducted conventional triaxial tests with different loading and unloading paths on the saturated granite. The unloading rate varies between 0.1–10 MPa/s to study the mechanical properties and the evolution of strain energy of the surrounding rock under blasting excavation and static excavation in underground tunnels. It is of great significance for understanding the mechanism of unloading rockburst occurrence in high-stress rock masses and even the permeability characteristics of the engineering surrounding rock masses.

Table 1.
Summary of the conventional triaxial unloading tests.
| Rock Type | Stress Path | σ3 (MPa) | Unloading Rate vu (MPa/s) | Reference |
|---|---|---|---|---|
| Sandstone | 1. Increase σ1, unload σ3 | 4–19 | 0.02–0.14 | [47] |
| 4–10 | 0.05 | [48] | ||
| 5–30 | 0.005 | [49] | ||
| 15–30 | 0.05, 0.1, 0.2 | [50] | ||
| 15–45 | 2 | [51] | ||
| 2. Keep σ1, unload σ3 | 15–30 | 0.0003–0.1667 | [52] | |
| 1. Increase σ1, unload σ3 2. Keep σ1, unload σ3 | 10–30 | 0.1, 0.5 | [53] | |
| 3. Unload σ1, σ3 | 10–30 | 0.0008 | [33] | |
| Marble | 1. Increase σ1, unload σ3 | 40 | 0.05 | [37] |
| 2. Keep σ1, unload σ3 | 20 | 0.01–0.2 | [40,42] | |
| 10–60 | 0.01–1 | [54] | ||
| 3. Unload σ1, σ3 | 20–60 | 0.05 | [55] | |
| 20–40 | 0.1–10 | [11] | ||
| 1. Increase σ1, unload σ3 3. Unload σ1, σ3 | 20–40 | 0.26-1.28 | [26] | |
| Granite | 1. Increase σ1, unload σ3 | 5–30 | 0.0017–0.0333 | [56] |
| 30–60 | 0.05 | [57] | ||
| 2. Keep σ1, unload σ3 | 10 | 0.005–0.0115 | [19] | |
| 10–30 | 0.1 | [17,58] | ||
| 1. Increase σ1, unload σ3 3. Unload σ1, σ3 | 10–60 | 0.2 | [45] | |
| 1. Increase σ1, unload σ3 2. Keep σ1, unload σ3 3. Unload σ1, σ3 | 10–30 | - | [43] | |
| Mudstone | 1. Increase σ1, unload σ3 | 6-15 | 0.05, 0.1, 0.2 | [50] |
| 10–50 | 0.005–0.5 | [59] | ||
| Limestones | 2. Keep σ1, unload σ3 | 15 | 0.0217 | [39] |
| Shale | 1. Increase σ1, unload σ3 | 20–60 | 0.4–1.0 | [27] |
| 2. Keep σ1, unload σ3 | 20–60 | 0.4 | [27] | |
| Basalt | 1. Increase σ1, unload σ3 | 3–12 | 0.008 | [60] |
| 3. Unload σ1, σ3 | 3–12 | 0.008 | [60] | |
| Coal | 1. Increase σ1, unload σ3 | 30 | 0.001–0.005 | [34] |
| 4–8 | 0.012–0.024 | [35] | ||
| 4–10 | 0.02–0.14 | [47] | ||
| Dacite | 2. Keep σ1, unload σ3 | 5–15 | 0.0083 | [44] |
| Rock salt | 2. Keep σ1, unload σ3 | 15–25 | 0.005 | [10] |
| 23 | 0.001–0.5 | [31] | ||
| Mudstone | 2. Keep σ1, unload σ3 | 8–20 | 0.05 | [61] |
| 3. Unload σ1, σ3 | 8–20 | 0.05 | [61] | |
| Rock-Like | 2. Keep σ1, unload σ3 | 4–8 | 0.0083–0.0333 | [30] |
2. Materials and Methods
2.1. Specimen Preparation
As shown in Figure 1, all the granite specimens were taken from a quarry in Mianning district, Sichuan Province, China, about 400 km from the capital of Sichuan Province. The dimensions of the specimens were φ50 mm × h100 mm, and all specimens were drilled and cut in the same direction from a single rock mass to ensure minimum variability between different specimens. In addition, the specimens were carefully smoothed to meet the requirements of the International Society of Rock Mechanics (ISRM) [62], and the specimens were soaked in tap water for 48 h to reach a saturated state. Meanwhile, all operations were performed at room temperature. The XRD test result indicated that mineral compositions of the specimens in nature are quartz (49%), potassium feldspar (35%), black mica (8%), white mica (5%), apatite (2%) and others (1%). The SEM test demonstrated the specimens had a dense microstructure. The physical parameters were particle size ranging from 0.05–4 mm, average dry density of 2630 kg/m3, the average saturated density of 2635 kg/m3 and average p-wave velocity of 4027 m/s. The basic mechanical parameters were: uniaxial compressive strength was 104.93 MPa, Brazilian tensile strength was 4.53 MPa, cohesion was 21.83 MPa, and internal friction angle was 49.82°.
2.2. Test Scheme
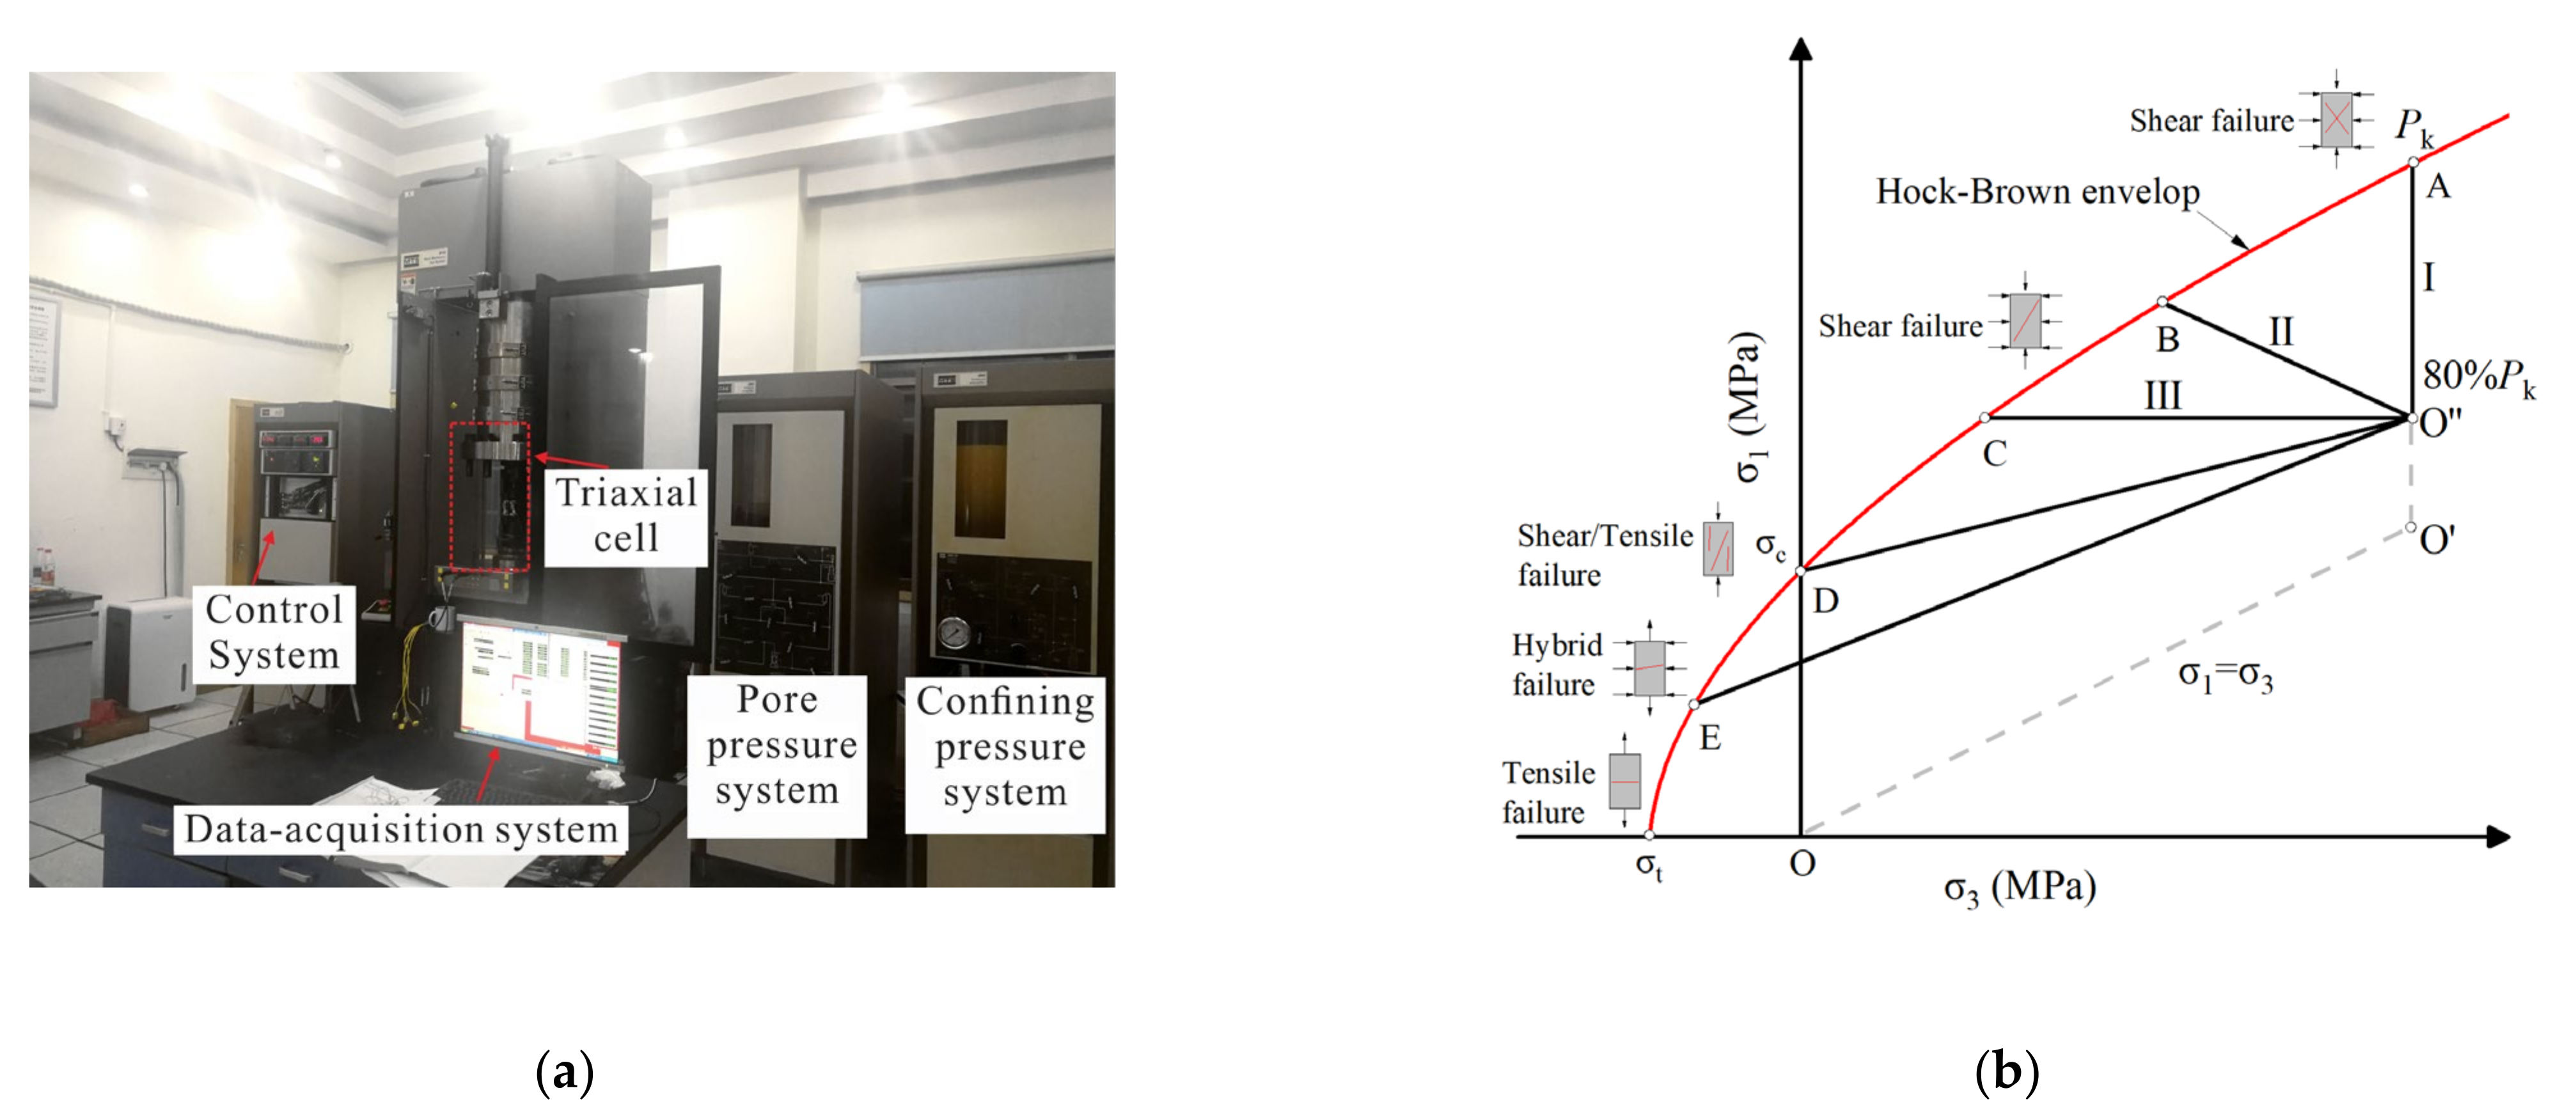
As shown in Figure 2, the test was performed by the MTS815 testing machine, and the test path was generally divided into three paths, Path-I, Path-II and Path-III. As shown in Table 2, for Group-I, i.e., Path-I, conventional triaxial compression test, we first loaded σ1 and σ3 at 0.5 MPa/s to the corresponding initial hydrostatic pressure O’ with the help of the confining pressure system in Figure 2a. Four confining pressures of 0, 10, 30 and 50 MPa were selected to obtain the failure envelope under the conventional triaxial compression test. The specimen was then loaded in the axial direction at a 0.12 mm/min rate along the O’A path until the specimen was destroyed. For Group-II, the conventional triaxial unloading test, which includes Path-II and Path-III, the initial confining pressure was selected as 50 MPa, which corresponds to the ground stress at a burial depth of about 2000 m, and the difference from Group-I was that the confining pressure started unloading when the axial load reached 80% (O’’) of the triaxial compression strength, the unloading rates were selected as 0.1, 1, 5 and 10 MPa/s, respectively. Meanwhile, the axial loading of different specimens was carried out at a rate of 0.06, 0.6, and 6 mm/min, until the specimen failed.
3. Results and Discussion
3.1. Mechanical Characteristics
3.1.1. Stress–Strain Curve
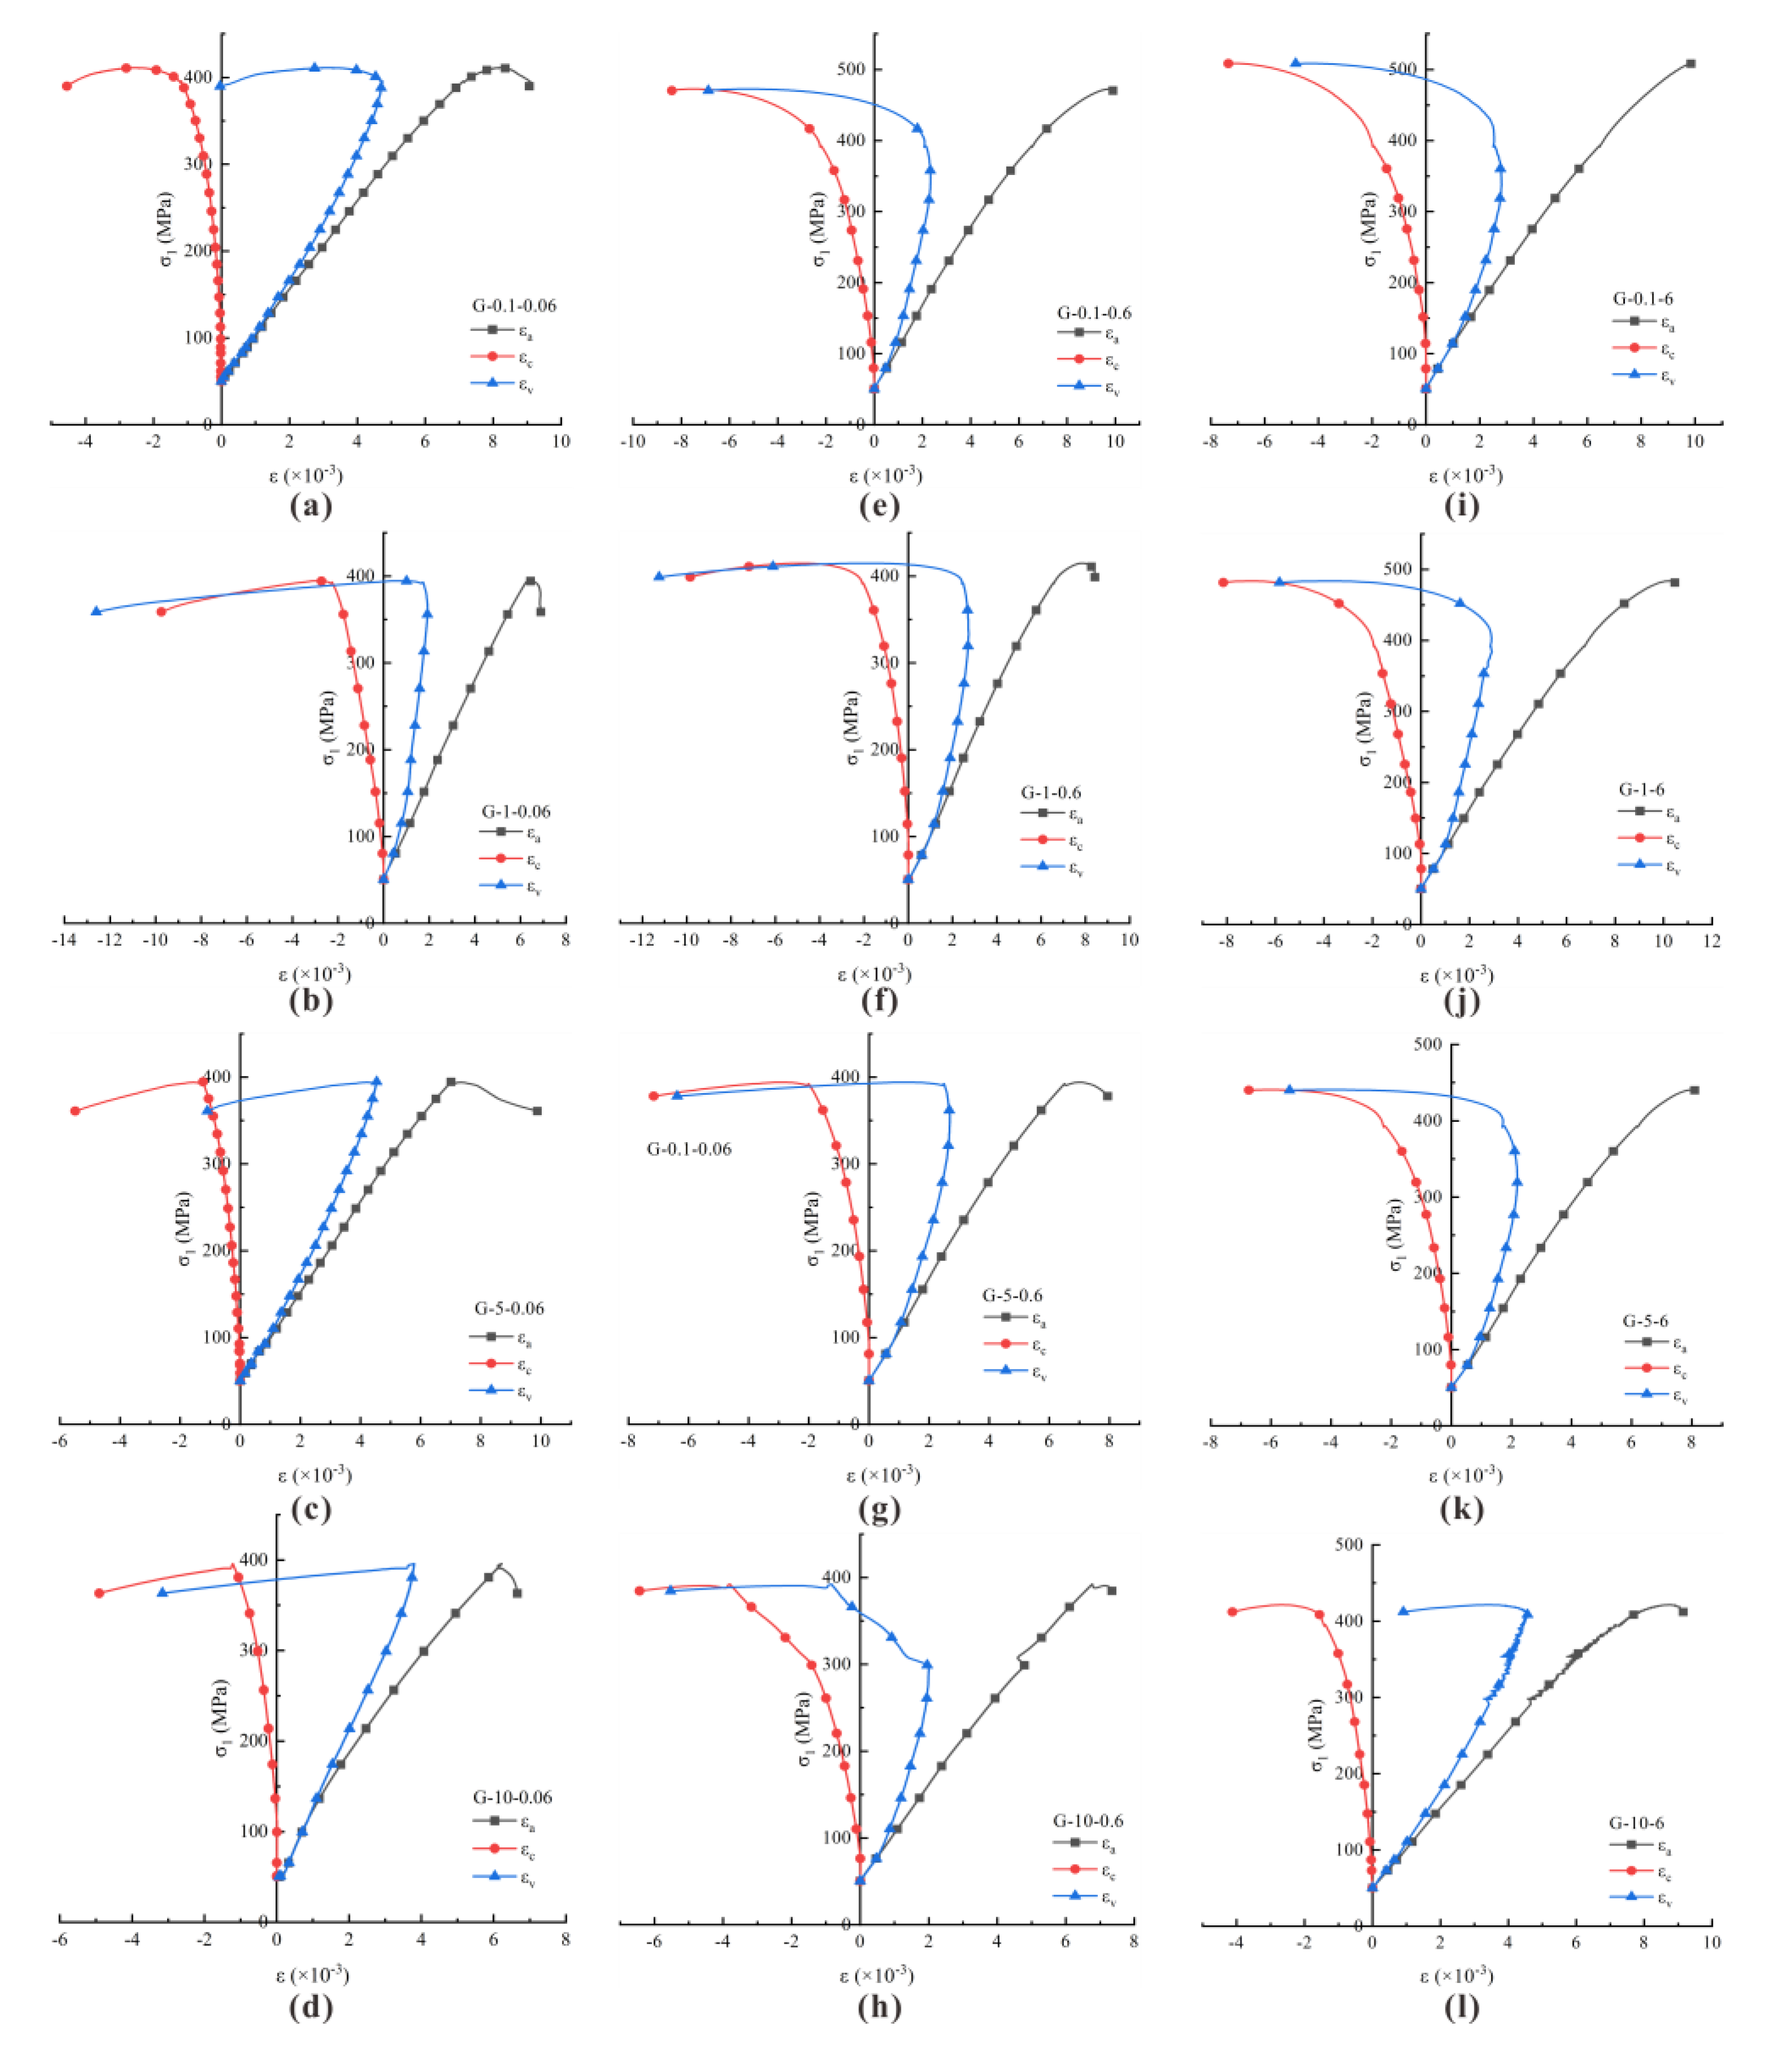
Figure 3 shows the relationship between the axial strain εa, the circumferential strain εc, the body strain εv and the principal stress σ1 for the saturated granite in the triaxial unloading test. In the unloading stage, the change rate of strain values increased significantly with the increase of the unloading rate, even though there was not much correlation with the final strain value, while the change of axial stress values was closely related to the axial loading rate va and the unloading rate vu. When va = 0.06 mm/min, the principal stress σ1 decreased gradually with the εa increase in the unloading stage. In particular, the unloading rate obviously affected the strain value; the strain value of the specimen changed rapidly when vu > 0.1 MPa/s. At va = 0.6 mm/min, σ1 gradually increased with εa except for vu = 0.1 MPa/s and then gradually decreased with the increase of vu at the rest of vu; at va = 6 mm/min, σ1 gradually increased with the increase of εa, and the magnitude of increase increased with the increase of vu. The increased range decreased with the increase of vu. until vu = 10 MPa/s. When it was converted to σ1,, σ1 increased first and then decreased with the increase of the εa. In addition, the εc-σ1 and εv-σ1 curves have the same trend as the εv-σ1 curve.
3.1.2. Strength Characteristics
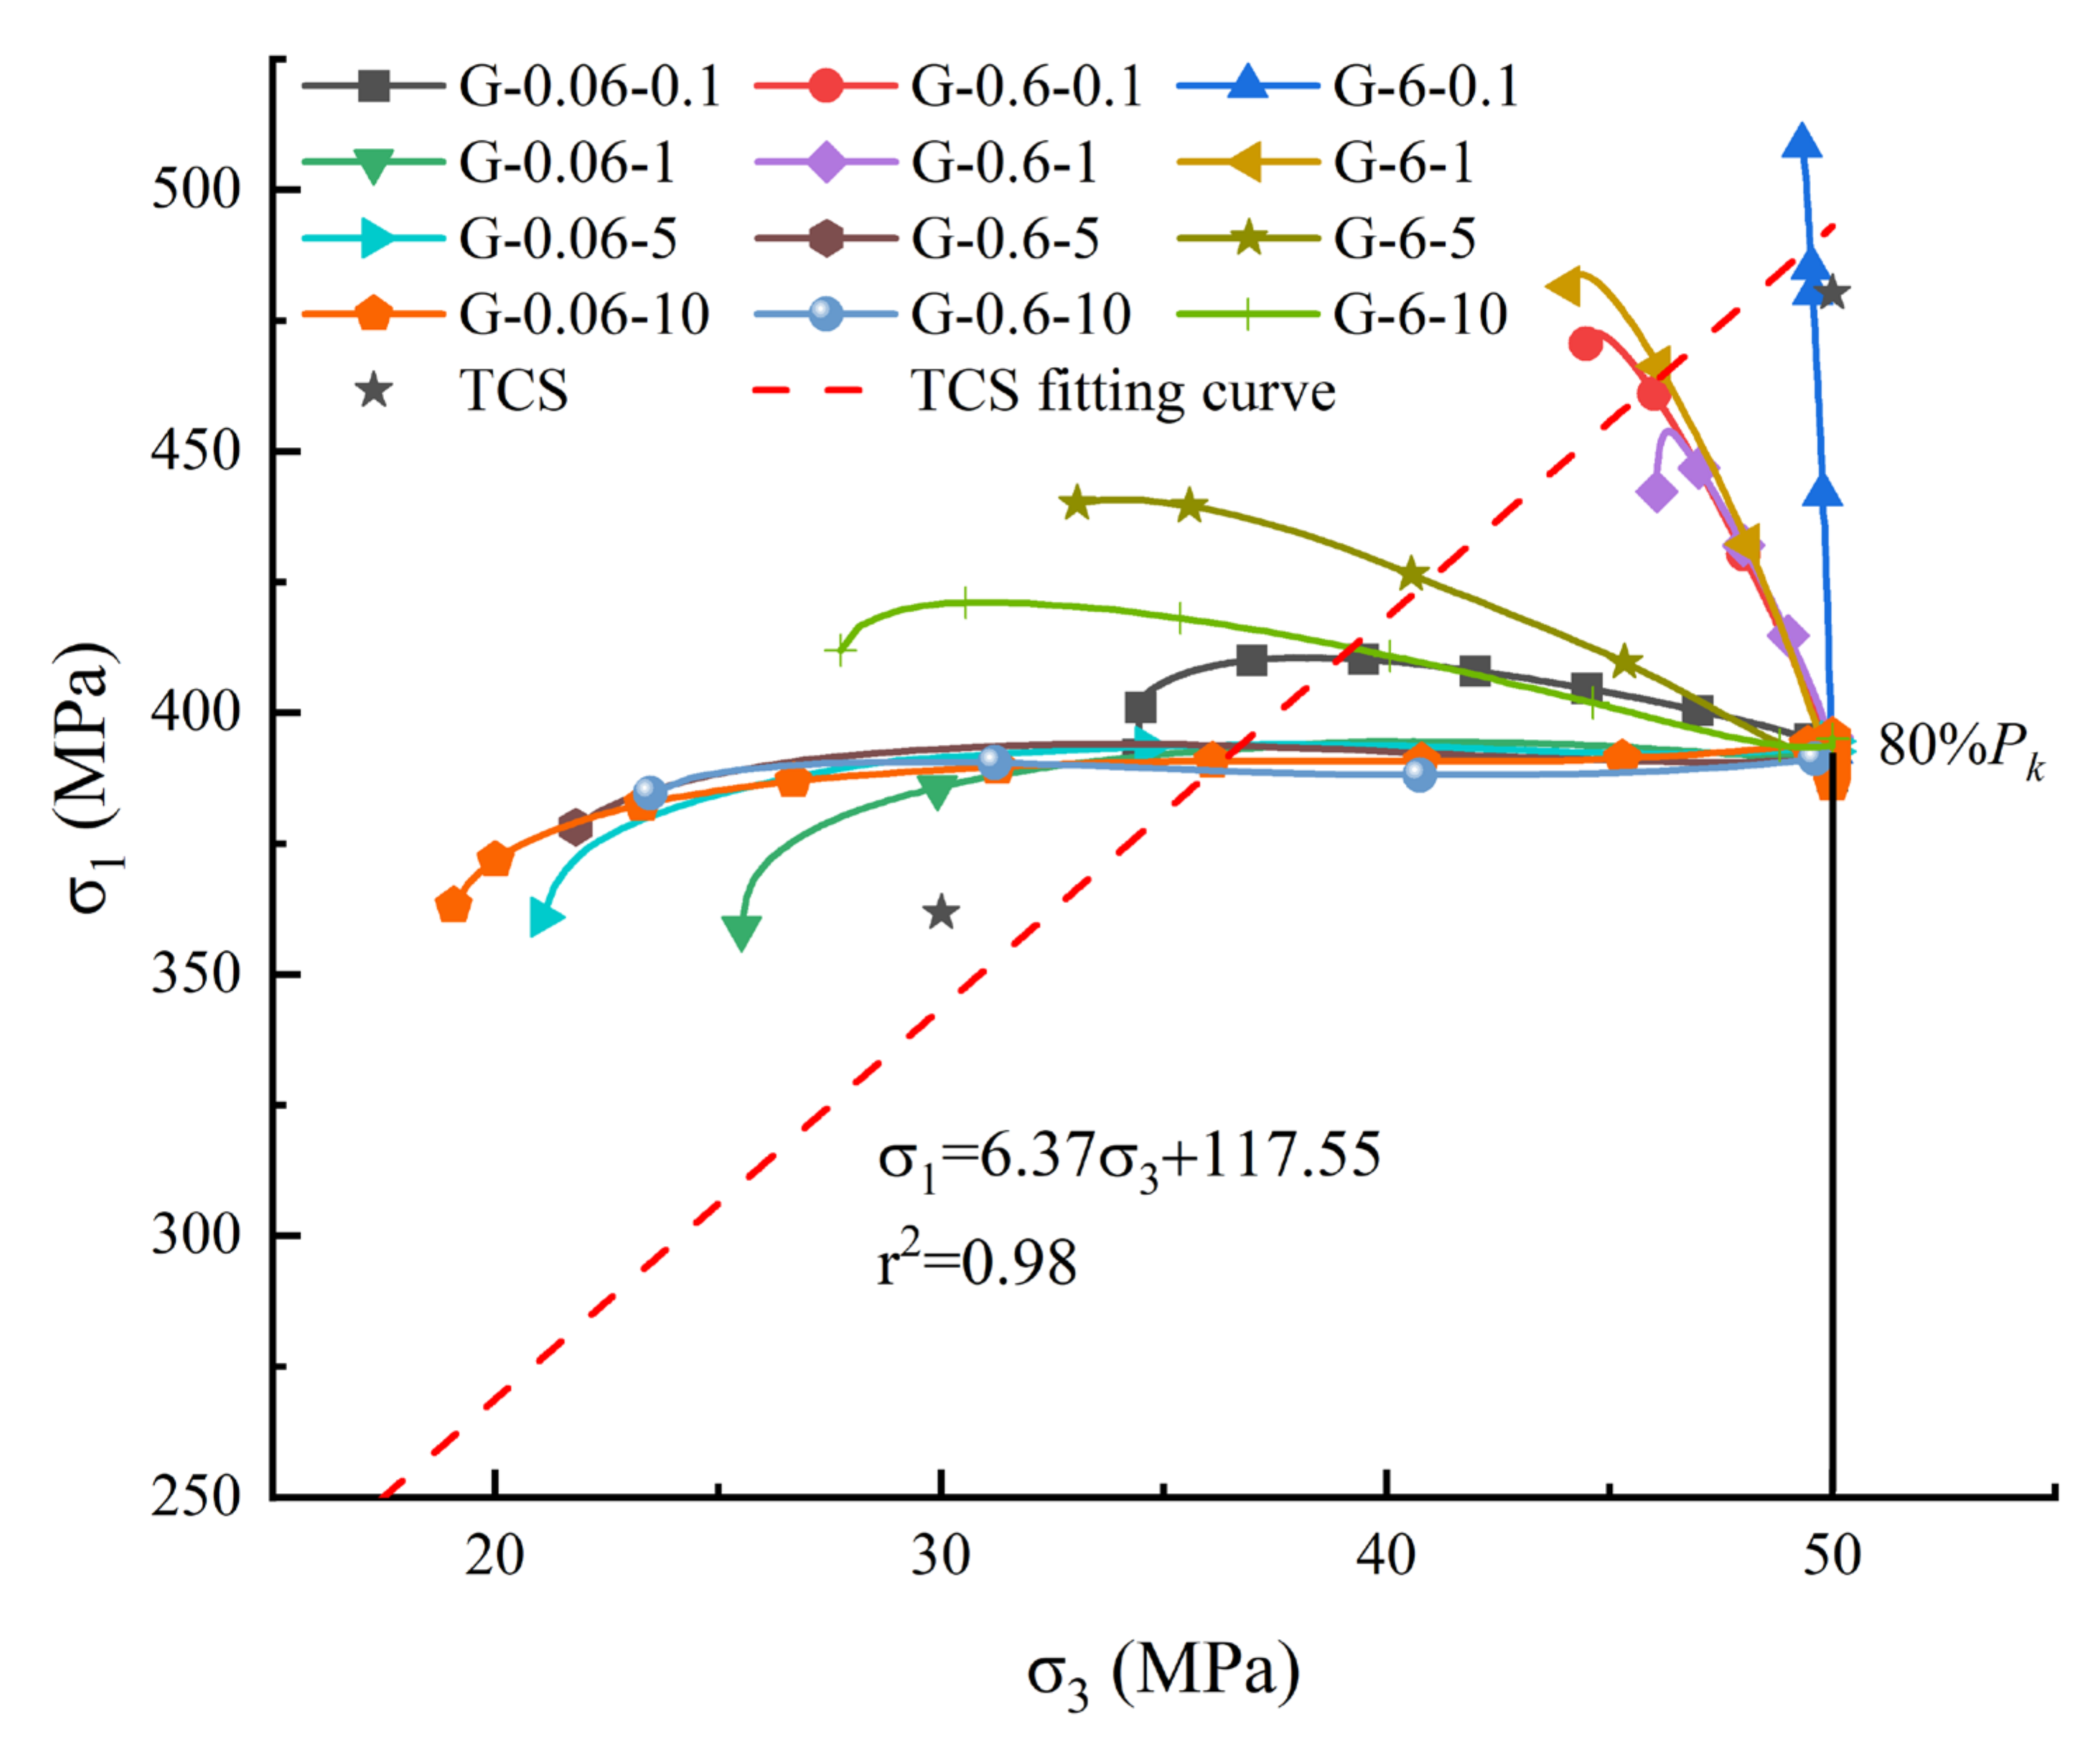
Figure 4 illustrates the variation of σ1–σ3 of all specimens before damage in the unloading test, in which the red scribed line is the conventional triaxial compression strength fitting line of saturated granite specimens under 0, 10, 30 and 50 MPa confining pressure. Combined with Table 3, it can be seen that in the triaxial unloading test, all the failure points (σ1, σ3) fall to the left side of the fitting line of the triaxial loading test except for G-0.6-1. This indicates that the bearing capacity of the specimen was improved to some extent under the unloading test, and this phenomenon is more obvious in Path-III. The main reason is that during the unloading test, the circumferential of the rock specimen has a significant expansion. When the stress change rate of the unloading rate is greater than that of the axial loading, for example, G-0.06-10, the confining pressure decreases quickly. The axial pressure decreases at a rate lower than the amount of the confining pressure; therefore, a smaller σ3 and a relatively larger σ1 are obtained. When the change rate of σ3 is less than σ1, for example, G-6-0.1, the specimen is loaded at a relatively larger rate in the axial direction. This disguisedly increases the specimen’s strength. Only when the rate of stress change due to the unloading rate is similar to that of axial loading, i.e., G-0.6-1, is the axial loading rate of the specimen lower than the rate of conventional triaxial compression. Therefore, the strength is less than the conventional triaxial compression strength fitting line value.
In addition, when the ratio of axial loading rate to unloading rate a ≤ 0.001 mm/MPa, the test paths correspond to Path-III, i.e., keep σ1 reducing σ3. When the ratio of the axial loading rate to the unloading rate a ≤ 0.02 mm/MPa, the test paths are corresponding to Path-II and are closer to Path-III, when a > 0.1 mm/MPa, the test paths are corresponding to Path-II and are closer to Path-I. This phenomenon is more and more significant with the increase of a.
3.1.3. Strain Characteristics
Table 4 lists the strain axial strain εa0, circumferential strain εc0 and body strainεv0 of the specimen at the unloading point and the strain axial strain εaf, circumferential strain εcf and body strain εvf at the failure point, and the difference in body strain Δεvf between the failure and unloading points. The difference in circumferential strain Δεc and body strain Δεv between the failure point and unloading points are shown in Figure 5. It was found that the axial strain of the specimen in conventional triaxial compression was the leading cause of specimen failure. Specifically, the axial strain difference Δεa = εaf − εa0 of the specimen gradually increased with the increase of confining pressure, while the circumferential strain difference Δεc = εcf − εc0 did not change much. The body strain difference Δεv = εvf − εv0 gradually increases with increasing circumferential pressure, except for uniaxial compression. Where Δεa/Δεc = 15.94%, the specimen mainly occurs in circumferential tensile strain failure. Under confining pressure, Δεa/Δεc gradually increases with increasing circumferential pressure from 21.12% to 50.24%. At this time, the confining pressure has a good restraint effect on the circumferential deformation. The circumferential deformation is the leading cause of specimens’ damage in the triaxial unloading test. At the axial loading rate of 0.06 mm/min, the maximum value of Δεa/Δεc is only 33.37% (G-0.06-5), and the minimum value of Δεa/Δεc is 4.23%, i.e., G-0.06-1, which is the minimum value in all the tests. At the axial loading rate of 6 mm/min, the axial loading rate is five times the loading rate of the conventional triaxial compression test, which causes the axial deformation of the specimen to be significantly enhanced, with the maximum value of Δεa/Δεc even reaching 35.69% at G-6-10.
The stress state achieved by unloading the confining compression is equivalent to superimposing a circumferential tensile stress on the original stress state, resulting in a significant circumferential expansion of the specimen. In plasticity theory, the dilatancy angle ψ is usually used to characterize the inelastic volume change. As suggested by Vermeer [63], the dilatancy angle ψ can be expressed as Equation (1):
where Δεap and Δεvp are the axial and volumetric plastic strain increments, respectively, and can be calculated by Equations (2)–(4).
The evolution of the dilatancy angle ψ with the normalized plastic shear strain increment Δγp/Δγpmax from the beginning of unloading to the ultimate bearing strength under different unloading rates is given in Figure 6. For the influence of the loading rate on the dilatancy angle at the axial loading rate va = 0.06 mm/min, the change in the dilatancy angle ψ of the specimens was not significantly related to the unloading rate at Δγp/Δγpmax < 0.2, while at Δγp/Δγpmax ≥ 0.2, the dilatancy angle ψ increased slowly overall with the increase of Δγp/Δγpmax. The size of the dilatancy angle was closely related to the initial dilatancy angle and less related to the unloading rate. Finally, the dilatancy angle exhibits a small decrease as the plastic shear strain Δγp/Δγpmax approaches 1. At va = 0.6 mm/min, the ψ of the specimen slowly decreases with the increase of plastic shear strain when the unloading rate vu is 10 MPa/s and increases first before Δγp/Δγpmax = 0.45, then decreases when vu is 0.1 MPa/s. It slowly increases with the increase of plastic shear strain at the unloading rate of 1 MPa/s and 5 MPa/s. From the late stage of damage, the ψ of the specimen will gradually increase with the increase of the vu except for G-6-10. When the axial loading rate va = 6 mm/min, the ψ of the specimen increases slowly with the increase of the plastic shear strain, except for vu = 10 MPa/s. At this time, a higher unloading rate will correspond to a larger ψ of the specimen. At vu = 10 MPa/s, the ψ of the specimen decreases rapidly with the increase of the plastic shear strain. It is noteworthy that at an unloading rate of 1 MPa/s, the ψ of the specimen decreases with an increasing axial loading rate, while at an unloading rate of 5 MPa/s, the ψ of the specimen increases with an increasing axial loading rate. This also indicates that slight plastic damage in the unloading process can cause a high expansion process, which is the reason for the expansion deformation in the annulus caused by the unloading stress path.
3.2. Energy Evolution Characteristics
The total energy U, axial strain energy Ua, circumferential strain energy Uc, elastic energy Ue and dissipation energy Ud of the specimen during the tests can be calculated from the following Equations (5)–(8) [43], and the calculated results are presented in Table 5.
where n is the total number of segments of the stress–strain curve, i is the segmentation points, and the segment interval time is 0.1 s; Eut and μut are the unloaded elastic modulus and Poisson’s ratio at time t, respectively.
3.2.1. Evolution of Strain Energy in the Triaxial Compression Test
From the energy statistics in Table 5, it can be seen that the confining pressure σ3 performs positive work in the conventional triaxial compression test to stop the destruction of the rock specimen, while in the conventional triaxial unloading test, the σ3 does negative work to help the rock destruction. Meanwhile, Ua > Uc, and Ue > Ud. In the conventional triaxial compression test, the relationship between energy and confining pressure is shown in Equation (9), where Uc and Ud increase approximately linearly with the increase of the confining pressure, while U, Ua and Ue increase quadratically with the increase of the confining pressure.
3.2.2. Evolution of Strain Energy in a Triaxial Compression Unloading Confining Pressure Test
The variation of each energy in the conventional triaxial unloading confining pressure test is shown in Figure 7. It can be found that the relationship of each energy throughout the test is Ua > U > Ud > Ue > Uc, while the change of energy after the unloading point becomes more complicated.To explore the change characteristics, we define ΔUα = Uαf − Uα0, which represents different energy types, and thus obtain the relationship between different unloading rates and the amount of energy change under the same axial loading rate as shown in Figure 8. It can be found that when the axial loading rate is 0.06 mm/min and 0.6 mm/min, the relationship between various energy changes is roughly ΔUa > ΔU > ΔUd > ΔUe > ΔUc. When the axial loading is 0.6 mm/min, the relationship between various energy changes is ΔUd > ΔUa > ΔU > ΔUe > ΔUc. The reason for this phenomenon is that when the axial loading rate is 0.06 mm/min and 0.6 mm/min, except for the unloading rate of 0.1 MPa/s and the axial loading rate of 0.6 mm/min, the σ1 of the specimens is slowly reduced from the unloading point under the rest of the loading rate. The confining pressure has been doing negative work from the unloading point, so ΔUa > ΔU > ΔUd > ΔUe > ΔUc, due to the reduction of the confining pressure. The bearing capacity of the specimen is gradually reduced, and part of the elastic energy Ue has been transformed into dissipated energy; Ud1 was released. In addition, the dissipated energy Ud2 released during the unloading process increases ΔUd to a point greater than the change of elastic energy ΔUe. Furthermore, the circumferential strain energy Uc that has been doing negative work enables Ua < Ud, and finally, the relationship between each energy change amount is obtained by Equation (5). It is worth noting that at the axial loading rate of 0.6 mm/min with the unloading rate of 5 MPa/s and 10 MPa/s, the relationship of each energy change is consistent with that of the axial loading rate of 6 mm/min, i.e., ΔUd > ΔUa > ΔU > ΔUe > ΔUc.
When the axial loading rate va is 6 mm/min, despite the unloading rate of the confining pressure gradually increasing, the growth of σ1 slowly decreases, and σ1 gradually increases overall, the axial stress increases rapidly, the confining pressure does negative work. As a result, ΔUc becomes the smallest, and the amount of change gradually decreases with the increase of the unloading rate. The axial stress increases rapidly, the restriction of the circumferential direction becomes smaller and smaller. The dissipation energy increases sharply, and ΔUd is the largest. From Figure 8c, it can be seen that the amount of change of ΔUd is not much on the whole, i.e., it is not much correlated with the unloading rate, which also means that with the increase of the axial loading rate, the dissipation energy is determined from the original by the unloading rate and the axial loading rate to the axial loading rate alone. ΔUa is slightly lower than ΔUd, while the elastic energy change ΔUe has a slight increase. The ΔUa and ΔU decrease gradually with an increasing unloading rate, while ΔUc decreases until the unloading rate is 1 MPa/s and increases slowly after that.
With the increase of vu, the variation of circumferential energy ΔUc tends to decrease slowly, independent of the axial loading rate. While the variation of the rest of the energy at va = 0.06 mm/min and va = 0.6 mm/min shows inverted V-shaped and V-shaped changes, respectively. Moreover, when va = 6 mm/min, except for the variation of total energy ΔU, axial energy ΔUa decreases with the increase of the unloading rate, and the variation of the rest of the energy has increased in different degrees.
3.3. Rock Failure Characteristics and Destruction Mechanism
The failure patterns of the saturated granite specimens under conventional triaxial unloading tests are shown in Figure 9. As you can see, at the axial loading rate of 0.06 mm/min, the failure surface of the specimen is a single shear failure plane, which is similar to the failure pattern of the specimen under conventional triaxial compression. At the axial loading rate of 0.6 mm/min, the failure surface of the specimen is complex, with a form of multiple shear surface compound. However, when the axial loading rate is 6 mm/min, the specimens show conjugate shear failure accompanied by a few tension strain failure, indicating that before the axial loading rate is 0.6 mm/min, the failure form of the specimen is mainly controlled by the axial stress, while after the axial loading rate of 0.6 mm/min, the failure mode of the specimen is controlled by both the axial stress and the circumferential stress.
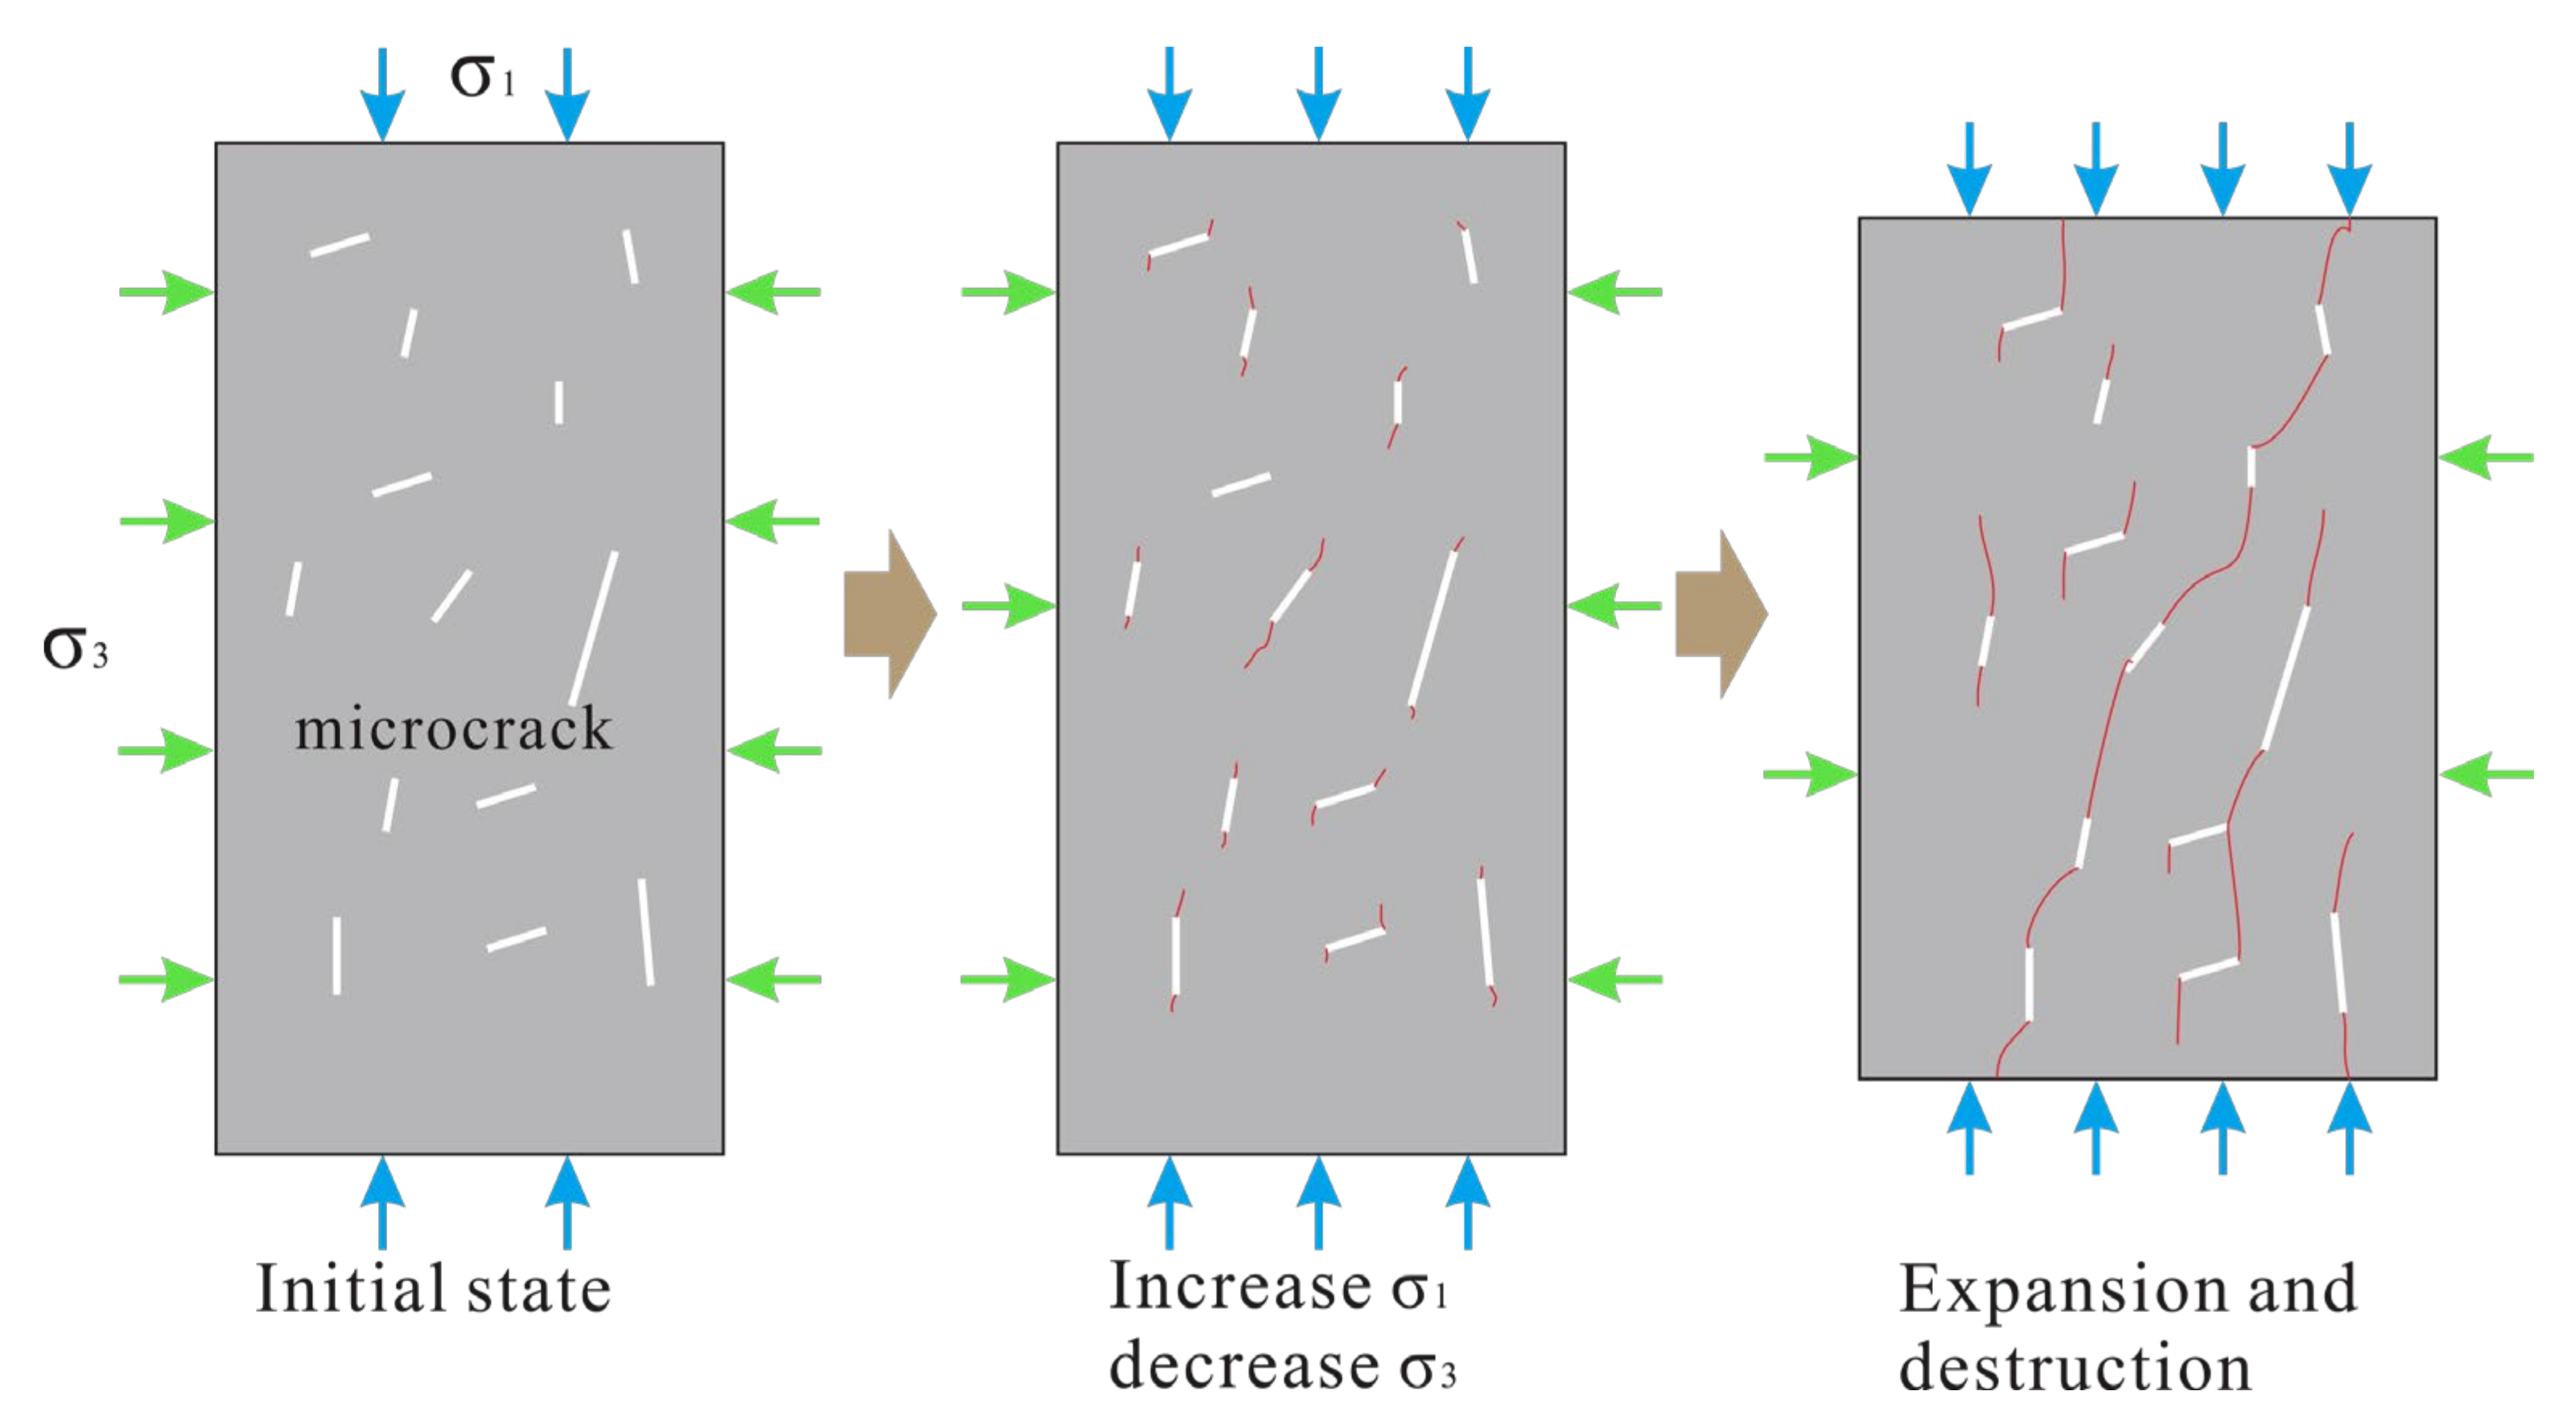
Figure 10 shows the damage evolution process of the granite specimen. The damage to the specimen is attributed to the combined effect of internal microcracks, axial stress and circumferential stress. Due to many microcracks inside the granite specimen, the microcracks have started to crack or tend to crack during the initial triaxial compression stage. As the triaxial unloading test begins, σ1/σ3 gradually increases with the unloading of the circumferential stress and the change of the axial stress. Meanwhile, the specimen is gradually compressed in the axial direction. At the same time, the reduction of the lateral constraint of the specimen provides help for the lateral deformation of the specimen. The specimen tended to be compressed axially and expanded laterally. The internal microcracks are cracked and expanded continuously, leading to penetration between step cracks and crack penetration along the σ1 direction, which eventually leads to the specimen’s shear failure and tensile strain failure.
Although a series of unloading tests with different axial loading rates and circumferential unloading rates have been successfully carried out on saturated granite, these tests are all based on conventional triaxial test equipment, which still cannot achieve the three unequal principal stresses in the underground space. Moreover, considering that the explosion is completed instantaneously during blasting excavation, the unloading rate is much larger than the unloading rate that can be achieved in the laboratory. Nevertheless, the damage to the surrounding rock results from the combined effect of axial and lateral stresses after unloading. Our study also provides some references for understanding the geological hazards such as rockburst in deeply buried tunnels. Subsequent research should consider the geological discontinuity and diversity, including single or multiple cracks or different materials included in one sample. Moreover, it is also meaningful to consider more environmental factors such as thermal shock and to study the microscopic characteristics and acoustic emission [64,65] characteristics of the fracture surface of the specimen using SEM and other equipment.
4. Conclusions
- (1)
- In the conventional triaxial unloading test, the circumferential deformation is the leading cause of failure, and its strain is greater than that of conventional triaxial loading. Under the same axial loading rate, the faster the unloading rate and axial loading rate, the smaller the σ3f and σ1f at the time of failure, and the failure point is outside the envelope of conventional triaxial compression tests. While under the same unloading rate, a faster axial loading corresponds to a larger σ3f and σ1f.
- (2)
- The variation of circumferential energy ΔUc decreases with the unloading rate, and ΔUd, ΔUa, ΔU and ΔUe showed inverted V-shaped and V-shaped va = 0.06 and 0.6 mm/min, respectively. When va = 6 mm/min, except for a slight increase in ΔUa, the rest of the variation of energy decreases with the increase of the unloading rate. The variation of dissipation energy changes from being determined by the unloading rate and the axial loading rate together to being determined by the axial loading rate with the axial loading rate increasing.
- (3)
- The failure modes of the specimens were mainly controlled by the axial stress and showed a single shear crack before va = 0.6 mm/min, while it is influenced by both axial and circumferential stress after the axial loading rate of not less than 6 mm/min, and the failure surface is a conjugate shear failure and tensile strain failure.
- (4)
- In the triaxial unloading test, the specimens were in the high expansion process most of the time, and the dilatancy angle of the specimens showed an overall upward trend except for vu = 10 MPa/s, va = 0.6 mm/min and 6 mm/min.
Author Contributions
Conceptualization, methodology, investigation, Z.L. and W.Y.; data curation, visualization, Z.L.; writing—original draft preparation, Z.L.; writing—review and editing, W.Y.; supervision, project administration, funding acquisition, W.Y. All authors have read and agreed to the published version of the manuscript.
Funding
The authors are grateful for the financial supports from the Excellent Postdoctoral Innovative Talents Project of Hunan Province, China (No. 2020RC2001).
Institutional Review Board Statement
Not applicable.
Informed Consent Statement
Not applicable.
Data Availability Statement
Data available on request due to privacy restrictions.
Acknowledgments
The authors would like to acknowledge the staff who processed the specimens and helped with testing, and many thanks to the three unknown reviewers for their careful review.
Conflicts of Interest
The authors declare no conflict of interest.
References
- Li, X.; Gong, F.; Tao, M.; Dong, L.; Du, K.; Ma, C.; Zhou, Z.; Yin, T. Failure mechanism and coupled static-dynamic loading theory in deep hard rock mining: A review. J. Rock Mech. Geotech. Eng. 2017, 9, 767–782. [Google Scholar] [CrossRef]
- Liu, Z.; Ma, C.; Wei, X.A.; Xie, W. Experimental Study of Rock Subjected to Triaxial Extension. Rock Mech. Rock Eng. 2022, 55, 1069–1077. [Google Scholar] [CrossRef]
- Yi, W.; Rao, Q.-H.; Sun, D.-L.; Shen, Q.-Q.; Zhang, J. A new integral equation method for calculating interacting stress-intensity factors of multiple holed-cracked anisotropic rock under both far-field and arbitrary surface stresses. Int. J. Rock Mech. Min. Sci. 2021, 148, 104926. [Google Scholar] [CrossRef]
- Fereidooni, D. Determination of the Geotechnical Characteristics of Hornfelsic Rocks with a Particular Emphasis on the Correlation Between Physical and Mechanical Properties. Rock Mech. Rock Eng. 2016, 49, 2595–2608. [Google Scholar] [CrossRef]
- Gautam, L.; Jain, J.K.; Jain, A.; Kalla, P. Valorization of bone-china ceramic powder waste along with granite waste in self-compacting concrete. Constr. Build. Mater. 2022, 315, 125730. [Google Scholar] [CrossRef]
- Gautam, P.K.; Dwivedi, R.; Kumar, A.; Kumar, A.; Verma, A.K.; Singh, K.H.; Singh, T.N. Damage Characteristics of Jalore Granitic Rocks After Thermal Cycling Effect for Nuclear Waste Repository. Rock Mech. Rock Eng. 2021, 54, 235–254. [Google Scholar] [CrossRef]
- Gautam, P.K.; Verma, A.K.; Sharma, P.; Singh, T.N. Evolution of Thermal Damage Threshold of Jalore Granite. Rock Mech. Rock Eng. 2018, 51, 2949–2956. [Google Scholar] [CrossRef]
- Gautam, P.K.; Jha, M.K.; Verma, A.K.; Singh, T.N. Evolution of absorption energy per unit thickness of damaged sandstone. J. Therm. Anal. Calorim. 2019, 136, 2305–2318. [Google Scholar] [CrossRef]
- Xie, H.Q.; He, C. Study of the unloading characteristics of a rock mass using the triaxial test and damage mechanics. Int. J. Rock Mech. Min. Sci. 2004, 41, 366. [Google Scholar] [CrossRef]
- Chen, J.; Jiang, D.Y.; Ren, S.; Yang, C.H. Comparison of the characteristics of rock salt exposed to loading and unloading of confining pressures. Acta Geotech. 2016, 11, 221–230. [Google Scholar] [CrossRef]
- Huang, D.; Li, Y. Conversion of strain energy in Triaxial Unloading Tests on Marble. Int. J. Rock Mech. Min. Sci. 2014, 66, 160–168. [Google Scholar] [CrossRef]
- Ma, C.; Xie, W.; Liu, Z.; Li, Q.; Xu, J.; Tan, G. A New Technology for Smooth Blasting without Detonating Cord for Rock Tunnel Excavation. Appl. Sci. 2020, 10, 6764. [Google Scholar] [CrossRef]
- Sato, T.; Kikuchi, T.; Sugihara, K. In-situ experiments on an excavation disturbed zone induced by mechanical excavation in Neogene sedimentary rock at Tone mine, central Japan. Eng. Geol. 2000, 56, 97–108. [Google Scholar] [CrossRef]
- Wei, X.A.; Li, Q.; Ma, C.; Dong, L.; Zheng, J.; Huang, X. Experimental investigations of direct measurement of borehole wall pressure under decoupling charge. Tunn. Undergr. Space Technol. 2022, 120, 104280. [Google Scholar] [CrossRef]
- Xiao, F.; Jiang, D.; Wu, F.; Zou, Q.; Chen, J.; Chen, B.; Sun, Z. Effects of prior cyclic loading damage on failure characteristics of sandstone under true-triaxial unloading conditions. Int. J. Rock Mech. Min. Sci. 2020, 132, 104379. [Google Scholar] [CrossRef]
- He, J.; Wang, Z.; Bai, J.; Zhang, L. Study on the Hoek-Brown parameters under loading and unloading triaxial laboratory tests. In Proceedings of the 1st International Conference on Civil Engineering, Architecture and Building Materials (CEABM 2011), Haikou, China, 18–20 June 2011; pp. 2074–2078. [Google Scholar]
- Duan, K.; Ji, Y.L.; Wu, W.; Kwok, C.Y. Unloading-induced failure of brittle rock and implications for excavation induced strain burst. Tunn. Undergr. Space Technol. 2019, 84, 495–506. [Google Scholar] [CrossRef]
- Ding, Q.-L.; Ju, F.; Mao, X.-B.; Ma, D.; Yu, B.-Y.; Song, S.-B. Experimental Investigation of the Mechanical Behavior in Unloading Conditions of Sandstone After High-Temperature Treatment. Rock Mech. Rock Eng. 2016, 49, 2641–2653. [Google Scholar] [CrossRef]
- Kang, P.; Jing, Z.; Zou, Q.L.; Xiao, S. Deformation characteristics of granites at different unloading rates after high-temperature treatment. Environ. Earth Sci. 2020, 79, 343. [Google Scholar] [CrossRef]
- Yi, W.; Rao, Q.-H.; Li, Z.; Sun, D.-L.; Shen, Q.-Q. Thermo-hydro-mechanical-chemical (THMC) coupling fracture criterion of brittle rock. Trans. Nonferrous Met. Soc. China 2021, 31, 2823–2835. [Google Scholar] [CrossRef]
- Ma, Y.; Rao, Q.; Huang, D.; Yi, W.; He, Y. A new theoretical model of local air-leakage seepage field for the compressed air energy storage lined cavern. J. Energy Storage 2022, 49, 104160. [Google Scholar] [CrossRef]
- Azarafza, M.; Ghazifard, A.; Akgun, H.; Asghari-Kaljahi, E. Geotechnical characteristics and empirical geo-engineering relations of the South Pars Zone marls, Iran. Geomech. Eng. 2019, 19, 393–405. [Google Scholar] [CrossRef]
- Faradonbeh, R.S.; Taheri, A.; Ribeiro e Sousa, L.; Karakus, M. Rockburst assessment in deep geotechnical conditions using true-triaxial tests and data-driven approaches. Int. J. Rock Mech. Min. Sci. 2020, 128, 104279. [Google Scholar] [CrossRef]
- Fern, E.J.; Di Murro, V.; Soga, K.; Li, Z.L.; Scibile, L.; Osborne, J.A. Geotechnical characterisation of a weak sedimentary rock mass at CERN, Geneva. Tunn. Undergr. Space Technol. 2018, 77, 249–260. [Google Scholar] [CrossRef] [Green Version]
- Yi, W.; Rao, Q.-H.; Luo, S.; Shen, Q.-Q.; Li, Z. A new integral equation method for calculating interacting stress intensity factor of multiple crack-hole problem. Theor. Appl. Fract. Mech. 2020, 107, 102535. [Google Scholar] [CrossRef]
- Huang, R.-Q.; Huang, D. Experimental research on affection laws of unloading rates on mechanical properties of Jinping marble under high geostress. Chin. J. Rock Mech. Eng. 2010, 29, 21–33. [Google Scholar]
- Guo, Y.; Wang, L.; Chang, X. Study on the damage characteristics of gas-bearing shale under different unloading stress paths. PLoS ONE 2019, 14, e0224654. [Google Scholar] [CrossRef]
- Liu, Z.; Ma, C.; Wei, X.A.; Xie, W. Experimental study on mechanical properties and failure modes of pre-existing cracks in sandstone during uniaxial tension/compression testing. Eng. Fract. Mech. 2021, 255, 107966. [Google Scholar] [CrossRef]
- Liu, Z.; Ma, C.; Wei, X.-A. Electron scanning characteristics of rock materials under different loading methods: A review. Geomech. Geophys. Geo 2022, 8, 80. [Google Scholar] [CrossRef]
- Xu, J.; Li, H.; Meng, Q.; Xu, W.; He, M.; Yang, J. A Study on Triaxial Unloading Test of Columnar-Jointed-Rock-Mass-Like Material with AW Velocity Analysis. Adv. Civ. Eng. 2020, 2020, 6693544. [Google Scholar] [CrossRef]
- Han, Y.; Ma, H.; Yang, C.; Li, H.; Yang, J. The mechanical behavior of rock salt under different confining pressure unloading rates during compressed air energy storage (CAES). J. Pet. Sci. Eng. 2021, 196, 107676. [Google Scholar] [CrossRef]
- Cong, Y.; Wang, Z.Q.; Zheng, Y.R.; Zhang, L.M. Effect of Unloading Stress Levels on Macro- and Microfracture Mechanisms in Brittle Rocks. Int. J. Geomech. 2020, 20, 04020066. [Google Scholar] [CrossRef]
- Chen, X.; Tang, C.A.; Yu, J.; Zhou, J.F.; Cai, Y.Y. Experimental investigation on deformation characteristics and permeability evolution of rock under confining pressure unloading conditions. J. Cent. South Univ. 2018, 25, 1987–2001. [Google Scholar] [CrossRef]
- Xue, Y.; Ranjith, P.G.; Gao, F.; Zhang, D.; Cheng, H.; Chong, Z.; Hou, P. Mechanical behaviour and permeability evolution of gas-containing coal from unloading confining pressure tests. J. Nat. Gas Sci. Eng. 2017, 40, 336–346. [Google Scholar] [CrossRef]
- Wang, K.; Zheng, J.-Y.; Zhu, K.-S. Analysis of deformation failure characteristics and energy of anthracite under two kinds of stress paths. Rock Soil Mech. 2015, 36, 259–266. [Google Scholar] [CrossRef]
- Yi, W.; Rao, Q.; Ma, W.; Sun, D.; Shen, Q. A new analytical-numerical method for calculating interacting stresses of a multi-hole problem under both remote and arbitrary surface stresses. Appl. Math. Mech. Engl. Ed. 2020, 41, 1539–1560. [Google Scholar] [CrossRef]
- Chen, J.; Zhou, H.; Zeng, Z.Q.; Lu, J.J. Macro- and Microstructural Characteristics of the Tension-Shear and Compression-Shear Fracture of Granite. Rock Mech. Rock Eng. 2020, 53, 201–209. [Google Scholar] [CrossRef]
- Yang, Y.J.; Zhou, Y.; Ma, D.P.; Ji, H.Y.; Zhang, Y.D. Acoustic Emission Characteristics of Coal under Different Triaxial Unloading Conditions. Acta Geodyn. Geomater. 2020, 17, 51–60. [Google Scholar] [CrossRef] [Green Version]
- Zhou, X.P.; Zhang, Y.X.; Ha, Q.L. Real-time computerized tomography (CT) experiments on limestone damage evolution during unloading. Theor. Appl. Fract. Mech. 2008, 50, 49–56. [Google Scholar] [CrossRef]
- Zhou, K.P.; Liu, T.Y.; Hu, Z.X. Exploration of damage evolution in marble due to lateral unloading using nuclear magnetic resonance. Eng. Geol. 2018, 244, 75–85. [Google Scholar] [CrossRef]
- Wu, H.; Zhu, H.-H.; Zhang, C.-C.; Zhou, G.-Y.; Zhu, B.; Zhang, W.; Azarafza, M. Strain integration-based soil shear displacement measurement using high-resolution strain sensing technology. Measurement 2020, 166, 108210. [Google Scholar] [CrossRef]
- Wang, Y.; Zhao, Q.H.; Xiao, Y.G.; Hou, Z.Q. Influence of time-lagged unloading paths on fracture behaviors of marble using energy analysis and post-test CT visualization. Environ. Earth Sci. 2020, 79, 217. [Google Scholar] [CrossRef]
- Zhao, G.Y.; Dai, B.; Dong, L.J.; Yang, C. Energy conversion of rocks in process of unloading confining pressure under different unloading paths. Trans. Nonferrous Met. Soc. China 2015, 25, 1626–1632. [Google Scholar] [CrossRef]
- Wang, S.; Wang, H.; Xu, W.; Qian, W. Investigation on mechanical behaviour of dacite under loading and unloading conditions. Geotech. Lett. 2019, 9, 130–135. [Google Scholar] [CrossRef]
- Li, D.Y.; Sun, Z.; Xie, T.; Li, X.B.; Ranjith, P.G. Energy evolution characteristics of hard rock during triaxial failure with different loading and unloading paths. Eng. Geol. 2017, 228, 270–281. [Google Scholar] [CrossRef]
- Yi, W.; Rao, Q.; Zhu, W.; Shen, Q.; Li, Z.; Ma, W. Interacting Stress Intensity Factors of Multiple Elliptical-Holes and Cracks Under Far-Field and Arbitrary Surface Stresses. Adv. Appl. Math. Mech. 2022, 14, 125–154. [Google Scholar] [CrossRef]
- Ma, T.R.; Ma, D.P.; Yang, Y.J. Fractal Characteristics of Coal and Sandstone Failure under Different Unloading Confining Pressure Tests. Adv. Mater. Sci. Eng. 2020, 2020, 2185492. [Google Scholar] [CrossRef] [Green Version]
- Yang, R.; Ma, D.P.; Yang, Y.J. Experimental Investigation of Energy Evolution in Sandstone Failure during Triaxial Unloading Confining Pressure Tests. Adv. Civ. Eng. 2019, 2019, 7419752. [Google Scholar] [CrossRef] [Green Version]
- Wang, X.X.; Ma, W.J.; Huang, J.W.; Liao, Z.Y. Mechanical properties of sandstone under loading and unloading Conditions. In Proceedings of the 3rd International Conference on Materials Science and Engineering (ICMSE 2014), Jiujiang, China, 24–26 January 2014; pp. 441–446. [Google Scholar]
- Chen, X.J.; Li, L.Y.; Wang, L.; Qi, L.L. The current situation and prevention and control countermeasures for typical dynamic disasters in kilometer-deep mines in China. Saf. Sci. 2019, 115, 229–236. [Google Scholar] [CrossRef]
- Liu, X.-R.; Liu, J.; Li, D.-L.; He, C.-M.; Wang, Z.-J.; Xie, Y.-K. Experimental research on the effect of different initial unloading levels on mechanical properties of deep-buried sandstone. Rock Soil Mech. 2017, 38, 3081–3088. [Google Scholar] [CrossRef]
- Dong, X.H.; Yang, G.S.; Tian, J.F.; Rong, T.L.; Jia, H.L.; Liu, H. Characteristics of deformation properties of frozen sandstone under lateral unloading condition. Rock Soil Mech. 2018, 39, 2518–2526. [Google Scholar] [CrossRef]
- Xue, J.H.; Du, X.H.; Ma, Q.; Zhan, K.L. Experimental study on law of limit storage energy of rock under different confining pressures. Arab. J. Geosci 2021, 14, 62. [Google Scholar] [CrossRef]
- Qiu, S.; Feng, X.; Zhang, C.Q.; Zhou, H.; Sun, F. Experimental research on mechanical properties of deep-buried marble under different unloading rates of confining pressures. Chin. J. Rock Mech. Eng. 2010, 29, 1807–1817. [Google Scholar]
- Li, X.; Zhao, H.; Wang, B.; Xiao, T. Mechanical properties of deep-buried marble material under loading and unloading tests. J. Wuhan Univ. Technol. Mater. Sci. Ed. 2013, 28, 514–520. [Google Scholar] [CrossRef]
- Wang, C.S.; Zhou, H.W.; He, S.S.; Wang, Z.H.; Liu, J.F. Effect of unloading rates on strength of Beishan granite. Rock Soil Mech. 2017, 38, 151–157. [Google Scholar] [CrossRef]
- Wang, C.; Liu, J.; Chen, L.; Liu, J.; Wang, L. Mechanical behaviour and damage evolution of Beishan granite considering the transient and time-dependent effects of excavation unloading. Eur. J. Environ. Civ. Eng. 2020, 1–17. [Google Scholar] [CrossRef]
- Peng, C.; Wang, J.; Liu, H.; Li, G.; Zhao, W. Investigating the Macro-Micromechanical Properties and Failure Law of Granite under Loading and Unloading Conditions. Adv. Civ. Eng. 2021, 2021, 9983427. [Google Scholar] [CrossRef]
- Huang, X.; Liu, Q.S.; Liu, B.; Liu, X.W.; Pan, Y.C.; Liu, J.P. Experimental Study on the Dilatancy and Fracturing Behavior of Soft Rock Under Unloading Conditions. Int. J. Civ. Eng. 2017, 15, 921–948. [Google Scholar] [CrossRef]
- Xu, X.; Huang, R.; Li, H.; Huang, Q. Determination of Poisson’s Ratio of Rock Material by Changing Axial Stress and Unloading Lateral Stress Test. Rock Mech. Rock Eng. 2015, 48, 853–857. [Google Scholar] [CrossRef]
- Ren, Q.Y.; Zhang, H.M.; Liu, J.S. Rheological properties of mudstone under two unloading paths in experiments. Rock Soil Mech. 2019, 40, 127–134. [Google Scholar] [CrossRef]
- Ulusay, R. The ISRM Suggested Methods for Rock Characterization, Testing and Monitoring: 2007–2014; Springer International Publishing: Berlin, Germany, 2014. [Google Scholar]
- Vermeer, P.A.; De Borst, R. Non-associated plasticity for soils, concrete and rock. HERON 1984, 29, 3–64. [Google Scholar]
- Liu, Z.; Ma, C.; Wei, X.A.; Xie, W. Experimental Study on the Mechanical Characteristics of Single-Fissure Sandstone Under Triaxial Extension. Rock Mech. Rock Eng. 2022, 2020, 9374352. [Google Scholar] [CrossRef]
- Srinivasan, V.; Gupta, T.; Ansari, T.A.; Singh, T.N. An experimental study on rock damage and its influence in rock stress memory in a metamorphic rock. Bull. Eng. Geol. Environ. 2020, 79, 4335–4348. [Google Scholar] [CrossRef]
Figure 1.
Geographical location and microstructure of the specimens: (a) specimens; (b) SEM image.

Figure 2.
Test machine and scheme: (a) MTS815 test machine; (b) unloading paths.

Figure 3.
Stress−strain curves of saturated granite under a conventical triaxial unloading test with different vu: (a−d) va = 0.06 mm/min; (e−h) va = 0.6 mm/min; (i−l) va = 6 mm/min.
Figure 3.
Stress−strain curves of saturated granite under a conventical triaxial unloading test with different vu: (a−d) va = 0.06 mm/min; (e−h) va = 0.6 mm/min; (i−l) va = 6 mm/min.

Figure 4.
σ1–σ3 curves of saturated granite during an unloading test.

Figure 5.
Strain difference between failure point and unloading point of saturated granite during a conventional triaxial unloading test: (a) circumferential strain difference; (b) volume strain difference.
Figure 5.
Strain difference between failure point and unloading point of saturated granite during a conventional triaxial unloading test: (a) circumferential strain difference; (b) volume strain difference.

Figure 6.
The evolution of the dilatancy angle ψ under triaxial unloading tests: (a) va = 0.06 mm/min; (b) va = 0.6 mm/min; (c) va = 6 mm/min.
Figure 6.
The evolution of the dilatancy angle ψ under triaxial unloading tests: (a) va = 0.06 mm/min; (b) va = 0.6 mm/min; (c) va = 6 mm/min.


Figure 7.
Energy variation under a triaxial compression test with different unloading rates: (a–d) axial loading rate 0.06 mm/min; (e–h) axial loading rate 0.6 mm/min; (i–l) axial loading rate 6 mm/min.
Figure 7.
Energy variation under a triaxial compression test with different unloading rates: (a–d) axial loading rate 0.06 mm/min; (e–h) axial loading rate 0.6 mm/min; (i–l) axial loading rate 6 mm/min.

Figure 8.
Energy variation at different loading rates and different unloading rates: (a) axial loading rate 0.06 mm/min; (b) axial loading rate 0.6 mm/min; (c) axial loading rate 6 mm/min.
Figure 8.
Energy variation at different loading rates and different unloading rates: (a) axial loading rate 0.06 mm/min; (b) axial loading rate 0.6 mm/min; (c) axial loading rate 6 mm/min.

Figure 9.
Failure patterns of saturated granite specimens under a conventional triaxial unloading test with different unloading rates.
Figure 9.
Failure patterns of saturated granite specimens under a conventional triaxial unloading test with different unloading rates.

Figure 10.
Damage evolution process.

Table 2.
Conventional triaxial loading and unloading test scheme.
| Test Scheme | Specimen Number | Initial Confining Pressure (MPa) | Axial Loading Rate | Unloading Rate of σ3 |
|---|---|---|---|---|
| Group-I | TC-0 | 0 | 0.12 mm/min | - |
| TC-10 | 10 | - | ||
| TC-30 | 30 | - | ||
| TC-50 | 50 | - | ||
| Group-II | G-0.06-X * | 50 | 0.06 mm/min | 0.1 MPa/s, 1 MPa/s, 5 MPa/s, 10 MPa/s |
| G-0.6-X | 50 | 0.6 mm/min | ||
| G-6-X | 50 | 6 mm/min |
* X is the value of the axial loading rate.
Table 3.
Saturated granite’s physical and mechanical parameters under conventional triaxial loading and unloading tests.
Table 3.
Saturated granite’s physical and mechanical parameters under conventional triaxial loading and unloading tests.
| Test Scheme | Specimen No. | Dry Density (kg/m3) | Saturated Density (kg/m3) | σ30 (MPa) | σ3f (MPa) | σ1f (MPa) | E (GPa) | ν |
|---|---|---|---|---|---|---|---|---|
| Group I | TC-0 | 2637.49 | 2644.55 | 0 | 0 | 104.93 | 43.04 | 0.10 |
| TC-10 | 2631.32 | 2637.24 | 10 | 10 | 202.99 | 42.67 | 0.10 | |
| TC-30 | 2635.72 | 2641.16 | 30 | 30 | 361.84 | 53.96 | 0.11 | |
| TC-50 | 2635.67 | 2639.43 | 50 | 50 | 480.32 | 50.57 | 0.12 | |
| Group II | G-0.06-0.1 | 2635.13 | 2638.36 | 50 | 34.42 | 390.08 | 51.4 | 0.10 |
| G-0.06-1 | 2637.42 | 2641.45 | 50 | 25.53 | 358.82 | 58.04 | 0.28 | |
| G-0.06-5 | 2635.50 | 2641.38 | 50 | 21.06 | 361.00 | 51.71 | 0.11 | |
| G-0.06-10 | 2638.97 | 2643.01 | 50 | 18.77 | 354.14 | 62.64 | 0.18 | |
| G-0.6-0.1 | 2632.97 | 2637.00 | 50 | 44.48 | 470.63 | 58.39 | 0.17 | |
| G-0.6-1 | 2651.75 | 2655.78 | 50 | 28.83 | 398.89 | 59.08 | 0.23 | |
| G-0.6-5 | 2638.89 | 2642.93 | 50 | 21.81 | 378.21 | 59.03 | 0.21 | |
| G-0.6-10 | 2636.85 | 2640.88 | 50 | 23.47 | 384.67 | 56.05 | 0.20 | |
| G-6-0.1 | 2632.28 | 2636.32 | 50 | 49.31 | 508.61 | 60.45 | 0.24 | |
| G-6-1 | 2602.96 | 2606.98 | 50 | 43.97 | 465.05 | 56.32 | 0.18 | |
| G-6-5 | 2620.01 | 2624.07 | 50 | 32.07 | 400.16 | 62.90 | 0.18 | |
| G-6-10 | 2592.90 | 2596.95 | 50 | 27.74 | 412.31 | 53.09 | 0.26 |
Table 4.
Strains at the unloading point and the failure point of saturated granite specimens.
| Specimen No. | σ30 (MPa) | Unloading Point | Failure Point | Δεvf (×10−3) | ||||
|---|---|---|---|---|---|---|---|---|
| εa0 (×10−3) | εc0 (×10−3) | εv0 (×10−3) | εaf (×10−3) | εcf (×10−3) | εvf (×10−3) | |||
| TC-0 | 0 | 2.19 | −0.14 | 1.91 | 2.92 | −2.43 | −1.94 | −3.85 |
| TC-10 | 10 | 3.55 | −0.49 | 2.57 | 4.53 | −2.81 | −1.09 | −3.66 |
| TC-30 | 30 | 5.17 | −0.97 | 3.23 | 7.38 | −3.70 | −0.02 | −3.25 |
| TC-50 | 50 | 8.16 | −1.84 | 4.48 | 10.24 | −3.91 | 2.42 | −2.06 |
| G-0.06-0.1 | 50 | 7.14 | −1.22 | 4.70 | 9.06 | −4.55 | −0.05 | −4.75 |
| G-0.06-1 | 6.26 | −2.30 | 1.67 | 6.89 | −9.75 | −12.60 | −14.27 | |
| G-0.06-5 | 7.07 | −1.28 | 4.51 | 9.88 | −5.49 | −1.09 | −5.60 | |
| G-0.06-10 | 6.12 | −1.24 | 3.64 | 6.67 | −5.66 | −4.65 | −8.29 | |
| G-0.6-0.1 | 50 | 6.55 | −2.24 | 2.07 | 9.90 | −8.39 | −6.88 | −8.95 |
| G-0.6-1 | 6.56 | −2.07 | 2.42 | 8.43 | −9.84 | −11.25 | −13.67 | |
| G-0.6-5 | 6.53 | −2.04 | 2.46 | 7.94 | −7.16 | −6.37 | −8.83 | |
| G-0.6-10 | 6.78 | −3.86 | −0.94 | 7.34 | −6.44 | −5.53 | −4.59 | |
| G-6-0.1 | 50 | 6.46 | −1.99 | 2.49 | 9.85 | −7.35 | −4.84 | −7.33 |
| G-6-1 | 6.74 | −1.95 | 2.85 | 10.59 | −10.05 | −9.50 | −12.35 | |
| G-6-5 | 6.19 | −2.25 | 1.68 | 7.20 | −11.92 | −16.63 | −18.31 | |
| G-6-10 | 7.23 | −1.43 | 4.38 | 9.15 | −4.12 | 0.91 | −3.47 | |
Table 5.
Energy under conventional triaxial loading and unloading test (unit: MJ/m3).
| Specimen No. | σ30 (MPa) | Unloading Point | Failure Point | ||||||||
|---|---|---|---|---|---|---|---|---|---|---|---|
| Ua0 | Uc0 | U0 | Ue0 | Ud0 | Uaf | Ucf | Uf | Uef | Udf | ||
| TC-0 | 0 | - | - | - | - | - | 0.16 | - | - | 0.13 | 0.03 |
| TC-10 | 10 | - | - | - | - | - | 0.91 | 0.03 | 0.94 | 0.55 | 0.39 |
| TC-30 | 30 | - | - | - | - | - | 2.55 | 0.14 | 2.70 | 1.74 | 0.95 |
| TC-50 | 50 | - | - | - | - | - | 4.88 | 0.24 | 5.11 | 3.35 | 1.77 |
| G-0.06-0.1 | 50 | 1.66 | −0.06 | 1.60 | 1.32 | 0.28 | 2.44 | −0.19 | 2.25 | 1.47 | 0.79 |
| G-0.06-1 | 1.43 | −0.11 | 1.32 | 1.02 | 0.29 | 1.68 | −0.34 | 1.34 | 0.73 | 0.60 | |
| G-0.06-5 | 1.63 | −0.06 | 1.56 | 1.30 | 0.26 | 2.69 | −0.17 | 2.51 | 1.56 | 0.96 | |
| G-0.06-10 | 1.46 | −0.06 | 1.39 | 1.11 | 0.28 | 1.67 | −0.16 | 1.50 | 0.97 | 0.53 | |
| G-0.6-0.1 | 50 | 1.53 | −0.11 | 1.42 | 1.08 | 0.34 | 3.02 | −0.40 | 2.62 | 1.59 | 1.53 |
| G-0.6-1 | 1.51 | −0.10 | 1.40 | 1.11 | 0.30 | 2.27 | −0.37 | 1.90 | 1.11 | 1.51 | |
| G-0.6-5 | 1.53 | −0.10 | 1.43 | 1.10 | 0.32 | 2.08 | −0.24 | 1.84 | 1.19 | 1.53 | |
| G-0.6-10 | 1.57 | −0.19 | 1.37 | 0.96 | 0.41 | 1.79 | −0.26 | 1.52 | 1.11 | 1.57 | |
| G-6-0.1 | 50 | 1.51 | −0.10 | 1.41 | −0.34 | 1.74 | 3.07 | −0.36 | 2.71 | −1.34 | 1.51 |
| G-6-1 | 1.57 | −0.10 | 1.47 | 1.16 | 0.31 | 3.31 | −0.46 | 2.85 | 1.58 | 1.57 | |
| G-6-5 | 1.44 | −0.11 | 1.33 | 1.01 | 0.32 | 1.90 | −0.45 | 1.45 | 0.67 | 1.44 | |
| G-6-10 | 1.69 | −0.07 | 1.62 | 1.32 | 0.30 | 2.49 | −0.16 | 2.33 | 1.67 | 1.69 | |
Publisher’s Note: MDPI stays neutral with regard to jurisdictional claims in published maps and institutional affiliations. |
© 2022 by the authors. Licensee MDPI, Basel, Switzerland. This article is an open access article distributed under the terms and conditions of the Creative Commons Attribution (CC BY) license (https://creativecommons.org/licenses/by/4.0/).
Share and Cite
MDPI and ACS Style
Liu, Z.; Yi, W. Experimental Study on the Mechanical Characteristics of Saturated Granite under Conventional Triaxial Loading and Unloading Tests. Sustainability 2022, 14, 5445. https://0-doi-org.brum.beds.ac.uk/10.3390/su14095445
AMA Style
Liu Z, Yi W. Experimental Study on the Mechanical Characteristics of Saturated Granite under Conventional Triaxial Loading and Unloading Tests. Sustainability. 2022; 14(9):5445. https://0-doi-org.brum.beds.ac.uk/10.3390/su14095445
Chicago/Turabian StyleLiu, Zelin, and Wei Yi. 2022. "Experimental Study on the Mechanical Characteristics of Saturated Granite under Conventional Triaxial Loading and Unloading Tests" Sustainability 14, no. 9: 5445. https://0-doi-org.brum.beds.ac.uk/10.3390/su14095445
Note that from the first issue of 2016, this journal uses article numbers instead of page numbers. See further details here.