
Empty Pallet Allocation Optimization in Shipbuilding Using a Pallet Pool System

School of Transportation and Logistics Engineering, Wuhan University of Technology, Wuhan 430063, China
*
Author to whom correspondence should be addressed.
Sustainability 2022, 14(9), 5479; https://0-doi-org.brum.beds.ac.uk/10.3390/su14095479
Submission received: 31 March 2022
/
Revised: 23 April 2022
/
Accepted: 29 April 2022
/
Published: 3 May 2022
(This article belongs to the Special Issue Circular Economy for Sustainable Manufacturing)
Abstract
:Pallets are an important transportation tool in modern shipbuilding. With shipbuilding now trending towards larger ships, empty pallet allocation needs to meet the demands of having low costs and being sustainable for green shipbuilding. Thus, with the development of a pallet pool system, a new shipbuilding empty pallet pool allocation (SEPPA) pattern is proposed in this study. An integrated framework is developed that combines a mathematical planning model for a SEPPA pattern with a green allocation strategy. For the base case, the operation costs of the traditional shipbuilding empty pallet allocation (TSEPA) pattern and the SEPPA pattern are solved by applying an improved genetic algorithm for different pallet supply and demand situations. The results show that the SEPPA pattern is more cost-efficient than the TSEPA pattern. With increasing imbalances between supply and demand, the operation costs of the SEPPA pattern are lower than that of the TSEPA pattern. In general, the distribution of supply and demand will affect operation costs. Reasonable safety inventory intervals can reduce the operation costs of empty pallet allocation. This research may support decision making by shipbuilding pallet managers as they seek to minimize the costs of their pallet operations, by adopting practices and adapting strategies for their specific conditions.
1. Introduction
Pallets are important components of global supply chains, and one of the most commonly utilized returnable transport items (RTIs), transporting over 80% of all global trade items [1]. Pallets are important supply chain assets because they have significant environmental and economic implications over their entire life cycle [2].
The shipbuilding industry is an intensive manufacturing industry that integrates labor, capital, and technology. In the ship manufacturing process, there are also several problems, such as keeping neat and tidy shipbuilding sites, and the waste of resources. Therefore, it is necessary for the shipbuilding industry to promote green shipbuilding technologies [3]. An effective optimization scheduling method can improve economic benefits, achieve energy conservation, emission reduction, consumption reduction, cost reduction, and reduce environmental impacts [4]. In recent research on scheduling optimization problems, Guo [5] established the green blocking flowline scheduling problem model for panel block (GBFSP) in shipbuilding. A green vehicle routing and scheduling problem model with soft time windows for steel distribution in shipbuilding was proposed [6]. Some of the scheduling optimization problems have been studied, but the empty pallet allocation problem is rarely mentioned, which is one of the scheduling optimization problems in shipbuilding.
The empty pallet allocation problem in shipbuilding can be defined as follows. Pallets are an important tool for the transfer of materials during ship construction. Within the shipyard, construction materials are essentially transported to each shop on pallets [7]. If there are not enough pallets in stock, pallets are obtained from the pallets supply center outside the shipyard to complete the transportation of materials during the ship construction process. Therefore, the problem of empty pallet allocation arises. With shipbuilding now trending towards larger ships [8], increasing amounts of materials need to be carried out with pallets within shipyards. More materials result in more empty pallets during operation. Based on this problem, the shipbuilding empty pallet allocation problem needs to be studied.
The empty pallet allocation problem is a brand-new research field [9]. Some literature on the empty pallet allocation problem studied the field of railway pallet allocation [10], and pallet allocation in urban logistics [11]. However, there are few studies discussing the pallet allocation problem in shipyards. In recent research, Ren proposed an optimization model for fleet sizing and empty pallet allocation, considering CO2 emissions [12]. However, this study stands from the perspective of the pallet rental company managers, and not of the manufacturing companies. Roy [13] developed a two-stage integrated framework for a pallets management pattern that combines cost relationship models. However, this study does not address the shipbuilding pallet operation process. Tailored software incorporating a geographic information system (GIS) and routing functionalities is used to quantify the logistical and environmental impacts generated by pallet distribution activities [14]. However, the data of national large retailers used in this study are of little significance to pallet allocation in ship construction.
At present, pallet allocation patterns are generally divided into three modes: transfer of ownership, pallet exchange, and pallet pooling, of which the pallet pool system is currently the most popular and environmentally friendly pattern [12,15]. Different allocation patterns can produce different economic and environmental outcomes in the pallet allocation process. It becomes critical to understand the environmental impacts of all aspects of shipbuilding logistical operations [16], as shipbuilding companies place increasing emphasis on green shipbuilding.
Therefore, aiming at the optimization of empty pallets allocation in green shipbuilding, this study firstly constructs a new empty pallet allocation pattern on the basis of the traditional ship construction pallet allocation pattern, and proposes a green allocation strategy for this new empty pallet allocation pattern. Secondly, the mathematical planning model for the optimization of shipbuilding empty pallet pool allocation pattern is established. Thirdly, an improved genetic algorithm is designed, and a case study is conducted to compare operation costs between the new empty pallet allocation pattern, and the traditional empty pallet allocation pattern. Finally, we conduct a sensitivity analysis for the SEPPA pattern.
The remaining content of this study is as follows. The second section is the literature review. The third section is the shipbuilding empty pallet pool allocation pattern construction, which introduces the pallet pool system into the pallet management pattern in shipbuilding, based on the traditional shipbuilding pallet allocation pattern. The fourth section is research methods, which constructs the mathematical planning model for the optimization of the shipbuilding empty pallet pool allocation pattern. Then, we propose the empty pallet allocation green strategy. The fifth section is the case analysis referring to realistic data from a shipyard. The sixth section calculates the operation costs. The seventh section is the discussion which compares operation costs between the SEPPA pattern and the TSEPA pattern. This section also analyses the sensitivity, including the impact of pallet safety inventory on operation costs, and the impact of supply–demand imbalance on operation costs. The seventh section is the conclusion, which summarizes and puts forward the limitations of the research.
2. Literature Review
This section reviews some background research and the related research articles, including the application of pallet pool systems, shipbuilding transportation scheduling optimization, and pallet allocation methods.
A pallet pool system is a system where an organization (company or national agency or industry consortium) establishes a pallet operation center in each region to distribute, maintain, and collect pallets; the system also allocates where companies that need pallets can rent the required number of pallets from the nearest pallet operation center and return the empty pallets to the nearest pallet operation center after unloading the goods [17]. Pallet pool systems have been commonly established throughout the world, such as CHEP Company, CPC (The Canadian Pallet Council, Cobourg, ON, Canada), and EPAL (The European Pallet Association, Dusseldorf, Germany). The application of pallet pool systems has been studied by some scholars. Xu et al. [18] proposed an optimal management strategy for pallet pool systems in the supply chain environment. RFID technology was applied to information management in pallet pool systems [19]. However, few studies have applied pallet pool systems to pallet management in ship construction.
Shipbuilding transportation scheduling optimization problems have been extensively investigated by researchers in such fields as industrial engineering and management science. In the field of ship production scheduling, more research is focused on the block scheduling problem. A hybrid optimization algorithm was proposed for solving a block transportation problem when multiple transporters are used [20]. In the study of block scheduling in shipbuilding, a heuristic spatial scheduling model was established based on the investigation to minimize makespan in shipbuilding [21]. Kim et al. [22] proposed a mathematical model considering the sequence policy of transporters in order to minimize the weighted sum of empty transporter travel times, delay times, and tardy times, and an ant colony optimization algorithm with random selection was proposed. With respect to the block schedule in a shipbuilding enterprise, a branch and bound algorithm was proposed for the spatial resource constrained project scheduling problem [23]. Wang et al. [24] transformed the block transportation problem into the classical traveling salesman problem and assignment problem, with the solution of a heuristic algorithm based on the greedy algorithm. However, the pallet allocation problem in shipbuilding has been little studied, as pallet allocation is an important part of transportation problems in shipbuilding. In the study of pallet management in shipbuilding, Lin [25] put forward a dual-pallet management model for ship tube processing workshops, and set up a production logistics system for tube processing workshops based on three aspects: production process optimization, facility layout planning, and storage and handling tools optimization. Yang [26] proposed the idea of running a lean pallet set distribution based on FSD/WSD in the total section, and on the operation idea of lean pallet set distribution management in the dockyard loading stage. We also found that ship construction pallet management research is more concerned with management models and management ideas. There is little research that introduces the pallet pool system into shipbuilding empty pallet allocation.
By further summarizing the literature related to pallet allocation models in methodology, Ren et al. [27] proposed a single-type pallet allocation model which only included the constraint of the stochastic transportation capacity when only demand is deterministic. Ren et al. [28] proposed a single-type pallet allocation model which included the constraints of a deterministic inventory capacity, stochastic transportation, and loading and unloading capacity when supply and demand are also stochastic. Ren et al. [29] proposed a multi-type pallet allocation model with truckload limits that included the uncertain constraints of the inventory capacity, loading and unloading capacity, transportation capacity, and damage rate when supply and demand are also uncertain. Zhou et al. [30] proposed a multi-type pallet allocation model that included the constraints of the deterministic transportation capacity when supply and demand are deterministic. Ni et al. [31] proposed a single-type pallet allocation model when supply and demand are stochastic, using the method of the genetic algorithm. Zhou et al. [32] proposed a single-type pallet allocation model with multi-type transportation that included the constraints of a deterministic transportation capacity when supply and demand are deterministic. Zhou et al. [33] proposed a single-type pallet allocation model that included the constraints of a deterministic loading and unloading capacity when supply and demand are deterministic, and then solved the problem with an immune clonal algorithm. We can find the following key points:
- The goals of the pallet allocation models are all intended to reduce total cost.
- The majority of studies have only looked into specific types of pallets.
- Demand, supply, inventory capacity, transportation capacity, and loading and unloading capacity are all restrictions in those models.
- Most literature cites the use of a single kind of transportation mode.
- Both intelligent algorithms (immune clone algorithm and genetic algorithm) and mathematical programming calculation software (Lingo and Cplex) can calculate the optimization results.
Therefore, in this study we propose a shipbuilding empty pallet pool allocation model (SEPPAM) with the goal of reducing the total costs, which include the transportation cost, inventory cost, handling cost, and the shortage cost. The constraints in the SEPPAM include demand, supply, damage rate, inventory capacity, and transportation capacity in this study. In addition, we consider two kinds of pallets, those of which are widely used in shipbuilding. Only vehicle transportation is considered in our shipbuilding pallet pool allocation model. Finally, we use the Elitist Genetic Algorithm to calculate the optimization results using PYTHON.
3. Shipbuilding Empty Pallet Allocation Pattern Analysis
3.1. TSEPA Pattern Analysis
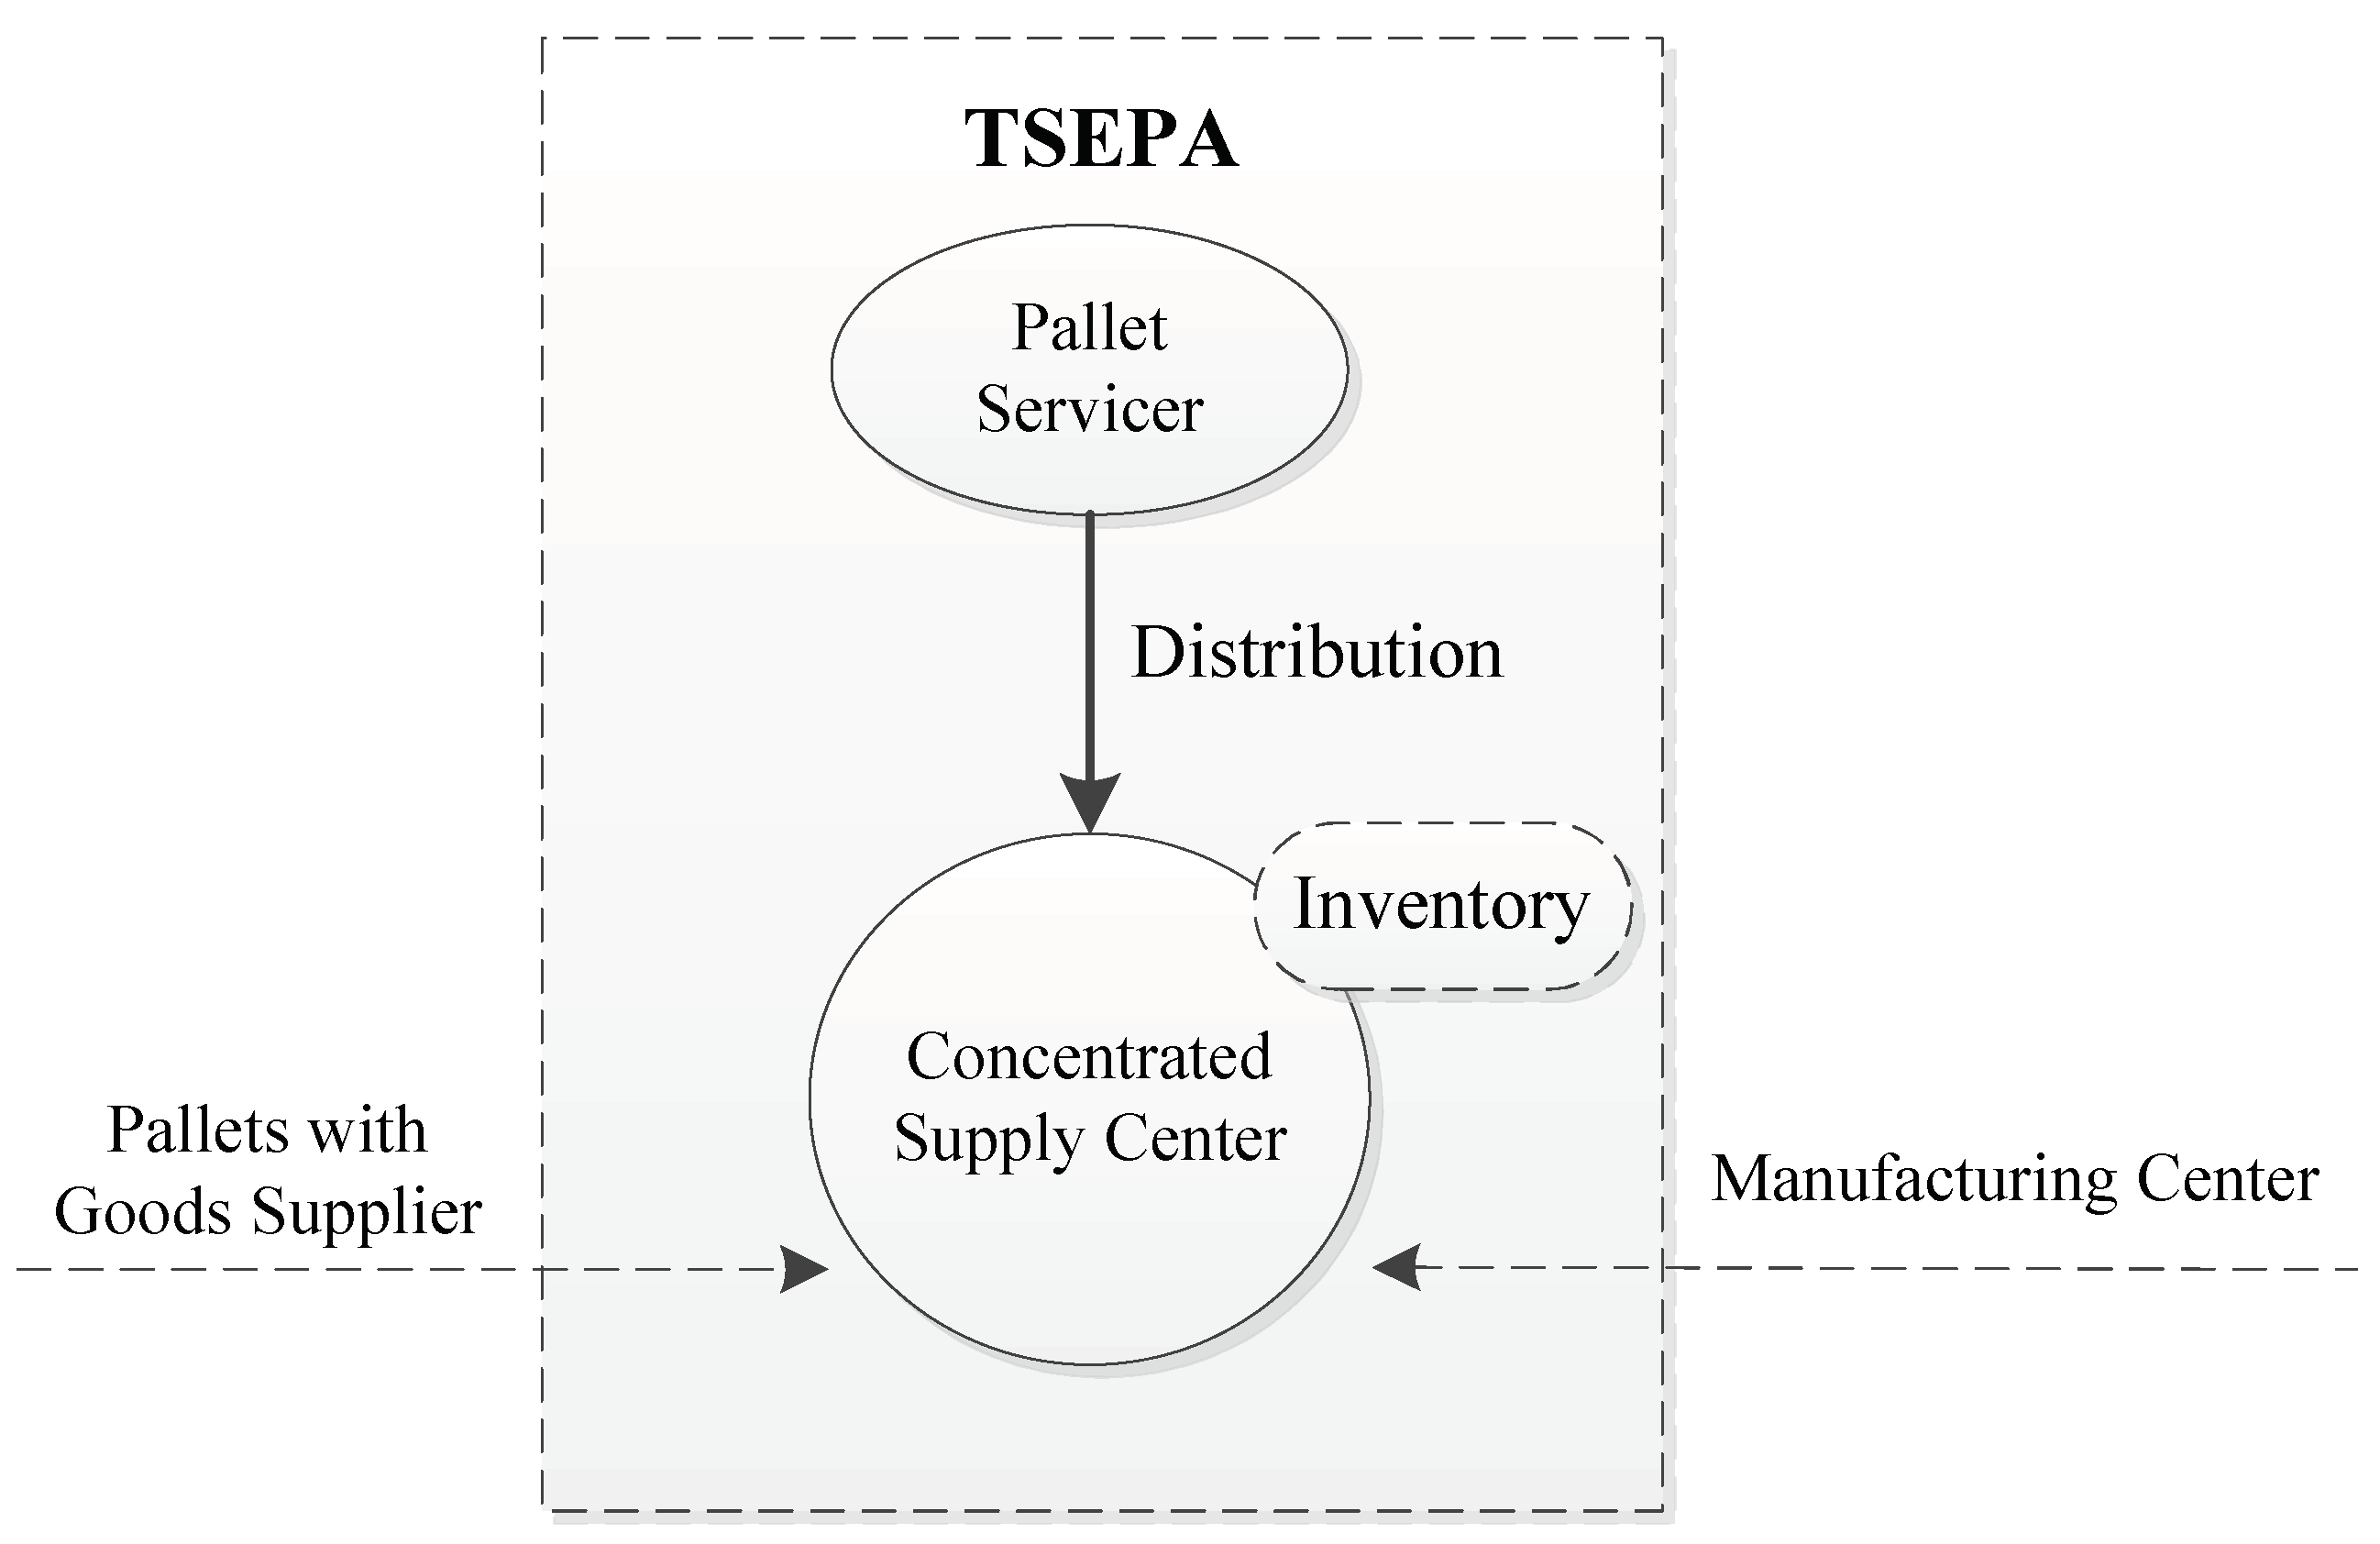
Currently, a traditional shipbuilding empty pallet allocation (TSEPA) pattern is often used in shipyards, i.e., the distribution-inventory pattern. This pattern is close to an open-loop system with no salvage value (single-use expendable pallet system) [13]. In this pattern, the empty pallets are transported to the shipyard. The pallets are stored in the shipyard until they are disposed. Pallets flow in a TSEPA as shown in Figure 1. In a TSEPA pattern, shipyard concern focuses on the number of pallets entering the concentrated supply center, and the number of pallets shipped out of the center. When the quantity of pallets delivered from the concentrated supply center to the manufacturing center is smaller than the quantity of pallets shipped to the concentrated supply center by the supplier, there is no need to gain pallets from the empty pallet supplier; when the quantity of pallets delivered from the concentrated supply center to the manufacturing center is larger than the quantity of pallets shipped to the concentrated supply center by the supplier, more pallets are necessary from the empty pallet supplier, and the excess pallets are stored in the shipyard’s internal warehouse.
3.2. Introductions of Pallet Pool Systems
From shipyard field research, we found that the TSEPA pattern has its drawbacks, mainly in the following two aspects:
- The concentrated supply center only judges whether pallets are needed based on the inventory quantity of pallets; once the inventory quantity cannot meet the existing ship production demand, it must wait for the supply of empty pallets to maintain pallet distribution, which cannot meet the inventory demand, and even more cannot meet ship lean production requirements.
- As the empty pallets in a shipyard cannot be processed in a timely manner, the accumulated pallet inventory becomes too large, which increases the burden of pallet inventory and increases the risk of pallet damage; these factors result in increased inventory costs and pallet damage costs as a result of improper management.
With the development of large-scale ship construction, there are increasing amounts of construction materials within shipyards. This results in more pallets being used in the ship production process. Poor punctuality of distribution times and inefficient storage of pallets will become increasingly apparent. Therefore, it is particularly important for shipbuilding to find a pattern that can effectively utilize pallets and reduce empty pallet allocation costs. This pattern needs to address the following issues of pallet management for shipbuilding:
- A way to control the inventory of empty pallets in the face of different arrival times and avoid an excess number of pallets occupying warehouse capacity.
- A way to recycle pallets and control the cost of acquiring empty pallets.
- A way to face the uncertainty between the pallets shipped by suppliers and the pallets needed by the production department to ensure that there are enough empty pallets for cargo handling and distribution to meet production needs.
Pallet pool systems have been commonly established throughout the world. The pallet pool system (PPS) has many benefits which cover operation costs of the enterprise, and mainly include economic benefits for transportation costs, loading and unloading, inventory costs, etc. The development of pallet pooling has proven to be beneficial to both enterprises and society [34]. PLUS (Pallet Handling System) is critical to the United States [35], which reflects benefits to society. Some studies show the benefits to enterprises. Insufficient development of pallet pool systems is one of the reasons for high logistical costs [36]. Pallet pooling can help companies save costs, especially by enhancing the efficiency of warehousing and transportation [37]. In the case of CHEP, a pallet pool system was proved to be an excellent way to save costs [38]. The introduction motivation of pallet pool systems is mainly reflected in the following two aspects:
- The pallets used in shipping enterprises will be recycled to the pallet service center. The pallet pool system may increase pallet circulation capacity, reduce the number of pallets provided by ship enterprises for inventory, reduce inputs, and avoid the trouble caused by stacking empty pallets, etc.
- There is unified allocation from the perspective of the optimal overall situation of the shipbuilding enterprise, reducing operation costs, speeding up the circulation of pallets and improving efficiency.
3.3. SEPPA Pattern Analysis
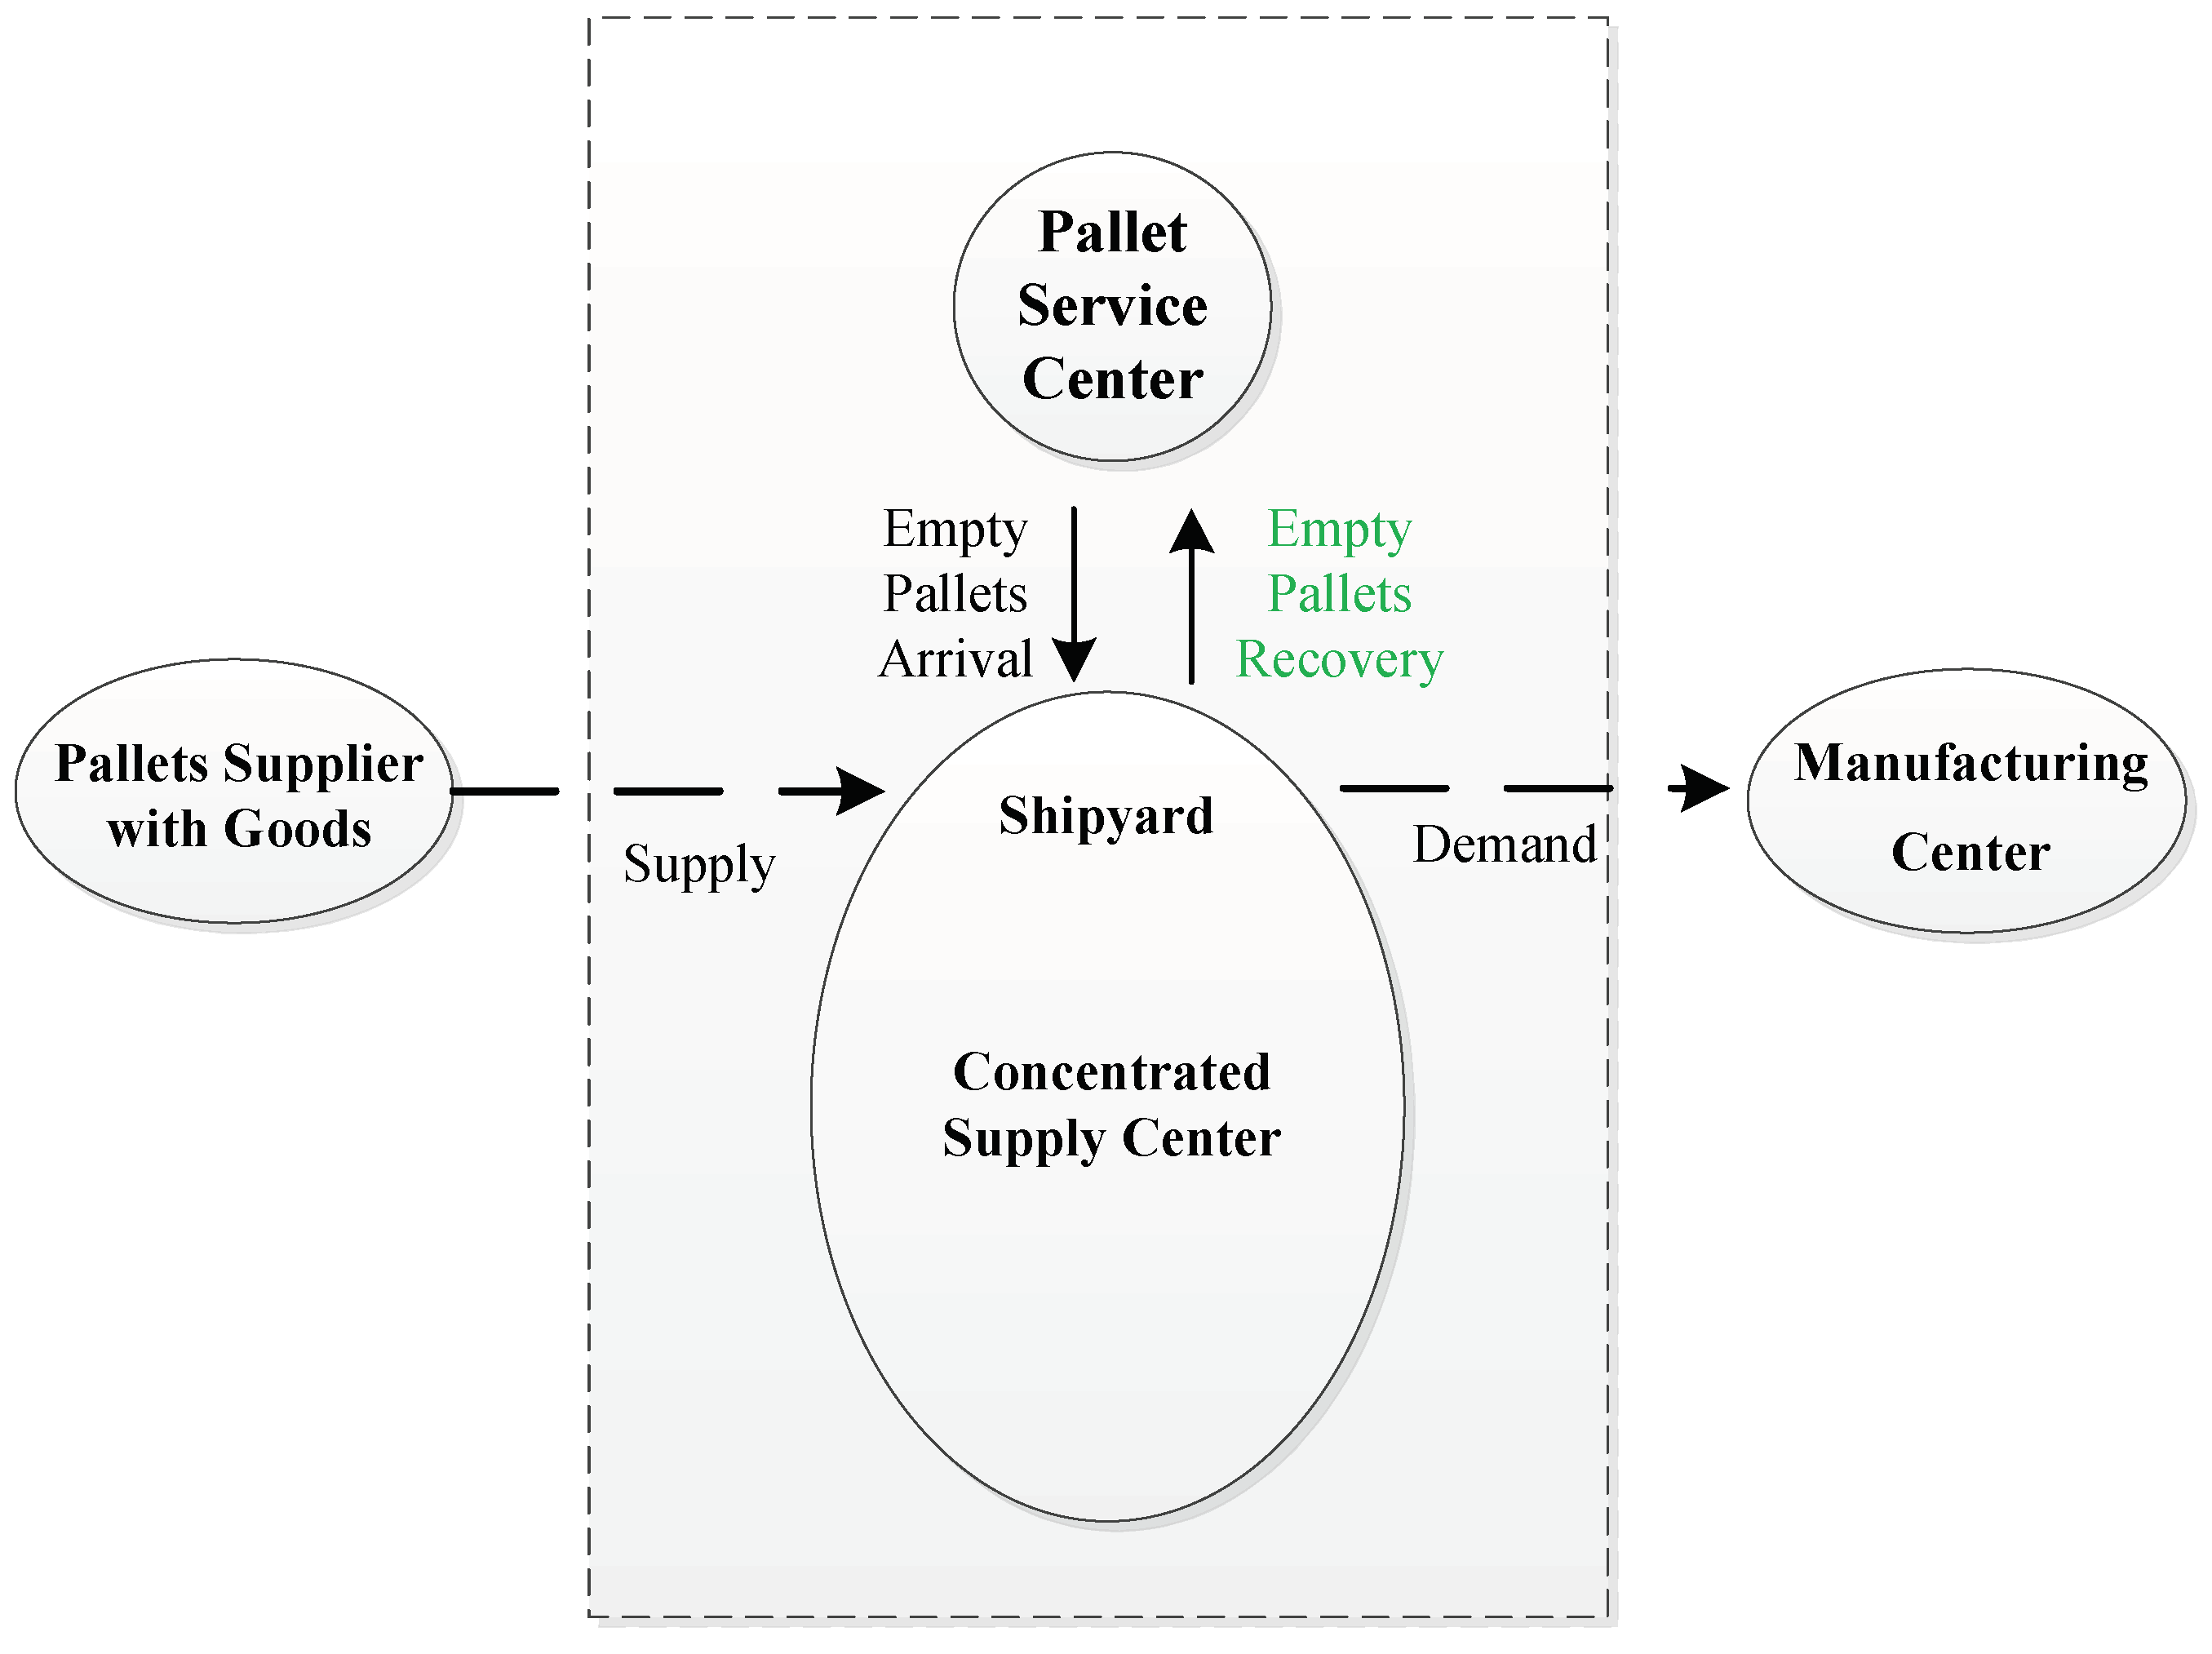
The advantages of the pallet pool system may compensate for the disadvantages of the TSEPA pattern, so we introduce the pool system into the shipbuilding pallet allocation pattern. Pallet flow in the SEPPA pattern is shown in Figure 2. The SEPPA pattern translates the pallet volume of production planning and pallet installation in the production process into the supply and demand considerations in the pallet pool system, highlights the combination of pallet use and recycling in the pallet pool system, and builds a pallet pool system with lease and recycling for empty pallets. With these differences from TSEPA, more empty pallets will be recycled to the pallet service center to reduce the pressure on the empty pallet inventory of the shipyard.
In this system, the construction material is transported by the supplier to the shipyard’s concentrated supply center in the form of pallets, prior to which the supplier gains empty pallets from the regional pallet service center. The shipyard’s concentrated supply center is an integrated concept consisting of several warehouses where pallets are dispatched from the concentrated supply center. The concentrated supply center transports the pallets with goods to the manufacturing center, while the empty pallets from the manufacturing center are recycled to the concentrated supply center. The distribution of pallets with goods is from the supplier to the concentrated supply center, and finally to the manufacturing center, and supply and demand considerations exist in the concentrated supply center in every period.
The source of empty pallets is the regional pallet service center near the shipyard, and the empty pallets are circulated from the regional pallet service center to the concentrated supply center. At the same time, if the number of pallets in the concentrated supply center is excessive, there is a logistical activity of pallet recycling between the concentrated supply center and the regional pallet service center. During the distribution process carried out in shipyards, broken pallets are generated at the end of each period.
4. Methods
4.1. Problem Description
The SEPPA problem can be defined as follows: there is a known concentrated supply center in a shipyard which has a warehouse for empty pallets. The concentrated supply center will set a safety inventory. The concentrated supply center shares empty demand information with pallet service centers. Two sizes of wooden pallets are transported from the pallet service center to the concentrated supply center, then empty pallets are transported from the concentrated supply center back to the pallet service center. The empty demand quantities of the concentrated supply center in each period are known, and empty pallets supply quantities of each pallet service center are known. The only means of transporting empty pallets is by vehicles. Empty pallets can be damaged during logistical activities. The operation costs in SEPPA problem consists of four considerations: the transportation cost, the handling cost, the inventory cost, and the shortage cost. The optimization objective of this problem is to rationally allocate the distribution quantity of empty pallets and the recycling quantity of empty pallets between the concentrated supply center and the pallet service center, to minimize the total operation cost.
4.2. Assumptions
Before further study, in order to facilitate the study of this problem and establish solution of the model, the following assumptions are made:
- 1200 mm × 800 mm and 1200 mm × 1000 mm standard pallets are considered;
- Unit transportation costs, unit inventory costs, and unit handling costs of pallets are determined;
- The inventory capacity and handling capacity of the concentrated supply center are determined;
- Only vehicle transportation is used between the concentrated supply center and the pallet service center;
- Damage to empty pallets is considered, which are transported between the pallet service center and the concentrated supply center;
- The pallets used in the previous period are recycled in the current period;
- All broken pallets are disposed of as direct waste, regardless of their profitability.
4.3. Parameters
- Decision Variables
- empty pallets of type transported from pallet service center to concentrated supply center in period t;
- empty pallets of type recycled from the concentrated supply center back to the pallet service center .
- Constant Parameters
- supply of the concentrated supply center for pallets of type in period ;
- demand of the concentrated supply center for pallets of type in period ;
- unit transportation cost of pallets of type from pallet service center to concentrated supply center;
- unit inventory cost of pallets of type in the concentrated supply center;
- unit handling cost of pallets of type in the concentrated supply center;
- unit shortage cost of pallets of type in the concentrated supply center;
- damage rate (unit: %) of pallets of type ;
- inventory capacity for pallets of type ;
- transportation capacity (unit: pcs) of pallet service center . It also represents the maximum number of pallets to be carried by vehicle between the concentrated supply center and pallet service center ;
- safety inventory under inventory level for pallets of type from pallet service center ;
- safety inventory level. It represents the proportion of safety inventory within the inventory capacity.
- State Variable
- inventory of the concentrated supply center in period t for pallets of type .
4.4. SEPPA Model
In this study, we construct the objective function M1 as the total cost of empty pallet allocation in period T. Transportation cost, handling cost, inventory cost, and shortage cost are selected as the main cost type components in Equation (1):
Equation (2) denotes the transportation cost. Transportation cost includes the product of unit transportation costs with the sum of the number of empty pallets transported and recycled between the pallet service center and the concentrated supply center.
Equation (3) denotes the handling cost. Handling cost is mainly the cost of loading and unloading goods onto empty pallets at the concentrated supply center.
Equation (4) denotes the inventory cost. The inventory cost is composed of the difference between the total of the demand and the recycling, the supply, the inventory of the previous period, and arrival quantities of the concentrated supply center in the current period. If the difference is greater than 0, the current inventory cost is 0. If the difference is less than 0, indicating that there is a surplus of pallets at this time; thus, there is an inventory cost.
Equation (5) denotes the shortage cost. If the difference between the sum of the supply, the inventory of the previous period, and arrival quantities of the concentrated supply center in the current period and the sum of the demand and the recycling is greater than 0, there is a shortage of pallets. If the difference is less than 0, indicating that there is no shortage, and the cost of shortage is 0.
In Equation (6), the empty pallet inventory quantity at the end of the period is calculated from the previous period’s inventory and the current period’s supply and demand, in addition to the number of empty pallets distributed and recycled. If there is a shortage of pallets, this value is zero. If there is no shortage of pallets, it is equal to the remaining quantity of pallets in the current period in the concentrated supply center.
Equations (7) and (8) denote that when pallets are transferred, the number of pallets loaded at the concentrated supply center and the number of pallets unloaded should not exceed the transportation capacity from the pallet service center to the concentrated supply center.
Equation (9) denotes that the empty pallets loaded in the concentrated supply center will not exceed the current empty pallets volume in the concentrated supply center when transferring empty pallets.
Equation (10) denotes that when transferring empty pallets, the number of empty pallets recovered to the service center in the concentrated supply center cannot exceed the number of empty pallets required by the current concentrated supply center.
4.5. Green Allocation Strategy
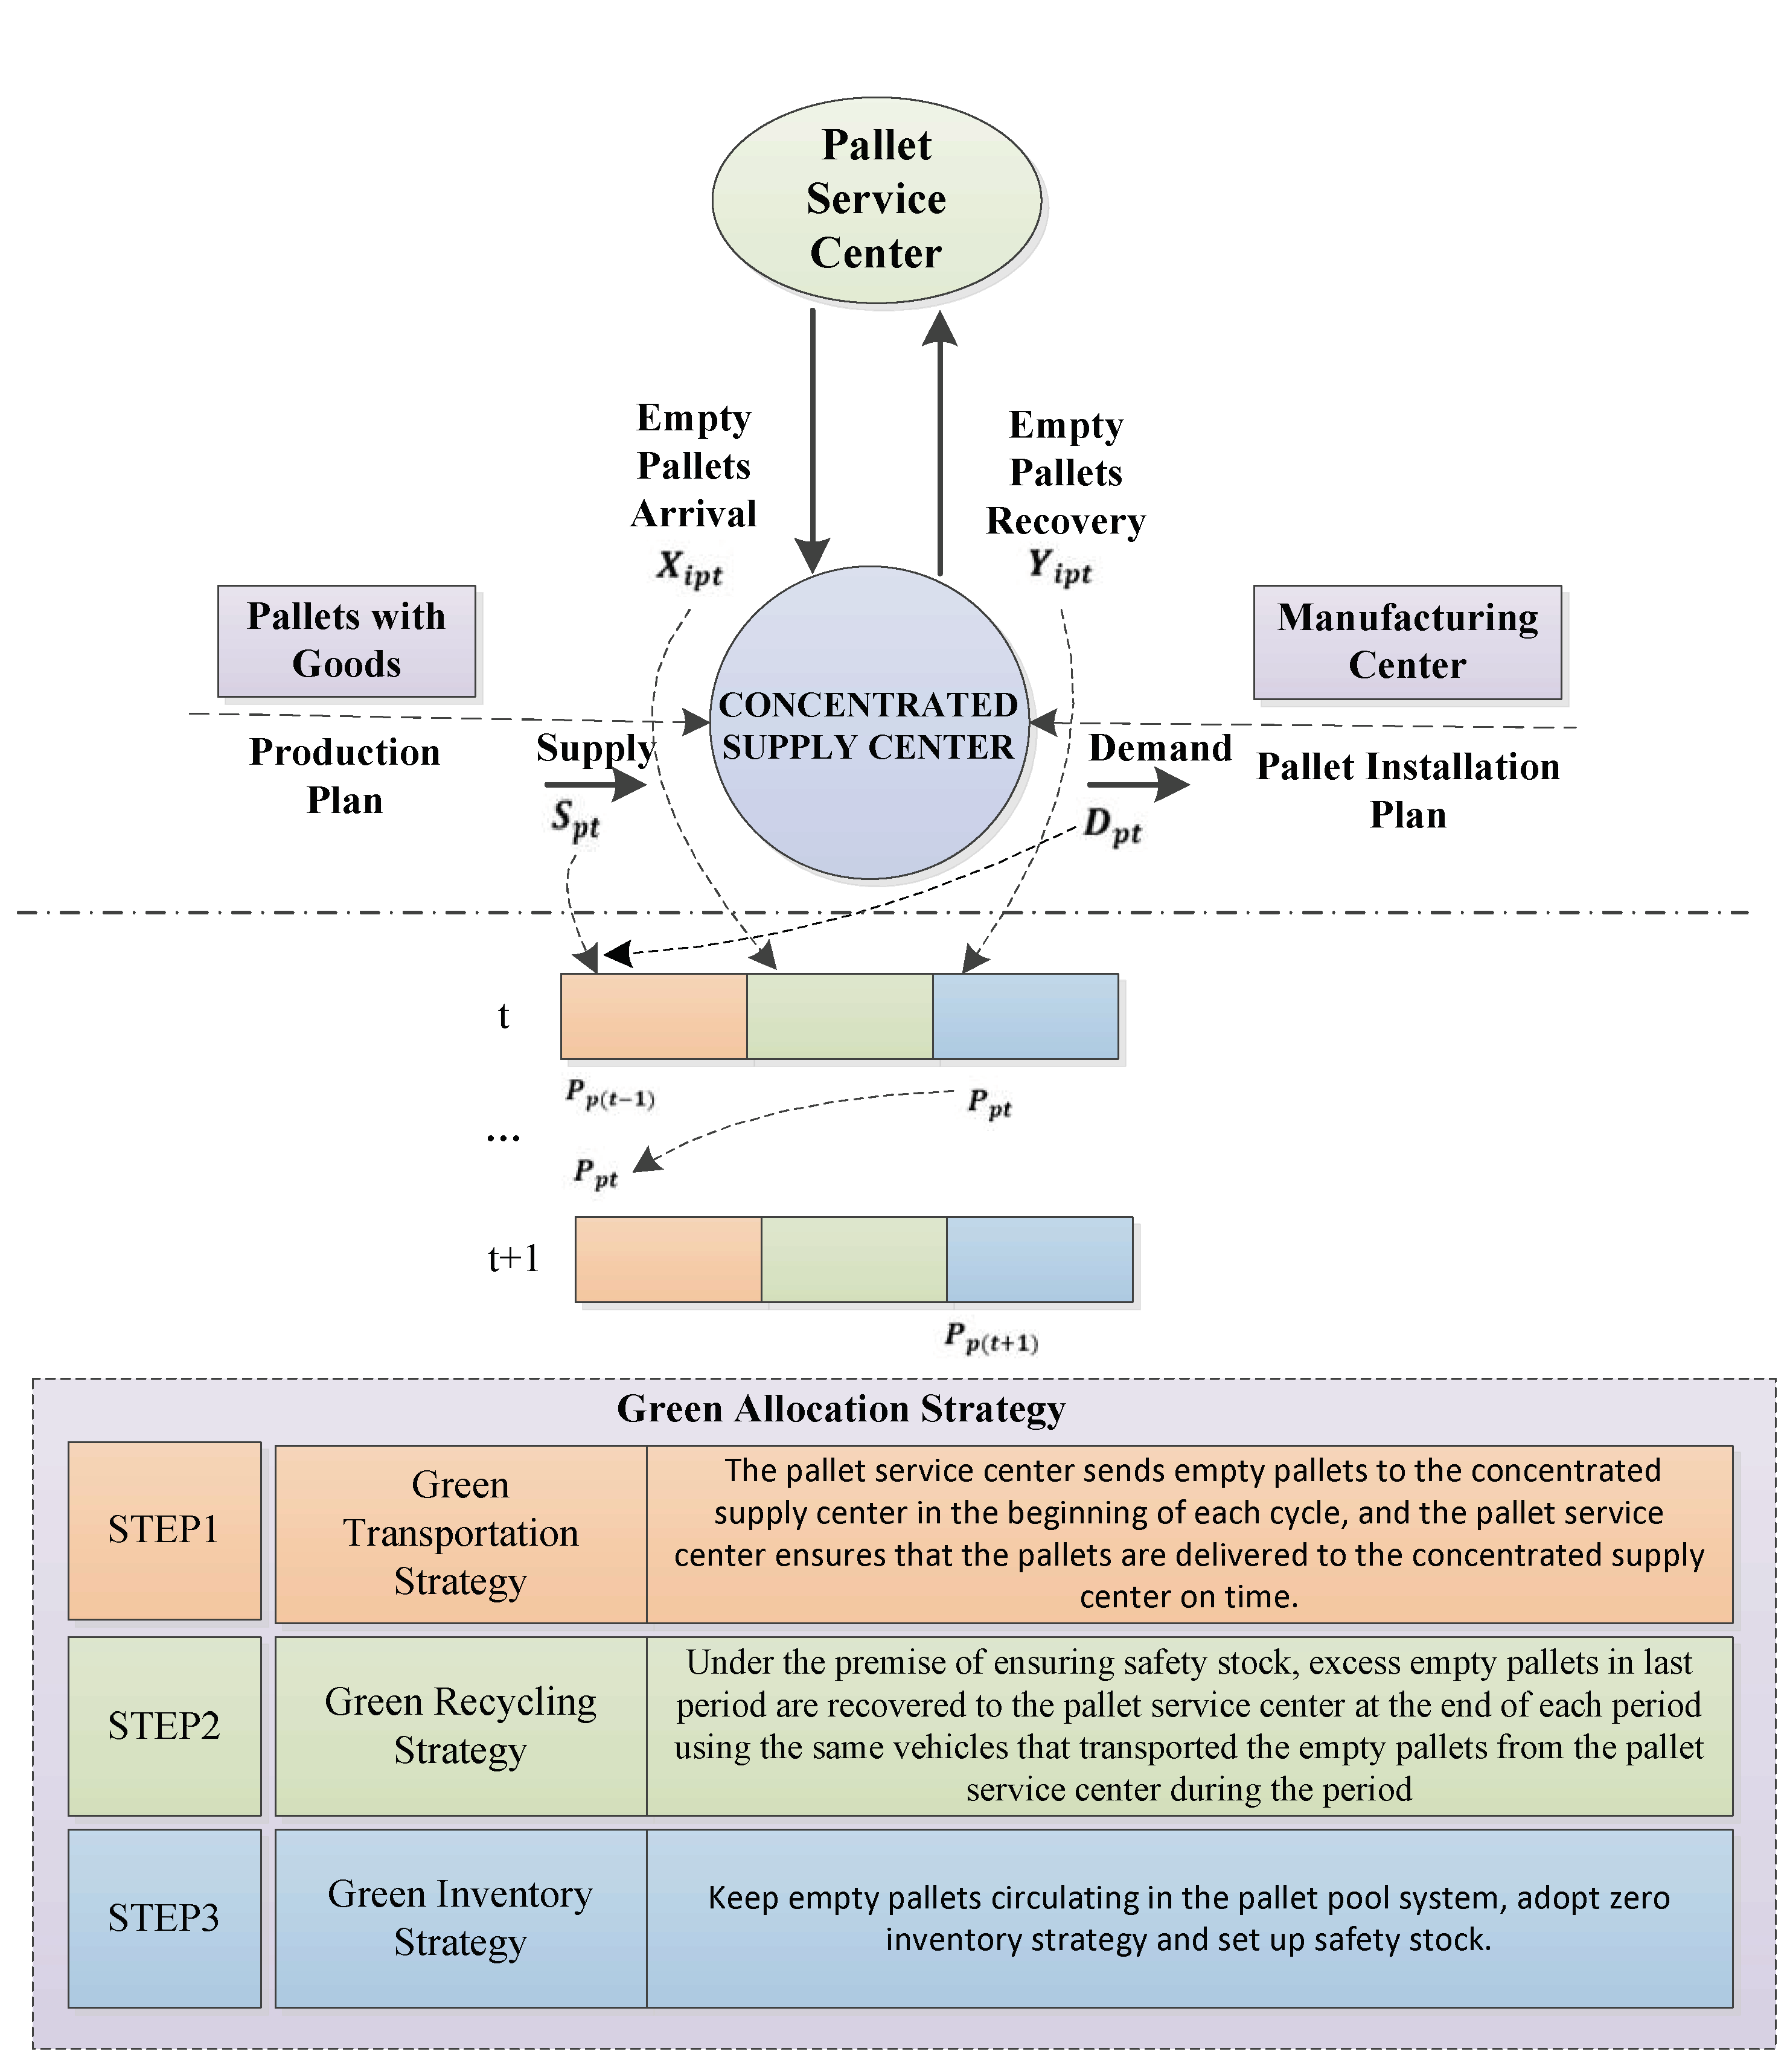
Based on the traditional empty pallet allocation analysis, the pallet pool system is introduced, and a green allocation strategy for empty pallets applicable to ship construction is proposed. The framework for the green strategy of the SEPPA pattern is illustrated in Figure 3. In order to ensure on-time delivery of pallets within the cycle, reduce the space for pallet storage inside shipyards, improve the chaos of pallets placed everywhere in shipyards, reduce the amount of recycling as much as possible, and avoid deliberately arranging vehicles to recycle pallets, the empty pallet allocation strategy for ship construction includes three parts: a green transportation strategy, a green inventory strategy, and a green recycling strategy. The strategy corresponds to the three steps of the shipbuilding empty pallet allocation process; the green transportation strategy corresponds to the first step of the allocation process, the green recycling strategy corresponds to the second step of the allocation process, and the green inventory strategy corresponds to the third step of the allocation process.
Green transportation strategy. The pallet service center sends empty pallets to the concentrated supply center at the beginning of each cycle, and the pallet service center ensures that the pallets are delivered to the concentrated supply center on time. In the green transportation strategy, empty pallet transportation decisions are made according to the value of the difference between supply and demand. In step 1, each period of the concentrated supply center generates independent pallet supply and pallet demand, and the supply and demand information for each period is provided before the pallets arrive at the concentrated supply center. The supply and demand information are obtained from the production schedule and pallet installation schedule. The supply is determined by the production schedule and the demand is determined by the pallet installation schedule.
Green recycling strategy. Under the premise of ensuring safety stock, excess empty pallets from the last period are recycled to the pallet service center at the end of each period using the same vehicles to transport the empty pallets from the pallet service center during the period. In step 2, empty pallet allocation decisions determine the number of empty pallets to be transported from the pallet service center to the concentrated supply center. Then, the concentrated supply center recycles the extra pallets from the previous period, when the number of recycled empty pallets is determined.
Green inventory strategy. This strategy keeps empty pallets circulating in the pallet pooling system, adopting a zero inventory strategy, and setting up safety stock. The green inventory strategy uses the method of “circulation” instead of “inventory”, which is more commonly used in shipbuilding enterprises. In the green inventory strategy, the maximum safety inventory of pallets is set as the maximum capacity of inventory, and the minimum safety inventory is set as the initial stock of empty pallets. We assume a linear distribution of inventory in the concentrated supply center. Equation (11) provides the safety inventory in the concentrated supply center, which is controlled by setting the inventory level for each period. represents the lower limit of safety inventory, which is usually set to the initial stock of the concentrated supply center.
In step 3, according to Equation (6), we calculate the value at the end of the period, which is the inventory quantity of the concentrated supply center in period t. Besides, is the inventory of empty pallets at the beginning of the concentrated supply center in period t + 1. As pallet damage rate is considered, the pallet quantity at the end of period t − 1 and the pallet damage rate determine the amount of pallets that can be put into use in period t. Equation (12) provides the amount of recycled pallets in period t, which is together determined by the number of available pallets in period t and the safety inventory .
The recycled pallets in period t will be recycled in period t + 1. When the number of pallets available for use in period t is less than the safety inventory, the recycled pallet amount is 0. When the number of pallets available for use in period t is greater than the safety inventory, the empty pallet recycling amount is the difference between the available pallets in period t minus the safety inventory.
5. Case Analysis
5.1. Parameter Value Setting
For our case study, we reference a base case that uses values as follows. Two pallet service centers are selected; pallet service center A provides pallets, and pallet service center B provides pallets.
We set the same unit inventory cost and unit handling cost for each type of pallet in the concentrated supply center. At the same time, in order to avoid delays resulting from an insufficient supply of pallets, the rate of shortage of pallets is set relatively high. The pallet service centers are all located in the area where the shipyard is located, and are subject to market influences that vary the unit transportation costs. The unit transportation costs for the pallet service centers, and the unit inventory cost, unit handling cost, and unit shortage cost for the concentrated supply center, are shown in Table 1.
There are 40 empty pallets in the initial stock of the concentrated supply center, of which and . The maximum inventory capacity of the concentrated supply center is . Up to 300 pallets can be transported within the concentrated supply center by vehicles. , the damage rate, is the same for pallets and pallets. The safety inventory level is .
5.2. Supply and Demand Description
There are many strategic factors affecting pallet transfer, from among which the supply and demand balance state of pallets is the most important. In this study, we select three base datasets which are illustrated and exemplified in Table 2, Table 3 and Table 4. Three common supply and demand patterns are discussed: balanced pattern, moderately unbalanced pattern, and extremely unbalanced pattern. In each pattern, while pallet supply and demand fluctuate, they are assumed to obey three different distributions discussed separately for comparison: uniform distribution, normal distribution, and Poisson distribution. In balanced pattern, the ratio of the overall excess number of pallets supplied to the overall number of pallet gaps is set from 0.98 to 1.02. In moderately unbalanced pattern, the ratio of the overall excess number of pallets supplied to the overall number of pallet gaps is set from 1.48 to 1.52. In extremely unbalanced pattern, the ratio of the overall excess number of pallets supplied to the overall number of pallet gaps is set from 1.98 to 2.02 [39].
We select three data sets which are illustrated and exemplified in Table 2, Table 3 and Table 4. These data sets include the monthly pallet supply–demand data. Among the symbols, represents supply volume; represents demand volume in balanced pattern; represents demand volume in moderately unbalanced pattern;
represents demand volume in extremely unbalanced pattern.
5.3. Algorithm Design
Next, the Elitist Genetic Algorithm (EGA) is applied to calculate the operation costs; EGA is based on the genetic algorithm to save the individuals with the highest fitness value in the population, and replicate them all to the next generation’s population. The elite retention strategy plays a significant role in the global convergence performance of genetic algorithms, and many scholars have demonstrated that the EGA is globally convergent [40]. EGA is implemented using the following steps:
Step 1: Encode the solutions. In this study, the genetic algorithm is encoded by integer encoding in the order of periods. For two types of pallets from two pallet service centers in a period of two months, the solution encoding of is denoted as follows: .
Step 2: Set the algorithm parameters. Crossover probability , variation probability , population size , number of generations of genetic evolution , and proportion of superior individuals retained , are set.
Step 3: Initialize the population. The initial population is created based on the population size parameters. Each individual contains the number of purchases or leases for various pallets in the full cycle.
Step 4: Select the operation. The fitness of individuals in the population is ranked, and the individuals that are excellent in front are kept completely for the next generation, and individuals continue to cross and mutate into the next generation. Elite retention method is used instead of roulette wheel selection method.
Step 5: Crossover the operation. We use a two-point crossover approach. Two points are randomly selected in the coding string, and the fragment is swapped.
Step 6: Perform the variation operation. A code string point is randomly selected, and a random number in the range is used as the new value for that point. is a decision value of . When is greater than , is calculated according to the following formula: . When is less than , is 0.
Step 7: Terminate the condition judgment. Steps (2)–(6) are repeated for the population until the genetic evolutionary generation is reached; the individual with the highest fitness and the total cost are output in the last generation of the population.
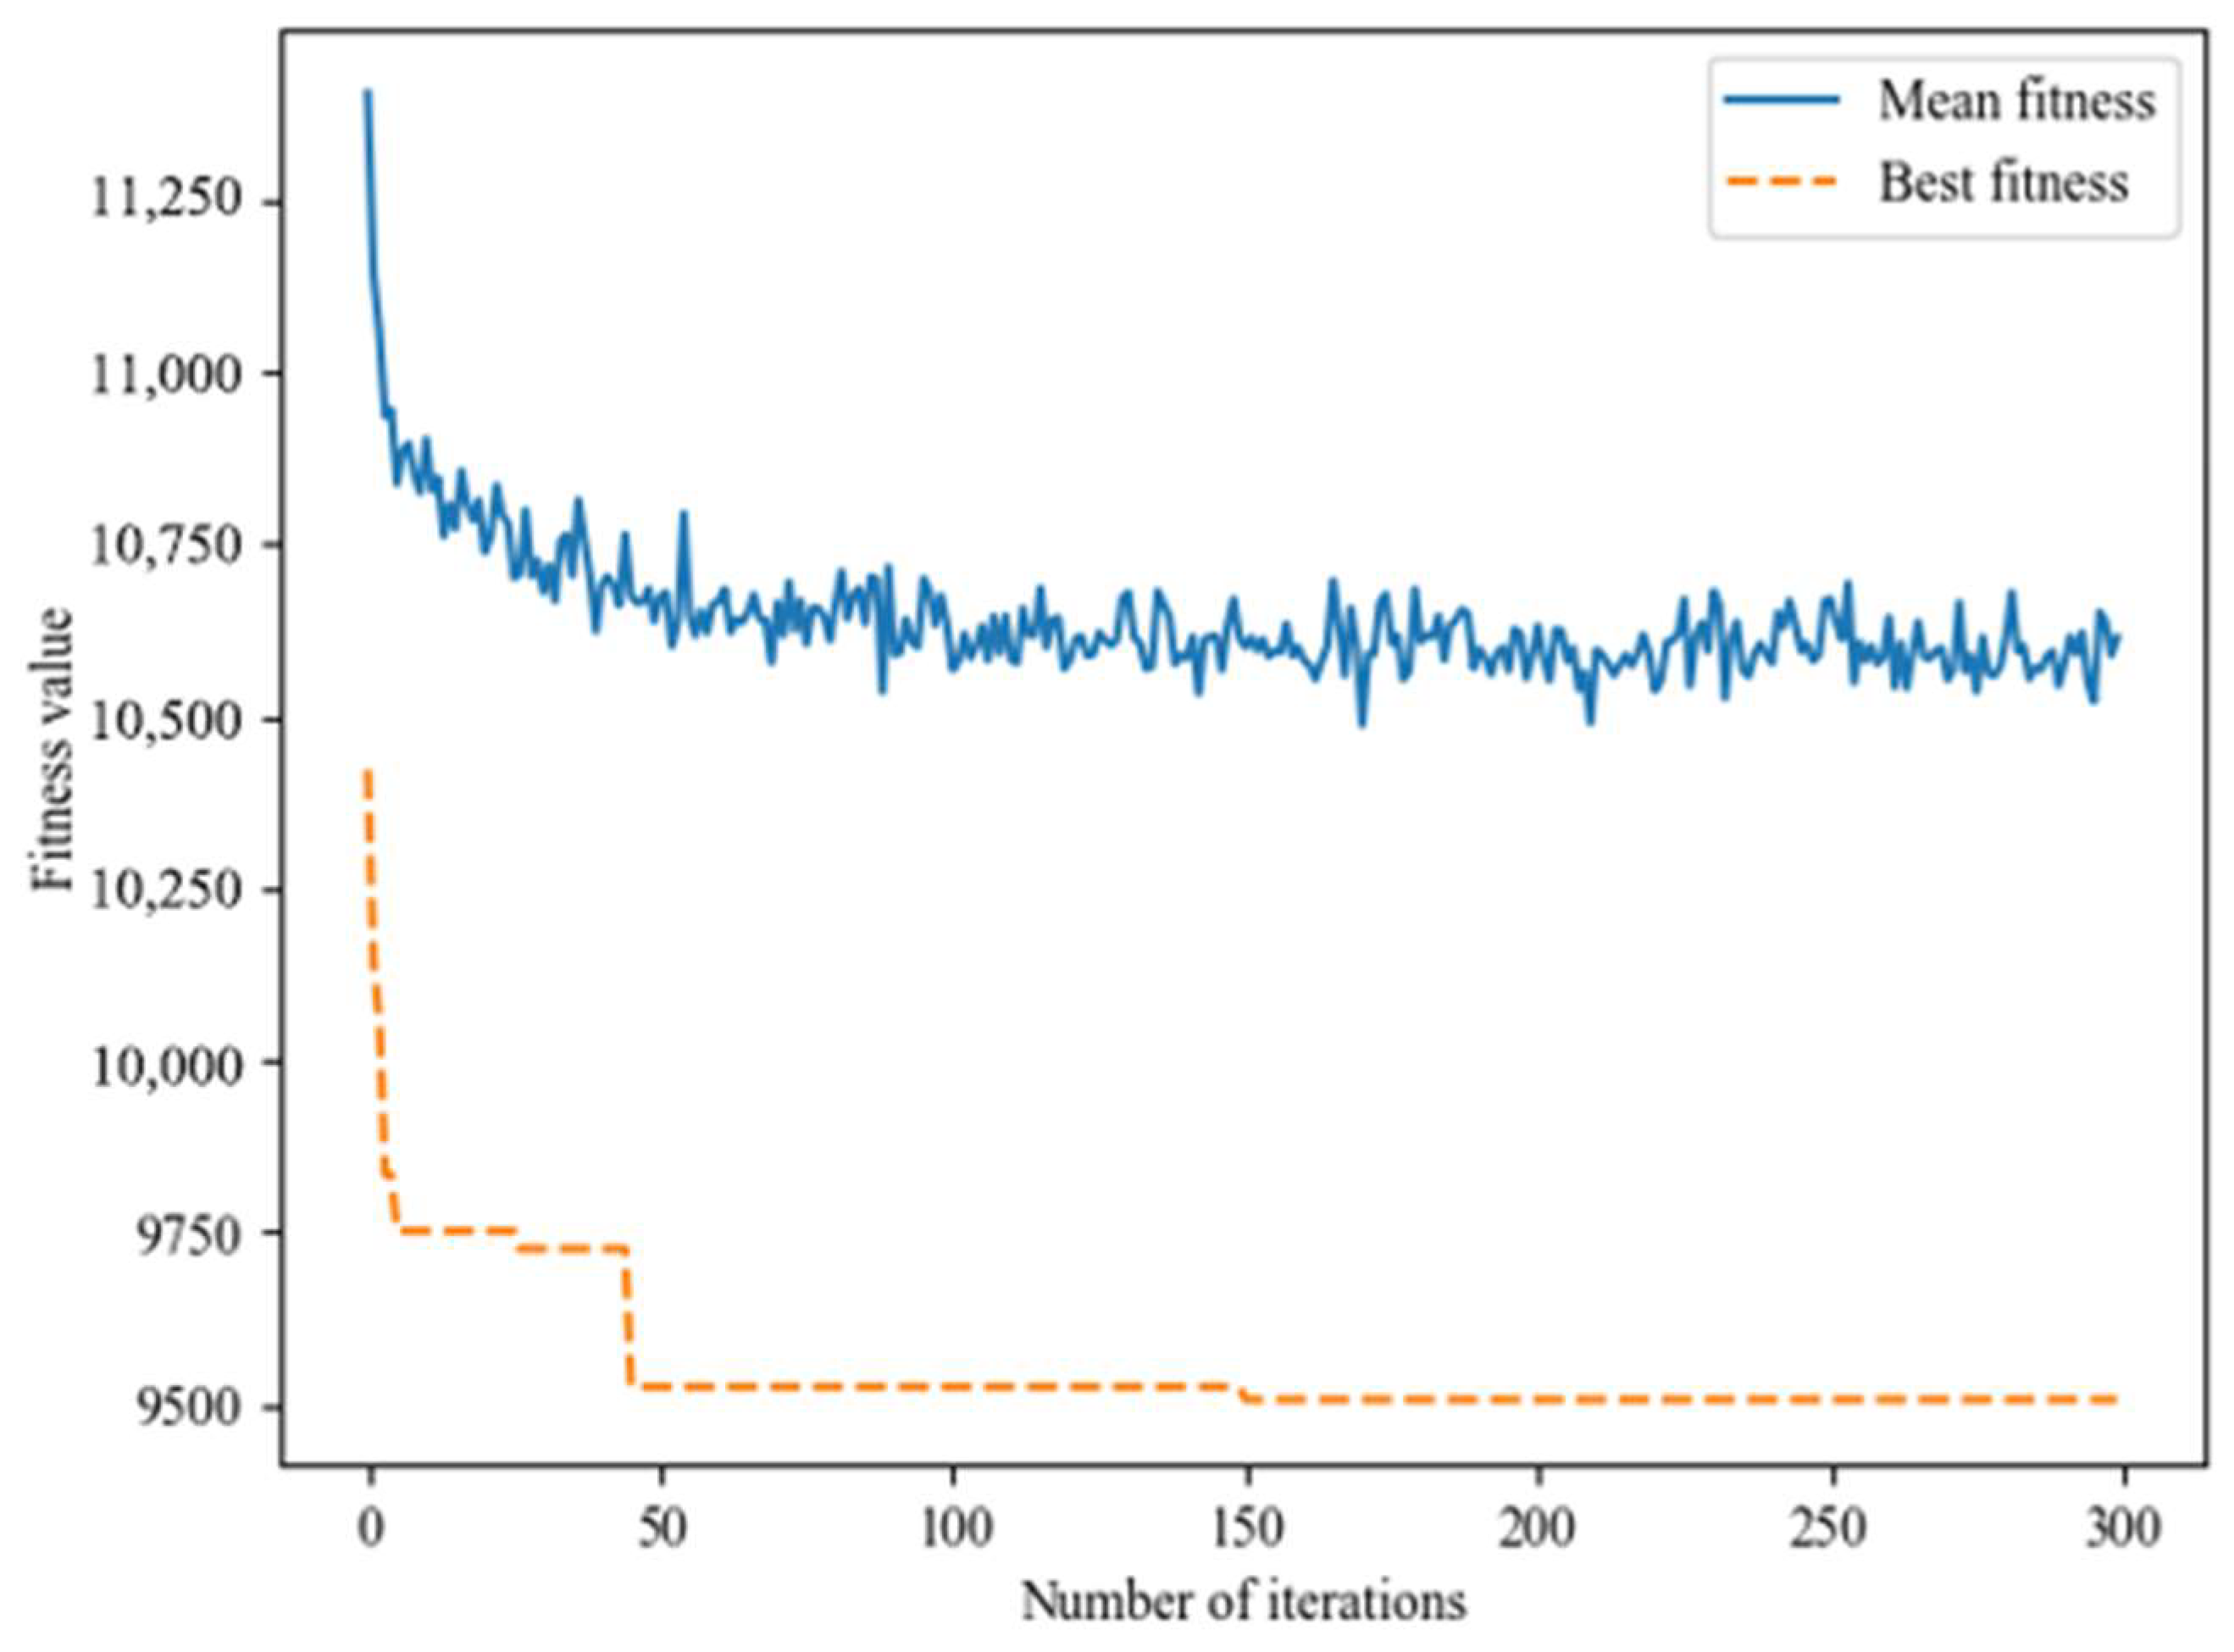
EGA is designed to solve the cases using PYTHON to calculate the operation costs. The convergence graph of the algorithm is shown in Figure 4. It can be observed that the objective function value gradually converges with the increase in the number of genetic iterations, and in the number of iterations from 150 to 300, the objective function value does not change, which indicates that the algorithm has good convergence.
6. Results
The SEPPA pattern operation costs (POC) are calculated under three different supply and demand patterns, namely, balanced pattern (BP), moderately unbalanced pattern (MUP), and extremely unbalanced pattern (EUP). In each pattern, the supply and demand are divided into three different distributions, namely, uniform distribution (PUD), normal distribution (PND), and Poisson distribution (PPD). The total operation costs for the SEPPA pattern (POC-BP-PUD, POC-BP-PND, POC-BP-PPD, POC-MUP-PUD, POC-MUP-PND, POC-MUP-PPD, POC-EUP-PUD, POC-EUP-PND, and POC-EUP-PPD) are shown in Table 5. Table 5 represents nine operation costs for the SEPPA pattern. The result shows that regardless of whether the pattern is BP, MUP, or EUP, the lowest operation cost is PPD, followed by PND, with the highest being PUD. In addition, the operation cost for MUP-PUD is higher than BP-PPD, and the operation cost for MUP-PPD is less than EUP-PUD.
7. Discussion
Next, the operation cost of the TSEPA pattern is calculated to compare to the SEPPA pattern, since we are interested in the breakpoints for which pattern is preferred in terms of cost savings. We conduct a one-factor-at-a-time sensitivity analysis for the SEPPA pattern, based on data set 3. For parameters that impact the operation cost, we vary the safety inventory level. Besides, we are interested in the sensitivity of three supply–demand patterns’ parameters, and three supply–demand distributions’ parameters, to changes in the operation cost parameters.
7.1. Operation Costs Comparison
For the traditional allocation pattern, we construct the objective function M2 as the total cost of empty pallet allocation in period T. Transportation cost, handling cost, inventory cost, and shortage cost are selected as the main cost type components for Equation (13).
TSEPA operation costs (TOC) for three data sets are calculated, as shown in Table 6. Table 6 shows TOC for balanced pattern (BP-TOC), TOC for moderately unbalanced pattern (MUP-TOC), TOC for extremely unbalanced pattern (EUP-TOC); the average of cost savings percentage (ACSP) for PUD (PUDACSP), ACSP for PND (PNDACSP), and ACSP for PPD (PPDACSP).
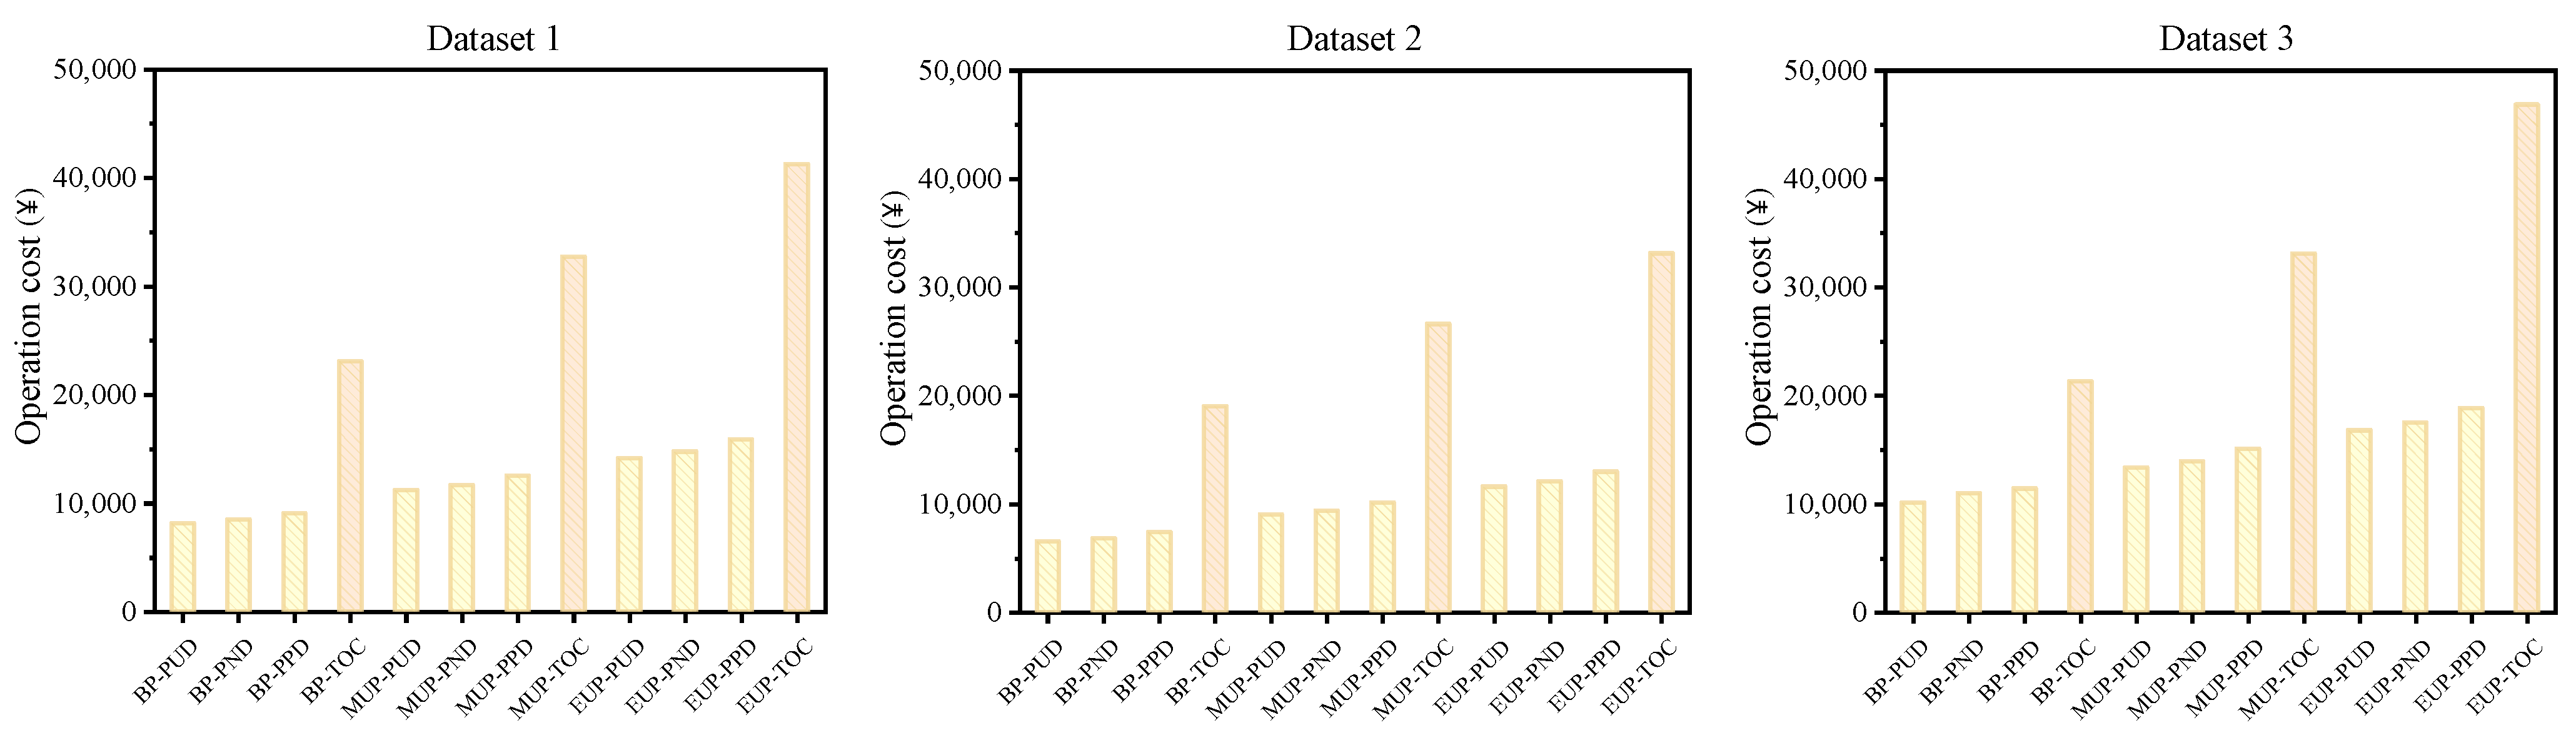
Then, the SEPPA pattern total operation costs under nine cases (BP-PUD, BP-PND, BP-PPD, MUP-PUD, MUP-PND, MUP-PPD, EUP-PUD, EUP-PND, and EUP-PPD) are compared with TSEPA TOCs. Figure 5 depicts the SEPPA pattern total operation costs, and TSEPA pattern total operation costs for three data sets. Figure 5 shows that among the three groups of data, the total operation cost for the SEPPA pattern comparison with that for the TSEPA pattern shows the same trend. In summary, comparing the operation costs for TSEPA and SEPPA, SEPPA has lower operation costs than TSEPA, whether the scenario is a balanced, moderately unbalanced, or extremely unbalanced pattern.
We also calculate the cost savings percentages (CSP) between TOC and POC for nine cases. Then, the average of cost savings percentages (ACSP) for three data sets are calculated, as shown in Table 6. In general, the interval of ACSP for nine cases is 56–65%. In the balanced pattern, the interval of ACSP is 56–61%. In the moderately unbalanced pattern, the interval of ACSP seems to be 59–64%. For the extremely unbalanced pattern, the interval of ACSP is between 61 and 65%.
7.2. Impact of Safety Inventory Level on Operation Costs
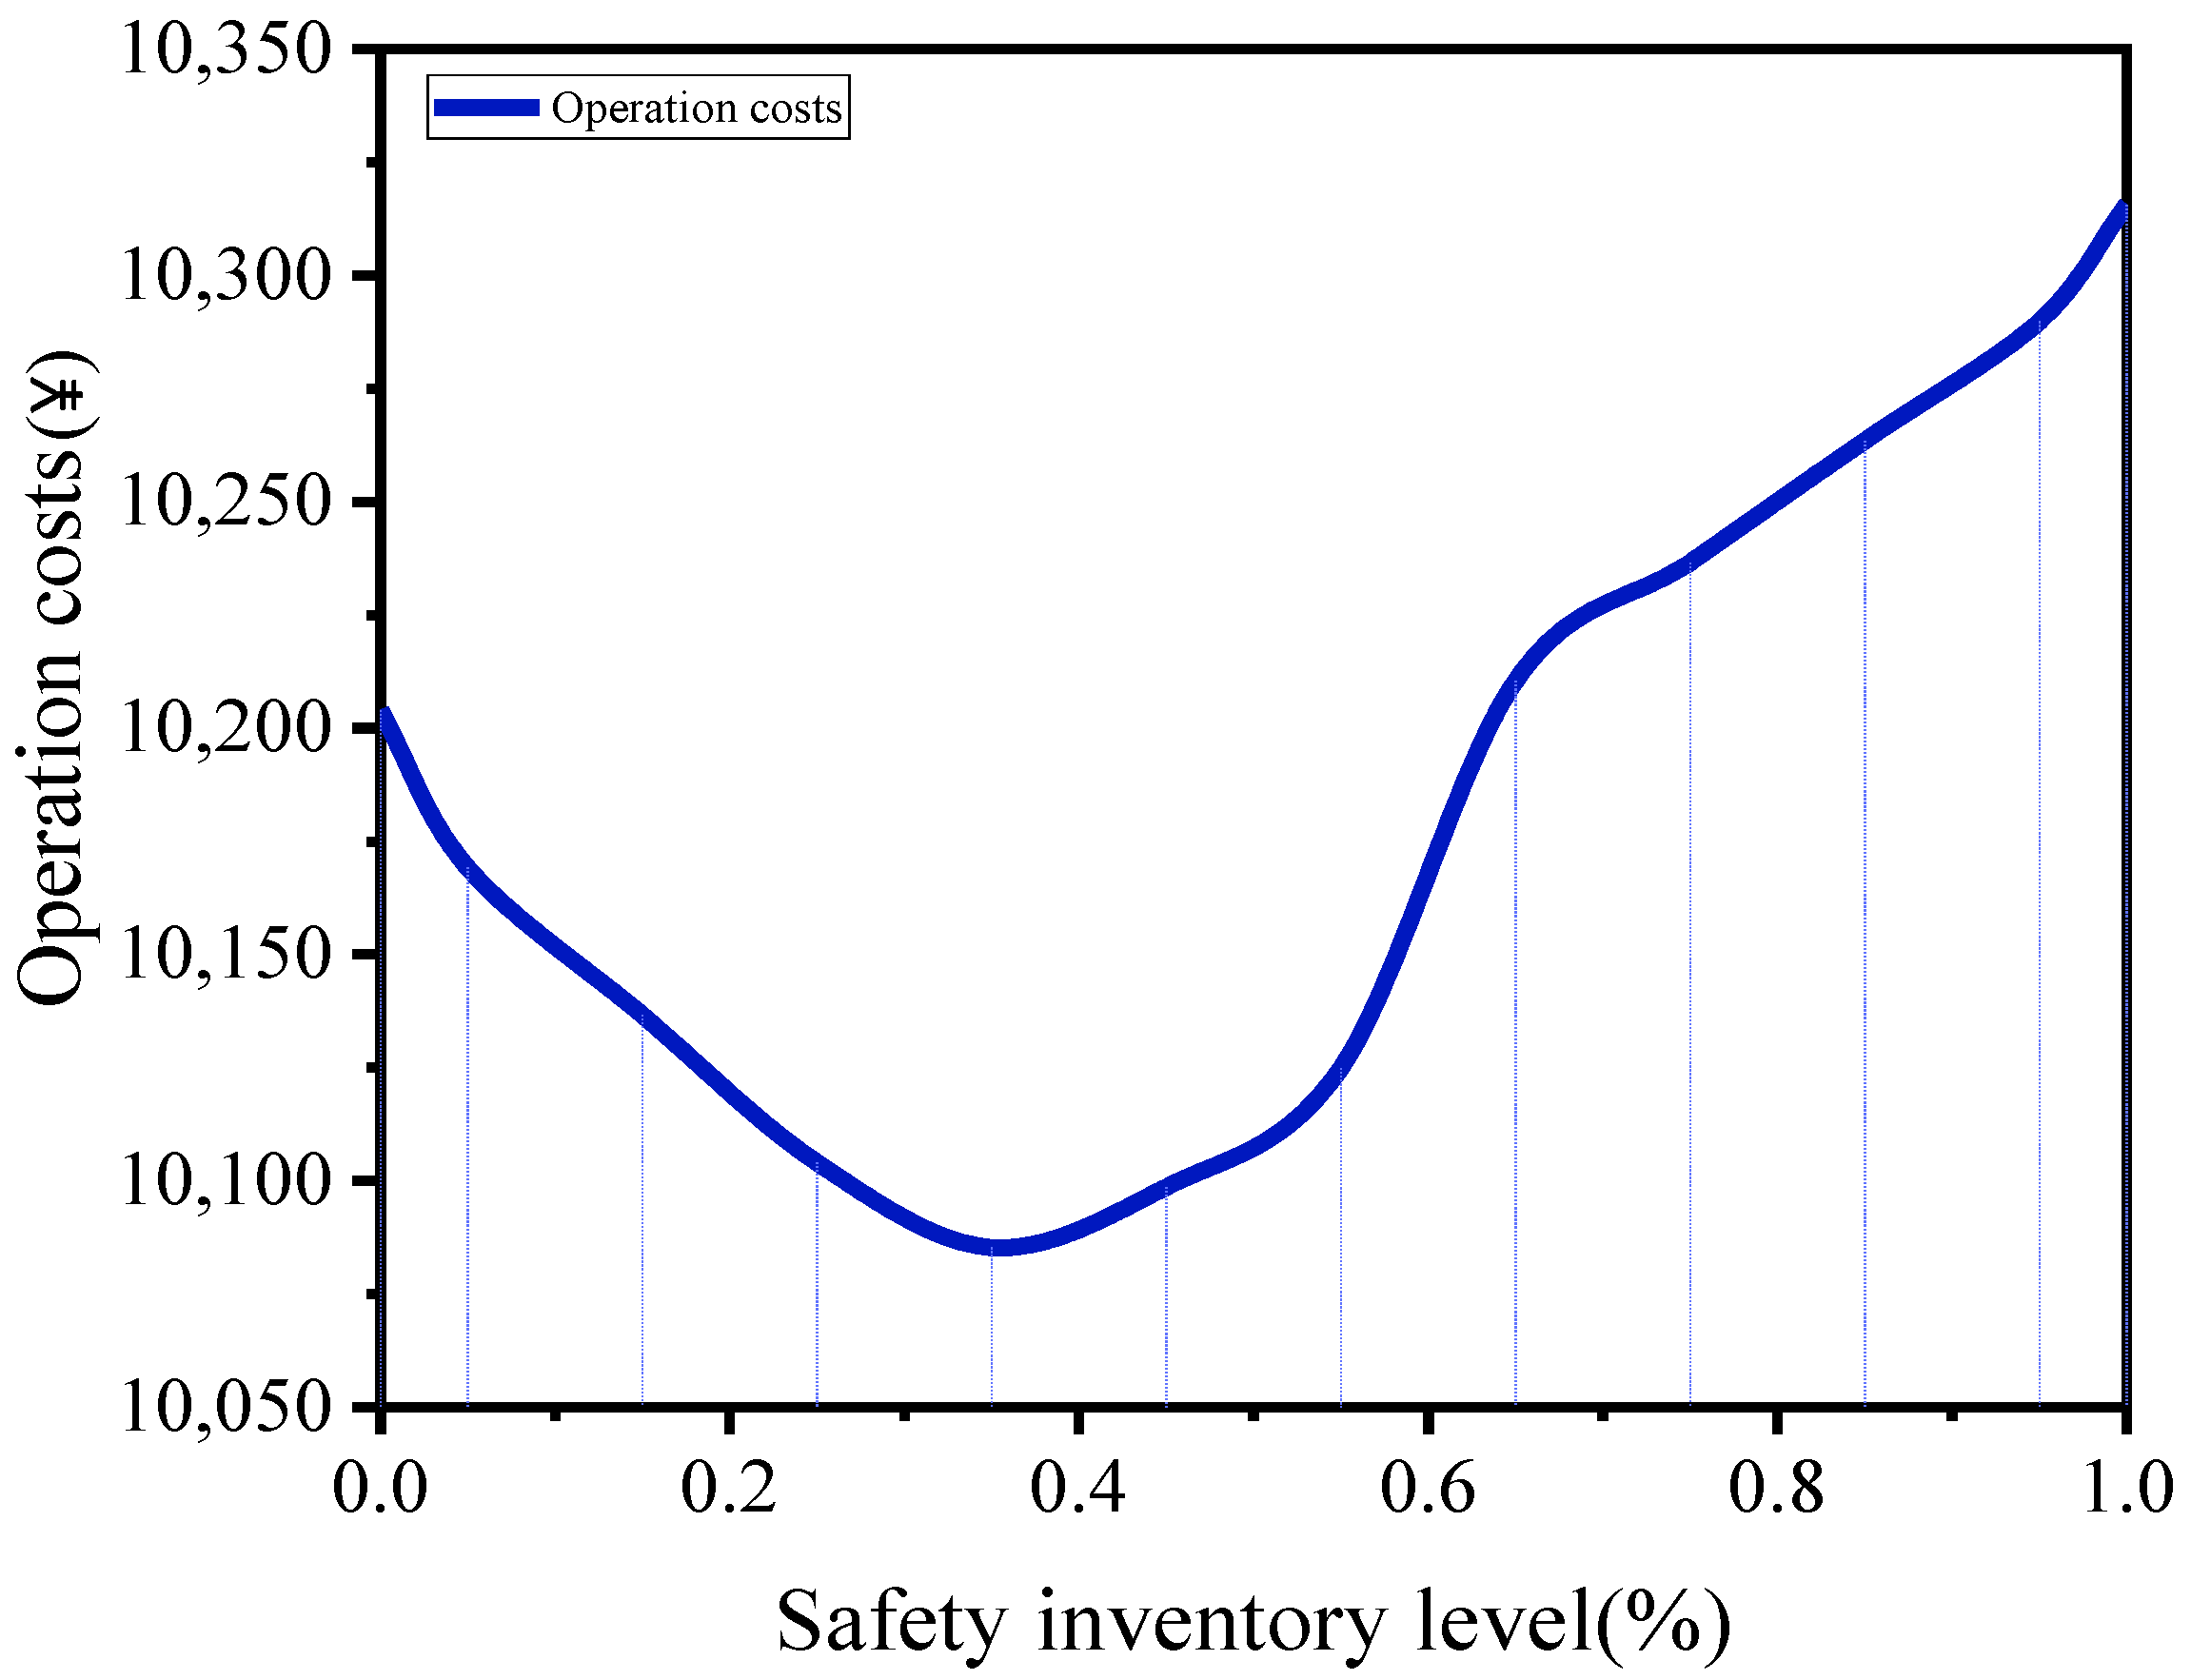
A sensitivity analysis is conducted on safety inventory levels. The relationship between safety inventory levels and BP-PUD for the SEPPA pattern is shown in Figure 6. It can be found that the operation cost decreases gradually as the safety inventory level changes from 0 to 0.35, and increases gradually as that level changes from 0.35 to 1. The lowest operation cost for empty pallet allocation is achieved at an operation level of 0.35. When the safety inventory is larger, the possibility of being out-of-stock in the concentrated supply center is lower. However, the larger the safety inventory is, the more likely it will result in surplus stock. When the safety inventory level is 0.35, the corresponding operation cost is ¥10,085. It is indicated that the safety stock corresponding to a safety inventory level of 0.35 represents the optimal safety stock, which corresponds to the lowest operation cost. Based on this result, we may maintain the empty pallet allocation operation, and hence control the number of empty pallets in the concentrated supply center to avoid excessive empty pallet surplus.
7.3. Impact of Supply–Demand Imbalance on Operation Costs
The impact of supply and demand patterns and their distributions on operation costs during the whole twelve periods from data set 3 are illustrated in Figure 7, Figure 8 and Figure 9. We vary the operation costs of the TSEPA pattern with that of the SEPPA pattern under three supply and demand patterns (BP, MUP, and EUP) during all twelve periods. For the SEPPA pattern, we discuss the impact of three supply and demand distributions (PUD, PND, and PPD) on operation costs.
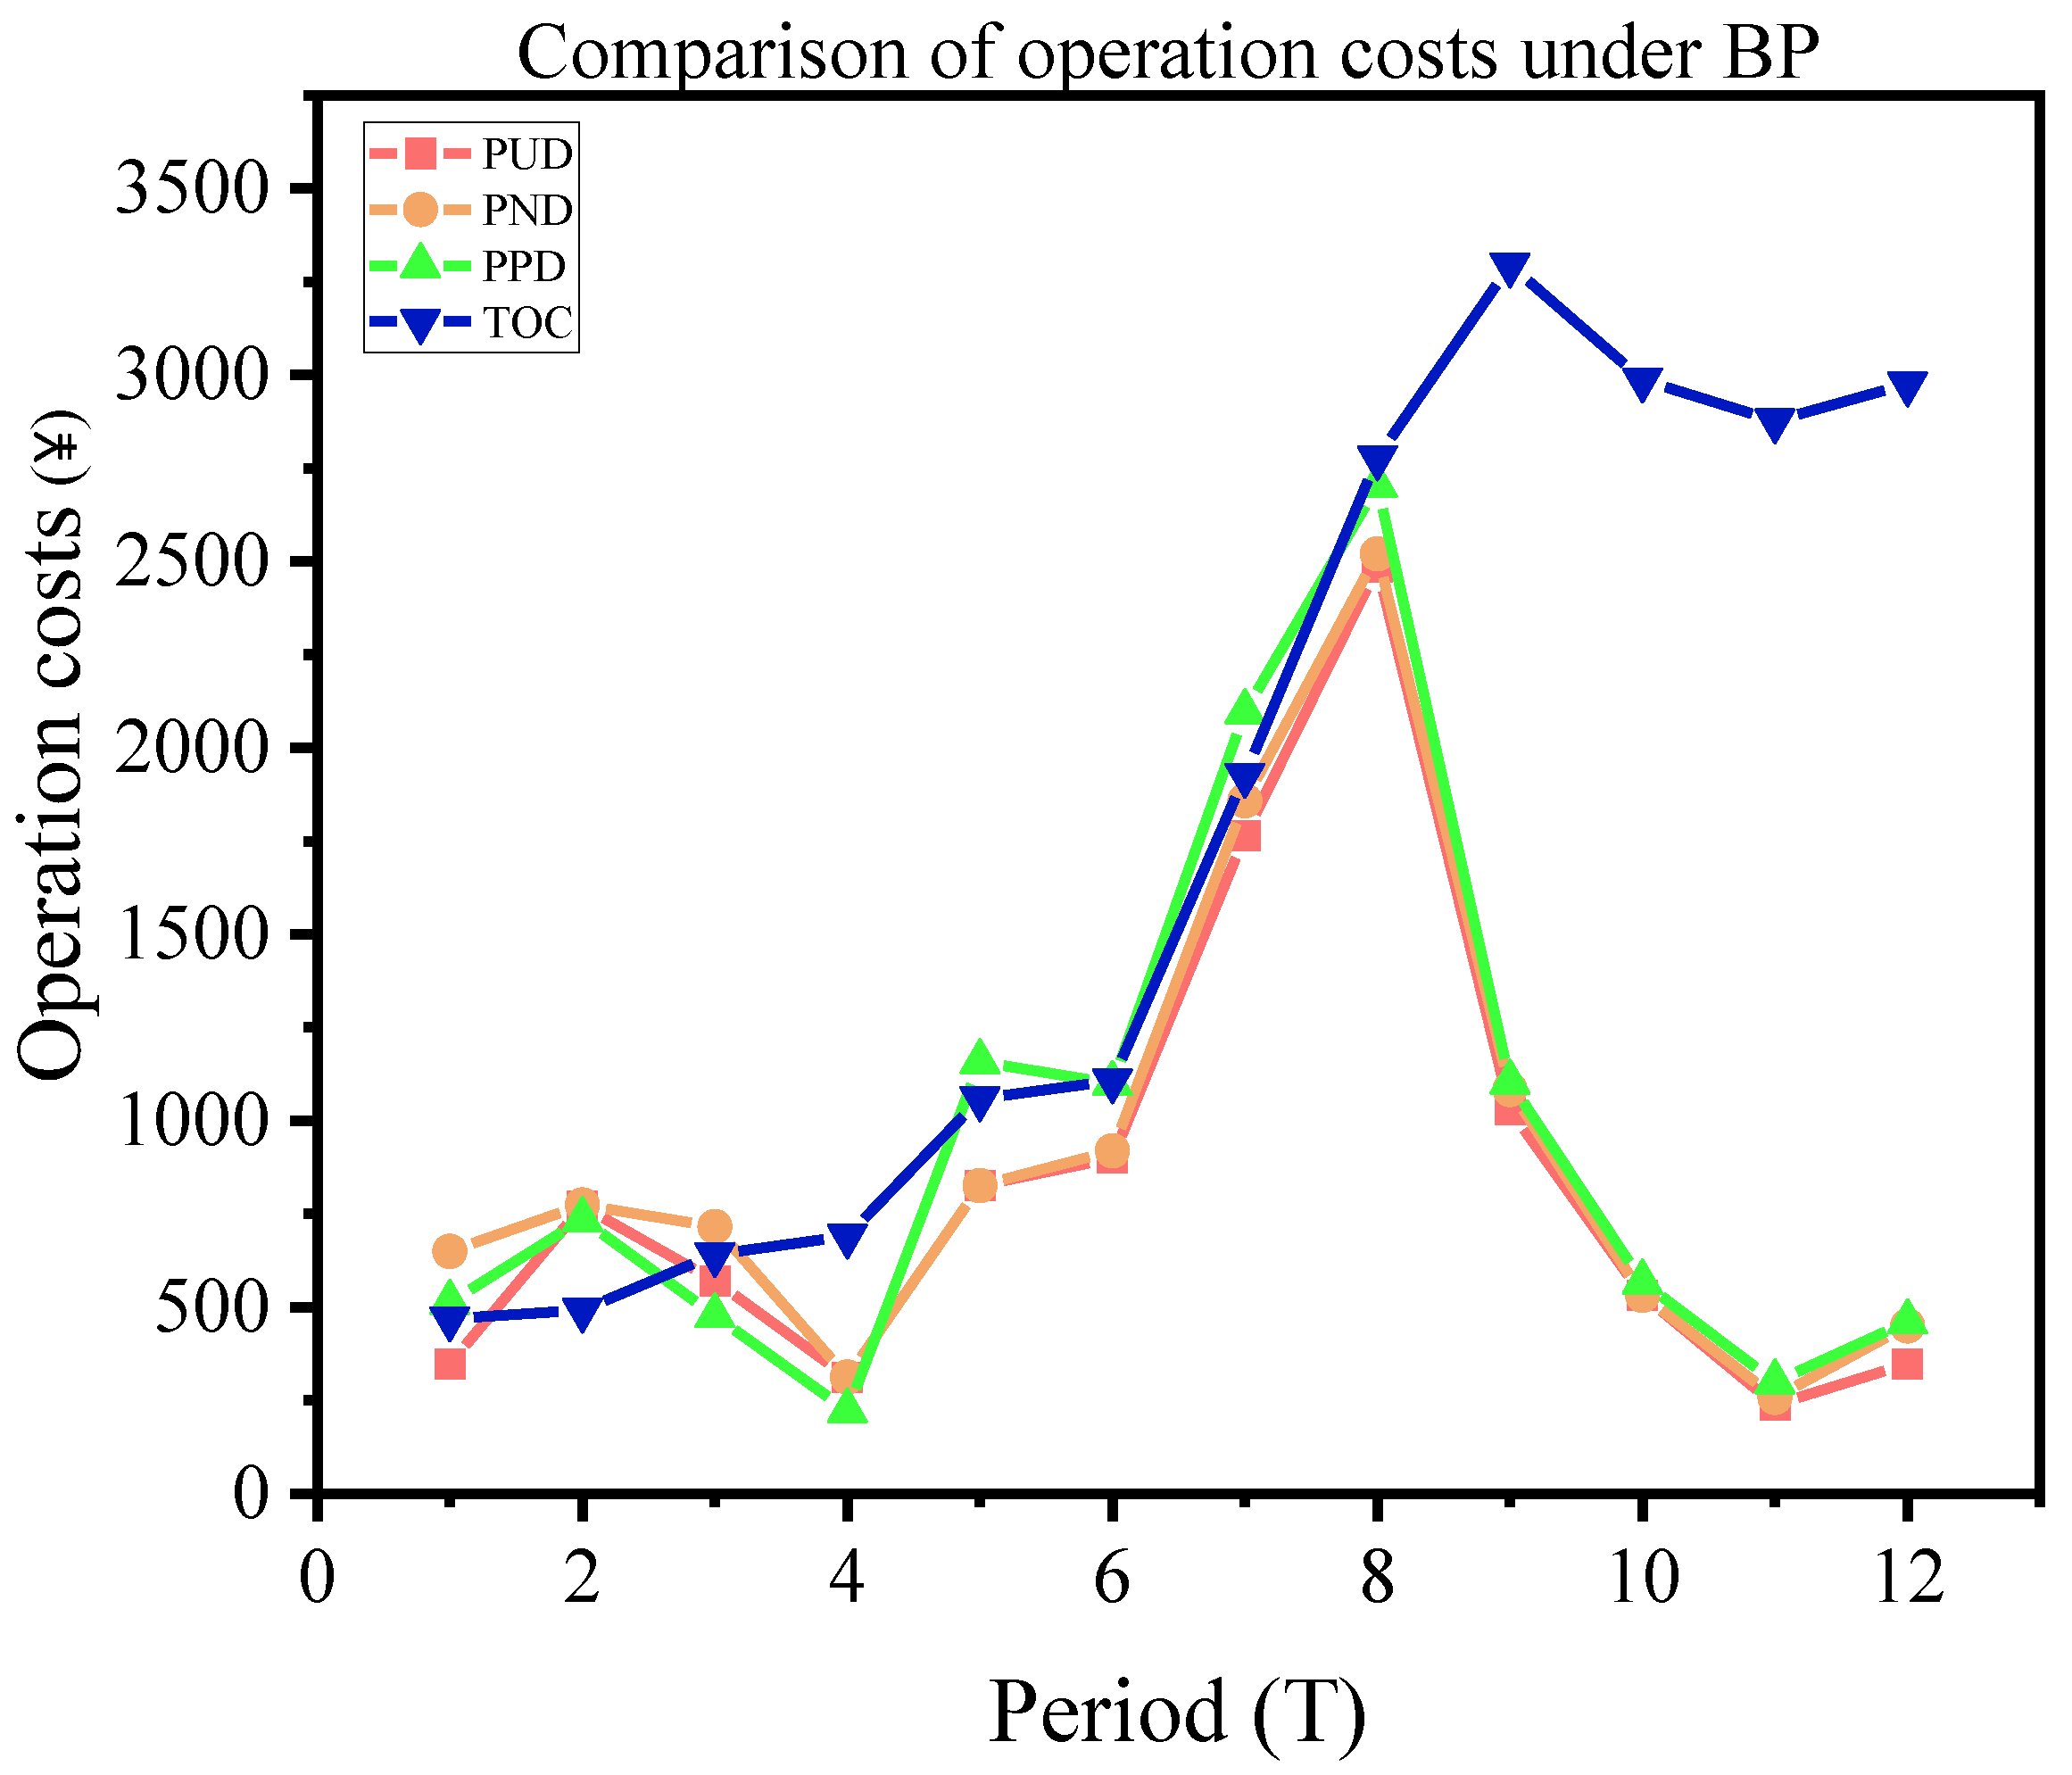
Figure 7 depicts the operation costs of both the TSEPA pattern and the SEPPA pattern for three distributions under BP at different periods. Under BP, the operation cost of the TSEPA pattern is compared with POC-BP-PUD, POC-BP-PND, and POC-BP-PPD. From the first period to the eighth period, the operation cost difference between the SEPPA pattern and the TSEPA pattern is not significant. However, from the eighth period onwards, the operation costs when supply and demand are under PUD, PND, and PPD for the SEPPA pattern have a significant advantage over the TSEPA pattern. Overall, all three distributions for the SEPPA pattern in the balanced pattern have advantages relative to the TSEPA pattern. Simultaneously, we vary POC-BP-PUD, POC-BP-PND, and POC-BP-PPD. From the first to the fourth period, POC-BP-PND is the largest, and from the fifth period onward, the operation costs all present as follows: the highest is POC-BP-PPD, the second is POC-BP-PND, and the lowest is POC-BP-PUD. The volatility of supply and demand from the first period to the eighth period has a greater impact on operation costs. In contrast, from period nine to period twelve, the volatility of supply and demand has less impact on operation costs, and the difference among the three distributions is not significant. As the supply and demand distribution changes from uniform distribution, normal distribution, and Poisson distribution, the fluctuations in the supply and demand distribution become more volatile, making the SEPPA pattern less advantageous relative to the TSEPA pattern.
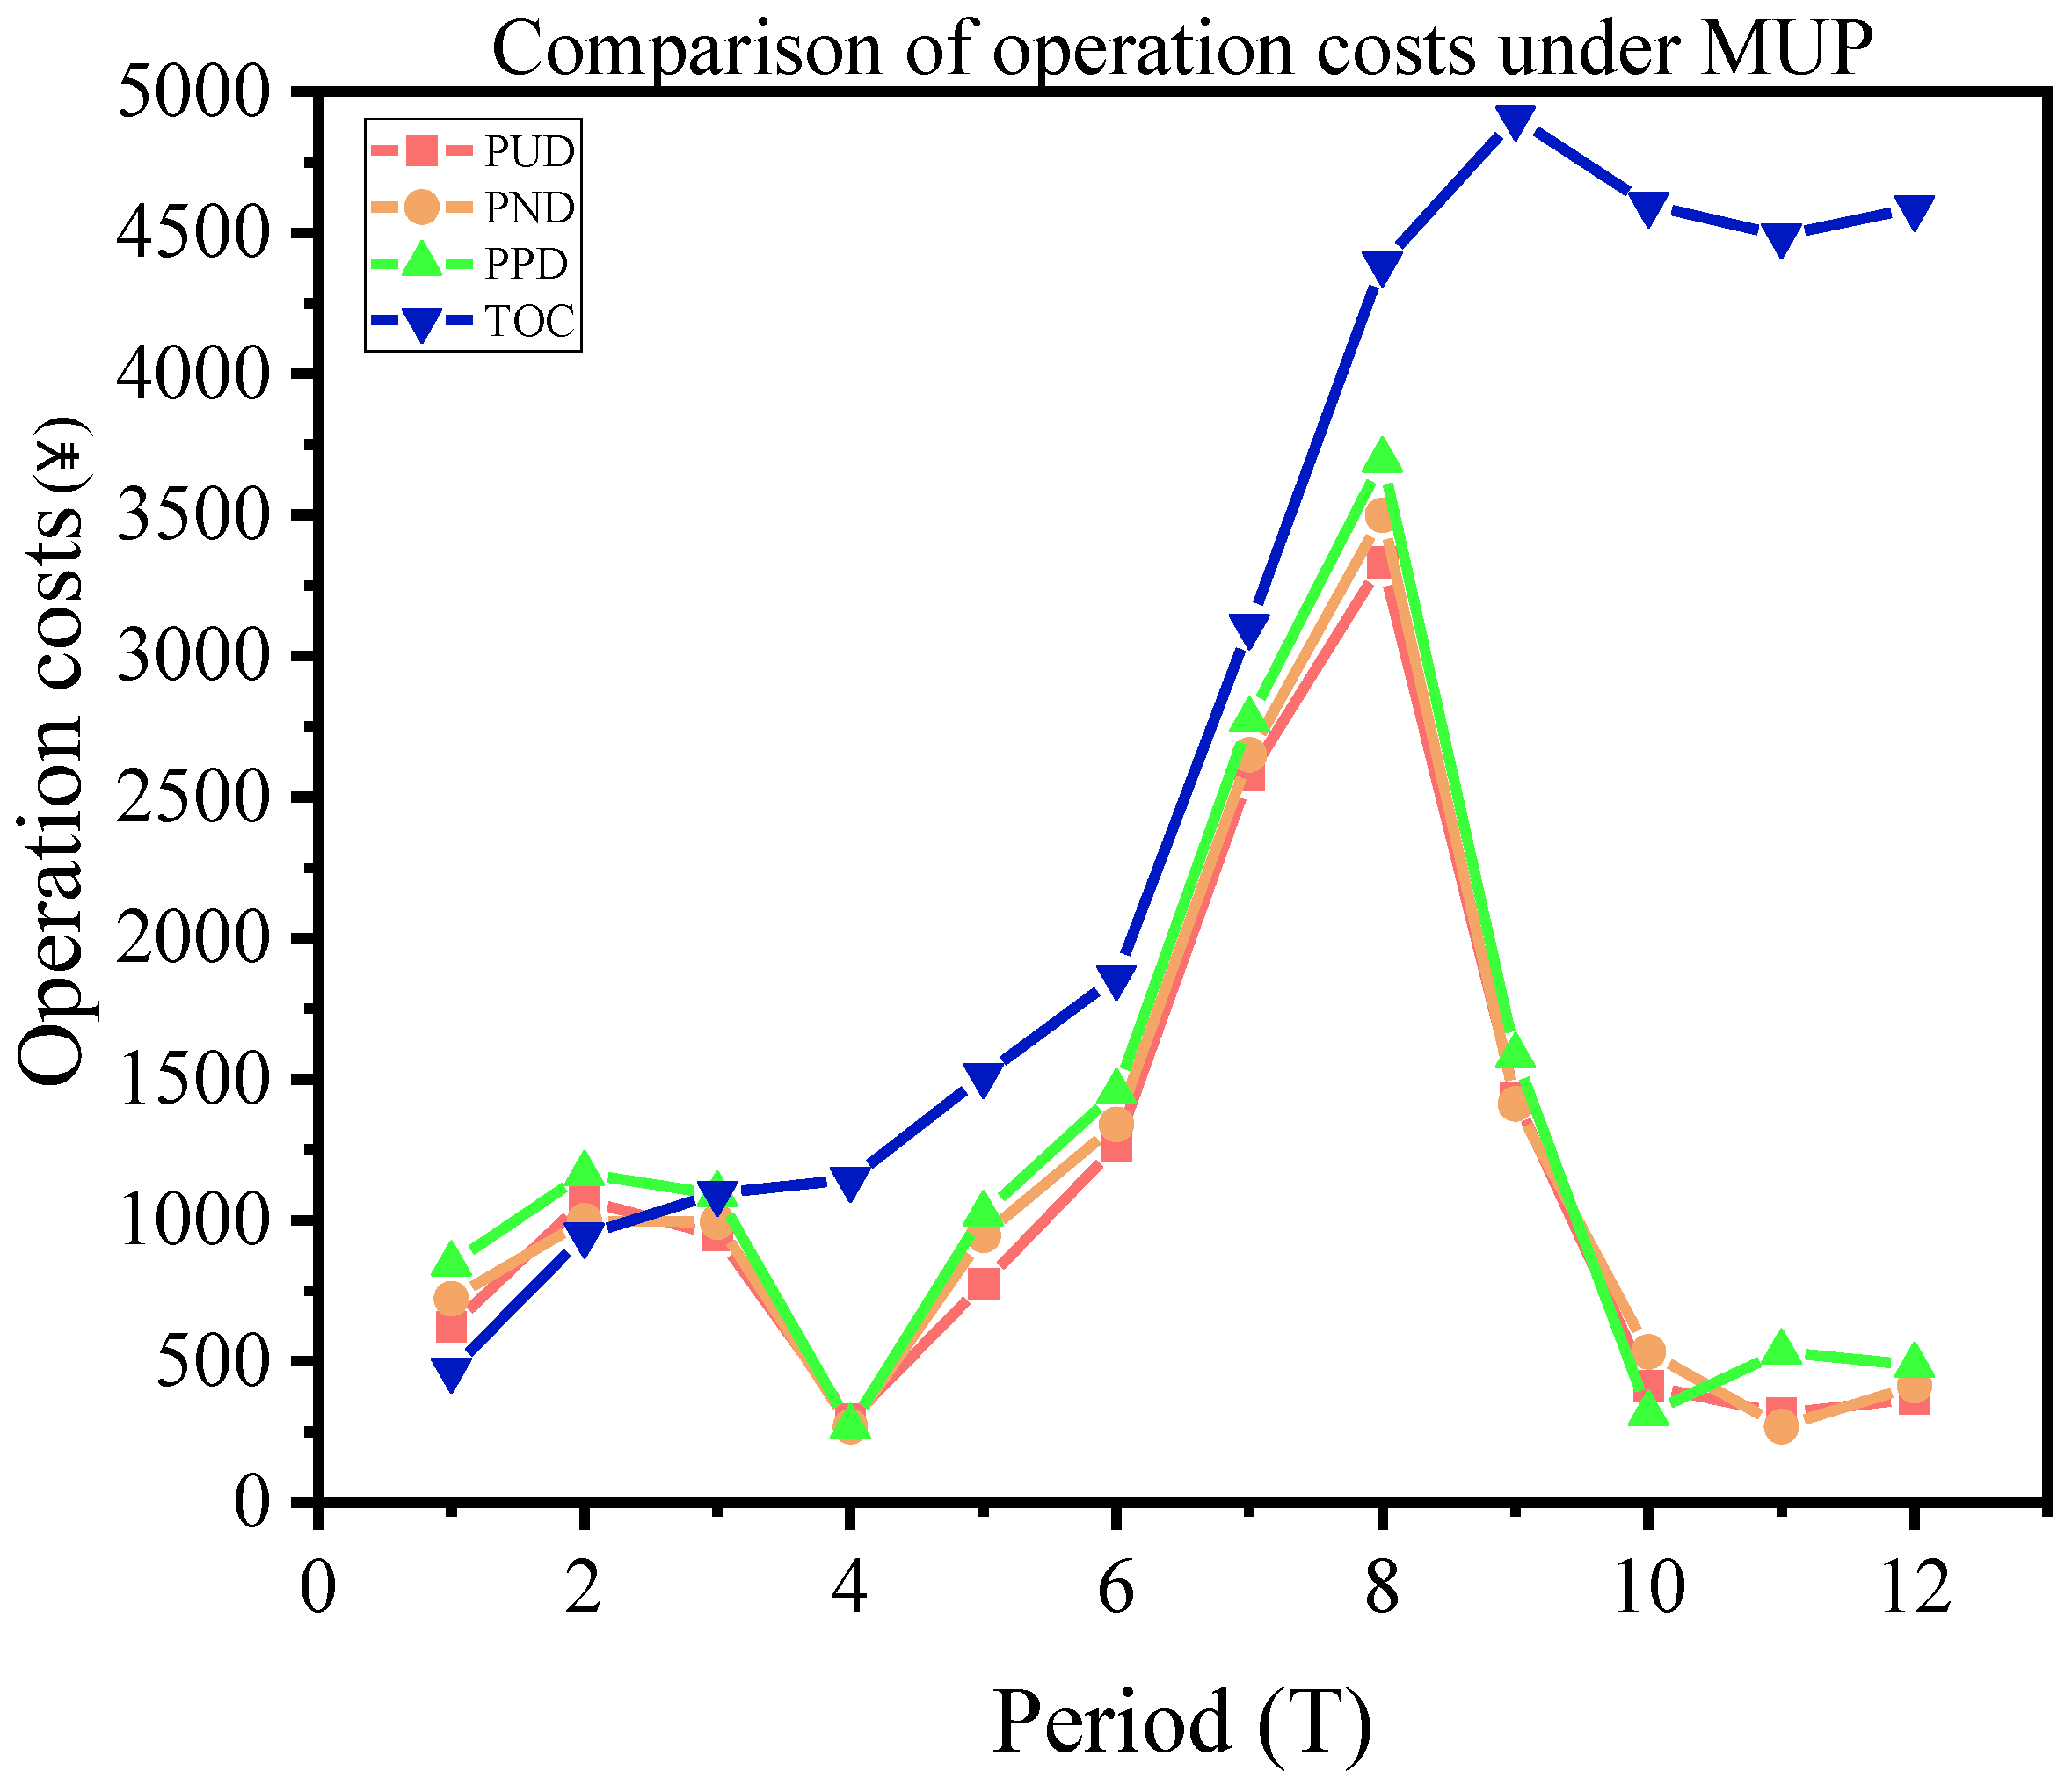
Figure 8 depicts the operation costs of both the TSEPA pattern and the SEPPA pattern for three distributions under MUP at different periods. Under MUP, we vary the operation cost of the TSEPA pattern with POC-MUP-PUD, POC-MUP-PND, and POC-MUP-PPD. At the beginning of the operation, the TSEPA pattern has a slight advantage over the SEPPA pattern. However, after the third period, all three distributions of the SEPPA pattern have an advantage over the TSEPA pattern, especially from the eighth period, where the three distributions of the SEPPA pattern have a greater advantage over the traditional model. Meanwhile, we vary POC-MUP-PUD, POC-MUP-PND, and POC-MUP-PPD. Except for the tenth period, the operation costs for each period showed the highest operation costs when supply and demand is under a Poisson distribution, the second highest operation costs when supply and demand is under a normal distribution, and the lowest operation costs when supply and demand is under a uniform distribution. Further, the operation costs under the three distributions of the SEPPA pattern do not differ significantly, indicating that fluctuations in supply and demand have a small impact on the operation costs of the SEPPA pattern, reflecting the good adaptability of the SEPPA strategy.
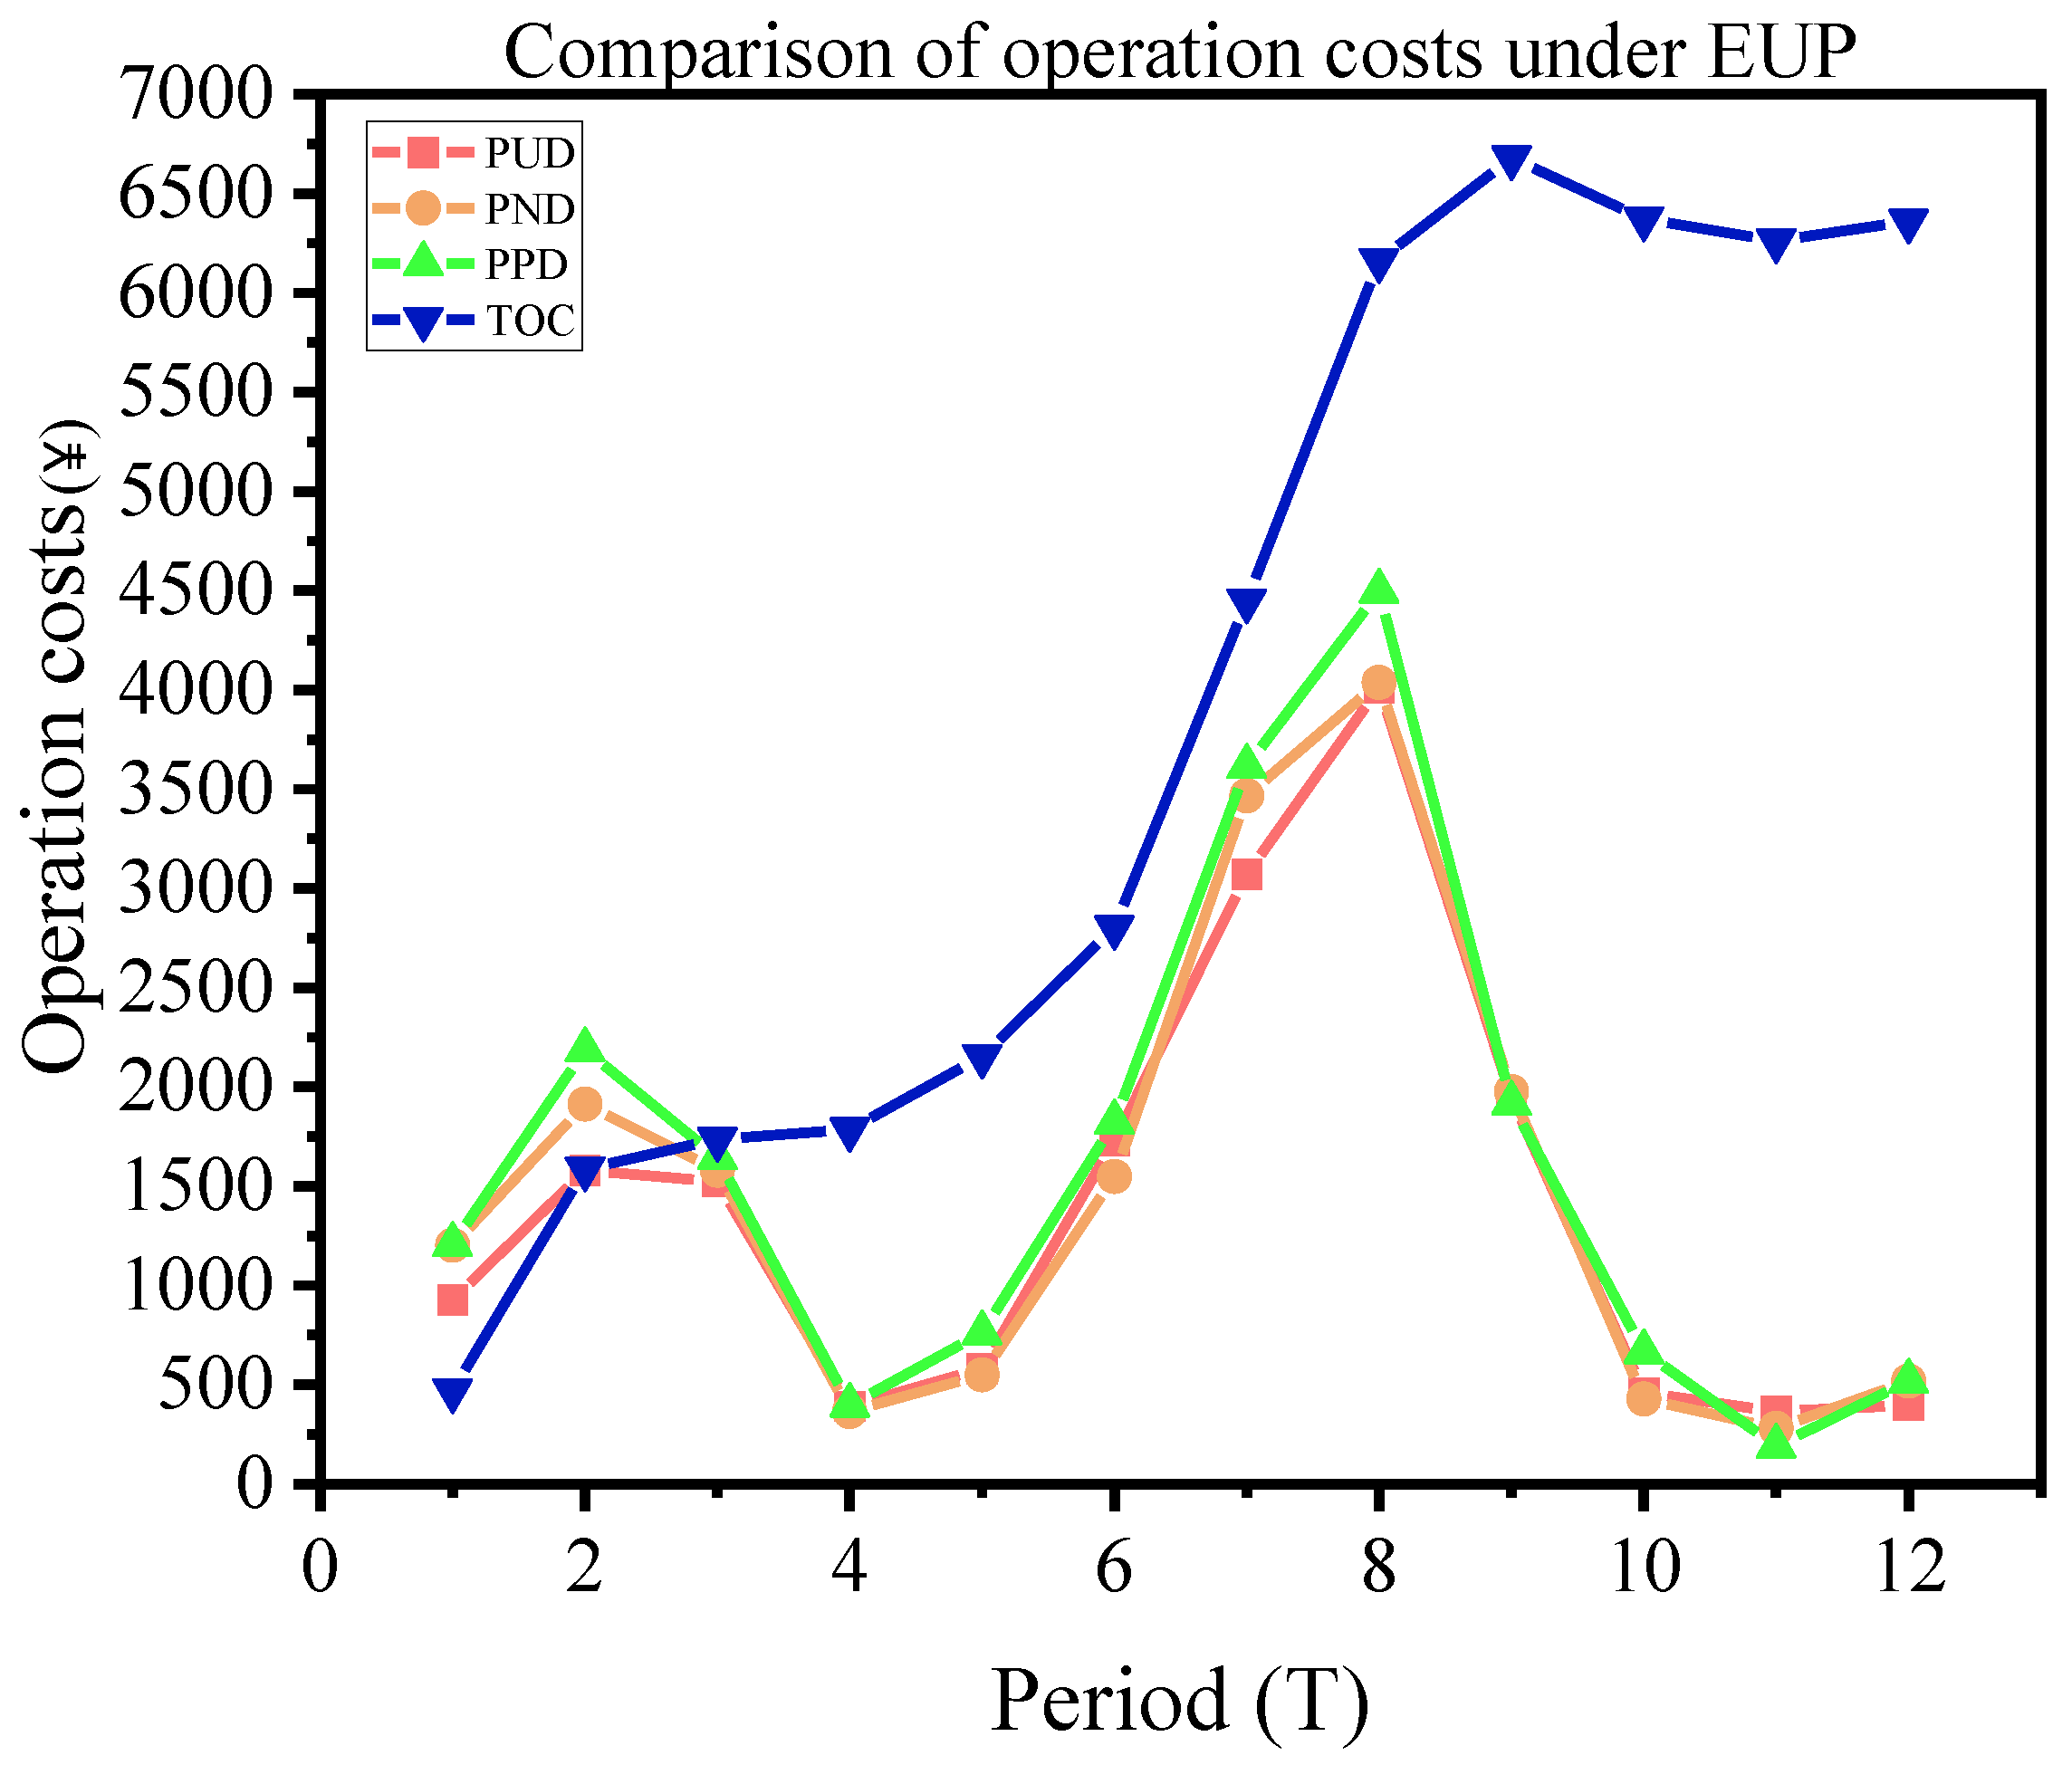
Figure 9 depicts the operation costs of both the TSEPA pattern and the SEPPA pattern for three distributions under EUP at different periods. At the beginning of the allocation operation, the operation cost of the TSEPA pattern has a slight advantage over the operation cost of the SEPPA pattern. However, after the third period, all of POC-EUP-PUD, POC-EUP-PND, and POC-EUP-PPD have a significant advantage in operation costs over the TSEPA pattern. Overall, the three distributions in EUP for the SEPPA pattern have a significant advantage in operation costs over the TSEPA pattern. Simultaneously, we vary the operation costs when supply and demand is under three distributions of the SEPPA pattern under EUP. Except for the eleventh period, the operation costs for each period showed that the highest operation cost is POC-EUP-PPD, the second highest operation cost is POC-EUP-PND, and the lowest operation cost is POC-EUP-PUD. In the seventh and eighth periods, the fluctuations in the supply and demand distribution gradually become more influential on operation costs, while in the other periods the supply and demand distribution has little influence on operation costs in general. The overall difference in operation costs when supply and demand is under the three distributions are not significant, indicating that fluctuations in supply and demand have a small impact on the operation costs of the SEPPA pattern.
In summary, the analysis leads to the conclusion that the SEPPA pattern is relatively more advantageous than the TSEPA pattern; with increasing imbalance between supply and demand, the SEPPA pattern becomes more advantageous. In general, the operation cost when supply and demand is under a Poisson distribution is the highest, followed by the operation cost when supply and demand is under a normal distribution, and the operation cost when supply and demand is under a uniform distribution is the lowest.
Further, we make a more in-depth discussion of the reasons for the performance of operation costs of the TSEPA pattern and operation costs of the SEPPA pattern when supply and demand is under three distributions. In BP and MUP, the greater the fluctuations of supply and demand for empty pallets, the higher the operation costs incurred. This occurs since volatility exacerbates the imbalance between supply and demand. This is reflected in the following two points:
- In BP, the ratio of pallet supply and demand is balanced and stable, and there are few fluctuations. The advantages of the SEPPA pattern are manifested later.
- In MUP, the costs of the TSEPA pattern are low in the early stages of decision making, since the current demand for empty pallets can still be met from inventory, and the overall number of pallets transferred is low. When the pallet transfer volume increases, the TSEPA pattern generates a large amount of storage costs, and the advantages of recycling in the SEPPA pattern become more obvious.
In EUP, supply and demand are already severely imbalanced. The change in the volume of empty pallets generated by different distributions is not enough to significantly affect the imbalance between supply and demand of empty pallets, resulting in an insignificant impact of the distribution of supply and demand for empty pallets on operation costs. In addition, due to the pallet imbalance between supply and demand, the TSEPA pattern incurs significant extra operation costs, especially a large amount of storage costs, while the SEPPA pattern relies on the pool system to ensure the supply of pallets, and to maintain the normal flow of pallets in the shipyard production process.
8. Conclusions
We analyzed the traditional shipbuilding empty pallet allocation (TSEPA) pattern. Based on this, we introduce a pallet pool system and propose a shipbuilding empty pallet pool allocation (SEPPA) pattern. Considering the green logistics concept, we propose a green empty pallet allocation strategy for shipbuilding that includes a green transportation strategy, a green inventory strategy, and a green recycling strategy.
To validate the validity of the SEPPA pattern, we constructed a shipbuilding empty pallet pool allocation model considering multiple pallets, multiple pallet service centers, and multiple periods, and designed an improved genetic algorithm to calculate the operation costs of shipbuilding empty pallet pool allocation patterns when supply and demand are in three patterns (balanced pattern, moderately unbalanced pattern, and extremely unbalanced pattern), and under three supply and demand distributions (uniform distribution, normal distribution, and Poisson distribution). Based on the case analysis for three data sets, the SEPPA pattern’s total operation costs were compared with the total operation costs of the TSEPA pattern in BP, MUP, and EUP. The results indicated that the SEPPA pattern had lower total operation costs than the TSEPA pattern, whether supply and demand was in a balanced, moderately unbalanced, or extremely unbalanced pattern. The interval of the average cost savings percentage was 56–65%, which demonstrated that the SEPPA pattern is more cost effective for empty pallet allocation operation.
We conducted a sensitivity analysis to provide insights into the shipbuilding empty pallet allocation pattern. We compared the operation costs of the TSEPA pattern with that of the SEPPA pattern when supply and demand was BP, MUP, and EUP during all twelve periods. The analysis led to the conclusion that the SEPPA pattern was relatively more advantageous in operation costs than the TSEPA pattern. Additionally, with increasing imbalance between supply and demand, the SEPPA pattern became more advantageous. We discussed the impact of three supply and demand distributions (PUD, PND, and PPD) on operation costs for the SEPPA pattern. When supply and demand was under PPD, the operation cost was the highest, followed by when supply and demand was under PND, and the operation cost was the lowest when supply and demand was under PUD. In summary, the distribution of supply and demand will affect operation costs. We analyzed the correlation between the key factors of empty pallet allocation problems in ship construction engineering and operation costs. Safety inventory levels were shown to affect the operation costs of pallet allocation under the pallet pool system, and a reasonable safety inventory interval can reduce the operation costs of empty pallet allocation. The results may provide assistance in decision making for empty pallet allocation in ship construction projects. Besides, this study may lead to useful insights for pallet managers in shipyard or other manufacturing enterprises.
Firstly, it is found that the empty pallet allocation method based on the pallet pool system has lower operation costs. Especially when shipyards require regular access to empty pallets and onsite management, the pallet pool system is indeed a good method. In fact, there are many pallet logistical service providers who can provide empty pallet allocation service, and take charge of the whole process of empty pallet distribution and recovery for shipyards, such as CHEP.
Secondly, this paper provides the variations of operation costs under different supply and demand distributions. Shipyards can coordinate the supply and demand of empty pallets required in the production process to reduce pallet operation costs.
Thirdly, for shipyards, the empty pallet safety inventory level has to find a balance point at a low level to make empty pallet allocation operation costs lower. In fact, for a production company such as a shipyard, logistical apparatus need to match production, and production cannot be affected by insufficient inventory of logistical apparatus. However, on the other hand, a high level of logistical apparatus inventory will increase the company’s operation costs.
Finally, this study represented the pallet usage required for production in a mathematical model. It may provide some reference to manufacturing companies that need empty pallet allocation for their logistical activities.
Future research directions include incorporating additional objectives beyond costs for selecting a pallet management pattern within the scope of green shipbuilding. We also acknowledge that the conclusions derived in this research are limited, as only two sizes of wooden pallets were considered. The environmental and economic impacts of wooden and plastic pallets are different. For this reason, it would be interesting to develop further research that compares the economic and environmental benefits of empty pallet allocation caused by wooden and plastic pallets in ship construction. Finally, the development of system simulation methods to better understand pallet allocation process mechanisms in shipbuilding that can handle the uncertainty of allocations can be pursued.
Author Contributions
Conceptualization, H.Y. and J.Y.; methodology, H.Y., Z.C. and X.K.; software, X.K.; validation, H.Y. and X.K.; formal analysis, H.Y.; investigation, H.Y., Z.C. and X.K.; resources, J.Y.; writing—original draft preparation, H.Y. and X.K.; writing—review and editing, H.Y., S.Y. and Z.C.; All authors have read and agreed to the published version of the manuscript.
Funding
This work is supported by “Special of the Ministry of Industry and Information Technology of China”, Grant Number MC-202009-Z03.
Institutional Review Board Statement
Not applicable.
Informed Consent Statement
Not applicable.
Data Availability Statement
Not applicable.
Acknowledgments
The authors would like to thank all reviewers and editors for their valuable comments.
Conflicts of Interest
The authors declare no conflict of interest.
References
- Koĕí, V. Comparisons of environmental impacts between wood and plastic transport pallets. Sci. Total Environ. 2019, 686, 514–528. [Google Scholar] [CrossRef] [PubMed]
- Tornese, F.; Gnoni, M.G.; Thorn, B.K.; Carrano, A.L.; Pazour, J.A. Management and logistics of returnable transport items: A review analysis on the pallet supply chain. Sustainability 2021, 13, 12747. [Google Scholar] [CrossRef]
- Zhao, Z. Discussion on green shipbuilding technology system. China Shipbuild. 2008, 49, 36–40. [Google Scholar]
- Liao, W.; Wang, T. A novel collaborative optimization model for job shop production—Delivery considering time window and carbon emission. Sustainability 2019, 11, 2781. [Google Scholar] [CrossRef] [Green Version]
- Guo, H.; Li, J.; Yang, B.; Mao, X.; Zhou, Q. Green scheduling optimization of ship plane block flow line considering carbon emission and noise. Comput. Ind. Eng. 2020, 148, 106680. [Google Scholar] [CrossRef]
- Chen, G.; Wu, X.; Li, J. Green vehicle routing and scheduling optimization of ship steel distribution cen-ter based on improved intelligent water drop algorithms. Math. Probl. Eng. 2020, 2020, 1–13. [Google Scholar]
- Qian, W.; Wang, L.; Chen, Y. Implementation strategy and effect analysis of shipbuilding shell loading palletization management. Ind. Eng. 2011, 6, 99–103. [Google Scholar]
- Li, T. Demand analysis of construction standards for large ships and high-tech ships. Shipbuild. Stand. Quality 2014, 3, 18–20. [Google Scholar]
- Ren, J.W.; Liu, B.; Wang, Z.Y. An optimization model for multi-type pallet allocation over a pallet pool. Adv. Mech. Eng. 2017, 9, 1–9. [Google Scholar] [CrossRef] [Green Version]
- Yu, L. Research on the Development Policies and Measures of Railway Pallets Transport; Beijing Jiaotong University: Beijing, China, 2008. [Google Scholar]
- Wang, Z.; Ren, J.; Ma, Y.; Zhang, H. A stochastic programming model for pallet pooling based on urban collaborative distribution system. J. Highw. Transp. Res. Dev. 2018, 35, 146–152. [Google Scholar]
- Ren, J.; Chen, C.; Gao, J.; Feng, C. An optimization model for fleet sizing and empty pallet allocation considering CO2 emissions. PLoS ONE 2020, 15, e0229544. [Google Scholar] [CrossRef] [PubMed] [Green Version]
- Roy, D.; Carrano, A.L.; Pazour, J.A.; Gupta, A. Cost-effective pallet management strategies. Transp. Res. Part E Logist. Transp. Rev. 2016, 93, 358–371. [Google Scholar] [CrossRef]
- Accorsi, R.; Baruffaldi, G.; Manzini, R.; Pini, C. Environmental impacts of reusable transport items: A case study of pallet pooling in a retailer supply chain. Sustainability 2019, 11, 3147. [Google Scholar] [CrossRef] [Green Version]
- Harris, J.S.; Worrell, J.S. Pallet Management System: A Study of the Implementation of UID/RFID Technology for Tracking Shipping Materials within the Department of Defense Distribution Network; NAVAL Postgraduate School: Monterey, CA, USA, 2008; pp. 12–13. [Google Scholar]
- Carrano, A.L.; Thorn, B.K.; Woltag, H. Characterizing the carbon footprint of wood pallet logistics. For. Prod. J. 2014, 64, 232–241. [Google Scholar] [CrossRef]
- Ren, J.; Zhang, X. Pallet recovery model based on modified pallet pool system. J. Southwest Jiaotong Univ. 2010, 2010, 482–485. [Google Scholar]
- Xu, Q. Logistics pallets pooling service supply chain system and the optimal management. China Bus. Mark. 2010, 24, 22–25. [Google Scholar]
- Zhang, Q.; Wei, J.; Cheng, G.; Wang, Z.; Yan, D.; Zhao, S. Pallet rental information system based on RFID. In Proceedings of the IEEE Conference on Industrial Electronics and Applications (ICIEA), Xi’an, China, 20 May 2009. [Google Scholar]
- Roh, M.-I.; Cha, J.-H. A block transportation scheduling system considering a minimisation of travel distance without loading of and interference between multiple transporters. Int. J. Prod. Res. 2011, 49, 3231–3250. [Google Scholar] [CrossRef]
- Zheng, J.; Jiang, Z.; Chen, Q. Block spatial scheduling modelling and application in shipbuilding. Int. J. Prod. Res. 2011, 50, 2744–2756. [Google Scholar] [CrossRef]
- Kim, B.S.; Joo, C.M. Ant colony optimization with random selection for block transportation scheduling with heterogeneous transporters in a shipyard. Int. J. Prod. Res. 2012, 50, 7229–7241. [Google Scholar] [CrossRef]
- Hu, S.; Song, W.; Kao, Y.; Ito, T.; Sun, X. A branch and bound algorithm for project scheduling problem with spatial resource constraints. Math. Probl. Eng. 2015, 9, 1–9. [Google Scholar] [CrossRef]
- Wang, C.; Mao, Y.-S.; Hu, B.-Q.; Deng, Z.-J.; Shin, J.G. Ship block transportation scheduling problem based on greedy algorithm. J. Eng. Sci. Technol. Rev. 2016, 9, 93–98. [Google Scholar] [CrossRef]
- Lin, Y. Research on Production Logistics Optimization of Ship Pipe Processing Workshop Based on Double Pallet Management; Chongqing University: Chongqing, China, 2014. [Google Scholar]
- Yang, T. Study on the Application of Lean in the Management of Pallet Consolidation in Shipyards; Jiangsu University of Science and Technology: Zhenjiang, China, 2016. [Google Scholar]
- Ren, J.; Zhang, X. Pallet recovery stochastic programming model of pallet pool system. Control. Decis. 2010, 25, 1211–1214. [Google Scholar]
- Ren, J.; Zhang, X. Two stage stochastic chance constrained programming model of pallet pool system dispatch. Control. Decis. 2011, 26, 1353–1357. [Google Scholar]
- Ren, J.; Zhang, X.; Zhang, J.; Ma, L. A multi-scenario model for pallets allocation over a pallet pool. Syst. Eng. Theory Pract. 2014, 34, 1788–1798. [Google Scholar]
- Zhou, K.; He, S.W.; Song, R.; You, L.J. Optimization model of railway empty pallet dispatching based on the mode of pallet pool. J. Beijing Jiaotong Univ. 2014, 38, 22–26. [Google Scholar]
- Ni, L.; He, Y.D.; Zhou, L.; Deng, L. Robust control optimization of triple-echelon closed-loop pallet pool system in multi-uncertain environment. J. Inf. Comput. Sci. 2015, 12, 2635–2645. [Google Scholar] [CrossRef]
- Zhou, K.; He, S.W.; Song, R.; You, L.J. Decision scheme optimization for empty pallets dispatching based on pallet pool mode. Control. Decis. 2015, 30, 2009–2013. [Google Scholar]
- Zhou, K.; He, S.W.; Song, R. Optimization for service routes of pallet service center based on the pallet pool mode. Comput. Intell. Neurosci. 2016, 2016, 1–11. [Google Scholar] [CrossRef] [Green Version]
- Sakai, K.J. Pallet pooling and environment. Logist. Mater. Handl. 2003, 8, 46–49. [Google Scholar]
- Brindley, C. Pallet math = profit$ for all: Experts study the economic feasibility of an industry cooperative pool. Pallet Enterp. 2010, 4, 22–26. [Google Scholar]
- Auguston, K.A. Is the U.S. ready for pallet pooling. Mod. Mater. Handl. 1991, 46, 76. [Google Scholar]
- Don, M. What makes reusable packaging systems work. Logist. Inf. Manag. 1996, 9, 39–42. [Google Scholar]
- Witt, C.E. Economics of pallet rental. Mater. Handl. Eng. 1999, 54, 47–48. [Google Scholar]
- Ji, M.; Wang, Q.; Zhang, X.; Zhang, H. Optimal model for allocation and transportation strategies of empty containers between coastal ports. Oper. Res. Manag. Sci. 2014, 23, 80–89. [Google Scholar]
- Haitao, B.; Chao, S. A route planning algorithm for aerocraft based on elitist genetic algorithm. Command. Control. Simul. 2010, 32, 42–46. [Google Scholar]
Figure 1.
Pallet flow in a TSEPA. Empty pallets flow in the traditional pallet allocation pattern.

Figure 2.
Pallet flow in the SEPPA pattern. Empty pallets recycling is considered in the SEPPA pattern.
Figure 2.
Pallet flow in the SEPPA pattern. Empty pallets recycling is considered in the SEPPA pattern.

Figure 3.
The SEPPA green strategy framework.

Figure 4.
The convergence graph of the algorithm. The objective function value gradually converges with the increase in the number of genetic iterations.
Figure 4.
The convergence graph of the algorithm. The objective function value gradually converges with the increase in the number of genetic iterations.

Figure 5.
Comparison of TOCs and POCs.

Figure 6.
Impact of safety inventory level on operation costs.

Figure 7.
Comparison of operation costs under BP.

Figure 8.
Comparison of operation costs under MUP.

Figure 9.
Comparison of operation costs under EUP.


Table 1.
Unit cost. Unit transportation cost, unit inventory cost, unit handling cost, and unit shortage cost are present.
Table 1.
Unit cost. Unit transportation cost, unit inventory cost, unit handling cost, and unit shortage cost are present.
| Pallet Service Center A | Pallet Service Center B | Concentrated Supply Center | ||
|---|---|---|---|---|
| Unit transportation cost (¥) | Unit transportation cost (¥) | Unit inventory cost (¥) | Unit handling cost (¥) | Unit shortage cost (¥) |
| 1.5 | 1.6 | 3.2 | 1.2 | 50 |
Table 2.
Supply and demand data set 1.
| T | S | Db | Dmb | Deb | Db-S | Dmb-S | Deb-S |
|---|---|---|---|---|---|---|---|
| 1 | 5656 | 5822 | 5822 | 5822 | 166 | 166 | 166 |
| 2 | 6162 | 6224 | 6224 | 6224 | 62 | 62 | 62 |
| 3 | 6086 | 5880 | 5782 | 5718 | −206 | −304 | −368 |
| 4 | 5964 | 6052 | 6052 | 6052 | 88 | 88 | 88 |
| 5 | 5910 | 5726 | 5624 | 5512 | −184 | −286 | −398 |
| 6 | 5862 | 6126 | 6126 | 6126 | 264 | 264 | 264 |
| 7 | 5788 | 5576 | 5474 | 5376 | −212 | −314 | −412 |
| 8 | 5632 | 5852 | 5852 | 5852 | 220 | 220 | 220 |
| 9 | 6208 | 6010 | 5882 | 5804 | −198 | −326 | −404 |
| 10 | 6456 | 6518 | 6518 | 6518 | 62 | 62 | 62 |
| 11 | 6442 | 6286 | 6236 | 6114 | −156 | −206 | −328 |
| 12 | 6218 | 6312 | 6312 | 6312 | 94 | 94 | 94 |
Table 3.
Supply and demand data set 2.
| T | S | Db | Dmb | Deb | Db-S | Dmb-S | Deb-S |
|---|---|---|---|---|---|---|---|
| 1 | 3306 | 3408 | 3408 | 3408 | 102 | 102 | 102 |
| 2 | 506 | 562 | 562 | 562 | 56 | 56 | 56 |
| 3 | 1428 | 1476 | 1476 | 1476 | 48 | 48 | 48 |
| 4 | 3812 | 3650 | 3572 | 3516 | −162 | −240 | −296 |
| 5 | 3624 | 3456 | 3368 | 3310 | −168 | −256 | −314 |
| 6 | 3726 | 3886 | 3886 | 3886 | 160 | 160 | 160 |
| 7 | 3606 | 3432 | 3344 | 3272 | −174 | −262 | −334 |
| 8 | 3614 | 3802 | 3802 | 3802 | 188 | 188 | 188 |
| 9 | 4118 | 3964 | 3888 | 3790 | −154 | −230 | −328 |
| 10 | 4252 | 4454 | 4454 | 4454 | 202 | 202 | 202 |
| 11 | 4248 | 4096 | 4028 | 3902 | −152 | −220 | −346 |
| 12 | 3922 | 3976 | 3976 | 3976 | 54 | 54 | 54 |
Table 4.
Supply and demand data set 3.
| T | S | Db | Dmb | Deb | Db-S | Dmb-S | Deb-S |
|---|---|---|---|---|---|---|---|
| 1 | 4078 | 4202 | 4202 | 4202 | 124 | 124 | 124 |
| 2 | 4362 | 4248 | 4106 | 3906 | −114 | −256 | −456 |
| 3 | 4432 | 4486 | 4486 | 4486 | 54 | 54 | 54 |
| 4 | 4582 | 4654 | 4654 | 4654 | 72 | 72 | 72 |
| 5 | 4436 | 4642 | 4642 | 4642 | 206 | 206 | 206 |
| 6 | 4354 | 4162 | 4068 | 3974 | −192 | −286 | −380 |
| 7 | 4210 | 3954 | 3822 | 3696 | −256 | −388 | −514 |
| 8 | 4064 | 3798 | 3662 | 3528 | −266 | −402 | −536 |
| 9 | 4436 | 4624 | 4624 | 4624 | 188 | 188 | 188 |
| 10 | 4658 | 4734 | 4734 | 4734 | 76 | 76 | 76 |
| 11 | 4622 | 4658 | 4658 | 4658 | 36 | 36 | 36 |
| 12 | 4466 | 4538 | 4538 | 4538 | 72 | 72 | 72 |
Table 5.
SEPPA pattern total operation costs. POC in BP, MUP, and EUP under PUD, PND, and PPD for 3 data sets.
Table 5.
SEPPA pattern total operation costs. POC in BP, MUP, and EUP under PUD, PND, and PPD for 3 data sets.
| DATA SET | 1 | 2 | 3 | ||||||
|---|---|---|---|---|---|---|---|---|---|
| Pattern | PUD | PND | PPD | PUD | PND | PPD | PUD | PND | PPD |
| BP | ¥8146 | ¥8463 | ¥9041 | ¥6552 | ¥6802 | ¥7382 | ¥10,112 | ¥10,992 | ¥11,398 |
| MUP | ¥11,204 | ¥11,629 | ¥12,518 | ¥9033 | ¥9386 | ¥10,133 | ¥13,325 | ¥13,933 | ¥15,073 |
| EUP | ¥14,155 | ¥14,737 | ¥15,878 | ¥11,582 | ¥12,052 | ¥12,980 | ¥16,780 | ¥17,520 | ¥18,839 |
Table 6.
TOC and ACSP data.
| TOC | ACSP | |||||
|---|---|---|---|---|---|---|
| Pattern | Data set 1 | Data set 2 | Data set 3 | PUDACSP | PNDACSP | PPDACSP |
| BP | ¥23,071 | ¥19,015 | ¥21,298 | 61% | 59% | 56% |
| MUP | ¥32,735 | ¥26,612 | ¥33,112 | 64% | 62% | 59% |
| EUP | ¥41,311 | ¥33,152 | ¥46,821 | 65% | 64% | 61% |
Publisher’s Note: MDPI stays neutral with regard to jurisdictional claims in published maps and institutional affiliations. |
© 2022 by the authors. Licensee MDPI, Basel, Switzerland. This article is an open access article distributed under the terms and conditions of the Creative Commons Attribution (CC BY) license (https://creativecommons.org/licenses/by/4.0/).
Share and Cite
MDPI and ACS Style
Yu, H.; Yang, J.; Kang, X.; Cong, Z.; Yao, S. Empty Pallet Allocation Optimization in Shipbuilding Using a Pallet Pool System. Sustainability 2022, 14, 5479. https://0-doi-org.brum.beds.ac.uk/10.3390/su14095479
AMA Style
Yu H, Yang J, Kang X, Cong Z, Yao S. Empty Pallet Allocation Optimization in Shipbuilding Using a Pallet Pool System. Sustainability. 2022; 14(9):5479. https://0-doi-org.brum.beds.ac.uk/10.3390/su14095479
Chicago/Turabian StyleYu, Hao, Jiaqi Yang, Xipei Kang, Zhe Cong, and Siwei Yao. 2022. "Empty Pallet Allocation Optimization in Shipbuilding Using a Pallet Pool System" Sustainability 14, no. 9: 5479. https://0-doi-org.brum.beds.ac.uk/10.3390/su14095479
Note that from the first issue of 2016, this journal uses article numbers instead of page numbers. See further details here.