Article

The Influence of Different Types of Environmental Enrichment on the Performance and Welfare of Broiler Chickens and the Possibilities of Real-Time Monitoring via a Farmer-Assistant System

1
Institute for Animal Nutrition, University of Veterinary Medicine Hanover, Foundation, 30173 Hannover, Germany
2
Department of Nutrition and Nutritional Deficiency Diseases, Faculty of Veterinary Medicine, Mansoura University, Mansoura 35516, Egypt
3
Department of Hygiene and Zoonoses, Faculty of Veterinary Medicine, Mansoura University, Mansoura 35516, Egypt
4
Farm for Education and Research Ruthe, University of Veterinary Medicine Hannover, Foundation, 31157 Ruthe/Sarstedt, Germany
5
Clinic for Poultry, University of Veterinary Medicine Hannover, Foundation, 30559 Hannover, Germany
6
Institute for Animal Breeding and Genetics, University of Veterinary Medicine Hannover, Foundation, 30559 Hannover, Germany
7
Institute of Animal Hygiene, Animal Welfare and Farm Animal Behaviour, University of Veterinary Medicine Hannover, Foundation, 30625 Hannover, Germany
*
Author to whom correspondence should be addressed.
Sustainability 2022, 14(9), 5727; https://0-doi-org.brum.beds.ac.uk/10.3390/su14095727
Submission received: 13 April 2022 / Revised: 30 April 2022 / Accepted: 5 May 2022 / Published: 9 May 2022
(This article belongs to the Special Issue Recent Advances in Poultry Management)

Abstract

:
The aim of this study is to evaluate the influence of environmental enrichment on the growth performance, litter and/or air quality as well as animal welfare indicators of broilers. Control groups (CG) and trial groups (TG) were housed under identical conditions during six fattening runs, with the TG having three types of environmental enrichment and a Farmer-Assistant System (FAS). A representative number of 50 birds were weighed and litter samples were taken at d 14, 21 and 28. Additionally, the same broilers were examined for foot pad dermatitis (FPD) on those days. The average bodyweight of the birds in the CG was significantly lower (1671 g) only at d 28 compared to TG (1704 g); at d 14, d 21 and d 33 at the slaughterhouse, no significant differences were observed. The dry matter content in the litter did not significantly differ between CG and TG. Birds housed in CG had significantly higher FPD scores at d 14 (1.24) and d 21 (2.19) compared to those housed in TG (0.73 and 1.52, respectively). No effects on air quality parameters, such as CO2 and NH3, were seen between the groups. Overall, our study shows no negative influences of environmental enrichment on growth performance, litter and air quality.

1. Introduction

Broiler production has been the fastest growing sector in animal production worldwide over the past decades, driven by the increasing demand for animal-sourced foods by the rapid population growth, [1] and a change in dietary preferences [2,3]. In 2020, the world broiler meat production exceeded 100 million tonnes [4]. Broilers grow fast with a high efficiency compared to other farm animals, because they consume relatively little feed per kg of produced kg of meat compared to, for example, pigs and cattle [5]. Broiler meat is consumed across cultural and religious communities [6]. However, citizens and consumers, particularly in developed countries such as those in Europe, are increasingly concerned about the living conditions of intensely farmed chickens and the health and welfare problems encountered in densely populated broiler houses with flocks of 20,000 birds and more [7].
These houses offer very little structural orientation for the birds [8]. The animals can freely move on a flat, usually concrete floor covered with litter material, such as chopped straw or wood chips, peat or something similar [9]. They are offered feed and water from automatic feeding systems. A ventilation system combined with a heating system provides ambient indoor temperatures for optimal growth rates. In this barren environment [10] with high stocking density, typical production diseases, often addressed as technopathies or cumulative disorders, such as lameness or foot pad dermatitis (FPD) [11] and deep skin dermatitis as well as sudden cardiac death [12], culminate in the last week of the production cycle.
To avoid or ease these problems that impair the welfare of the birds [13] various measures and attempts have been undertaken [14,15,16,17,18,19,20]. These problems can seriously affect productivity, with animal losses and degraded meat quality. Initially, research was carried out to mainly address factors of nutrition [14,15], but in recent years, attention has been paid more and more to housing conditions [16,17]. Due to their fast growth combined with low activity, the animals easily develop lameness and other pathologies, such as FPD, particularly in combination with wet litter [18]. Consequently, birds may suffer from pain and their well-being and health status are reduced, which also results in economic losses for the farmers [19,20].
A solution, or at least an improvement, was seen in the so-called “environmental enrichment”, which has been defined as “an improvement in the biological functioning of captive animals resulting from modifications to their environment” [21]. It has been shown in previous studies that environmental enrichment can be used to target problems of low complexity of structure and can therefore increase animal welfare [8,22,23,24]. It is part of the natural behaviour of birds and broiler chickens to be eager to climb and sit on perches or other structures off the ground [25,26,27]. This is presumably related to the wildlife strategy of their ancestors to avoid predators [26,28]. Elevated structures allow species-specific behaviours and the broilers have the possibility to choose several different seating positions [29]. These elements and activities may tackle the well-known problem in conventional chicken houses, i.e., the chickens are inactive for approximately 80% of their time [30,31] when not eating or drinking. Movement and choosing several different seating positions can help to distribute the load on the foot pads, while also help to increase muscle activity [32] and reduce lameness [24,33] and FPD [34].
Enrichment options, which have been under research in recent years, are higher places such as small elevated perforated or non-perforated floors, perches [22,27] and straw bales [35], which trigger activity and direct pecking behaviour to straw stems. However, not every tested enrichment element suits the purpose perfectly [36]. Some recent studies have shown that straw bales, for example, while being well-accepted for seating broilers, can also lead to an increase in FPD [20,37].
A common difficulty in assessing animal welfare in commercial broiler flocks is their often large numbers of birds [38]. Modern technology can offer new options of real-time monitoring of not only the birds, but also the climate and everything related to the animals’ environment. Especially the high data density generated by this monitoring as well as the possible earlier detection of irregularities could contribute to higher animal welfare [39,40]. Nevertheless, it has to be taken into consideration that these systems could also be used for increasing productivity in addition to the main focus of improving animal welfare [39]. The focus of animal welfare evaluations has often been on “outcome” measures [40], but the climate also has a considerable influence on animal welfare as well as animal health [41]. Thus, a more intensive monitoring can also contribute to improve environmental conditions.
The aim of this study is to test, characterise and improve possible options to offer environmental enrichment in broiler houses. The focus in this paper is to evaluate the influence of environmental enrichment on animal welfare and growth performance with the help of an FAS. The large amount of continuously measured climate data were analysed to evaluate the effects of possible higher numbers of birds in enriched areas. By collecting litter samples, the influence of the environmental enrichment on litter quality was evaluated. Moisture was the main focus, as it has an influence on the condition of the foot pads [42]. Furthermore, the foot pads of individual animals were scored in order to investigate the influence of the environmental enrichment and to give an estimate of the impairment of the well-being of the birds resulting from these injuries.

2. Materials and Methods

2.1. Animals and Diets

2.1.1. Animals

In this study, broilers were raised as hatched in a barn on the Farm for Education and Research in Ruthe, University of Veterinary Medicine Hannover, Foundation, Hannover, Germany. Chicks of the same age and genetics (Ross 308) were distributed randomly between two groups (control group = CG and trial group = TG) on the same day and at the same time. The broilers were housed for 6 fattening runs, with each run having a control and trial group consisting of 8100 birds each. With 16,200 birds in each fattening group, a total number of 97,200 birds were housed in this trial. The length of each of the 6 fattening runs was 33 days.

2.1.2. Diets

The birds were fed ad libitum and had free access to water. A commercial pelleted diet (MEGA Tierernährung GmbH & Co. KG, Visbek, Germany), based on wheat and soybean meal, was offered in a three-phase feeding programme (Table 1). The first phase was the “starter diet”, which was offered until d 7 of life, and then exchanged for the “grower I diet”. After d 20 of life, “grower II” was introduced, which was fed until d 29, and finally the “finisher diet” was fed until d 33.

2.2. Experimental Design and Housing

The broilers were raised for 33 days in two separate, but identically designed, broiler houses at the same time under controlled environmental housing conditions. The barn for each group was 30 m long and 16 m wide.
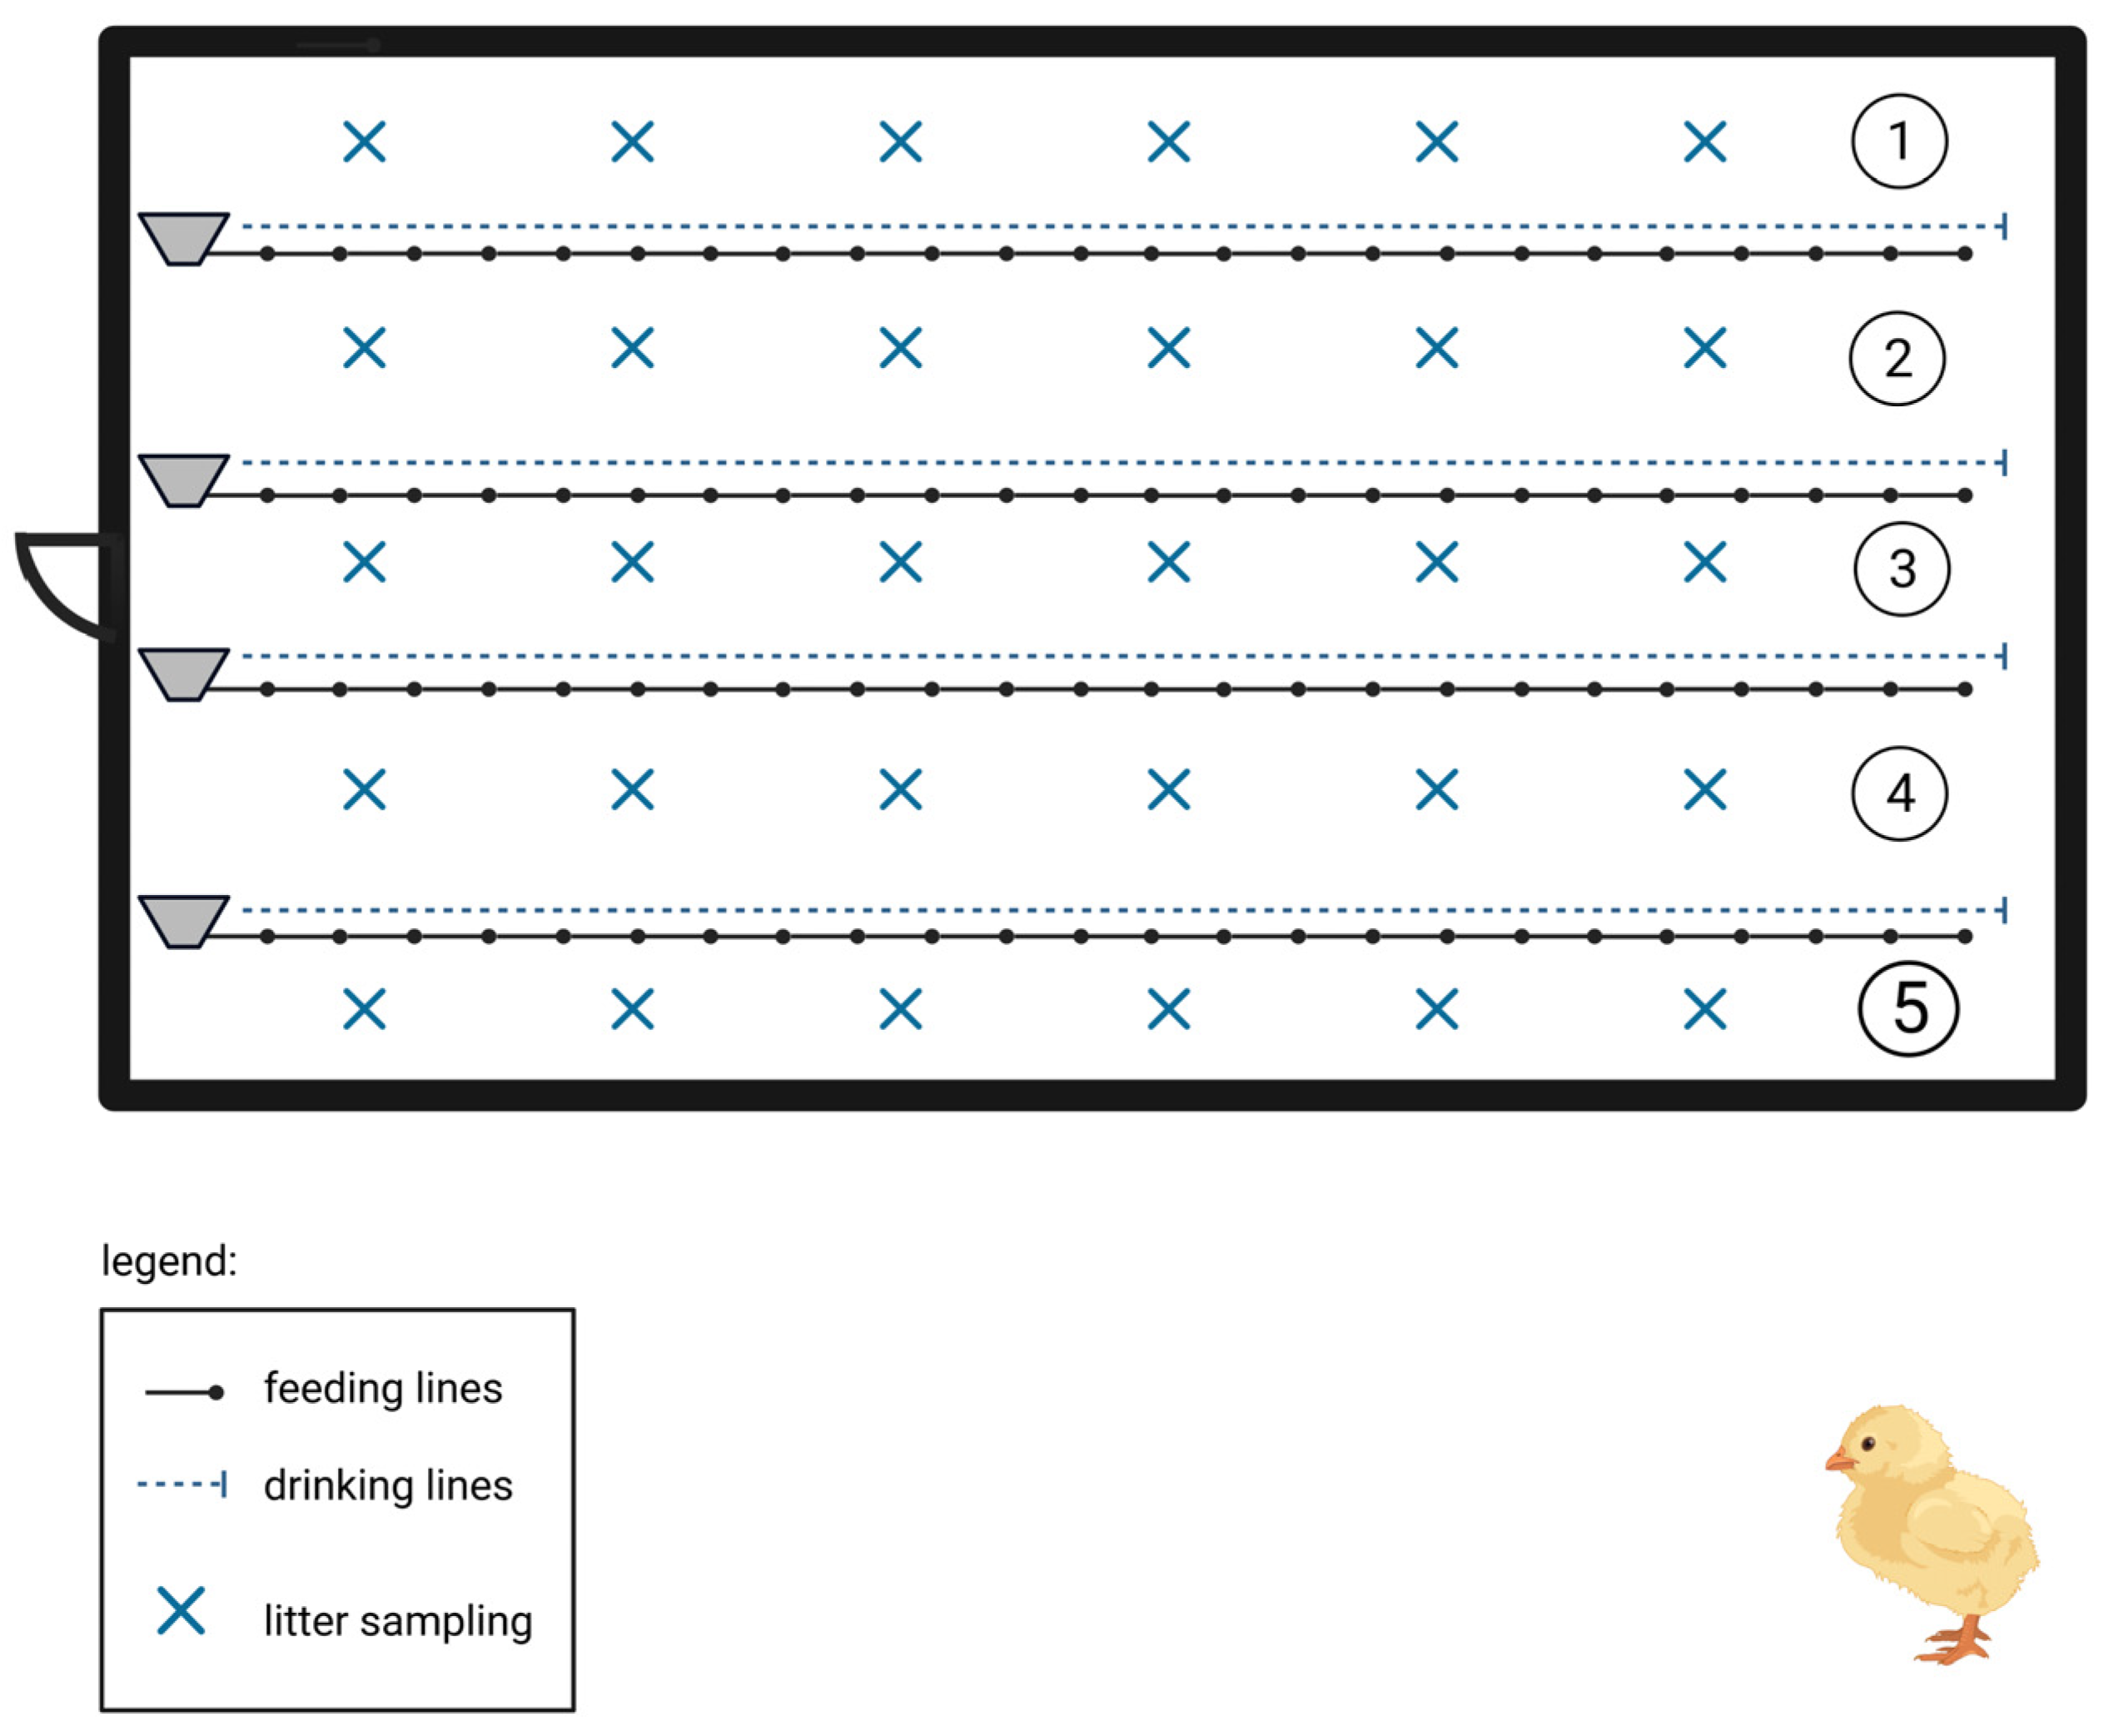
The feed was provided in four conventional feeding lines (Big Dutchman International GmbH, Vechta, Germany) with four conventional water lines (LUBING Maschinenfabrik Ludwig Bening GmbH & Co. KG, Barnstorf, Germany) next to them (Figure 1). The water lines were equipped with drinking nipples (LUBING Maschinenfabrik Ludwig Bening GmbH & Co. KG). Figure 1 shows an overview of the barn and the different areas.
The chicks were housed on a litter composed of conventional wood shavings (GOLDSPAN®, Goldspan GmbH and Co. KG, Goldenstedt, Germany).
The light programme was 24 h light at d 0. At d 1, the light was turned off from 23:00 to 03:00, and at d 2 from 22:00 to 04:00. From d 3 onwards, the dark period was between 21:00 and 05:00. After d 21, the dark period was shortened to the period from 22:00 until 04:00.
The air temperature at d 1 was 33.5 °C and was successively lowered gradually until d 33 to 23 °C. The barn was heated with a gas air-heating system. The air temperature was measured with temperature and humidity sensors, which were used to control the negative pressure ventilation system.
The birds were vaccinated via the drinking water at d 12 against Newcastle Disease (Poulvac ND Hitchner B1; Zoetis Deutschland GmbH, Berlin, Germany), at d 18 against Gumboro (AviPro Precise, Elanco Animal Health, Bad Homburg, Germany) and at d 20 against infectious bronchitis with the virus strain Ma5 (Nobilis IB Ma5, Intervet Deutschland GmbH, Unterschleißheim, Germany).

2.3. Experimental Treats

2.3.1. Environmental Enrichment

During the trial, three different types of environmental enrichment were used (Figure 2, Figure 3 and 
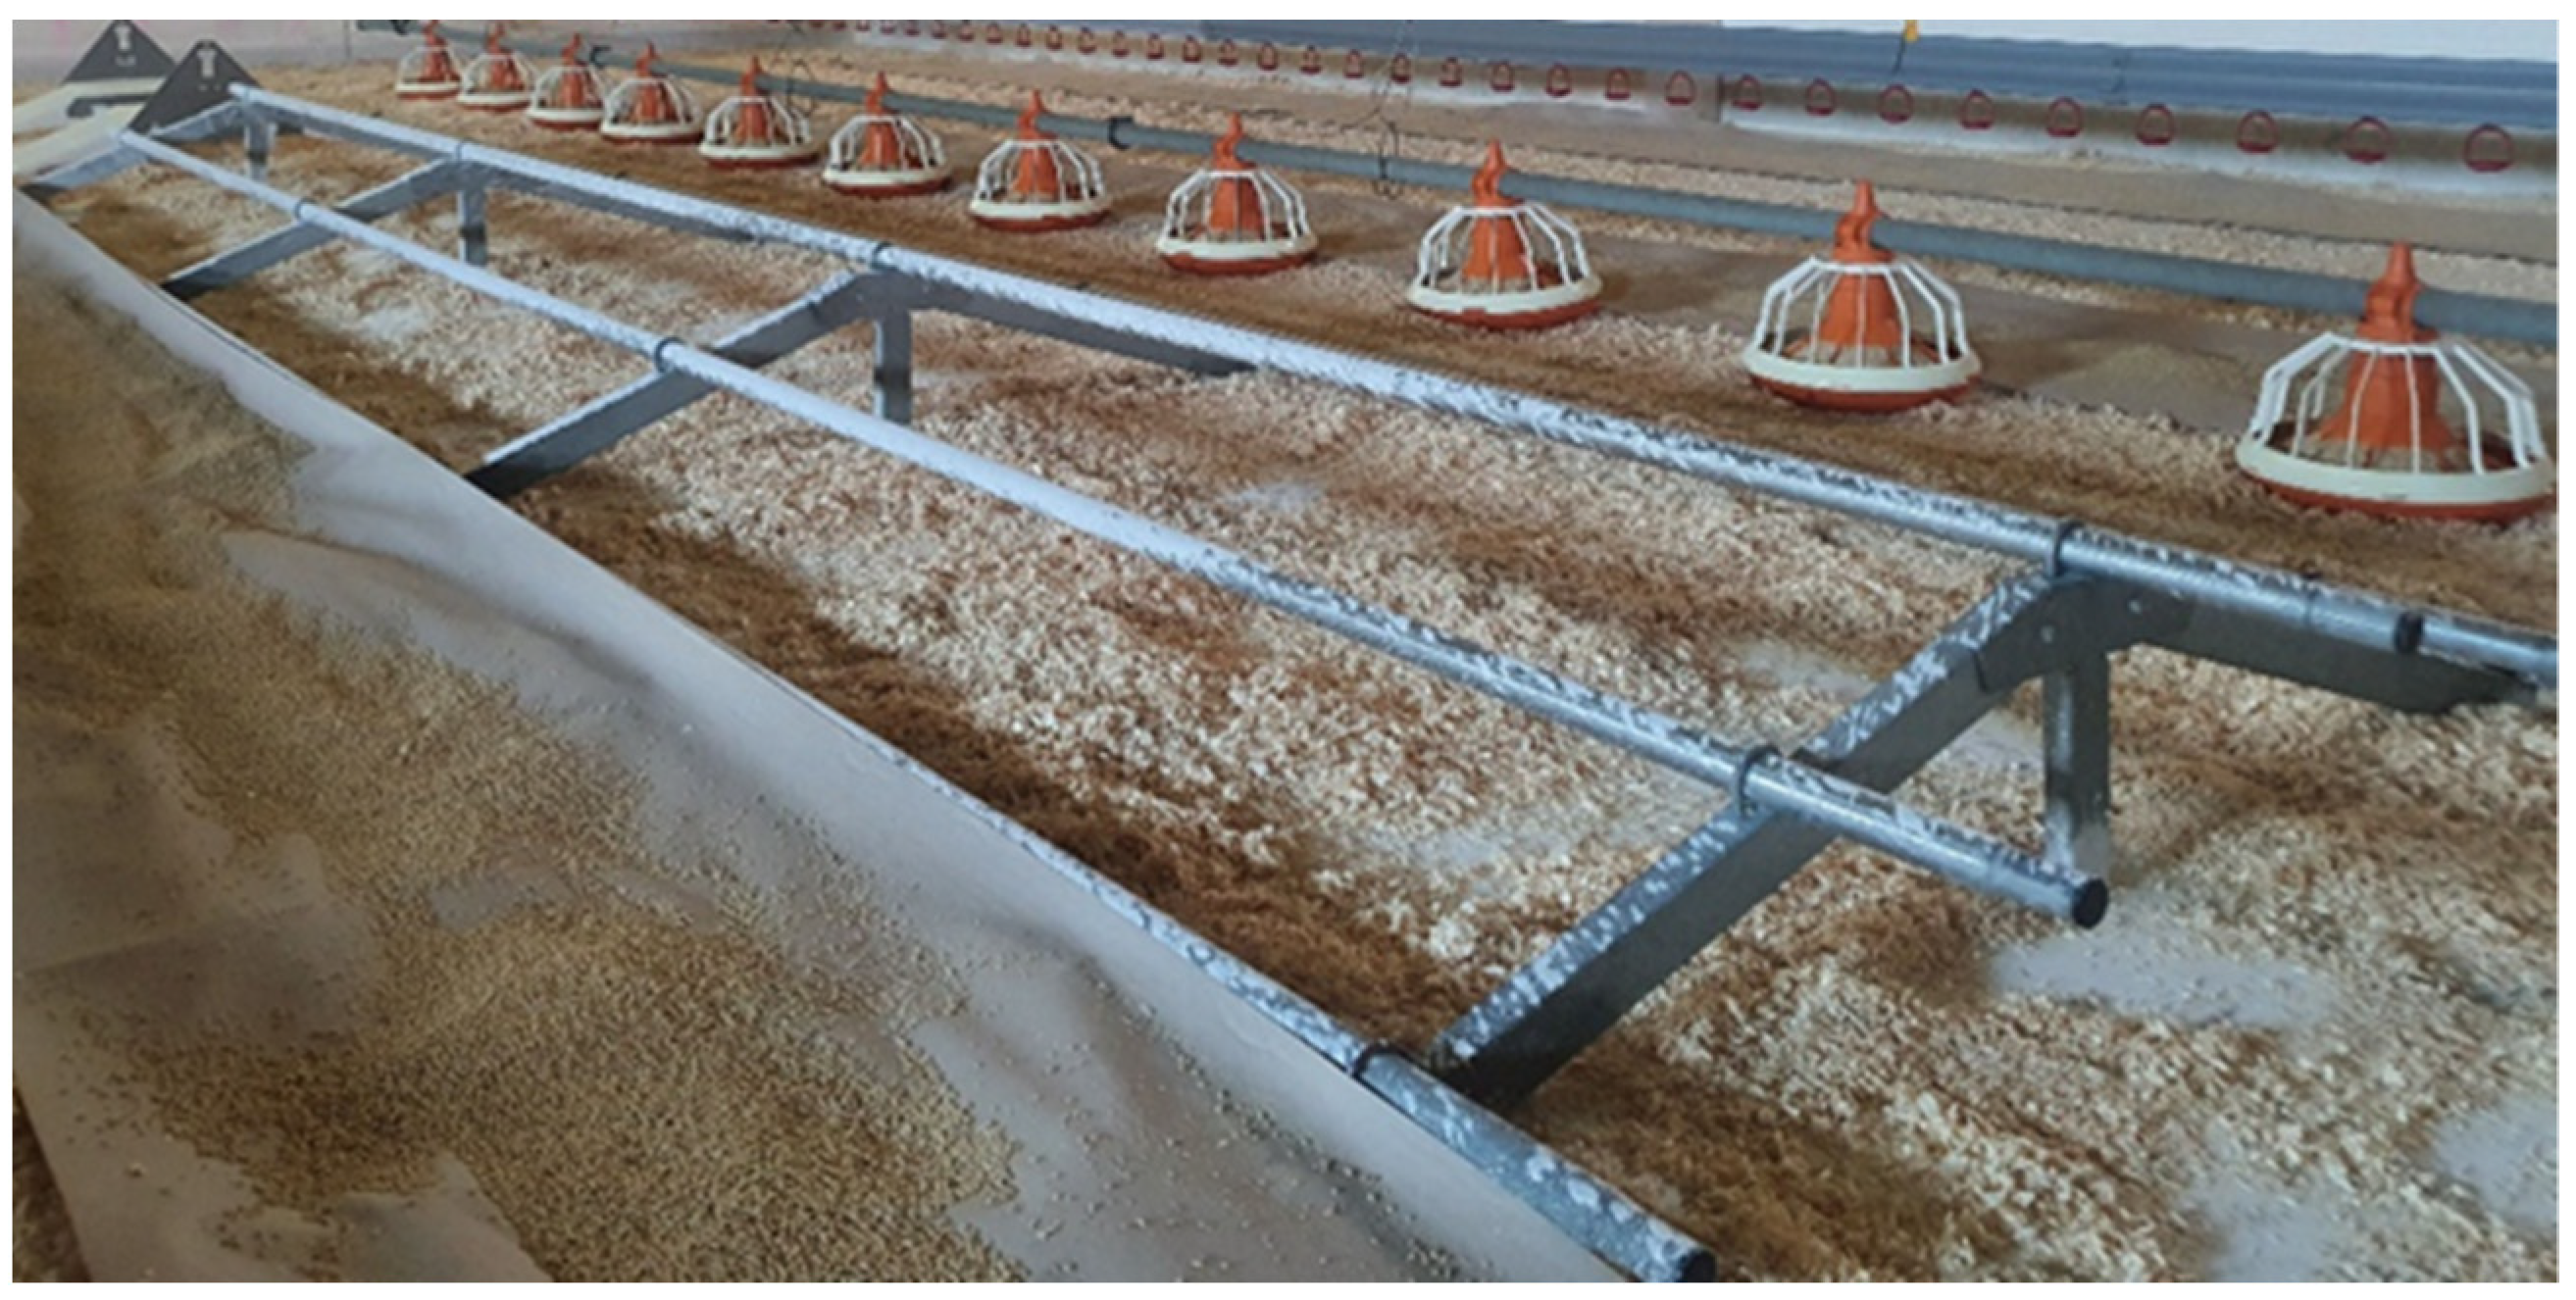
Figure 4). The first type was the so-called “A-Reuter” (Big Dutchman International GmbH, Vechta, Germany). It consisted of five round perches made of metal, which were mounted on a triangular framework. The dimensions of the perches and, therefore, the whole construction were 5.60 m long by 1.40 m wide.
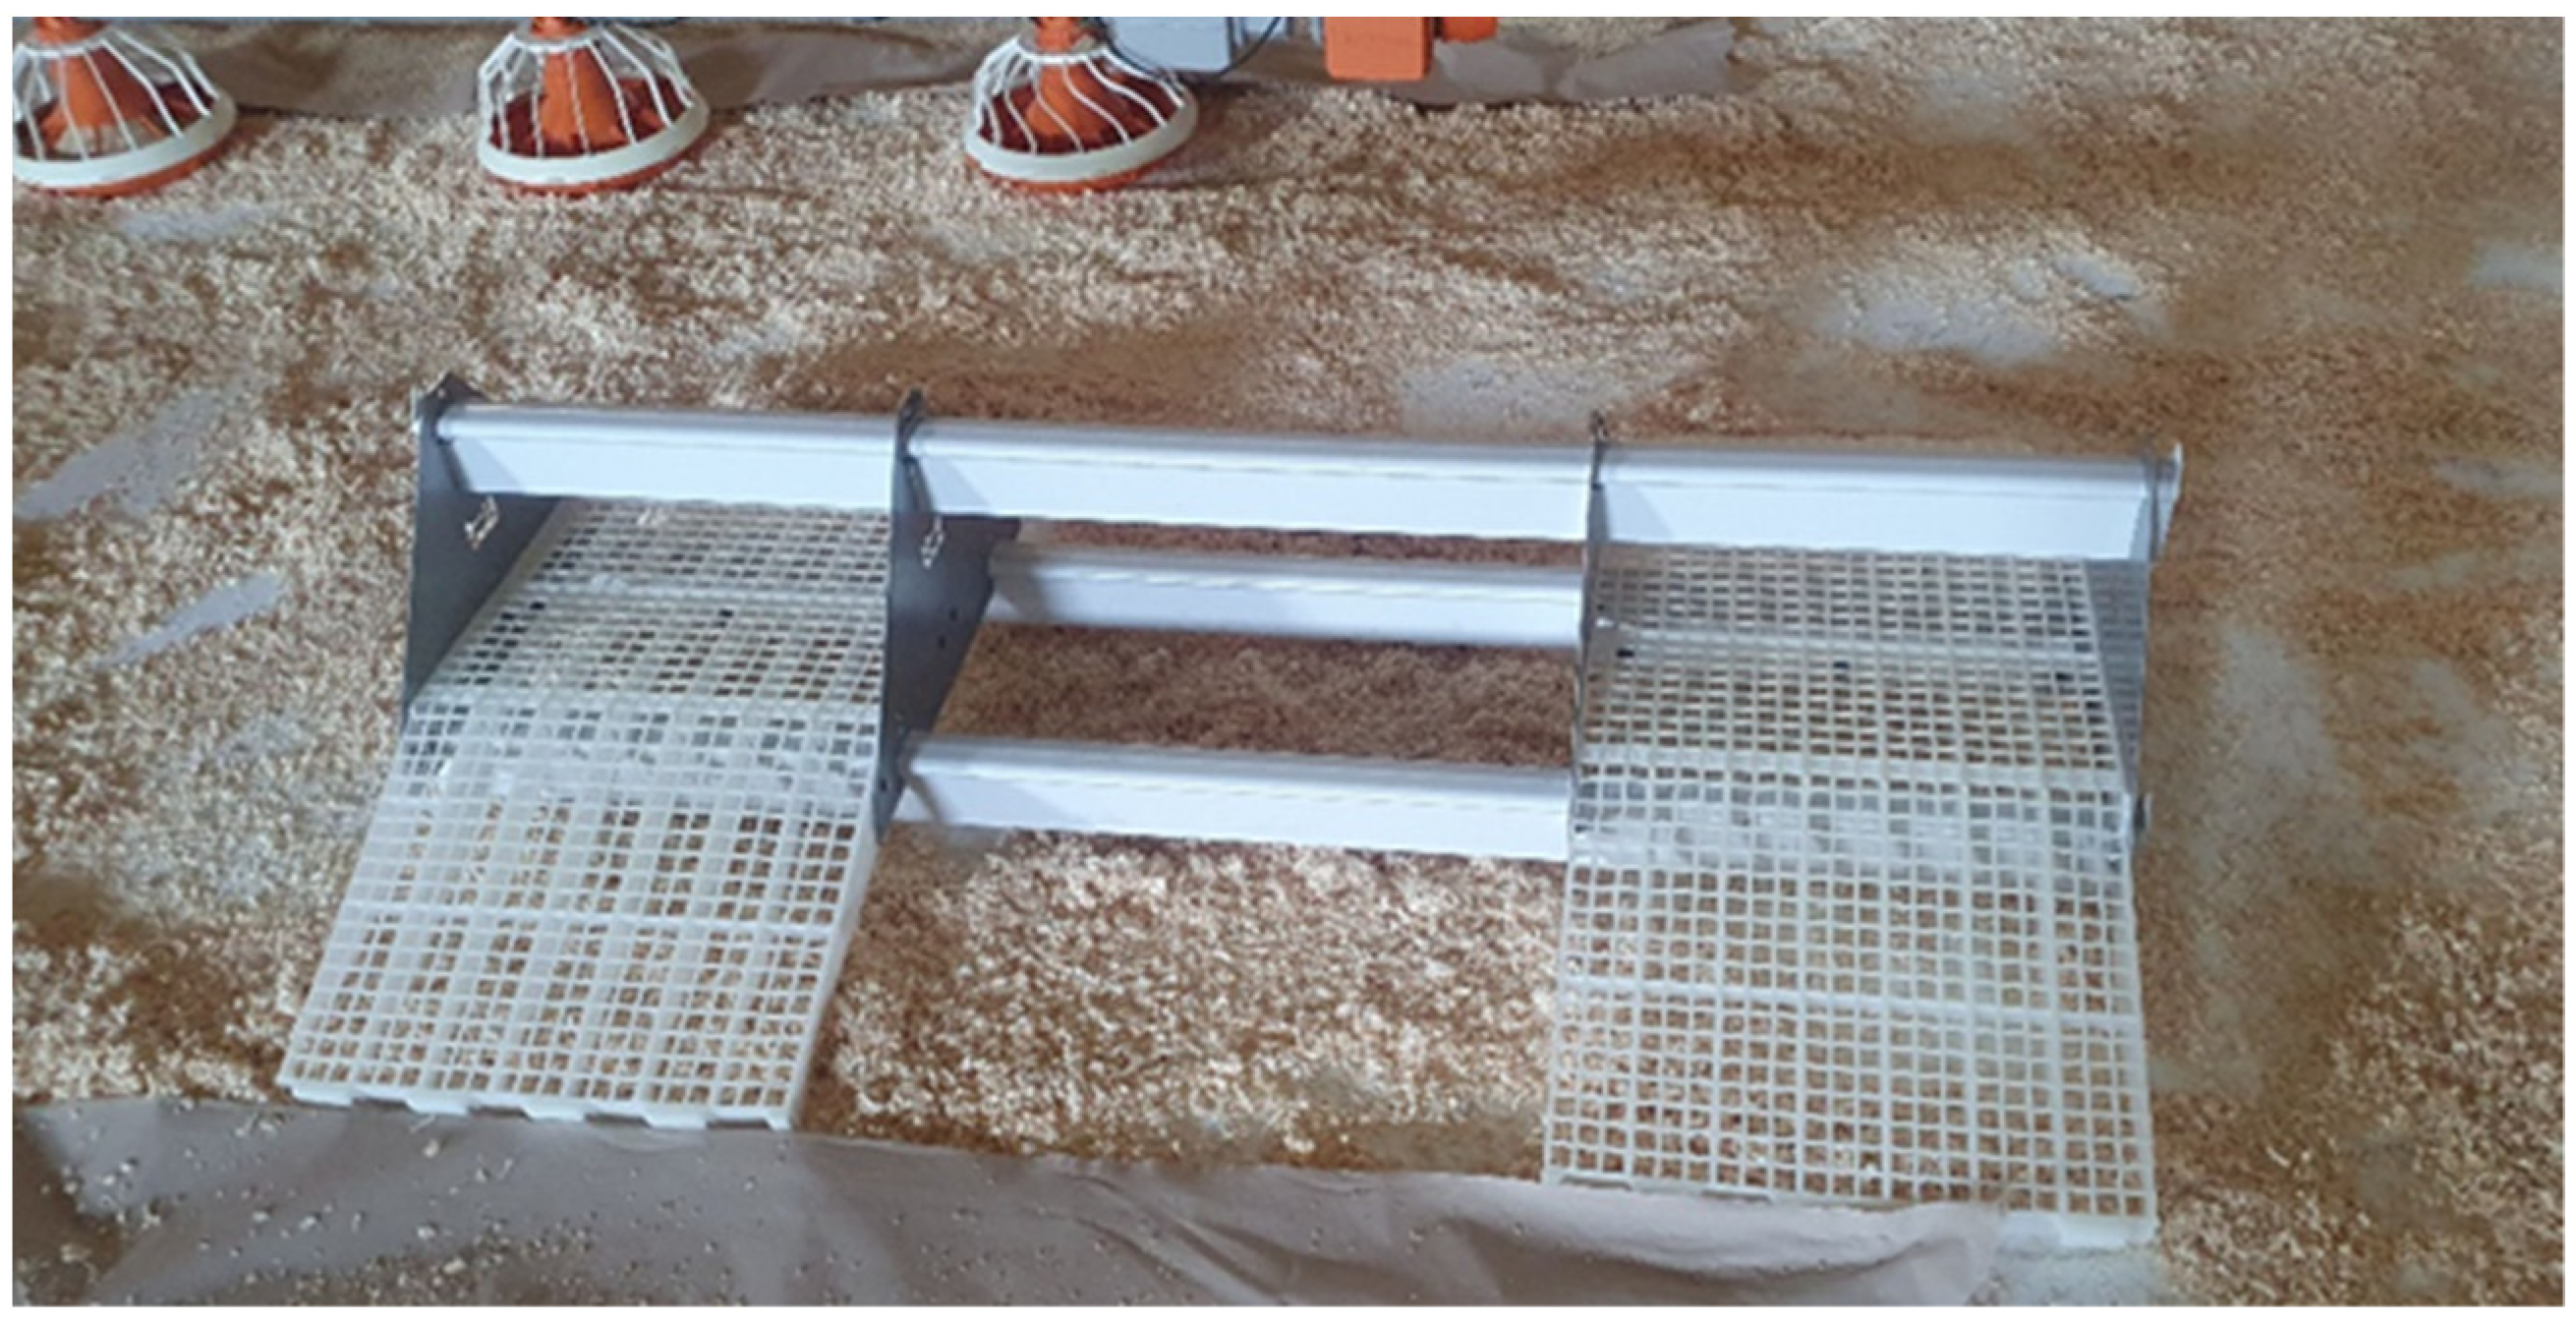
The second environmental enrichment used was the “Hybrid” (Hölscher + Leuschner GmbH & Co. Kg, Emsbüren, Germany), which was a combination of perches and elevated planes. It consisted of two elevated planes on each side, which were accessible via two ramps, each on either side. Both were 248 mm wide and 1012 mm long. The planes were connected via three perches, each of which was 1.5 m in length. Two perches were mounted under the planes, leaving a space of 992 mm between the inner edges of the planes. The third perch was mounted above the planes and had a triangular framework to hold it. All perches were aligned at right angles towards the planes. The perches were 52 mm wide and 78 mm high, with a rounded top part.
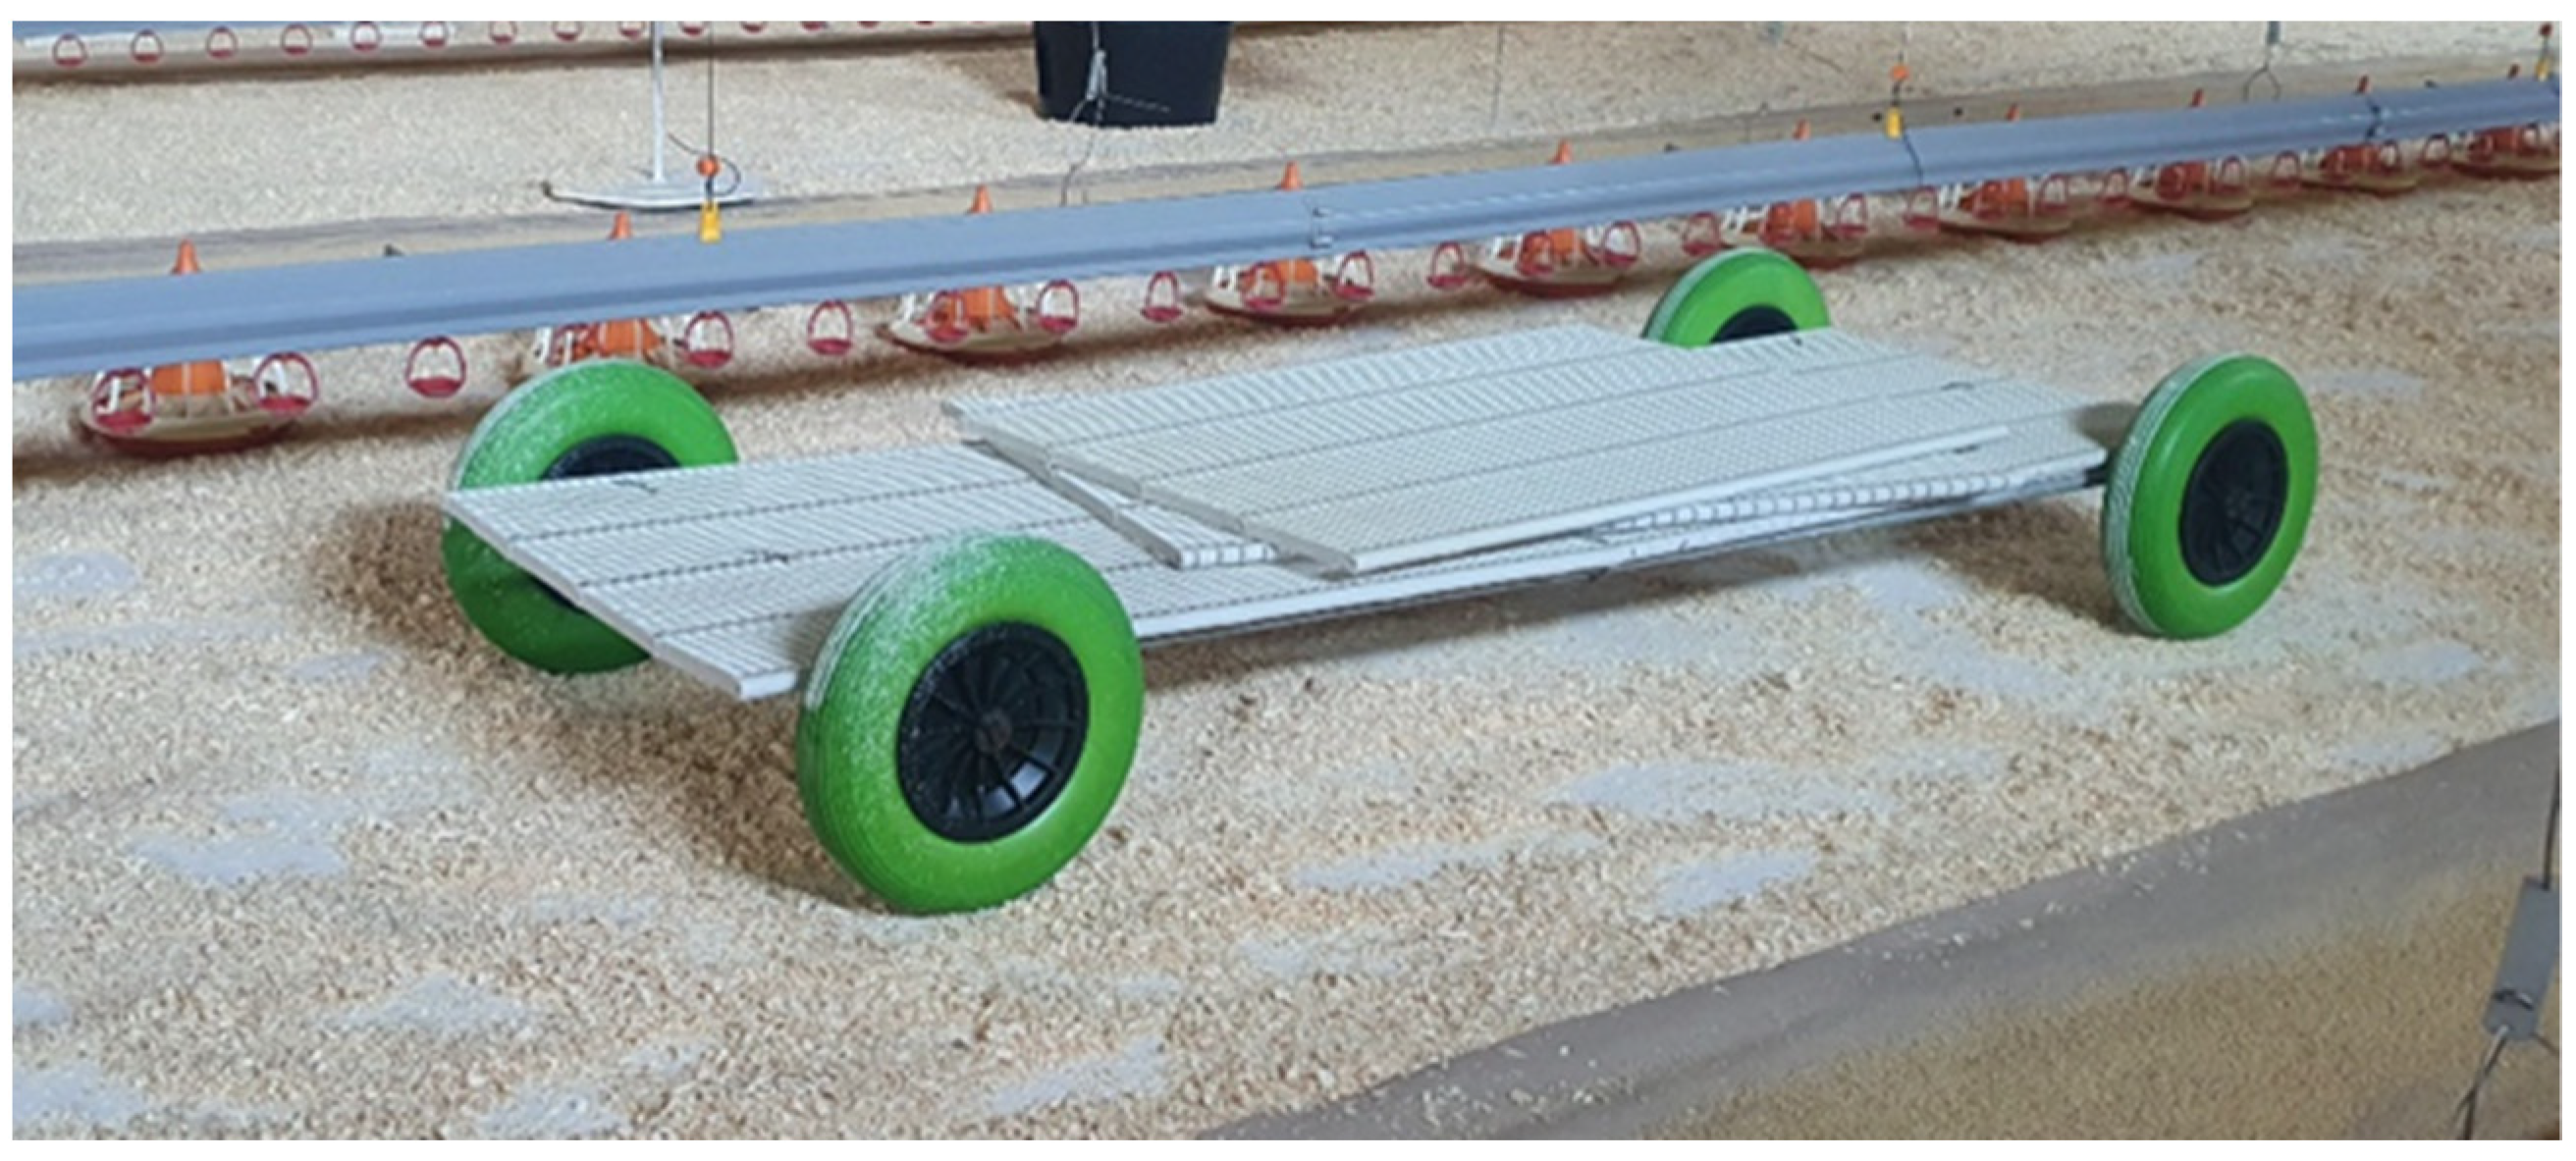
The third environmental enrichment was the “Plateau” as an elevated plane variant. It consisted of two grids mounted on a rectangular framework. The framework was supported by two carriage axles with two tyres each. Each grid had a length of 1.20 m and a width of 0.75 m, making the whole enrichment 2.40 m long. On both of the long sides, there was a ramp, also consisting of one of the grids.
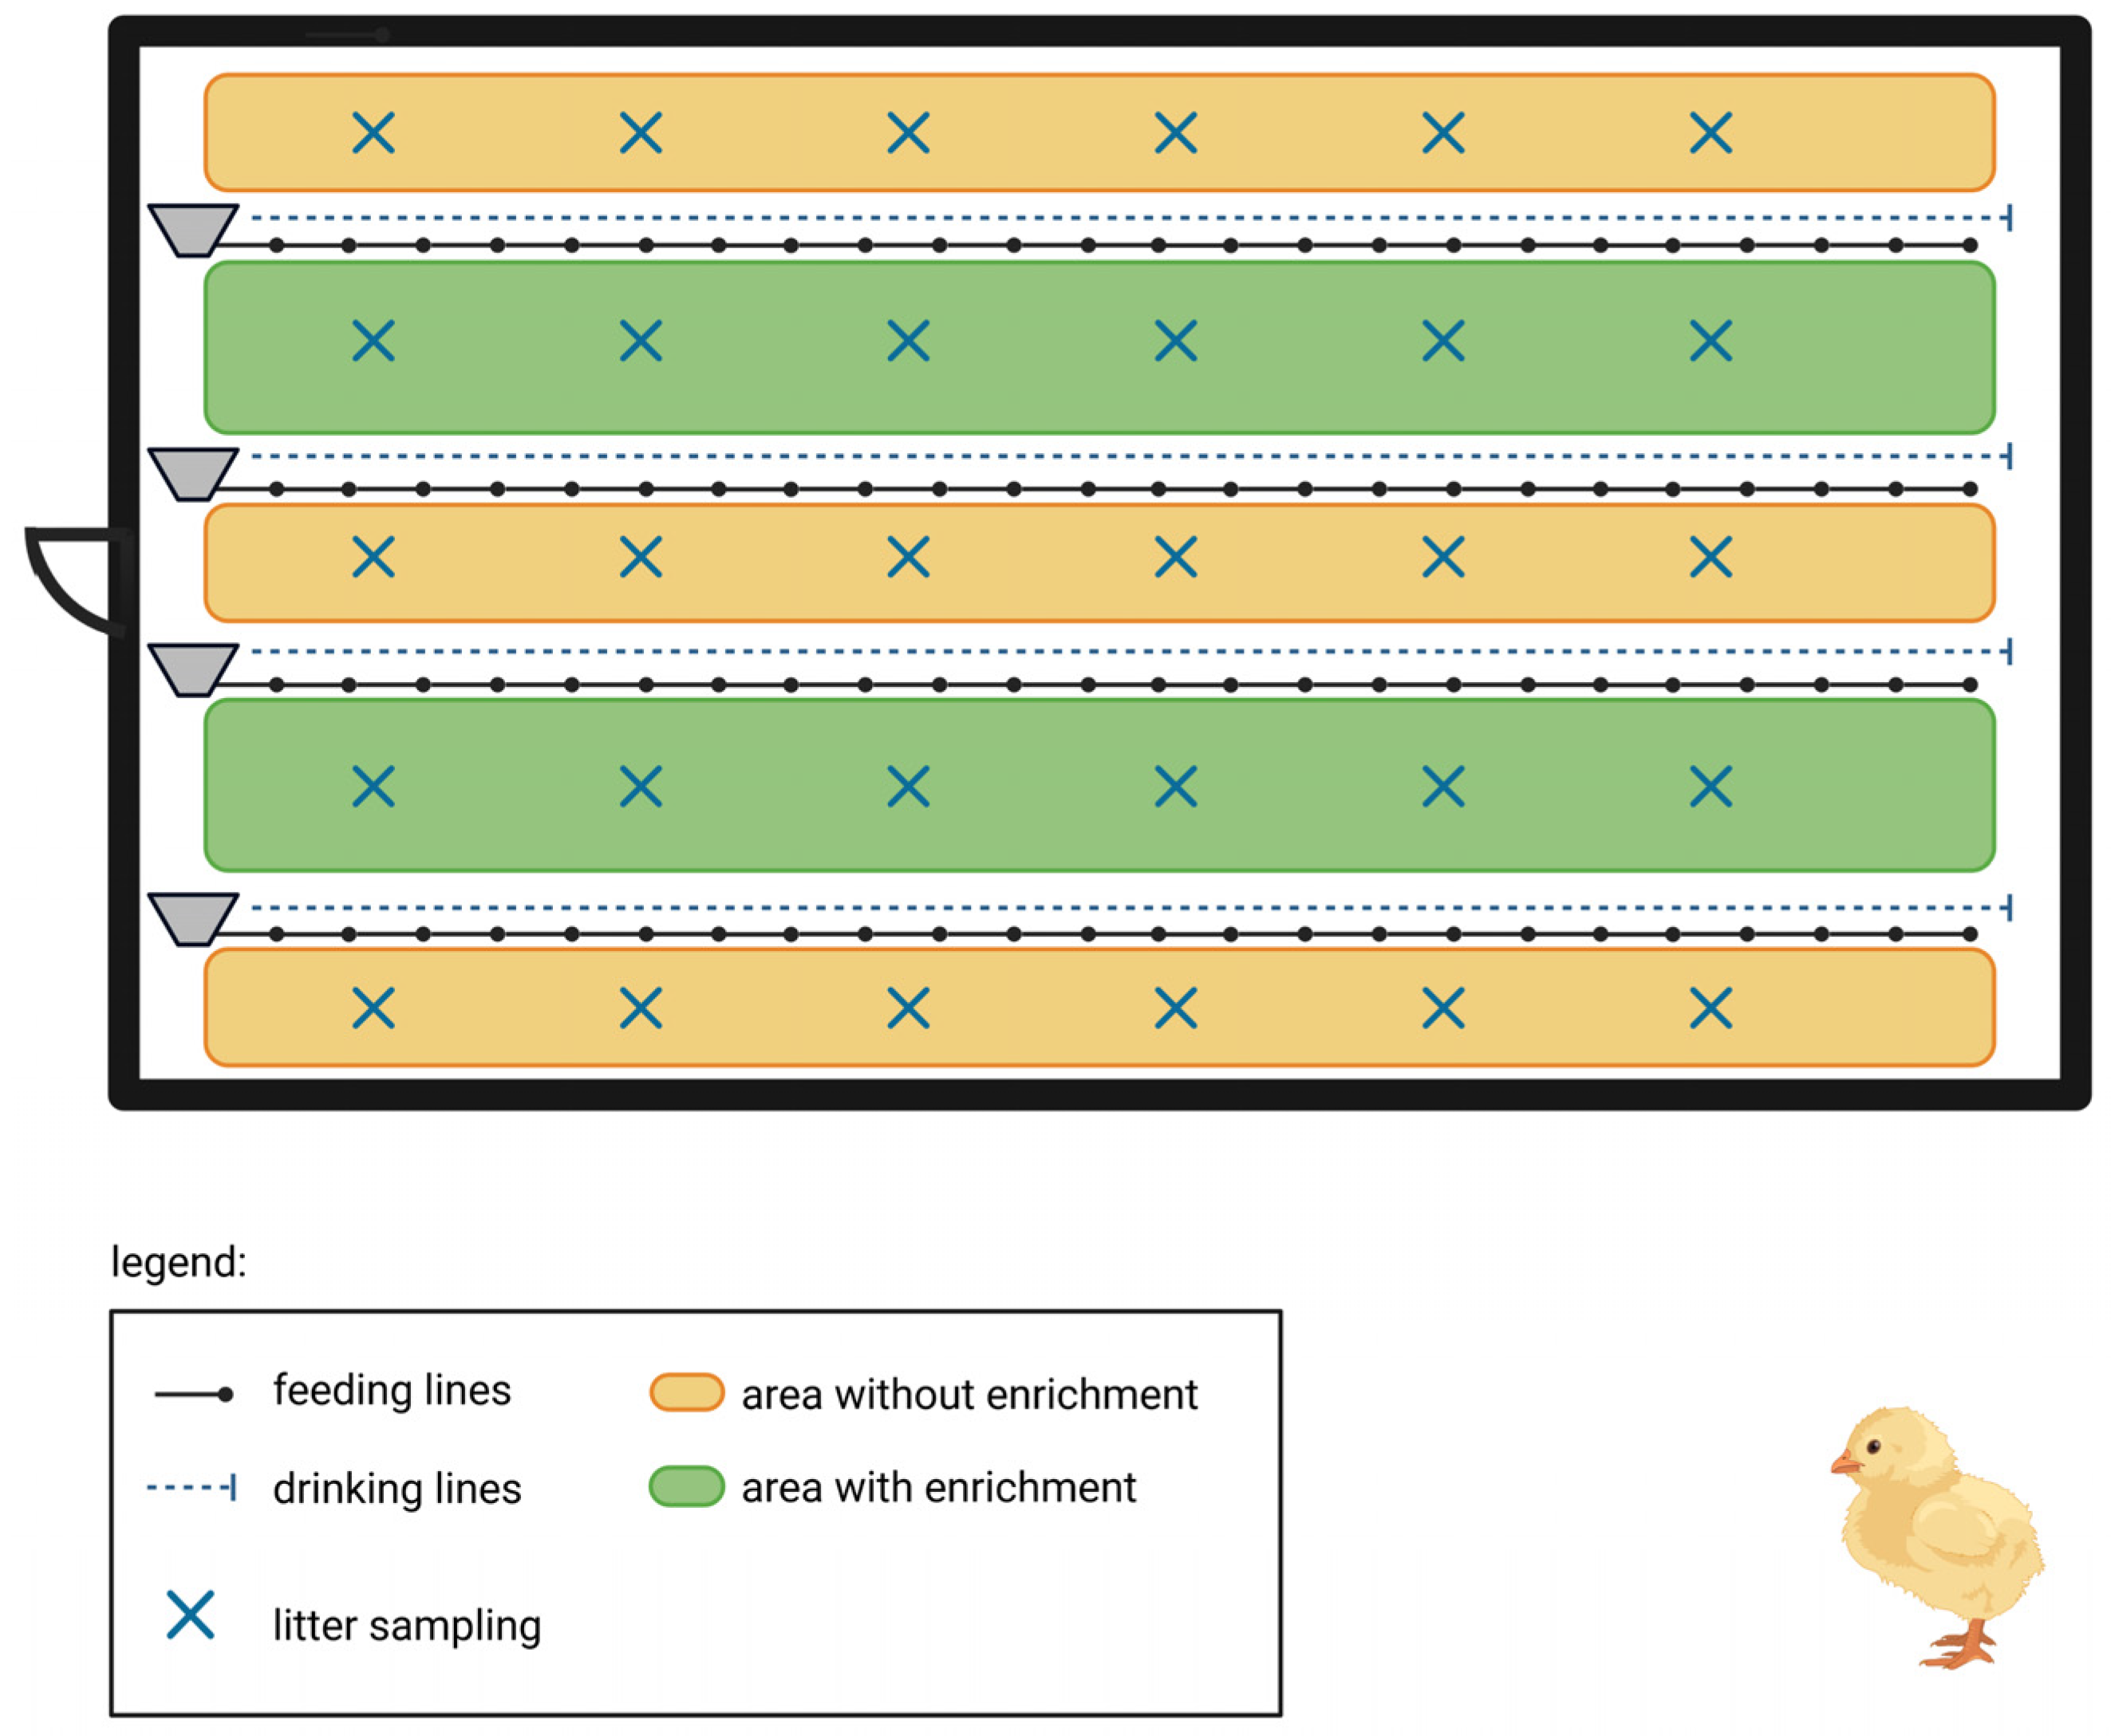
During each trial run, all of the three different environmental enrichments were used and placed in three different positions within the barn: A, B and C. In each of the following trial runs, the positions of the enrichments were changed in a clockwise direction so that A became B, B became C and C became A. This was performed to exclude any negative effects of the positioning.

2.3.2. Farmer-Assistant System

The Farmer-Assistant System (FAS) is a mobile, ceiling-based livestock robot that runs on rails attached to the ceiling of the barn. It consists of top and bottom boxes, which are connected by a telescope arm. The top part contains the battery, the engine, the driving wheels and the top camera, which provides an overview of the stall. The rails allow the robot to permanently circulate through the barn and monitor the broilers continuously. The bottom box is equipped with sensors, which permanently measure air temperature, relative humidity of the air, wind velocity, carbon dioxide (CO2), ammonia (NH3), light and noise 70 cm above the barn floor. It does not influence the behaviour of the birds. The robot delivers climate data for each square metre of the barn. The bottom box also contains one bottom and two side cameras for a more detailed monitoring of the broilers. All data are stored in a protected, cloud-based system mapped across the barn floor and presented to the farmers regularly in a daily report.

2.4. Measurements

2.4.1. Growth Performance and Slaughter Data

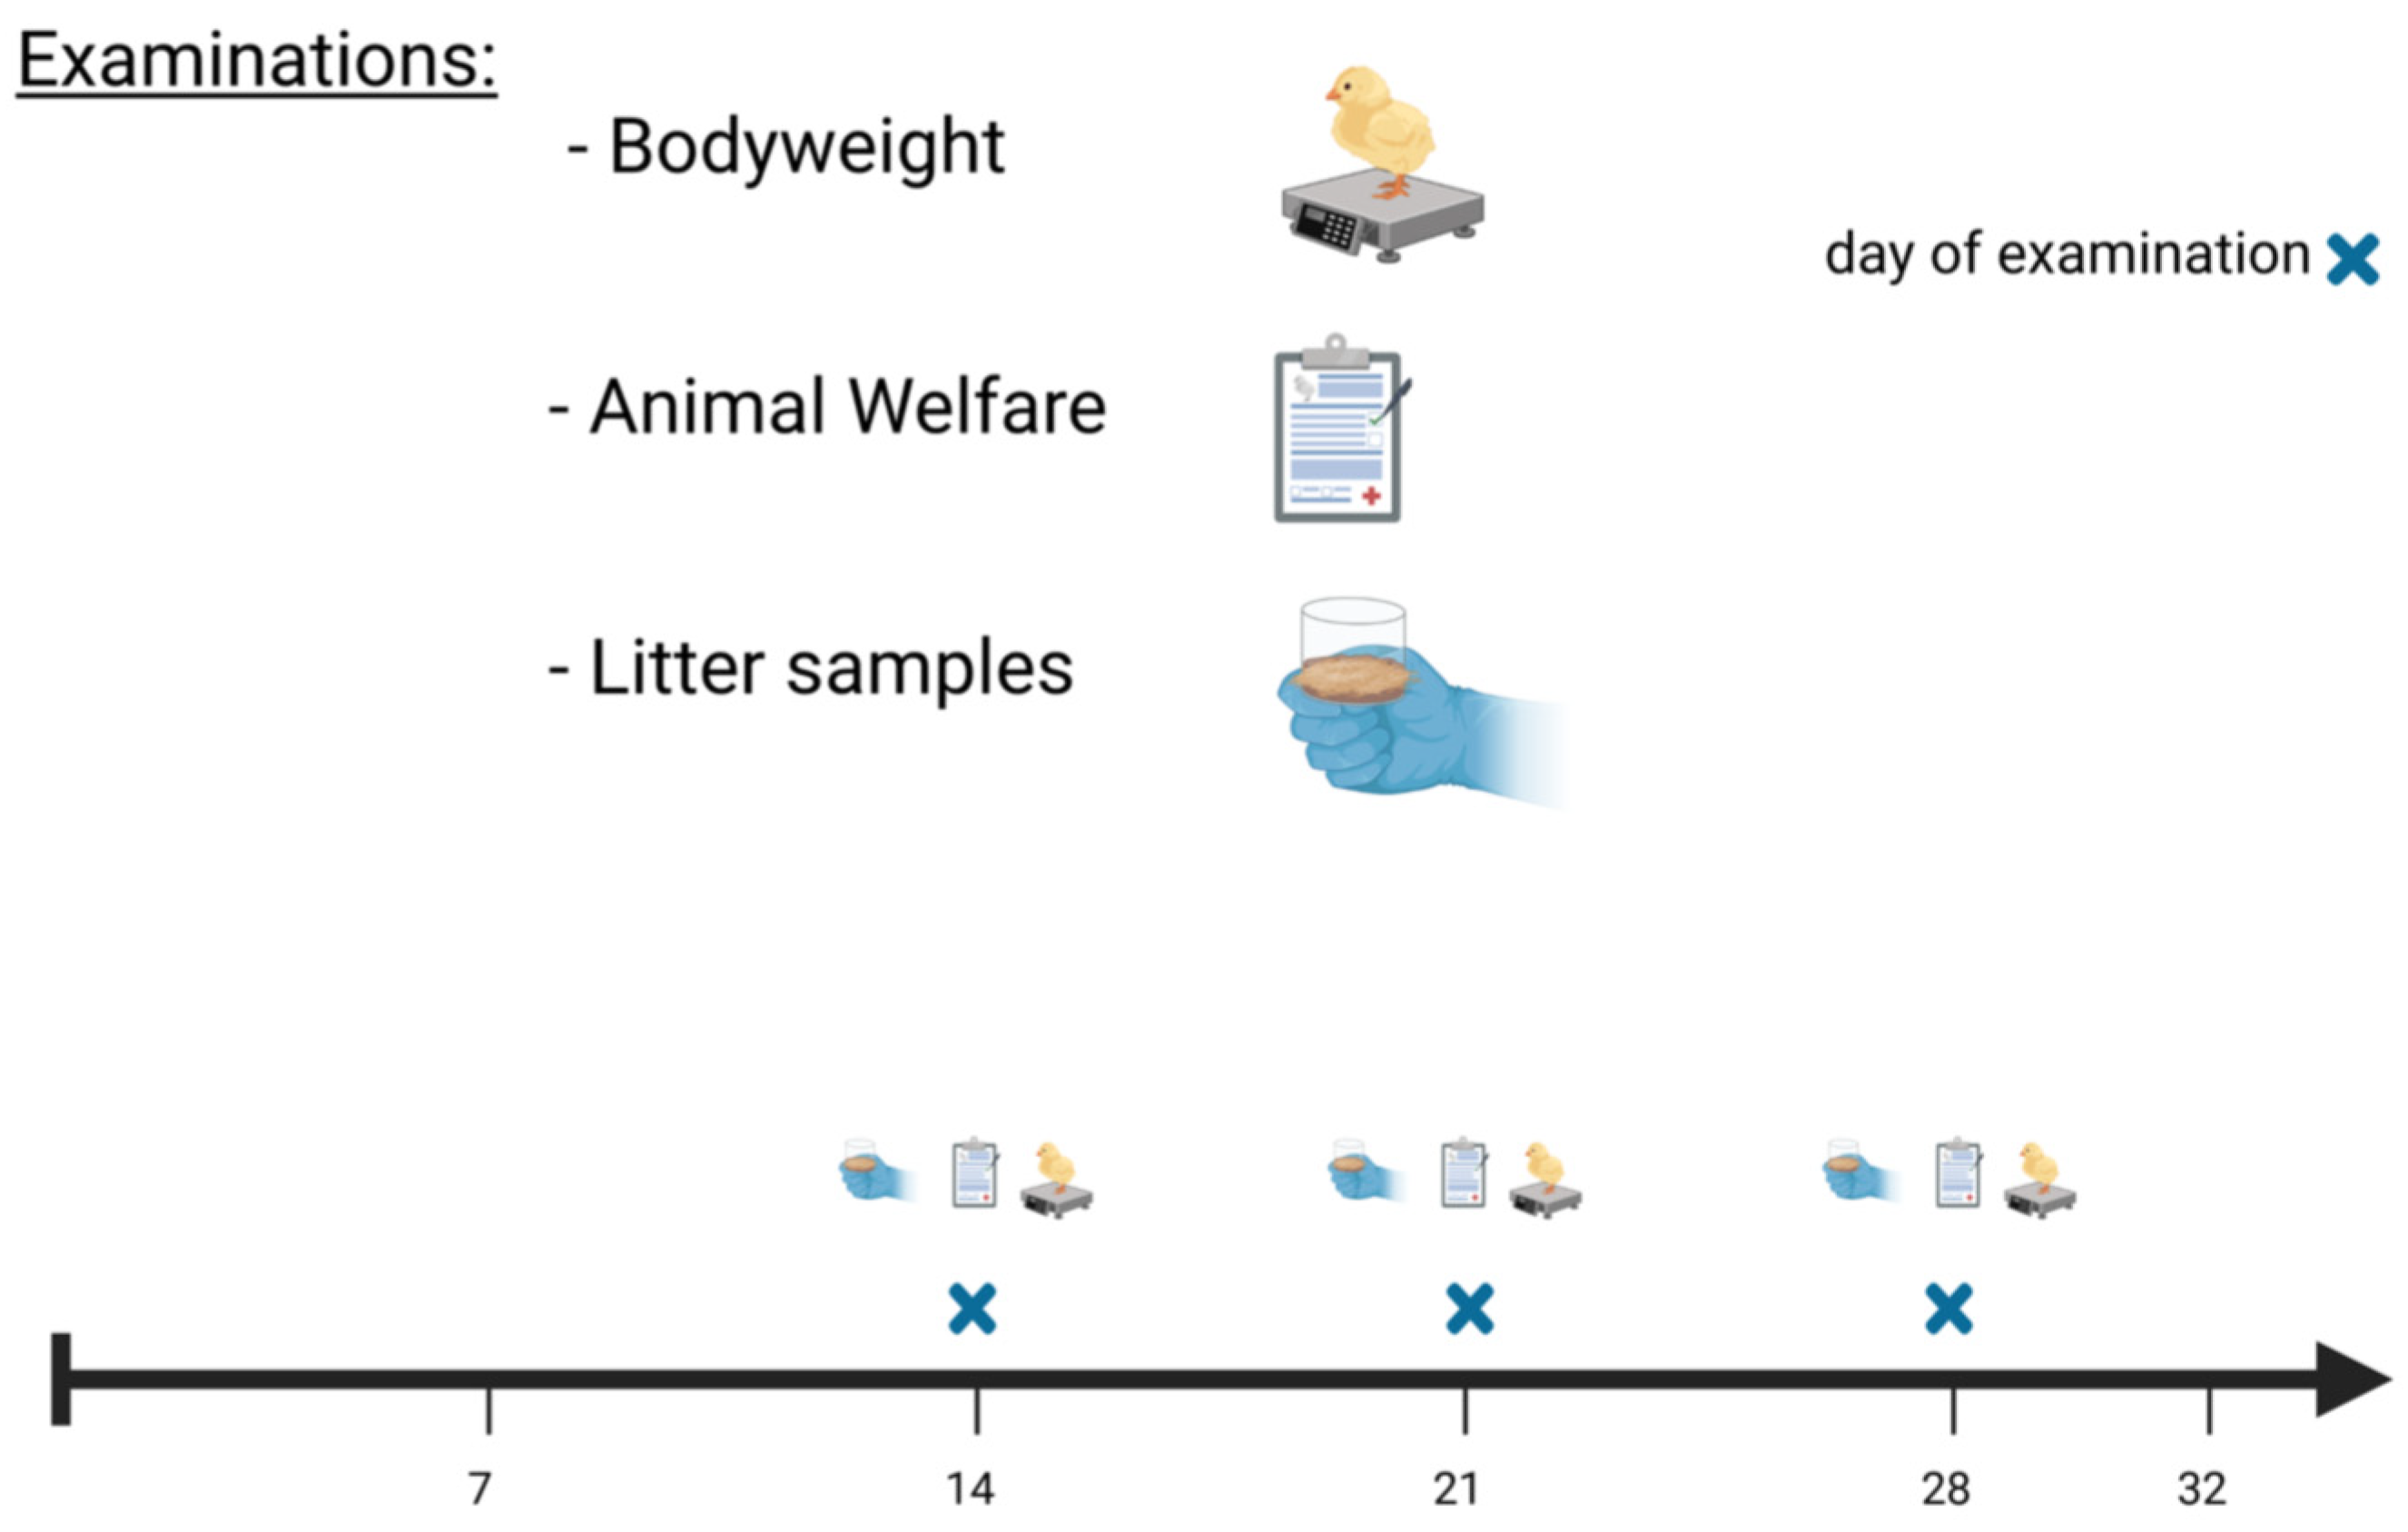
Individual bodyweight (BW) of 50 randomly selected birds per barn (for six runs) was measured at d 14, 21 and 28 of life (Figure 5). Hanging scales (Veit electronics s.r.o., Brno, Czech Republic) were used to record the birds’ weight. At the slaughterhouse, the number of delivered birds was noted as well as their BW. After subtracting the discarded birds, an average slaughter weight was calculated. The slaughterhouse also scored the foot pads via a camera-based system according to the common FPD scoring (QS Qualität und Sicherheit GmbH, Bonn, Germany) at slaughter with scores 0, 1, 2 a and 2 b [43].

2.4.2. Feed Conversion Ratio

The feed conversion ratio (FCR) was calculated by dividing the feed intake (kg) by the total BW (kg) of all birds for both the control and trial groups. The corrected FCR was calculated by using the corrected feed intake in kg. The corrected feed intake was obtained by subtracting the cumulative feed intake of the dead animals from the total feed intake. The cumulative feed intake of the dead animals was the sum of the daily feed intake of each animal up to the day of slaughter (d 33).

2.4.3. Litter Dry Matter

Litter samples to measure the dry matter (DM) content were collected at d 14, 21 and 28 of life (Figure 5) from five different rows in each barn (in all six runs). The rows were defined in-between the outside walls and the next drinking line or in the area between feeding and drinking lines (Figure 1). There were six points of sample collection in each row, resulting in thirty samples for each day. The litter was collected by taking all litter down to the ground with one hand at every spot (50 g). All samples were dried at 103 °C for the time needed to reach a constant weight and, afterwards, the DM was measured.

2.4.4. Foot Pad Dermatitis

The external examination of the foot pads (as an indicator of animal welfare) of the birds was performed for 50 randomly selected birds in each barn in all six runs at d 14, 21 and 28 (Figure 5). The foot pads were examined for both feet and the FPD score was recorded looking at the central plantar area. To evaluate the FPD scores, a seven-point scale in accordance with Mayne et al. [44] was used, which is described by Table 2. Regarding this scoring, score 0 refers to no external signs of FPD. Score 3 marks the point where first necrotic areas may occur and where the central part of the foot pad is swollen, red and harder. The other scores relate, in increasing order, to the size of the necrotic areas up until score 7, which describes a foot pad in which half of it is covered in necrotic scales.

2.4.5. Carbon Dioxide and Ammonia in the Air

Carbon dioxide (CO2) and ammonia (NH3) and the other climate parameters were continuously measured in the air of the barn by the FAS during up to twenty rounds per day on average and for one square metre of the barn floor. Data collection stopped shortly before slaughter, resulting in around 100,000 individual values per run and parameter, in total 2 million pieces of data per day. From these individual values, daily means and weekly means were formed.

2.5. Statistical Analysis

Data analysis was performed using the statistical software package from SAS, Version 7.1 (SAS Inst., Cary, NC, USA). All measured data were analysed descriptively by sample size, mean values, confidence interval, standard deviation, minimum and maximum. The group comparisons as well as the area comparisons were performed by one-way analysis of variance (ANOVA) for independent samples. In general, the Ryan–Einot–Gabriel–Welsch multiple-range test (REGWQ) was used for multiple pairwise means comparisons between the groups. All statements of statistical significance were based on p < 0.05.

3. Results

3.1. Growth Performance and Slaughter Data

3.1.1. Growth Performance

In Table 3, the average bodyweight of 50 individual birds of both the control group and trial group for d 14, 21 and 28 are displayed and statistically compared.
As shown in Table 3, there were no significant differences in BW between the groups at d 14 and 21 of life. At d 28, the birds in the CG had a significantly lower BW than those in the TG (1671 g vs. 1703 g).

3.1.2. Slaughter Data

The slaughter data were reported from the slaughterhouse. Table 4 shows the average bodyweight and foot pad score with standard deviation for both the control and trial groups at d 33.
The results in Table 4 show that there were no significant differences between the control and trial groups regarding bodyweight and foot pad score, which shows that both bodyweight gain and foot health were not negatively affected by the provided environmental enrichment.

3.1.3. Feed Conversion Ratio

In Table 5, both the FCR and corrected FCR are displayed and analysed for the control and trial groups.
As shown in Table 5, both the FCR and corrected FCR had no significant differences between both groups. Neither the control nor the trial groups showed any variances over the six trial runs.

3.2. Litter Quality and FPD Scoring

3.2.1. Litter Quality

Table 6 shows that, over the course of six trial runs, there were no significances differences either for d 14, 21 or 28 between the control and trial groups regarding the average dry matter (g/kg) in the litter.
For a more detailed analysis of the influence of the enrichments, the individual areas were further subdivided. At first, the trial group was separated into the enriched (green area in Figure 1) and non-enriched (yellow area in Figure 1) area and the DM was analysed.
As Table 7 shows, the DM was significantly higher in the enriched areas of the trial group compared to the non-enriched areas.
In order to be able to compare the individual enrichments, the litter samples were also examined individually in relation to the range of each environmental enrichment. This was performed by comparing the samples from the green areas (Figure 5).
Table 8 shows no significant differences between all three types of enrichment. On all days, the dry matter in the litter was the same for all types of environmental enrichments. Therefore, the individual variants did not have a different influence on the litter quality.

3.2.2. FPD Scoring

Table 9 shows the FPD scores at d 14, 21 and 28 in comparison for the control and trial groups with regard to the average values on examination days with standard deviation.
As shown in Table 9, at days 14 and 21, the CG showed significantly higher FPD scores than the TG. At day 28, the control group reached the values of the trial group and no differences were seen.

3.3. Air Quality

Table 10 shows the weekly averages of CO2 and NH3 in the TG. It displays significant differences for CO2 between the weeks, except for weeks four and five. For NH3, there are significant differences between the weeks, except between weeks 1 and 2 and weeks 3 and 4.
In a following step, the areas inside the trial group were divided into enriched and non-enriched areas (green areas in Figure 1) to have a closer look at the influence of the environmental enrichment on the air quality.
Table 11 compares the CO2 concentrations in the enriched and non-enriched areas in the trial group. Over the course of five weeks, these were compared within the respective group as well as with each other.
As Table 11 shows, there were no significant differences between the enriched and the non-enriched areas in the trial group over the course of all five weeks. It also shows the significances between the weeks for both the enriched and non-enriched areas. Carbon dioxide was significantly higher in the beginning before continuing to decline in both areas.
Table 12 depicts the same comparison as Table 11, but for NH3 instead of CO2.
Table 12 displays no significant differences between both areas regarding ammonia in the air for all five weeks, but it shows significances for each area regarding the weeks. In both the enriched and non-enriched areas, ammonia was significantly lower in week one and continued to increase until week 5. The exception to this was week 4, when the ammonia in the air was slightly lower than in the previous week for both the enriched and non-enriched areas.

4. Discussion

4.1. Influence of Environmental Enrichment on Growth Performance

The comparison of bodyweights from the control and trial groups in this study did not show any significantly lower values for the trial group. The FCR also showed no significant differences between the control and trial groups. This indicates that the presence of environmental enrichment and the assumed higher energy consumption, which could result from the increased physical activity stimulated by the environmental enrichment, had no negative influence on weight development. The FCR also showed no significant differences between the control group and trial group. This indicates that the presence of environmental enrichment and the assumed higher energy consumption, which could result from the increased physical activity stimulated by the environmental enrichment, had no negative influence on weight development. Recent studies have shown different influences of environmental enrichment on the growth performance of broilers. While de Jong et al. recorded significantly higher bodyweights for birds housed without enrichment after d 17 [45], Jacob et al. did not find any differences in bodyweight [46]. More recently, Nazareno et al. described an increased bodyweight due to environmental enrichment [47].
This is contrary to results that showed it is possible that environmental enrichment increases the activity of the birds and that this could have a negative effect on bodyweight development [48]. The results of our study, however, had no such observable effect. There were suggestions that increased activity could have a positive effect on leg health [49], muscle growth [32] and weight gain [50]. Regarding leg health, de Jong et al. found no such effects on leg health [45]. It has also been described in the literature that increased activity through environmental enrichment can also lead to an increased amount of exploratory behaviour and comfort behaviour [51], which is, therefore, an indication of improved animal welfare. However, the temporary, slightly positive effect on bodyweight in this trial was only seen for a few days at the very end of the fattening period, and, with a longer fattening period, the results could be different again.
When taking a look at the FCR, the statistical analysis also shows no differences regarding both groups, which also gives a hint towards environmental enrichment not having any influence on the performance of the birds. This is in accordance with de Jong et al., who described that the FCR did not differ between the enriched and non-enriched housed groups of the same strain [45].

4.2. Influence of Environmental Enrichment on FPD Scoring and Litter Quality

The examination of foot pads in both groups on the farm showed significantly lower FPD scores for the trial group at days 14 and 21. This could be related to the accessibility of more seating positions offered by the environmental enrichment or maybe by the increased activity, which could also lead to improved leg health [16]. A main influence of wet litter on the development of FPD is described in the literature [52], although there are a lot of other factors influencing this as well [53]. The results obtained in the current study reveal that the environmental enrichment had no negative influence on the litter quality. A recent study found that environmental enrichment in form of elevated platforms and straw bales has also no effect on the litter quality, as humidity in the litter differed from 25.1 ± 5.1% to 48.1 ± 7.7% with enrichment and from 19.4 ± 3.4% to 45.1 ± 9.9% without it (p = 0.12) [54]. Nevertheless, another recent study elucidated that the significant effect of the enriched environment on the litter quality depended on the litter collection point; the litter taken from below the elevated platforms had a significantly higher moisture content than the same area in the control compartments (p= 0.013). However, no significant effects occurred in the litter taken around the feeding troughs and water dispensers in both compartments [55]. Other studies that analysed litter moisture in enriched environments found no significant changes between the enriched and control groups during the production cycle, with 24.6 ± 4.6% with the enriched environment and 27.9 ± 6.3% without it [56,57].
In our study, the analysis of the litter samples, however, showed no significance in the DM content of litter sampling between the groups and, therefore, no indication that the differences in FPD scoring were related to wet litter in this trial, although the DM in the litter of our trial never reached the critical value of 65% or less [58]. For the majority of the examination days, the DM content was even closer to what is described as the ideal moisture content of 20–25% [59]. To take a closer look at how the environmental enrichment might have contributed to the lower FPD scores by having a positive influence on the litter quality, the trial group was then divided into enriched and non-enriched areas. The results of this analysis show that the DM content of the litter was significantly higher in the enriched areas at day 14. In combination with the lower FPD scores at days 14 and 21, this could be an indication of a positive effect on the litter quality, as the FPD score was closely related to the litter moisture [58]. In the following weeks, the DM contents of both areas had no significant differences, although the DM contents in the enriched areas were slightly higher. This could explain why the FPD scores became similar at the end of the fattening process.
The results in this trial also show that the type of environmental enrichment does not have a significant influence on the effect on the litter, as there were no significant differences between the three types of environmental enrichment used, although it is described in the literature that perches are used less frequently than elevated platforms [49]. It seems that the possibility of taking a different seating position and being able to sit on grounds other than the litter is enough to improve litter quality and possibly also FPD. In order to evaluate the influences of single types of environmental enrichment more precisely and to examine which type is most suitable for broilers, it could be helpful to carry out trials with only one type of enrichment. Nevertheless, it is necessary to continuously work on the further development of environmental enrichment in order to constantly improve in this area [16,60].
Regarding foot pad scores at the slaughterhouse, there were no significant differences between both groups. Thus, even if it has been discussed that the provision of environmental enrichment could have either a negative [20,61] or a positive influence [62,63] on foot pad health, these previous results are inconclusive. The different types of scoring at the slaughterhouse also play a role, but studies have shown that FPD scoring at the slaughterhouse is well suited to mirror the foot pad health on the farm [64].

4.3. Influence of Environmental Enrichment on Air Quality

A high concentration of ammonia on poultry farms is a potentially dangerous situation both for chickens and farm workers [65,66]. Generally, increasing ammonia volatilisation in the farm air is associated with litter characteristics, such as DM [67]. The current study showed a typical significant increase in the aerial NH3 level towards the end of the fattening period (5.49 and 5.59 ppm in the control and enriched groups, respectively), but still lower than the maximum values of 20 ppm prescribed by German law [68]. Values of 25 ppm and more have been described to have negative effects on the growth performance of broilers [69]. The results of this study are aligned with the results of Adler et al. [70], which showed that NH3 concentrations constantly increase towards the end of the fattening cycle, with significantly higher values than at the beginning (p < 0.01). The results of our study showed similar significant differences with 0.10 ppm in week 1 and 5.55 ppm in week 5. In contrast to our study, Yang et al. [57] concluded that, under experimental conditions, the NH3 concentrations in the broiler rooms with an elevated perching platform were 27% lower than those in the rooms without an elevated perching platform. Moreover, Almeida et al. [71] elucidated that NH3 concentration increased during the production cycle, reaching its highest value at d 42 (25 ppm) in broilers in the control group, while the NH3 level in the perforated plastic floor reached 2 ppm at d 42.
Concerning the CO2 concentrations, the CO2 values obtained in the present study decreased during the broilers’ growth, from 2892 to 1887 ppm for the control group and from 2963 to 1925 ppm for the enriched group (Table 11). However, in all cases, these levels were still below the 3000 ppm standard for the protection of broilers established in the European Directive 2007/43/CE [10]. The higher CO2 concentrations at the beginning can be explained by the fact that gas heating was used in this trial, which leads to higher CO2 concentrations in the air [72]. The continuous decrease in concentration could then be associated with the steadily lower requirement for temperature and the associated lower heating output. This agrees with the results of Knížatová et al. who described that an increased ventilation rate at the end of the production cycle causes a decrease in CO2 concentration in the air (inverse relation between CO2 level and ventilation rate) [73].

5. Conclusions

Overall, the results of our study show no negative influences of the used environmental enrichment installations on the growth performance and FPD scores of Ross broilers during the 33-day fattening periods. There was no negative influence of the different installations on litter and air quality. However, it can be assumed that the provision of enrichment tools, such as perches and elevated platforms, and the birds becoming used to them from an early stage offers more opportunities for the broilers to express better their natural behavioural traits, which can improve individual well-being. Our study did not display any negative influence of the enrichment elements and the mobile-ceiling-based robot on bodyweight gain and animal health. The real-time monitoring and the wealth of data provided by the robot offer vast opportunities to closely monitor broiler flocks and individual birds and give a detailed mapping of air quality and indoor climate conditions in animal barns.

Author Contributions

Conceptualisation, J.H. and C.V.; methodology, F.S., J.H. and C.V.; software, C.V.; validation, F.S., A.A.-E.W., M.F.E.A. and C.V.; formal analysis, F.S., B.R. and C.V.; investigation, F.S., A.A.-E.W., M.F.E.A., C.S., M.A., S.R. and C.V.; resources, F.S., C.S., J.H. and C.V.; data curation, F.S., B.R. and C.V.; writing—original draft preparation, F.S.; writing—review and editing, B.R., A.A.-E.W., M.F.E.A., J.H. and C.V.; visualisation, F.S. and B.R.; supervision, J.H. and C.V.; project administration, S.R., O.D. and C.V.; funding acquisition, O.D. All authors have read and agreed to the published version of the manuscript.

Funding

This project was financially supported by the Federal Ministry of Food and Agriculture (BMEL) based on a decision of the Parliament of the Federal Republic of Germany, granted by the Federal Office for Agriculture and Food (BLE) (Funding code 2817MDT305). This Open Access publication was funded by the Deutsche Forschungsgemeinschaft (DFG, German Research Foundation) within the programme LE 824/10-1 “Open Access Publication Costs” and University of Veterinary Medicine Hannover, Foundation.

Institutional Review Board Statement

The study design was approved by the Animal Welfare Officer of the University of Veterinary Medicine Hannover, Foundation, Germany code “AZ: TVO-2021-V-19”.

Informed Consent Statement

Not applicable.

Data Availability Statement

The data presented in this study are available in this manuscript.

Acknowledgments

We would like to thank Frances Sherwood-Brock for proofreading the manuscript to ensure correct English language usage.

Conflicts of Interest

The authors declare no conflict of interest.

References

  1. Delgado, C.L. Rising consumption of meat and milk in developing countries has created a new food revolution. J. Nutr. 2003, 133 (Suppl. 2), 3907S–3910S. [Google Scholar] [CrossRef] [PubMed] [Green Version]
  2. Smil, V. Worldwide transformation of diets, burdens of meat production and opportunities for novel food proteins. Enzym. Microb. Technol. 2002, 30, 305–311. [Google Scholar] [CrossRef]
  3. Vranken, L.; Avermaete, T.; Petalios, D.; Mathijs, E. Curbing global meat consumption: Emerging evidence of a second nutrition transition. Environ. Sci. Policy 2014, 39, 95–106. [Google Scholar] [CrossRef]
  4. FAO. Food Outlook: Biannual Report on Global Food Markets; FAO: Rome, Italy, 2020. [Google Scholar]
  5. Gaudaré, U.; Pellerin, S.; Benoit, M.; Durand, G.; Dumont, B.; Barbieri, P.; Nesme, T. Comparing productivity and feed-use efficiency between organic and conventional livestock animals. Environ. Res. Lett. 2021, 16, 024012. [Google Scholar] [CrossRef]
  6. Henchion, M.; McCarthy, M.; Resconi, V.C.; Troy, D. Meat consumption: Trends and quality matters. Meat Sci. 2014, 98, 561–568. [Google Scholar] [CrossRef] [PubMed] [Green Version]
  7. De Jong, I.; Berg, C.; Butterworth, A.; Estevéz, I. Scientific report updating the EFSA opinions on the welfare of broilers and broiler breeders. EFSA Support. Publ. 2012, 9, 295E. [Google Scholar] [CrossRef]
  8. Bergmann, S.; Schwarzer, A.; Wilutzky, K.; Louton, H.; Bachmeier, J.; Schmidt, P.; Erhard, M.; Rauch, E. Behavior as welfare indicator for the rearing of broilers in an enriched husbandry environment—A field study. J. Vet. Behav. 2017, 19, 90–101. [Google Scholar] [CrossRef]
  9. Adler, C.; Tiemann, I.; Hillemacher, S.; Schmithausen, A.; Müller, U.; Heitmann, S.; Spindler, B.; Kemper, N.; Büscher, W. Effects of a partially perforated flooring system on animal-based welfare indicators in broiler housing. Poult. Sci. 2020, 99, 3343–3354. [Google Scholar] [CrossRef]
  10. Giersberg, M.; Hartung, J.; Kemper, N.; Spindler, B. Floor space covered by broiler chickens kept at stocking densities according to Council Directive 2007/43/EC. Vet. Rec. 2016, 179, 124. [Google Scholar] [CrossRef]
  11. Spindler, B.; Hartung, J. Prevalence of Pododermatitis in broiler chickens kept according to Directive 2007/43/EC stocking densities. In Animal Hygiene and Sustainable Livestock Production, Proceedings of the XVth International Congress of the International Society for Animal Hygiene, Vienna, Austria, 3–7 July 2011; Tribun EU: Brno, Czech Republic, 2011; Volume 1. [Google Scholar]
  12. Gentle, M.J. Pain issues in poultry. Appl. Anim. Behav. Sci. 2011, 135, 252–258. [Google Scholar] [CrossRef]
  13. Bergmann, S.; Louton, H.; Westermaier, C.; Wilutzky, K.; Bender, A.; Bachmeier, J.; Erhard, M.; Rauch, E. Field trial on animal-based measures for animal welfare in slow growing broilers reared under an alternative concept suitable for the German market. Berl. Münch. Tierärztl. Wochenschr. 2016, 129, 453–461. [Google Scholar]
  14. Oviedo-Rondon, E.O.; Hume, M.E.; Hernandez, C.; Clemente-Hernandez, S. Intestinal microbial ecology of broilers vaccinated and challenged with mixed Eimeria species, and supplemented with essential oil blends. Poult. Sci. 2006, 85, 854–860. [Google Scholar] [CrossRef] [PubMed]
  15. Waldenstedt, L. Nutritional factors of importance for optimal leg health in broilers: A review. Anim. Feed Sci. Technol. 2006, 126, 291–307. [Google Scholar] [CrossRef]
  16. Pedersen, I.; Forkman, B. Improving leg health in broiler chickens: A systematic review of the effect of environmental enrichment. Anim. Welf. 2019, 28, 215–230. [Google Scholar] [CrossRef] [Green Version]
  17. Sans, E.C.O.; Federici, J.F.; Dahlke, F.; Molento, C.F.M. Evaluation of Free-Range Broilers Using the Welfare Quality (R) Protocol. Braz. J. Poult. Sci. 2014, 16, 297–305. [Google Scholar] [CrossRef] [Green Version]
  18. Bradshaw, R.H.; Kirkden, R.D.; Broom, D.M. A review of the aetiology and pathology of leg weakness in broilers in relation to welfare. Avian Poult. Biol. Rev. 2002, 13, 45–103. [Google Scholar] [CrossRef] [Green Version]
  19. Mayne, R.K.; Powell, F.; Else, R.W.; Kaiser, P.; Hocking, P.M. Foot pad dermatitis in growing turkeys is associated with cytokine and cellular changes indicative of an inflammatory immune response. Avian Pathol. 2007, 36, 453–459. [Google Scholar] [CrossRef] [Green Version]
  20. Tahamtani, F.M.; Pedersen, I.J.; Riber, A.B. Effects of environmental complexity on welfare indicators of fast-growing broiler chickens. Poult. Sci. 2020, 99, 21–29. [Google Scholar] [CrossRef]
  21. Newberry, R.C. Environmental Enrichment—Increasing the Biological Relevance of Captive Environments. Appl. Anim. Behav. Sci. 1995, 44, 229–243. [Google Scholar] [CrossRef]
  22. Ventura, B.A.; Siewerdt, F.; Estevez, I. Access to barrier perches improves behavior repertoire in broilers. PLoS ONE 2012, 7, e29826. [Google Scholar] [CrossRef] [Green Version]
  23. De Jong, I.; Gunnink, H. Effects of a commercial broiler enrichment programme with or without natural light on behaviour and other welfare indicators. Animal 2019, 13, 384–391. [Google Scholar] [CrossRef] [PubMed]
  24. Blatchford, R.A.; Archer, G.S.; Mench, J.A. Contrast in light intensity, rather than day length, influences the behavior and health of broiler chickens. Poult. Sci. 2012, 91, 1768–1774. [Google Scholar] [CrossRef] [PubMed]
  25. Olsson, I.A.S.; Keeling, L.J. The push-door for measuring motivation in hens: Laying hens are motivated to perch at night. Anim. Welf. 2002, 11, 11–19. [Google Scholar]
  26. Schrader, L.; Muller, B. Night-time roosting in the domestic fowl: The height matters. Appl. Anim. Behav. Sci. 2009, 121, 179–183. [Google Scholar] [CrossRef]
  27. Donaldson, C.J.; O’Connell, N.E. The influence of access to aerial perches on fearfulness, social behaviour and production parameters in free-range laying hens. Appl. Anim. Behav. Sci. 2012, 142, 51–60. [Google Scholar] [CrossRef]
  28. Newberry, R.C.; Estevez, I.; Keeling, L.J. Group size and perching behaviour in young domestic fowl. Appl. Anim. Behav. Sci. 2001, 73, 117–129. [Google Scholar] [CrossRef]
  29. van de Weerd, H.A.; Day, J.E.L. A review of environmental enrichment for pigs housed in intensive housing systems. Appl. Anim. Behav. Sci. 2009, 116, 1–20. [Google Scholar] [CrossRef]
  30. Weeks, C.A.; Danbury, T.D.; Davies, H.C.; Hunt, P.; Kestin, S.C. The behaviour of broiler chickens and its modification by lameness. Appl. Anim. Behav. Sci. 2000, 67, 111–125. [Google Scholar] [CrossRef]
  31. Zuidhof, M.J.; Schneider, B.L.; Carney, V.L.; Korver, D.R.; Robinson, F.E. Growth, efficiency, and yield of commercial broilers from 1957, 1978, and 2005. Poult. Sci. 2014, 93, 2970–2982. [Google Scholar] [CrossRef]
  32. Pedersen, I.J.; Tahamtani, F.M.; Forkman, B.; Young, J.F.; Poulsen, H.D.; Riber, A.B. Effects of environmental enrichment on health and bone characteristics of fast growing broiler chickens. Poult. Sci. 2020, 99, 1946–1955. [Google Scholar] [CrossRef]
  33. Reiter, K.; Bessei, W. Effect of locomotor activity on leg disorder in fattening chicken. Berl. Munch. Tierarztl. Wochenschr. 2009, 122, 264–270. [Google Scholar] [PubMed]
  34. Ohara, A.; Oyakawa, C.; Yoshihara, Y.; Ninomiya, S.; Sato, S. Effect of Environmental Enrichment on the Behavior and Welfare of Japanese Broilers at a Commercial Farm. J. Poult. Sci. 2015, 52, 323–330. [Google Scholar] [CrossRef] [Green Version]
  35. Baxter, M.; Bailie, C.L.; O’Connell, N.E. Evalution of dustbathing substrate and straw bales as environmental enrichments in commercial broiler housing. Appl. Anim. Behav. Sci. 2018, 200, 78–85. [Google Scholar] [CrossRef] [Green Version]
  36. Bach, M.H.; Tahamtani, F.M.; Pedersen, I.J.; Riber, A.B. Effects of environmental complexity on behaviour in fast-growing broiler chickens. Appl. Anim. Behav. Sci. 2019, 219, 104840. [Google Scholar] [CrossRef]
  37. Bilgili, S.F.; Hess, J.B.; Blake, J.P.; Macklin, K.S.; Saenmahayak, B.; Sibley, J.L. Influence of bedding material on footpad dermatitis in broiler chickens. J. Appl. Poult. Res. 2009, 18, 583–589. [Google Scholar] [CrossRef]
  38. Ben Sassi, N.; Averós, X.; Estevez, I. Technology and poultry welfare. Animals 2016, 6, 62. [Google Scholar] [CrossRef] [Green Version]
  39. Rowe, E.; Dawkins, M.S.; Gebhardt-Henrich, S.G. A systematic review of precision livestock farming in the poultry sector: Is technology focussed on improving bird welfare? Animals 2019, 9, 614. [Google Scholar] [CrossRef] [Green Version]
  40. Main, D.; Mullan, S.; Atkinson, C.; Cooper, M.; Wrathall, J.; Blokhuis, H. Best practice framework for animal welfare certification schemes. Trends Food Sci. Technol. 2014, 37, 127–136. [Google Scholar] [CrossRef] [Green Version]
  41. Part, C.E.; Edwards, P.; Hajat, S.; Collins, L.M. Prevalence rates of health and welfare conditions in broiler chickens change with weather in a temperate climate. R. Soc. Open Sci. 2016, 3, 160197. [Google Scholar] [CrossRef] [Green Version]
  42. Chuppava, B.; Visscher, C.; Kamphues, J. Effect of different flooring designs on the performance and foot pad health in broilers and turkeys. Animals 2018, 8, 70. [Google Scholar] [CrossRef] [Green Version]
  43. QS Fachgesellschaft Geflügel GmbH; Bonn, G. Leitfaden Befunddaten in der Geflügelschlachtung; Version 01.01.2022; QS Fachgesellschaft Geflügel GmbH: Bonn, Germany, 2022. [Google Scholar]
  44. Mayne, R.; Else, R.; Hocking, P. High litter moisture alone is sufficient to cause footpad dermatitis in growing turkeys. Br. Poult. Sci. 2007, 48, 538–545. [Google Scholar] [CrossRef] [PubMed]
  45. de Jong, I.C.; Blaauw, X.E.; van der Eijk, J.A.; das Silva, C.S.; van Krimpen, M.M.; Molenaar, R.; van den Brand, H. Providing environmental enrichments affects activity and performance, but not leg health in fast-and slower-growing broiler chickens. Appl. Anim. Behav. Sci. 2021, 241, 105375. [Google Scholar] [CrossRef]
  46. Jacob, F.; Salgado, D.; Nää, I.; Baracho, M. Effect of Environmental Enrichment on the Body Weight in Broiler Chickens. Braz. J. Poult. Sci. 2020, 22. [Google Scholar] [CrossRef]
  47. Nazareno, A.C.; da Silva, I.J.; Delgado, E.F.; Machado, M.; Pradella, L.O. Does environmental enrichment improve performance, morphometry, yield and weight of broiler parts at different ages? Rev. Bras. Eng. Agrícola Ambient. 2022, 26, 292–298. [Google Scholar] [CrossRef]
  48. Aksit, M.; Yardim, Z.K.; Yalcin, S. Environmental enrichment influences on broiler performance and meat quality: Effect of light source and providing perches. Eur. Poult. Sci. 2017, 81. [Google Scholar] [CrossRef]
  49. Kaukonen, E.; Norring, M.; Valros, A. Perches and elevated platforms in commercial broiler farms: Use and effect on walking ability, incidence of tibial dyschondroplasia and bone mineral content. Animal 2017, 11, 864–871. [Google Scholar] [CrossRef] [Green Version]
  50. Meyer, M.; Johnson, A.K.; Bobeck, E.A. A novel environmental enrichment device improved broiler performance without sacrificing bird physiological or environmental quality measures. Poult. Sci. 2019, 98, 5247–5256. [Google Scholar] [CrossRef]
  51. Vasdal, G.; Vas, J.; Newberry, R.C.; Moe, R.O. Effects of environmental enrichment on activity and lameness in commercial broiler production. J. Appl. Anim. Welf. Sci. 2019, 22, 197–205. [Google Scholar] [CrossRef]
  52. De Jong, I.C.; Gunnink, H.; van Harn, J. Wet litter not only induces footpad dermatitis but also reduces overall welfare, technical performance, and carcass yield in broiler chickens. J. Appl. Poult. Res. 2014, 23, 51–58. [Google Scholar] [CrossRef]
  53. Abd El-Wahab, A.; Visscher, C.; Kamphues, J. Impact of different dietary protein sources on performance, litter quality and foot pad dermatitis in broilers. J. Anim. Feed Sci. 2018, 27, 148–154. [Google Scholar] [CrossRef]
  54. Mocz, F.; Michel, V.; Janvrot, M.; Moysan, J.-P.; Keita, A.; Riber, A.B.; Guinebretière, M. Positive Effects of Elevated Platforms and Straw Bales on the Welfare of Fast-Growing Broiler Chickens Reared at Two Different Stocking Densities. Animals 2022, 12, 542. [Google Scholar] [CrossRef] [PubMed]
  55. Malchow, J.; Schrader, L. Effects of an Elevated Platform on Welfare Aspects in Male Conventional Broilers and Dual-Purpose Chickens. Front. Vet. Sci. 2021, 8, 660602. [Google Scholar] [CrossRef] [PubMed]
  56. Bailie, C.L.; Baxter, M.; O’Connell, N.E. Exploring perch provision options for commercial broiler chickens. Appl. Anim. Behav. Sci. 2018, 200, 114–122. [Google Scholar] [CrossRef] [Green Version]
  57. Yang, X.; Huo, X.; Li, G.; Purswell, J.L.; Tabler, T.; Chesser, D.; Zhao, Y. Application of Elevated Perching Platform and Robotic Vehicle in Broiler Production. In Proceedings of the 2019 ASABE Annual International Meeting, Boston, MA, USA, 7–10 July 2019; American Society of Agricultural and Biological Engineers: St. Joseph, MI, USA, 2019. [Google Scholar]
  58. Abd El-Wahab, A.; Visscher, C.; Beineke, A.; Beyerbach, M.; Kamphues, J. Experimental studies on the effects of different litter moisture contents and exposure time to wet litter on development and severity of foot pad dermatitis in young fattening turkeys. Arch. Geflugelkd. 2012, 76, 55–62. [Google Scholar]
  59. Kuleile, N.; Metsing, I.; Tjala, C.; Jobo, T.; Phororo, M. The effects of different litter material on broiler performance and feet health. Online J. Anim. Feed Res. 2019, 9, 206–211. [Google Scholar] [CrossRef]
  60. Riber, A.; Van De Weerd, H.; De Jong, I.; Steenfeldt, S. Review of environmental enrichment for broiler chickens. Poult. Sci. 2018, 97, 378–396. [Google Scholar] [CrossRef]
  61. Đukić Stojčić, M.; Bjedov, S.; Žikić, D.; Perić, L.; Milošević, N. Effect of straw size and microbial amendment of litter on certain litter quality parameters, ammonia emission, and footpad dermatitis in broilers. Arch. Anim. Breed. 2016, 59, 131–137. [Google Scholar] [CrossRef]
  62. Marušić, D.; Matković, K.; Matković, S.; Pavičić, Ž.; Ostović, M.; Kabalin, A.E.; Lucić, H. Effect of litter type and perches on footpad dermatitis and hock burn in broilers housed at different stocking densities. S. Afr. J. Anim. Sci. 2019, 49, 546–554. [Google Scholar]
  63. BenSassi, N.; vas, J.; Vasdal, G.; Averós, X.; Estévez, I.; Newberry, R.C. On-farm broiler chicken welfare assessment using transect sampling reflects environmental inputs and production outcomes. PLoS ONE 2019, 14, e0214070. [Google Scholar] [CrossRef] [Green Version]
  64. Louton, H.; Erhard, M.; Wirsch, K.; Bergmann, S.; Piller, A.; Schmidt, P.; Rauch, E. Comparison of four assessment methods of foot pad dermatitis and hock burn of broilers. Berl. Munch. Tierarztl. Wochenschr. 2020, 133, 1–11. [Google Scholar]
  65. Ritz, C.; Fairchild, B.; Lacy, M. Implications of ammonia production and emissions from commercial poultry facilities: A review. J. Appl. Poult. Res. 2004, 13, 684–692. [Google Scholar] [CrossRef]
  66. Naseem, S.; King, A.J. Ammonia production in poultry houses can affect health of humans, birds, and the environment—techniques for its reduction during poultry production. Environ. Sci. Pollut. Res. 2018, 25, 15269–15293. [Google Scholar] [CrossRef] [PubMed]
  67. Méda, B.; Hassouna, M.; Aubert, C.; Robin, P.; Dourmad, J.-Y. Influence of rearing conditions and manure management practices on ammonia and greenhouse gas emissions from poultry houses. World’s Poult. Sci. J. 2011, 67, 441–456. [Google Scholar] [CrossRef]
  68. TierSchNutztV. Verordnung zum Schutz Landwirtschaftlicher Nutztiere und Anderer zur Erzeugung Tierischer Produkte Gehaltener Tiere bei Ihrer Haltung; Tierschutz-Nutztierhaltungsverordnung in der Fassung der Bekanntmachung vom 22 die Durch Artikel 3 Absatz 2 des Gesetzes vom 30; Bundesministerium der Justiz: Berlin, Germany, 2006. [Google Scholar]
  69. Wang, Y.; Meng, Q.; Guo, Y.; Wang, Y.; Wang, Z.; Yao, Z.; Shan, T. Effect of atmospheric ammonia on growth performance and immunological response of broiler chickens. J. Anim. Vet. Adv. 2010, 9, 2802–2806. [Google Scholar]
  70. Adler, C.; Schmithausen, A.J.; Trimborn, M.; Heitmann, S.; Spindler, B.; Tiemann, I.; Kemper, N.; Büscher, W. Effects of a Partially Perforated Flooring System on Ammonia Emissions in Broiler Housing—Conflict of Objectives between Animal Welfare and Environment? Animals 2021, 11, 707. [Google Scholar] [CrossRef] [PubMed]
  71. de Almeida, E.A.; de Souza, L.F.A.; Sant’Anna, A.C.; Bahiense, R.N.; Macari, M.; Furlan, R.L. Poultry rearing on perforated plastic floors and the effect on air quality, growth performance, and carcass injuries—Experiment 1: Thermal comfort. Poult. Sci. 2017, 96, 3155–3162. [Google Scholar] [CrossRef] [PubMed]
  72. Cândido, M.; Xiong, Y.; Gates, R.; Tinôco, I.; Koelkebeck, K. Effects of carbon dioxide on turkey poult performance and behavior. Poult. Sci. 2018, 97, 2768–2774. [Google Scholar] [CrossRef]
  73. Knížatová, M.; Mihina, Š.; Brouček, J.; Karandušovská, I.; Sauter, G.; Mačuhová, J. Effect of the age and season of fattening period on carbon dioxide emissions from broiler housing. Czech J. Anim. Sci. 2010, 55, 436–444. [Google Scholar] [CrossRef] [Green Version]
Figure 1. Schematic drawing of the barn for the control (top) and trial (bottom) groups (the figure was created with Biorender.com).
Sustainability 14 05727 g001aSustainability 14 05727 g001b
Figure 2. “A-Reuter”.
Sustainability 14 05727 g002
Figure 3. “Hybrid”.
Figure 3. “Hybrid”.
Sustainability 14 05727 g003
Figure 4. Photo of the “Plateau” variant of environmental enrichment. As the photo was taken one day before the birds arrived, the ramps are laying on top of it after disinfection, ready to be attached to the sides with cable ties.
Sustainability 14 05727 g004
Figure 5. Timeline of the examinations in the trial and control groups.
Sustainability 14 05727 g005
Table 1. Chemical composition of the commercial diets used for the control and trial groups.
Ingredients (in %) StarterGrower IGrower II Finisher
Crude protein (CP)21.61919.019.5
Ether extract5.44.74.77.8
Crude fibre (CF)2.53.53.23.2
Crude ash5.55.45.14.8
Calcium0.90.750.70.65
Phosphorus0.850.550.50.4
Sodium0.160.160.150.14
Lysine1.351.121.121.14
Methionine0.80.280.540.28
Table 2. Footpad scoring in accordance with Mayne et al. (2007).
ScoreDescription of the Foot Pad
0No external signs of FPD. Skin of the foot pad and digital pads appears normal, no redness, swelling or necrosis is evident. The skin of the foot pad feels soft to the touch.
1Slight swelling and/or redness of the skin of the foot pad.
2The pad feels harder and denser than a non-affected foot. The central part of the pad is raised with swelling and redness and the reticulate scales may be separated. The digital pads may show a similar reaction.
3The central and digital foot pads are enlarged and swollen with red areas, and, as the skin has become compacted, the foot pad is hard. The reticulate scales have become enlarged and separated, and small black necrotic areas may occur.
4Marked swelling and redness around the margins of lesions occur. Reticulate scales die and turn black, forming scale-shaped necrotic areas. The scales around the outside of the black areas may have turned white. The area of necrosis is less than one-eighth of the total area of the foot pad.
5Swelling and redness are evident in the central and digital foot pads. The total foot pad size is enlarged. Reticulate scales are pronounced, increased in number and separated from each other. The amount of necrosis extends to a quarter of the foot pad. Small necrotic areas may also appear on the digital pads.
6As score 5, but with half of the foot pad covered by necrotic cells. The digital pads may have up to half of one pad covered with necrotic cells.
7A foot pad with over half of the foot pad covered in necrotic scales.
Table 3. Average bodyweight (g) ± standard deviation of individually weighed birds from day 14 to 28 of life in both the control (CG) and trial groups (TG).
Day of LifenCGTG
1450521.17 a ± 61.19526.48 a ± 49.88
21501029.82 a ± 127.761012.02 a ± 121.75
28501671.09 b ± 191.701703.54 a ± 182.31
a,b Means in a row with different superscripts differ significantly (p < 0.05).
Table 4. Slaughter data regarding average bodyweight (g) ± standard deviation per bird and foot pad points ± standard deviation, according to QS GmbH Germany, for the control (CG) and trial groups (TG) over six trials.
CG
(n = 54,276)
TG
(n = 54,607)
Bodyweight (g)2071.71 ± 72.032067.29 ± 34.60
Foot pad score14.71 ± 12.9917.00 ± 11.80
Table 5. Feed conversion ratio (kg feed/kg bodyweight gained) and corrected feed conversion ratio ± standard deviation in the control (CG) and trial groups (TG) over six trial runs.
NCG TG
FCR61.39 ± 0.021.38 ± 0.02
corr. FCR61.39 ± 0.051.38 ± 0.04
Table 6. Average dry matter (g/kg) of the litter ± standard deviation in the control (CG) and trial groups (TG) on the examination days.
Day CG
(n = 130)
TG
(n = 180)
14737.89 ± 74.63735.21 ± 55.76
21741.35 ± 79.36737.48 ± 88.26
28699.55 ± 120.96701.37 ± 111.22
Table 7. Dry matter (g/kg) ± standard deviation of the litter samples taken in the trial group divided by the enriched and non-enriched areas in the barn on the examination days.
Day Enriched AreaNon-Enriched Area
14745.38 a ± 53.94728.44 b ± 56.16
21745.54 a ± 92.68732.10 a ± 85.20
28713.31 a ± 86.77693.41 a ± 124.65
a,b Means in a row with different superscripts differ significantly (p < 0.05).
Table 8. Dry matter (g/kg) ± standard deviation of the litter in the trial group regarding the different types of environmental enrichment used in that area.
Dayn (per Enrichment) = 24Trial
14Enrichment 1730.62 ± 52.44
Enrichment 2747.04 ± 62.86
Enrichment 3758.45 ± 51.21
21Enrichment 1748.58 ± 88.81
Enrichment 2754.66 ± 90.96
Enrichment 3733.37 ± 100.51
28Enrichment 1728.0.8 ± 96.58
Enrichment 2707.08 ± 93.90
Enrichment 3704.75 ± 68.92
Table 9. Foot pad disease score ± standard deviation, in accordance with Mayne, scored for both feet of 50 birds per day in the control (CG) and the trial groups (TG).
CG TG
Day of LifenFPD ScoreFPD Score
143001.24 a ± 1.230.73 b ± 0.87
213002.19 a ± 1.761.52 b ± 1.61
283002.45 a ± 1.932.38 a ± 2.22
a,b Means in a row with different superscripts differ significantly (p < 0.05).
Table 10. Average values (ppm) ± standard deviation over periods of one week each for carbon dioxide (CO2) and ammonia (NH3) in the air of the trial group.
WeekCO2NH3
12934.21 A ± 606.160.10 C ± 0.11
22493.35 B ± 395.680.77 C ± 0.39
32209.08 AB ± 683.972.70 B ± 1.64
42036.97 C ± 458.462.67 B ± 1.45
51909.58 C ± 215.485.55 A ± 1.00
A–C Means in a column with different superscripts differ significantly (p < 0.05).
Table 11. Average values (ppm) ± standard deviation over periods of one week each for carbon dioxide (CO2) in the air in the enriched and non-enriched areas of the trial group.
Enriched AreasNon-Enriched Areas
WeekCO2CO2
12891.77 A ± 644.662962.50 A ± 596.46
22489.57 AB ± 412.092495.87 B ± 396.47
32190.66 BC ± 713.402221.36 BC ± 684.34
42021.35 BC ± 471.652047.38 C ± 462.96
51886.84 C ± 225.491924.75 C ± 215.15
A–C Means in a column with different superscripts differ significantly (p < 0.05).
Table 12. Average values (ppm) ± standard deviation over periods of one week each for ammonia (NH3) in the air in the enriched and non-enriched areas of the trial group.
Enriched AreasNon-Enriched Areas
WeekNH3NH3
10.10 C ± 0.120.10 C ± 0.11
20.77 C ± 0.410.77 C ± 0.39
32.69 B ± 1.692.71 B ± 1.66
42.62 B ± 1.452.70 B ± 1.50
55.49 A ± 0.985.59 A ± 1.05
A–C Means in a column with different superscripts differ significantly (p < 0.05).
Publisher’s Note: MDPI stays neutral with regard to jurisdictional claims in published maps and institutional affiliations.

