1. Introduction
Within the last decade, reactive power in the distribution network has been observed to be trending from a lagging power factor toward a leading power factor [
1,
2,
3,
4,
5,
6]. Reactive power affects the efficiency of electrical power systems, increasing the amount of energy generated and increasing the cost of the energy provided and consumed with the consequent detrimental impacts on environmental sustainability [
7], particularly in systems predominantly using fossil fuels [
8]. Reactive power can appear due to reactive elements and loads [
7], which are the focus of this study.
Too much reactive power in the system can lead to overvoltage in the network [
5]. Great Britain’s transmission system operator observed a shift in network power factor where, between 2007 and 2010, only one voltage rise was observed beyond set limits. In contrast, between 2011 and 2012, there were 165 voltage rise excursions [
6]. In the Australian state of Victoria, high voltages have been estimated to have resulted in 237 gigawatt hours of increased electricity consumption per year, with the equivalent carbon emissions of 62,000 internal combustion engine cars per year [
9].
Overvoltage in the distribution network also affects the distribution system operators’ assets causing premature failure and more maintenance being required in order to sustain reliable operation [
10,
11]. Overvoltage can cost network operators substantial amounts of money to manage. For example, for the above situation in Britain, estimates of the investments needed to address the overvoltage were in the order of hundreds of millions of British pounds [
6]. In turn, the increasing costs faced by network operators are substantially passed on to consumers in the form of their electricity bill for the distribution costs [
12,
13].
Overvoltage can also directly impact consumers with likely damage to appliances, increased electricity usage bills, and increased carbon emissions, given that a substantial proportion of electricity generation in Australia is from fossil fuels [
8]. That is, sustained overvoltage can reduce the life span of electrical appliances [
8,
14,
15,
16,
17] by more than 22 percent, with light sources such as lamps having their life span reduced by as much as 50% [
13,
15]. Overvoltage causes greater energy consumption from appliances, and this greater consumption causes an increase in the usage aspects of electricity bills [
17,
18], which could also increase carbon emissions in countries such as Australia that are still heavily reliant on fossil fuels [
17].
Overvoltage in Australia is also occurring due to the injection of active power at low load times from residential rooftop photovoltaic (PV) generation [
19,
20]. A further consequence is that customers with rooftop PV systems get curtailed in times of overvoltage and lose potential earnings [
21,
22]. To address these and other potential impacts, new smart rooftop PV systems are required to meet the recently implemented Australian Standard 4777.2, where inverters have been set so that if the voltage reaches undervoltage or overvoltage, the inverter system will inject or absorb reactive power [
23]. The new Australian Standard was applied in December of 2019 and does not apply to rooftop PV installed before that date, meaning there is still a chance of curtailment for customers who do not have the now-required settings [
23].
The purpose of the paper is to assess a variety of household loads for their potential to contribute reactive power to the system, particularly with recent changes in the nature of household appliances and devices. Another possible source of overvoltage could be the types of loads seen in households today varying substantially from those in the past in terms of their design and efficiency. In the past, loads tended to be resistive and inductive in appliances such as motors, transformers, heating, and refrigeration [
5]. With technological advances, specifically power electronics, nonlinear loads such as inverters, rectifiers, and switch mode power supplies (SMPS) have seen an increased uptake in households, impacting distribution networks [
24,
25]. Nonlinear loads are electronic devices that control the load when the current is drawn, resulting in a non-fundamental current waveform [
24]. Examples of these loads in households are devices such as light emitting diode (LED) lighting, LED televisions, mobile phone chargers, and other SMPS devices such as computers [
24]. The SMPS converts AC supply from the wall to DC and is common in a large range of devices [
15], especially those household devices and appliances with batteries being charged.
Several common loads in a typical household are capacitive with the injection of reactive power back out of the device in a previous test of appliances in Latvia in around 2014 [
1]. Those devices included LED TVs, notebooks, laptops, wi-fi routers, LED bulbs, and mobile phone chargers. Comparable results were seen in a study conducted in India of home appliances’ effects on power quality, confirming the injection of VAR into the network from these devices [
26]. With nonlinear loads being smaller and more efficient than large conventional linear loads, the proliferation of these devices may have been due to their apparent energy efficiency and benefit to greenhouse gas emissions. Global changes in consumerism in the past decade and government schemes to limit greenhouse gas emissions have resulted in the substantial uptake of these devices in residential households [
27].
Consequently, a simple categorization of appliances can be derived. There are two main groupings of appliances at a broad level: standard home appliances and modern home appliances, which may have nonlinear loads. Standard home appliances have been analyzed in previous studies [
1,
8,
28]. Still, more analyses need to be done with the growing penetration of modern appliances using LEDs or SMPS technology into modern households. In turn, these modern appliances can be categorized by their three main forms: lighting, displays, or appliances using power adaptors. The result is that common residential appliances and devices can be categorized into four categories: standard home appliances, lighting, displays, or power adapters. The first group, standard home appliances, have been around for a long time and do not have a dominant LED or SMPS technology in their design, while the other categories do.
The second category is lighting. LED lights have several benefits over the standard incandescent lightbulb that was predominantly used before them. LEDs are regarded as much more energy efficient than incandescent bulbs, with an LED having a wattage several times lower than an incandescent bulb for the same lumens [
1,
29]. Some governments, such as the state of Victoria in Australia, have had campaigns to encourage the adoption of LEDs across households [
30]. With government programs and the benefits of LEDs over other types of bulbs, the Asia Pacific LED lighting market was valued at
$27.5 billion in 2021 and is expected to grow at a compound annual growth rate (CAGR) of 13% from 2021 to 2026 [
31]. With the average Australian home having 37 light bulbs, this market growth, accelerated by government initiatives, suggests that a growing proportion of those 37 lights will be LEDs [
32]. However, LED bulbs have been found to operate at a low power factor of 0.44 leading [
1]. Though an incredibly efficient light source at only 3 W, its apparent power use is 6.8 VA, over 225% of the expected power consumption.
The past decade has also seen a large change in the uptake of the third category, displays, due to advancements in power electronics and innovation. The nature of televisions (TVs) has changed from cathode ray tube (CRT) technology to liquid crystal display (LCD) and plasma technology [
33]. With the development of LED TVs and monitors, LCDs have seen a reduction in their market share, with only a growth rate of 4.9% for 2021 compared to 37.1% for LED TVs [
34]. These new advancements in efficiency have reduced TV energy usage to only 6.8% of the total household [
35].
With estimates of the LED display market having a CAGR from 2021 to 2026 of 29.1% compared to the LCD market’s CAGR of 3.5%, LED displays are starting to dominate new penetration into the display market [
34]. Analyses of LED TVs show that they may absorb less than 50% of the wattage that LCD TVs absorb [
35]. However, lower-wattage LED TVs have a worse power factor outputting almost double the reactive power of an LCD when absorbing a similar number of watts [
35]. With the thousands of customers on distribution networks and the large market penetration of LED TVs, the effects of this reactive power injection at a distribution level could be substantial [
34,
36].
The fourth category of appliances covers SMPS technology, particularly chargers, with the appended consideration of wi-fi routers. Over the past 20 years, the world has seen ever-changing advancements in computers and handheld devices, which has led to increasing penetration of desktops and, now more commonly, laptops and mobile phones. The growth of these appliances and devices has accelerated in many countries with the advent of the COVID-19 pandemic, where many companies and organizations were forced to allow their staff to work from home, resulting in an 8.8% and 11.7% increase in laptops and handheld devices such as tablets, respectively, worldwide in 2021 [
37].
Laptop computers and mobile devices are reliant on chargers that convert the AC wall supply to a DC supply. Though the charging load of these devices is small, in 2019, there was an average of 18.9 internet-connected devices per Australian household, which is expected to increase to 35.6 by 2024 [
38].
The main technical contribution of this study is the assessment of household devices and appliances in terms of their power usage. Four types of load groups will be tested, categorized as standard home appliances, lighting, displays, and power adapters. Devices that fall under standard home devices are appliances that have been adopted into households for a long time and possess no dominant LED or SMPS technology in their design, while the other categories do. The main novel technical contribution is the assessment of devices and appliances with forms of power usage that differ relative to household devices of the past. The pattern of loads and power factors across these appliances will help us understand the likely impact of these appliances on distribution networks now and in the near future.
2. Materials and Methods
The experimental setup was similar to [
39], with adjustments due to equipment availability. In replacement of their signal and power source is a standard power outlet and the power meter Metrix PX 120 along with two multimeters. The resulting circuit design is shown in
Figure 1. The measured parameters shown in Tables 1–6 are real power (W), reactive power (VAR), and the power factor (PF), where their typical measurement errors are 1.5%, 2%, and 1%, respectively. The two multimeters are used to measure current (Amps) and voltage (Volts), where their typical measurement errors are 0.1%. All the devices used in the measurements are true root mean square (TRMS) meters suitable for measuring non-sinusoidal loads. The standard voltages in Australia are specified in the Australian Standards [
40], where the nominal voltage is 230 V (–6%,+10%), which gives a range of 216 V to 253 V.
To ensure that a consistent approach was taken to collect data from each appliance, the method from [
39] was used, where they allowed appliances to run for 5 min and reach a steady state operation before collecting data. A video camera was set up to record the metering equipment over the 5-min period, allowing all parameters being measured to be seen live. The experimental setup is shown in
Figure 2.
The data presented by the power meter was W, VAR, and PF, and the data presented by the multimeters were volts and amps. The apparent power (VA) was calculated by applying S = VI using the values of V and I from the multimeters. The PF has been included in the results as the load size will vary from appliance to appliance and allows for comparing small loads to large loads. Values will be out of one, with one being purely resistive, positive values meaning a lagging load, and negative values indicating a leading load. Volts are included in the data collection to ensure that the volts supplied by the power do not vary by a large amount while testing is taking place. The rated wattage was obtained from the nameplate or manual of the appliances.
3. Results
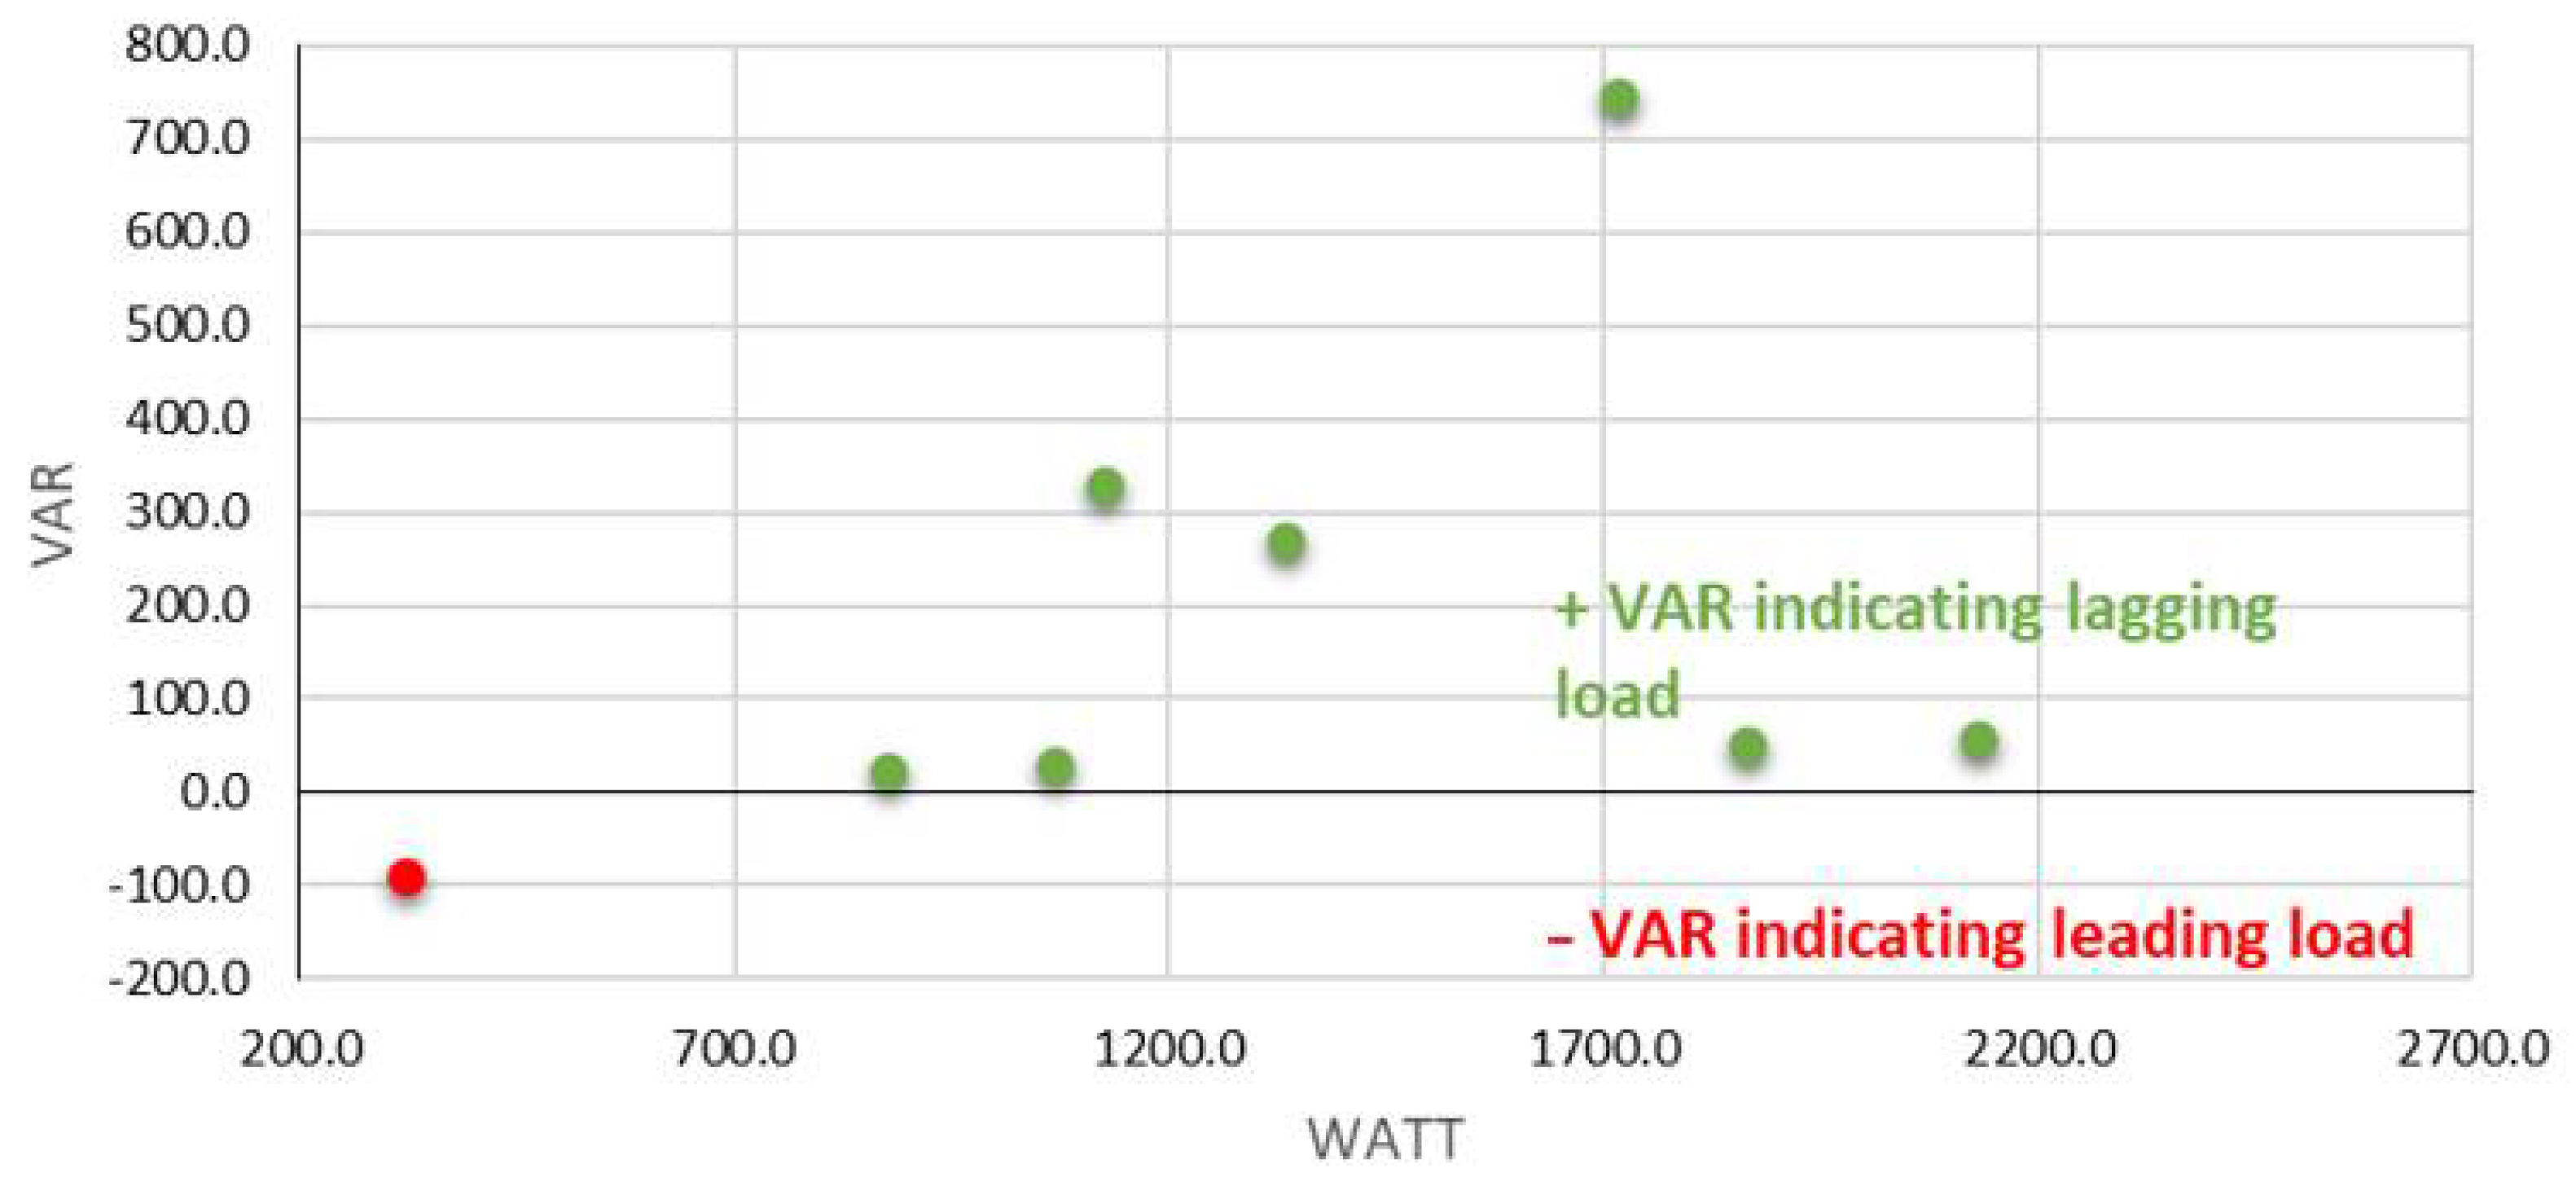
The majority of household appliances tested showed a leading power factor. Through our appliance testing procedure, a total of 56 different devices were tested, with 11 demonstrating a lagging power factor, 4 being purely resistive, and 41 having a leading power factor. These were all common devices found around most homes and were separated into various categories depending on the technology they possessed. All the modern appliances of switch mode power supply and LED technology have leading power factors with a considerable amount of VAR injection, as seen in
Figure 3.
Figure 3 shows the device’s power consumption in watts on the x-axis and the reactive power consumption or injection on the y-axis. Modern devices possess enhanced efficiency using SMPS and LED technology [
2,
3], where the load size compared to standard home appliances is minimal, prompting the use of
Figure 4 to represent these large loads. Further analysis is done below to understand each appliance technology and their respective power flow and factor.
The standard home devices are grouped as appliances found in households in the past, such as fans, refrigerators, vacuum cleaners, and kitchen appliances [
6]. These appliances have shown little technological change to their design, possessing motors, compressors, and heating in their topologies. For the analyses, these devices have been split into load sizes by small and large, with small devices being devices under 200 W of measured real power that generally operates for long periods. In contrast, the larger devices often only operate for short periods at loads generally over 1000 W. Note that the rated wattage was often different from the measured real power. In
Figure 4, a group of small loads can be seen that include a variety of fans and a refrigerator, all demonstrating lagging power factors with the consumption of VARs.
The fans tested exhibited various power factors, as seen in
Table 1, with the desk fans showing inefficient power factors of 0.56 and 0.7 with the absorption of 30.9 and 18.1 VARs, respectively. The high-velocity fan had a very efficient power factor of 0.94, absorbing only 3.9 VARs more than the Anko mini desk fan, which is expected as the efficiency of motors increases as they get closer to their rated load. The Anko mini desk fan is operating at just over 80% of its rating, while the high-velocity fan operates at nearly 95%. The refrigerator was found to be very efficient.
The large standard appliance testing can be seen in
Table 2. In a similar manner to [
25] the heating element loads in the water kettle, toaster, sandwich press, and iron are seen to be nearly purely resistive with power factors of 0.99. These appliances only absorb a small amount of VARs, ranging from 24.2 in the toaster to 56.8 in the kettle. The remaining devices absorb larger amounts of reactive power due to the electric motors implemented in their design. The vacuum cleaners both show a similar absorption with 269.1 VARs and 328.8 VARs, while the microwave shows a significant increase at 747.4 VARs.
To understand the power flows of lighting, various lighting types were tested with halogen, incandescent, and LED as well as varying sizes. The results of this testing can be seen in
Table 3, with all LED lighting having leading characteristics, while halogen and incandescent were purely resistive with power factors of 1. LED bulbs are observed to be less efficient than LED downlights, with power factors of around −0.6 compared to around −0.9, respectively. With the bulbs operating at such a low leading power factor, VAR injection was more than real power consumption. Apparent power use across the measured bulbs is between 150% and 200% of their rated wattage. Though the downlights appear more efficient in terms of their power factor, an injection of nearly four VARs is still seen across all tested. With the widespread installation of these devices, the overall effect on household load could be notable.
All of the televisions tested (in
Table 4) possessed leading characteristics, including the LCD and the plasma, demonstrating the export of reactive power. Two of the four LED televisions show a much less efficient power factor of roughly –0.6 compared to the close unity seen in all other televisions. The Hisense LED TV, Panasonic OLED, and Hitachi plasma demonstrate impressive efficiency with power factors of –0.96. However, the power consumption varies heavily between the displays, with the plasma absorbing and injecting over four times the amount of watts and VARs, respectively, of the Hisense, despite being 15″ smaller on the diagonal.
The monitors have similar technology to that found in televisions. They only have slight variations in design, such as size and image quality, and the power factor of these appliances is expected to be similar. Results in
Table 5 indicate that the LED monitors possess similar properties to two of the LED televisions tested, with all eight operating at a power factor between –0.52 and –0.67 leading. With these power factor levels, VAR exports are more than the real power consumption of the device, which is a similar effect to two of the LED televisions and the LED bulbs. The LCD monitor had a power factor of –0.47, vastly different from the three LCD televisions with efficient power factors of around –0.9.
A large variety of switch mode power supply devices were tested, with
Table 6 showing all exhibiting similar power factors between 0.47 and 0.63 leading. With a consistent power factor across load size, a linear increase in VAR output with load size is seen in
Figure 3, and operating in this range of power factor sees a large export of VARs from all these devices.
4. Discussion
The main technical contribution of this study is the assessment of household devices and appliances in terms of their power usage. The results show that modern appliances are changing household VAR flow. The likely effects on the net power flow in households can be seen with the results of our testing of household appliances, with 41 of the 56 appliances having a leading power factor exporting reactive power.
The standard home appliances tested were all lagging as anticipated. However, due to the small load size of the desk fans, the small consumption of VAR drastically drops the power factor. The refrigerator, containing a compressor, had a lagging power factor of around 0.65, though it operates very efficiently with a power factor of 0.96. The large standard appliances all operate at efficient power factors above 0.9. However, with the increased load size comes a large increase in VAR consumption compared to the smaller devices that export VARs. However, although reactive power consumption reaches up to nearly 750 VAR when the microwave is operating, these devices are usually only used for several minutes at a time. Overall, the small and large standard appliances have a small VAR consumption or only operate for short periods of time.
All of the LED lighting assessed above were found to be operating at leading power factors. Therefore, the household reactive power flow from LED lighting is expected to increase as LED penetration increases. With government programs changing the lighting in many businesses and households to LED technology [
30], these results show tensions in our efforts to move toward more sustainable energy use. Although CO
2 emissions are dropped with the increased efficiency of LEDs relative to halogen and incandescent bulbs, the effect on the network power factor and efficiency may result in unanticipated side effects.
The variety of televisions tested showed that LED televisions exhibited a much more efficient power consumption relative to size than LCD and Plasma. Results for these LED televisions varied substantially, with the power factors of the two brands operating at around −0.6, matching results from [
23], while the other two brands had power factors of −0.96. However, when the load size is considered, the Panasonic television still exported a large amount of VAR flow, at around 90 VARs, which was similar to the Bauhn and Dick Smith at around a third of the size load. LCD and LCD LED both had minimal VAR output with their moderately efficient load. Still, with their declining market penetration, the effect on household VAR flow is expected to be minimal. Similarly, although plasma had the largest VAR output, plasma displays only accounted for 16% of TV shipments in 2011 [
34]. The introduction of LED TVs has made plasma televisions unusual in households.
The monitor testing results varied slightly to the results for the televisions, with all power factors being around −0.6, comparable to the power factors of the displays in [
35]. The VAR output of the monitors is more than the watt consumption. With COVID-19 accelerating sales of monitors for working from home, the reactive power flow in households is expected to be affected greatly. Furthermore, the variety of switch mode power supplies operating in a similar range of leading power factors would increase household VAR flow with VAR injection more than real power consumption.
The resulting overvoltage could damage customer appliances and cause issues for networks. Networks may need to manage these issues with reactor banks or the like (e.g., see [
41]), although the more widespread use of power factor correction (e.g., per [
42]) could help to delay or lessen the need for network interventions.
In terms of limitations, note that the appliances assessed above were a relatively narrow sample of the appliances available in the market. Future research may wish to assess a wider range of small appliances, including a wider range of LED lighting, modern TVs, and appliances with switch-mode power supplies, to see whether or not the power factor is poor across most brands and products. Such a breadth of testing may be needed to inform appliance design considerations in the future.

 and
and 


