
Experimental Investigation on the Shear Characteristics of Frozen Silty Clay and Grey Relational Analysis
School of Highway, Chang’an University, Middle-Section of Nan’er Huan Road, Xi’an 710064, China
*
Author to whom correspondence should be addressed.
Sustainability 2023, 15(1), 180; https://0-doi-org.brum.beds.ac.uk/10.3390/su15010180
Submission received: 7 November 2022
/
Revised: 14 December 2022
/
Accepted: 17 December 2022
/
Published: 22 December 2022
(This article belongs to the Special Issue Achieving Sustainability in Civil and Construction Engineering through Emerging Technologies)
Abstract
:In the spring thawing season, the decrease in the strength of frozen soil caused by temperature may lead to slope instability. Therefore, researchers have studied the relationship between the temperature and strength of the freeze-thaw zone. However, previous studies have considered the impact of thawing temperature on the strength, but less research on shaping temperature. Therefore, direct shear tests were performed on specimens with different thawing temperatures (i.e., −5, −2 and 1 °C) and different water contents (i.e., 9, 16, and 23%) at different shaping temperatures (i.e., −2, −7 and −12 °C). The results indicated that: the stress-strain curves under different test conditions exhibited strain softening characteristics; shear strength and shear index decreased with increasing shaping temperature; the effect of cohesion on strength was greater than that of internal friction angle; the mechanical mechanism in the freeze-thaw zone was related to the unfrozen water content of the specimen. In addition, the grey correlation analysis showed that the water content had the greatest effect on the shear index, while the shaping temperature had the least effect on the shear index. The grey relational grade of shaping temperature was greater than 0.5, indicating that the effect of shaping temperature on strength was not negligible.
1. Introduction
With global warming, slopes on the Qinghai-Tibet Plateau are destabilized frequently due to the degradation of permafrost, which not only endangers the construction and operation of projects but also has a great impact on the ecological environment. Most of the engineering construction work in cold areas is carried out in the warm season. Although engineering construction in cold regions minimizes the disturbance of frozen soil, deep frozen soil will inevitably be directly exposed to the atmosphere, such as through slope excavation. The freeze-thaw zone starts to appear inside the exposed frozen soil due to the air temperature, and this can have a significant effect on the strength [1,2,3]. However, different from the freeze-thaw zone in spring, the freeze-thaw zone of deep frozen soil exposed to air has a larger temperature gradient, which makes the change in the strength of the freeze-thaw zone more complicated. The drastic change in strength may make the freeze-thaw zone become the weak zone of a slope, which may induce landslides [4,5,6,7]. Therefore, it is necessary to study the influence of the combined action of air temperature and ground temperature on the shear characteristic of the freeze-thaw zone.
Studies have shown that the instability of slopes in cold regions is mostly related to the thawing of frozen soil [8,9]. Water content and temperature have a pivotal role in the strength variation of frozen soil [10,11]. Qin et al. [12] and Zhou et al. [13] found that a slight increase in temperature could cause a reduction of strength when the temperature is close to the freezing point of ice in frozen soi. Meanwhile, some studies have believed that the shear strength of frozen soil is mainly influenced by unfrozen water content and ice content [14,15].
Therefore, a series of laboratory experiments were conducted by researchers to investigate the change mechanism of strength in the freeze-thaw zone. Through indoor tests, Peng et al. [16] found that temperature and water have a great influence on the strength of frozen silt soil. Ge et al. [17] studied the effect of freeze-thaw cycles on shear strength. Wang et al. [18] believed that cohesion has a great influence on strength of frozen soil than internal friction angle. Moreover, researchers have also investigated the influence of soil type, confining pressure, and other factors on the strength of frozen soil [19,20].
In addition, some scholars have studied the shear properties of soil and the soil-structure interface. Yazdani et al. [21] investigated the influence of the thermal cycle on the shear characteristic of soil—the pile interface through a direct shear test. Zhao et al. [22] carried out indoor tests to study the mechanical properties of the soil-pile interface and proposed a constitutive model, which can describe the shear stress-displacement variation law of the interface. Noroozi, A. G et al. [23] conducted a series of tests to study the shear characteristic of the soil-concrete interface. Huang et al. [24] investigated the effect of temperature on the shear properties of the soil-ice interface through low-temperature shear tests.
However, the previous research on the factors that affect the shear characteristics of the freeze-thaw zone is limited to the thawing temperature. The influence of the shaping temperature of frozen soil is rarely reported. Generally speaking, the shaping temperature of the soil during the cold season is mainly influenced by the ground temperature; while the thawing temperature is mainly controlled by the atmospheric temperature during the spring thaw. When the frozen soil thaws, the temperature at the freeze-thaw zone is influenced by a combination of atmospheric and ground temperatures. Therefore, to simulate the effect of the freezing state of frozen soil at different ground temperatures on the strength of the freeze-thaw zone, direct shear tests were conducted on samples with different water contents and different thawing temperatures () at different shaping temperatures (). Based on the shear stress versus shear displacement curves under different conditions, the shear behaviors of the freeze-thaw zone were described in detail. The effects of the factors on shear strength and shear index were analyzed. In addition, the degree of influence on strength of shaping temperature, thawing temperature, and water content on shear strength was also analyzed. These findings contribute to a further understanding of the mechanisms of mechanical changes in the freeze-thaw zone.
2. Experimental Materials and Methods
2.1. Materials
2.2. Samples Preparation
A cutting ring, with a height of 20 mm and diameter of 61.8 mm, was used to prepare the sample. The procedure for preparing the sample is as follows: Firstly, the soil was added with water depending upon the required water content, and then it was enclosed for 24 h. Secondly, the soil was pressed into the cutting ring using a press until the sample height reaches 20 mm. Thirdly, the soil with the cutting ring and the shear box was frozen at the pre-designed shaping temperature (i.e., −12, −7, and −2 °C) for 24 h. After freezing was complete, the sample in the cutting ring was removed and placed in the environmental box to await the start of the test. The sketch of the test sample was shown in Figure 2.
2.3. Direct Shear Apparatus
The test device is shown in Figure 3, which is composed of a direct shear apparatus, an environmental box (precision: ± 0.5 °C), and an automatic data acquisition system. The direct shear apparatus was placed in an environmental box during the test, as shown in Figure 3d. All temperatures were controlled by the environmental box, including the shaping temperature and the thawing temperature.
2.4. Experimental Process and Design
Firstly, the prepared sample was placed in the cooled shear box and the bolts on the box were tightened. Secondly, the box was wrapped with insulating foam except for the top. After the insulation foam has been wrapped, the samples were frozen at pre-designed thawing temperatures (i.e., −5, −2, and 1 °C) to allow the samples to start warming from the top down. Finally, with the temperature at the specified location of the specimen reaching the design value (thawing temperature), the direct shear test started and data was recorded by the data acquisition system at the same time. To ensure that the temperature at the shear surface reaches the pre-designed thawing temperature, a comparison specimen exists for the test. All operations on the comparison sample were identical to the test sample, except that a micro-thermometer was buried at the freeze-thawing zone. Before the test starts, the comparison specimen is first frozen in the environmental chamber to the shaping temperature. Then the specimens were thawed at the thawing temperature and the time taken to reach the thawing temperature at the specified position of the specimen was recorded with a stopwatch. The recorded time will be used as the calibration time for the sheared specimen. When the thawing time of the shear specimen in the environmental chamber reaches the calibrated value, the shear test starts immediately. The calibration values required for sample thawing under different conditions are shown in Table 2.
Based on the water contents of the less-ice, more-ice, and rich-ice permafrost, the water content of the samples was taken as 9%, 16%, and 23%, respectively. The shaping temperature was set to −12 °C, −7 °C, and −2 °C to simulate the ground temperature. At the same time, considering the sensitivity of the freeze-thawing zone to temperature, the thawing temperature was set to −5 °C, −2 °C, and 1 °C. Because the consolidation and drainage effects were not considered, the quick shear test is used in this paper. The test shear rate was set at 0.8 mm/min and the normal stresses were 100, 200, 300, and 400 kPa. The experimental scheme is shown in Table 3.
3. Results and Analysis
3.1. Stress-Strain Curves of the Freeze-Thawing Zone under Different Conditions
As shown in Figure. 4, the shear stress-displacement curves of the samples exhibit strain softening under different factors (In the figure, represents the water content of the sample, is the shaping temperature, and is the thawing temperature of the sample). The stress-strain curve for each sample under different shear conditions is divided into three phases: linear growth, plasticity increase, and shear failure.
Figure 4a shows the stress-strain relationship curves of fine-grained soils at different water contents ( = −5 °C, = −12 °C). As can be seen from Figure 4a, the shear stress increases with the increase of shear displacement at different water contents, and there is a positive correlation between them. The influence of water content on the shear characteristics of the sample is significant. Under the condition of constant temperature, the larger the water content, the larger the corresponding peak stress. The shear displacement corresponding to the peak stress is mainly concentrated in 5–6 mm, and the shear displacement corresponding to the peak stress increases with the increase of the normal stress.
From Figure 4b ( = 23%, = −12 °C), it can be seen that the trend of the stress-strain curves of the specimens at positive and negative temperatures are not the same. At a temperature of 1 °C, the linear growth interval of the stress-strain curve is mainly concentrated in the shear displacement range of 0–2 mm, and the plastic growth phase is concentrated in the shear displacement range of 2–4.5 mm. When the temperature is negative, the linear growth range is 0–4 mm, and the plastic growth range is 4–5.5 mm. It can be seen that the linear growth interval at negative temperatures is about 100% higher than the interval corresponding to positive temperatures. The plastic growth interval is 60% smaller than the one corresponding to the negative temperature. This indicates that the elastic properties of the specimens at negative temperatures are better than those at positive temperatures, while the plastic properties are just the opposite. This is related to the presence of ice in the specimens. In addition, the shear displacement corresponding to the peak stress of the specimen at 1 °C was concentrated in the range of 4.2–5.8 mm, while the shear displacement corresponding to the temperature of −5 °C was concentrated in the range of 5.5–6.0 mm. It can be found that both the peak stress and shear displacement of the specimen increased as the temperature decreased.
Figure 4c plots the stress-strain relationship curves of fine-grained soils at different shaping temperatures ( = 23%, = −12 °C). Since the thawing temperature is 1 °C, the development trend of the stress-strain curve of all specimens is the same as that of the positive temperature in Figure 4b. The linear growth stage of the stress-strain curve of the sample is concentrated in 0–2 mm, while the plastic growth stage is concentrated in 2–4.5 mm. This is mainly related to the presence of free water in the specimen when the temperature is 1 °C. In addition, the peak stress of the specimen decreases with the increase in the shaping temperature, which indicates that the shaping temperature will affect the shear characteristics of the sample.
The curves of different factors versus the peak shear stress of the specimen are plotted in Figure 5. It can be seen from Figure 5a that the shear strength decreases with increasing water content when the thawing temperature is positive, while the opposite is true when the thawing temperature is negative. From Figure 5b, it can be seen that the shear strength increases with the decrease in thawing temperature. As the thawing temperature increased from −5 °C to 1 °C, the peak stresses in the specimens decreased by 11.0%, 17.0%, and 23.0% when water contents is 9%, 16%, and 23%, respectively. Figure 5c plots the shaping temperature versus peak stress, and it can be found that as the shaping temperature increases from −12 °C to −2 °C, the peak stress of the specimen decreases by 20.7%, 13.0%, and 16.9% when water contents are 9%, 16%, and 23%, respectively. In conclusion, the change of peak stress is not only affected by temperature but also related to the initial water content.
3.2. Effect of Different Factors on Shear Strength
The shear stress-strain curves of the soil sample are all strain softening, so the peak shear stress is taken as the shear strength in accordance with the Geotechnical Test Specification (SL237-1999). The shear strength of specimens is described in Equation (1).
where is shear strength, is cohesion, is normal stress, and is internal friction angle.
The shear strength versus normal stress under different water content and thawing temperature at shaping temperatures of −12 °C, −7 °C, and −2 °C are shown in Figure 6, Figure 7, and Figure 8, respectively. As can be seen from Figure 6 and Figure 7, the shear strength decreases with increasing temperature and increases with increasing normal stress. The influence of water content on strength is related to the temperature of the frozen-thaw zone. From Figure 8, we can see that when the temperature is higher than 0 °C, the higher the water content, the lower the strength, while the temperature is lower than 0 °C, and the higher the water content the higher the strength. It can be found that the shear strength is affected by the combination of water content, thawing temperature, and shaping temperature.
3.2.1. Effect of Water Content on Shear Index
Figure 9 shows the influence of water content on the shear index under different thawing temperatures when the shaping temperature is −7 °C. It can be found the shear index varies at different thawing temperatures as the water content rises. At a temperature of 1 °C, the cohesion of the specimens decreased by 34.20% and the friction angle decreased by 4.01% as the water content increased from 9% to 23%. At a temperature of −2 °C and −5 °C, the cohesion increased by 37.16% and 64.43% as the water content increased from 9% to 23%, while the friction angle increased by only 2.25% and 3.58%, respectively. When the temperature is −2 °C and −5 °C, as the water content increases from 9% to 23%, the cohesion of the specimen increases by 37.16% and 64.43%, respectively, while the friction angle increases by 2.25% and 3.58%, respectively. It can be found that the shear index of the specimen increases at a negative temperature and decreases at a positive temperature as the water content increases, and the change of strength in the freeze-thaw zone is mainly caused by cohesion. This phenomenon is closely related to the state of water in the specimen.
3.2.2. Effect of Thawing Temperature on Shear Index
Figure 10 shows the relationships between thawing temperature and shear index under different water content (9, 16, and 23%) at a shaping temperature of −7 °C. It can be seen that the shear indexes decrease with increasing thawing temperature. When the thawing temperature rises from −5 °C to −2 °C, the percentage reduction of cohesion was 52.70%, 38.03%, and 64.64% for water contents of 9, 16, and 23%, respectively, while the percentage reduction of friction angle was 3.07%, 8.14%, and 10.88%, respectively. This indicates that when the thawing temperature is below −2 °C, the change of strength in the freeze-thaw zone is mainly caused by cohesion. As temperature rises from −2 °C to 1 °C, the internal friction angle decreased by 1.12%, 3.46%, and 9.67% at a water content of 9, 16, and 23%, respectively, while the cohesion decreases by 8.68%, 25.81%, and 36.98%, respectively, under the same conditions. This means that cohesion is still the main factor affecting shear strength.
3.2.3. Effect of Shaping Temperature on Shear Index
Figure 11 shows the relationships between shaping temperature and shear index under different water content (9%, 16%, and 23%) and thawing temperatures (1 °C). It can be found that the shear index tends to decrease as the shaping temperature increases. As the shaping temperature increased from −12 °C to −2 °C at a positive thawing temperature, the internal friction angle decreased by 2.71%, 0.51%, and 1% at a water content of 9%, 16%, and 23%, respectively, while the cohesion decreased by 59.11%, 58.86% and 62.06% at the same conditions. These results suggest that although the shear index at the freeze-thaw zone varies less with shaping temperature at a thawing temperature of 1 °C, it still affects the strength, and the variation in shear strength is mainly related to cohesion.
3.3. Grey Relational Analysis (GRA)
The principle of GRA is to examine the geometric proximity between factors to analyze and determine the extent of influence between factors [25]. Therefore, GRA can be used to investigate the extent to which different factors influence the shear strength of the sample. The calculation process consists of five steps, as shown in Figure 12.
First of all, as is seen from the flowchart, the reference sequences () and comparison sequences () are determined according to the content of the study.
Secondly, the reference and comparison sequences need to be normalized. In this study, the normalized equation is described in Equation (2).
where indicates the normalization value, is the comparative sequence, express the mean value of and express the variance of .
Next, the grey relational coefficient needs to be calculated using the following Equation (3).
where is the deviation value between and . and is the maximum and minimum value of ; is the identification coefficient and is taken to be a value of 0.5 [26,27].
The order of Grey relational grade determines the degree of importance of the influencing factors, the greater the grade, the higher the degree of association. The equation described in Equation (4)
In this study, the shear index represented the reference sequence, and influence factors (water content, thawing temperature, shaping temperature) represented comparison sequences. The reference and comparison sequences are presented in Table 4.
In this section, taking the internal friction angle as an example, the specific calculation process is given according to the flowchart of GRA. The results of normalization and the grey relational coefficients of factors on internal friction angle are shown in Table 5 and Table 6. The grey relational degree of factors on internal friction angle and cohesion are shown in Table 7.
Table 7 shows that the grey relational grades of shaping temperature, water content, and thawing temperature are greater than 0.5, which indicates that all three factors have a significant influence on the shear index of the sample. Water content has the greatest effect on the shear index while shaping temperature has the least effect on the shear index. The effect of thawing temperature on the shear strength of fine-grained soils is more significant than that of shaping temperature. Although the effect of shaping temperature on strength is weaker than that of thawing temperature, the results of the grey correlation analysis show that the effect of shaping temperature is not negligible.
4. Discussion
From the results, the state of water is the intrinsic factor affecting the shear strength, while the temperature is the extrinsic driving force for the change of water state. The shear characteristics of the freeze-thaw zone are determined by both temperature and water content. This finding is consistent with that of Zhu et al. [28] who believe that the change of water under the influence of temperature is an important factor causing the change of frozen soil strength. According to some researchers, the relationship between temperature and water in frozen soil can be linked by the change in unfrozen water content, and they proposed some prediction models for unfrozen water based on experimental data [29]. Taking the Anderson prediction model as an example, the change process of unfrozen water is divided into three regions: the rapid variation zone (0–−5 °C ), the slow variation zone (−5–−10 °C), and the stability zone (<−10 °C), as shown in Figure 13 [30]. From Figure 13, we can see that the unfrozen water content changed most significantly at 0–−5 °C and remained unchanged after less than −10 °C. As the temperature decreases, the unfrozen water reduced in the specimen freezes into ice, so the ice content grows as the temperature decreases. In addition, because the density of ice is 0.9 times that of water, the volume of water expands when it turns into ice. The volume expansion will make the soil particles squeezed to make the stress in the soil increase, which in turn makes the frictional resistance of the specimen increase. In addition, due to the reduction of unfrozen water content, the lubrication between soil particles is weakened and the internal frictional resistance is further enhanced. The effect of unfrozen water content on cohesion is mainly related to capillary cohesion and ice cementation. As the unfrozen water content decreases, the matrix suction in the soil increases, which makes the capillary cohesion in the soil increase. The increase in ice content makes the pores in the soil gradually fill with ice, which makes the ice cementation enhanced. Therefore, it can be found that the internal friction angle and cohesion of the specimen increase with the decrease in temperature. In addition, the strength of ice itself is higher than the strength of soil, so the higher the ice content, the higher the strength of frozen soil.
Although the influence of the freeze-thaw zone has been explored in recent years, a large number of studies have analyzed the effect of temperature on strength. However, researchers have considered mostly thawing temperature and ignored the effect of shaping temperature on strength. The temperature in the freeze-thawing zone of cold zone slopes is influenced by a combination of atmospheric temperature and ground temperature. In particular, the temperature of the freeze-thaw zone is more significantly influenced by the atmospheric temperature and ground temperature in areas where the natural ground is artificially disturbed, such as the road-cutting slope or cut-fill subgrade. In this paper, the thawing temperature simulates the atmospheric temperature and the shaping temperature represents the ground temperature. According to the test results, both shaping temperature and thawing temperature affect the strength of the freeze-thaw zone in Silty Clay. When considering the effect of temperature on the stability of slopes in cold areas, especially in excavated sections, the effect of ground temperature should be considered in addition to the effect of atmospheric temperature on strength.
5. Conclusions
Temperature and water content can have a dramatic effect on the shear characteristics of the freeze-thaw zone. To investigate the effect of shaping temperature on the shear properties of the freeze-thaw zone, a series of low-temperature direct shear tests were conducted under different conditions. The relation between each factor and strength was also discussed using grey relational analysis. The conclusions are as follows:
Under different test conditions, the stress-strain relationship of the freeze-thaw zone is strain softening. The strength of the freeze-thaw zone decreases with the increase in shaping temperature and thawing temperature. It should be noted that the shaping temperature will significantly affect the strength of the specimen when the thawing temperature is constant, and the lower the shaping temperature, the higher the strength of the specimen. Throughout the test, the effect of water content on the strength of the specimen was always present. The variation in the strength was closely related to the unfrozen water content. The increase of strength with water content at negative temperatures is mainly related to the increase of ice content in the soil.
When the thawing temperature is 1 °C, the shear index decrease with the increase of water content, and the opposite when the thawing temperature is negative. When the water content is certain, the shear index decreases with the increase of thawing temperature or shaping temperature. The internal friction angle is less affected by temperature and water content, and the shear strength is mainly affected by cohesion.
The relations between three factors and the shear index were analyzed by grey relational analysis. The grey relational degrees of thawing temperature, water content, and shaping temperature on the internal friction angle are 0.78, 0.81, and 0.51, respectively. The grey relational degrees of thawing temperature, water content, and shaping temperature on the cohesion are 0.80, 0.81, and 0.54, respectively. The grey relational grades of the factors are greater than 0.5, indicating that all three factors have a significant influence on the strength of the sample. The effect of shaping temperature on strength was previously neglected. Therefore, when considering the influence of temperature on the shear strength of frozen soil, the influence of shaping temperature on the strength of specimens should be considered in addition to the thawing temperature.
Author Contributions
Conceptualization, X.M.; Formal analysis, W.H.; Data curation, J.Z.; Writing—original draft, W.H.; Writing—review and editing, Q.W.; Visualization, W.H.; Supervision, X.M.; Funding acquisition, X.M. and Q.W. All authors have read and agreed to the published version of the manuscript.
Funding
The work presented in this paper was supported by the National Natural Science Foundation of China (Grant No. 51878064), the Key R & D and transformation plan of Qinghai Province (Grant No. 2021-SF-165), and the Natural Science Basic Research Program of Shaanxi (Grant No. 2021JQ-244).
Institutional Review Board Statement
Not applicable.
Informed Consent Statement
Not applicable.
Data Availability Statement
Not applicable.
Acknowledgments
The authors thank Linlin Chen for his assistance in completing the experiments.
Conflicts of Interest
The authors declare no conflict of interest.
References
- Xu, Z.; Wang, J.; Zhang, L. Physics of Permafrost; Beijing Science Press: Beijing, China, 2010; pp. 198–205. [Google Scholar]
- Xu, J.; Wang, S.; Wang, Z.; Jin, L.; Yuan, J. Heat Transfer and Water Migration in Loess Slopes During Freeze-thaw Cycling in Northern Shaanxi, China. Int. J. Civ. Eng. 2018, 16, 1591–1605. [Google Scholar] [CrossRef]
- Mouazen, A.M.; Ramon, H.; De Baerdemaeker, J. SW-Soil and water: Effects of bulk density and water content on selected mechanical properties of sandy loam soil. Biosyst. Eng. 2002, 83, 217–224. [Google Scholar] [CrossRef]
- Cheng, Y.; Ge, Q.; He, F. Experimental Research on Critical Depth of Slip Surface of Soil Slope in Seasonal Frozen Area. Rock Soil Mech. 2010, 31, 1042–1046. [Google Scholar] [CrossRef]
- Qu, Y.; Ni, W.; Niu, F.; Mu, Y.; Chen, G.; Luo, J. Mechanical and Electrical Properties of Coarse-grained Soil Affected By Cyclic Freeze-thawing in High Cold Regions. J. Cent. South Univ. 2020, 27, 853–866. [Google Scholar] [CrossRef]
- Xu, J.; Wang, Z.; Ren, J.; Wang, S.; Jin, L. Mechanism of Slope Failure in Loess Terrains During Spring Thawing. J. Mt. Sci. 2018, 15, 845–858. [Google Scholar] [CrossRef]
- Niu, F.; Cheng, G.; Ni, W.; Jin, D. Engineering-related Slope Failure in Permafrost Regions of the Qinghai-Tibet Plateau. Cold Reg. Sci. Technol. 2005, 42, 215–225. [Google Scholar] [CrossRef]
- Niu, F.; Luo, J.; Lin, Z.; Fang, J.; Liu, M. Thaw-induced slope failures and stability analyses. Landslides 2016, 13, 55–65. [Google Scholar] [CrossRef]
- Swanson, D.K. Permafrost thaw-related slope failures in Alaska’s Arctic National Parks, c. 1980–2019. Permafr. Periglac. Process. 2021, 32, 392–406. [Google Scholar] [CrossRef]
- van Zeyl, D.P.; Penner, L.A.; Halim, R.A. A slope failure caused by drainage cutoff through the advancement of seasonal frost, Hudson Bay Lowland. Landslides 2013, 10, 315–322. [Google Scholar] [CrossRef] [Green Version]
- Liao, M.; Lai, Y.; Liu, E.; Wan, X. A Fractional Order Creep Constitutive Model of Warm Frozen Silt. Acta Geotech. 2017, 12, 377–389. [Google Scholar] [CrossRef]
- Qin, Y.; Zhang, J.; Zheng, B.; Ma, X. Experimental study for the compressible behavior of warm and ice-rich frozen soil under the embankment of Qinghai–Tibet Railroad. Cold Reg. Sci. Technol. 2009, 57, 148–153. [Google Scholar] [CrossRef]
- Zhou, G.; Hu, K.; Zhao, X.; Wang, J.; Liang, H.; Lu, G. Laboratory investigation on tensile strength characteristics of warm frozen soils. Cold Reg. Sci. Technol. 2015, 113, 81–90. [Google Scholar] [CrossRef]
- Liu, X.; Liu, E.; Zhang, D.; Zhang, G.; Song, B. Study on strength criterion for frozen soil. Cold Reg. Sci. Technol. 2019, 161, 1–20. [Google Scholar] [CrossRef]
- Li, S.; Lai, Y.; Zhang, S.; Liu, D. An improved statistical damage constitutive model for warm frozen clay based on Mohr–Coulomb criterion. Cold Reg. Sci. Technol. 2009, 57, 154–159. [Google Scholar] [CrossRef]
- Peng, L.; Liu, J.; Tian, Y.; Qian, C. Unconfined compression tests on thawing soil. J. Geotech. Eng. 2008, 190, 1338–1342. [Google Scholar] [CrossRef]
- Ge, Q.; Wu, H.; Gong, Y. Research on the Soil Slope Stability Based on Soil Strength Deterioration in Seasonal Frozen Areas. Adv. Mater. Res. 2011, 243, 4270–4273. [Google Scholar] [CrossRef]
- Wang, E.; Xiao, Y.; Xu, C.; Tian, Y. Experimental study on shear strength of froze-thaw interface of silty clay under closed condition. J. Northeast Agric. Univ. 2020, 51, 61–70. [Google Scholar] [CrossRef]
- Wang, W.; Cao, G.; Li, Y.; Zhou, Y.; Lu, T.; Zheng, B.; Geng, W. Effects of Freeze-Thaw Cycles on Strength and Wave Velocity of Lime-Stabilized Basalt Fiber-Reinforced Loess. Polymers 2022, 14, 1465. [Google Scholar] [CrossRef]
- Gao, Q.; Wen, Z.; Wang, D.; Niu, F.; Xie, Y.; Gou, T. Study on the Instability Process of Slopes in Permafrost Regions By Direct Shear Test of Freezing-thawing Interface. Rock Soil Mech. 2018, 39, 2814–2822. [Google Scholar] [CrossRef]
- Yazdani, S.; Helwany, S.; Olgun, G. Influence of temperature on soil–pile interface shear strength. Geomech. Energy Environ. 2019, 18, 69–78. [Google Scholar] [CrossRef]
- Zhao, Y.; Mao, X.; Wu, Q.; Huang, W.; Wang, Y. Study on Shear Characteristics of Interface between Frozen Soil and Pile during Thawing Process in Permafrost Area. Adv. Civ. Eng. 2022, 2022, 1755538. [Google Scholar] [CrossRef]
- Noroozi, A.G.; Ajalloeian, R.; Bayat, M. Experimental study of the role of interface element in earth dams with asphalt concrete core-Case study: Mijran dam. Case Stud. Constr. Mater. 2022, 16, e01004. [Google Scholar] [CrossRef]
- Huang, W.; Mao, X.; Wu, Q.; Chen, L. Experimental study on shear characteristics of the silty clay soil-ice interface. Sci. Rep. 2022, 12, 19687. [Google Scholar] [CrossRef] [PubMed]
- Girish, B.M.; Siddesh, H.S.; Satish, B.M. Taguchi grey relational analysis for parametric optimization of severe plastic deformation process. SN Appl. Sci. 2019, 1, 937–948. [Google Scholar] [CrossRef] [Green Version]
- Acır, A.; Canlı, M.E.; Ata, İ.; Çakıroğlu, R. Parametric Optimization of Energy and Exergy Analyses of a Novel Solar Air Heater with Grey Relational Analysis. Appl. Therm. Eng. 2017, 122, 330–338. [Google Scholar] [CrossRef]
- Tosun, N. Determination of Optimum Parameters for Multi-performance Characteristics in Drilling By Using Grey Relational Analysis. Int. J. Adv. Manuf. Technol. 2006, 28, 450–455. [Google Scholar] [CrossRef]
- Zhu, Z.; Kang, G.; Ma, Y.; Xie, Q.; Zhang, D.; Ning, J. Temperature Damage and Constitutive Model of Frozen Soil Under Dynamic Loading. Mech. Mater. 2016, 102, 108–116. [Google Scholar] [CrossRef]
- Hu, G.; Zhao, L.; Zhu, X.; Wu, X.; Wu, T.; Li, R.; Xie, C.; Hao, J. Review of algorithms and parameterizations to determine unfrozen water content in frozen soil. Geoderma 2020, 368, 114277. [Google Scholar] [CrossRef]
- ЧЬЛTOBИЧ, H.A. The Mechanics of Frozen Ground; Zhang, C.-Q., Zhu, Y.-L., Eds.; Beijing Science Press: Beijing, China, 1985. [Google Scholar]
Figure 1.
Particle grading curve.

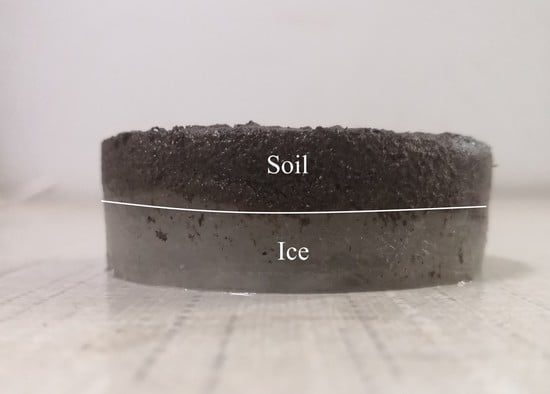
Figure 2.
Schematic diagram of the test sample.

Figure 3.
Test apparatus: (a) direct shear apparatus; (b) data acquisition system. (c) environmental box; (d) a sketch of the test equipment.
Figure 3.
Test apparatus: (a) direct shear apparatus; (b) data acquisition system. (c) environmental box; (d) a sketch of the test equipment.

Figure 4.
Stress-strain curves of samples under different conditions: (a) water content; (b) thawing temperature; (c) shaping temperature.
Figure 4.
Stress-strain curves of samples under different conditions: (a) water content; (b) thawing temperature; (c) shaping temperature.

Figure 5.
Shear strength of samples under different conditions: (a) water content; (b) thawing temperature; (c) shaping temperature.
Figure 5.
Shear strength of samples under different conditions: (a) water content; (b) thawing temperature; (c) shaping temperature.

Figure 6.
Mohr–Coulomb strength envelopes at a shaping temperature of −12 °C under different water content: (a) 9%; (b) 16%; (c) 23%.
Figure 6.
Mohr–Coulomb strength envelopes at a shaping temperature of −12 °C under different water content: (a) 9%; (b) 16%; (c) 23%.

Figure 7.
Mohr–Coulomb strength envelopes at a shaping temperature of −7 °C under different water content: (a) 9%; (b) 16%; (c) 23%.
Figure 7.
Mohr–Coulomb strength envelopes at a shaping temperature of −7 °C under different water content: (a) 9%; (b) 16%; (c) 23%.

Figure 8.
Mohr–Coulomb strength envelopes under different water content: (a) = −2 °C, = 1 °C; (b) = −7 °C, = 1 °C; (c) = −7 °C, = −2 °C.
Figure 8.
Mohr–Coulomb strength envelopes under different water content: (a) = −2 °C, = 1 °C; (b) = −7 °C, = 1 °C; (c) = −7 °C, = −2 °C.

Figure 9.
Effect of water content on the shear index: (a) Internal friction angle; (b) Cohesion.

Figure 10.
Effect of thawing temperature on the shear index: (a) Internal friction angle; (b) Cohesion.
Figure 10.
Effect of thawing temperature on the shear index: (a) Internal friction angle; (b) Cohesion.

Figure 11.
Effect of shaping temperature on the shear index: (a) Internal friction angle; (b) Cohesion.
Figure 11.
Effect of shaping temperature on the shear index: (a) Internal friction angle; (b) Cohesion.

Figure 12.
Flowchart of Grey relational analysis.

Figure 13.
Changes in unfrozen water content in silty clay.


Table 1.
Basic physical properties of the soil sample.
| Soil | Grain Density/ (g/cm³) | Liquid Limit/% | Plastic Limit/% | Dry Density/(g/cm³) | ||
|---|---|---|---|---|---|---|
| Water Content 9% | Water Content 16% | Water Content 23% | ||||
| Silty clay | 2.58 | 36.02 | 20.25 | 1.49 | 1.94 | 2.43 |
Table 2.
Time calibration table for temperature rising to a preset shear temperature at the freeze-thaw interface.
Table 2.
Time calibration table for temperature rising to a preset shear temperature at the freeze-thaw interface.
| Case | Shaping Temperature (°C) | Thawing Temperature (°C) | Water Content 9% (Thawing Time) | Water Content 16% (Thawing Time) | Water Content 23% (Thawing Time) |
|---|---|---|---|---|---|
| 1 | −12 | −5 | 4 min | 5 min 20 s | 7 min 40 s |
| 2 | −2 | 5 min 42 s | 8 min 45 s | 11 min 03 s | |
| 3 | −1 | 7 min 45 s | 10 min 50 s | 14 min 31 s | |
| 4 | −7 | −5 | 2 min 25 s | 2 min 58 s | 3 min 45 s |
| 5 | −2 | 4 min 45 s | 6 min 02 s | 8 min 09 s | |
| 6 | −1 | 6 min 58 s | 8 min 45 s | 10 min 02 s | |
| 7 | −2 | −1 | 1 min 05 s | 2 min 22 s | 2 min 40 s |
Table 3.
The experimental scheme.
| Case | Shaping Temperature (°C) | Initial Water Content (%) | Thawing Temperature (°C) | Normal Stress (kPa) |
|---|---|---|---|---|
| 1 | −2 | 9 | 1 | 100, 200, 300, 400 |
| 2 | −2 | 16 | 1 | |
| 3 | −2 | 23 | 1 | |
| 4 | −7 | 9 | −5 | 100, 200, 300, 400 |
| 5 | −7 | 9 | −2 | |
| 6 | −7 | 9 | 1 | |
| 7 | −7 | 16 | −5 | 100, 200, 300, 400 |
| 8 | −7 | 16 | −2 | |
| 9 | −7 | 16 | 1 | |
| 10 | −7 | 23 | −5 | 100, 200, 300, 400 |
| 11 | −7 | 23 | −2 | |
| 12 | −7 | 23 | 1 | |
| 13 | −12 | 9 | −5 | 100, 200, 300, 400 |
| 14 | −12 | 9 | 2 | |
| 15 | −12 | 9 | 1 | |
| 16 | −12 | 16 | −5 | 100, 200, 300, 400 |
| 17 | −12 | 16 | −2 | |
| 18 | −12 | 16 | 1 | |
| 19 | −12 | 23 | −5 | 100, 200, 300, 400 |
| 20 | −12 | 23 | −2 | |
| 21 | −12 | 23 | 1 |
Table 4.
The reference sequence () and the comparison sequences ().
| /kPa | /° | /°C | /% | /°C |
|---|---|---|---|---|
| 9.39 | 28.34 | −2 | 9 | 1 |
| 7.58 | 28.11 | −2 | 16 | 1 |
| 6.64 | 27.51 | −2 | 23 | 1 |
| 23.11 | 29.93 | −7 | 9 | −5 |
| 9.32 | 29.34 | −7 | 9 | −2 |
| 13.07 | 29.01 | −7 | 9 | 1 |
| 29.49 | 30.58 | −7 | 16 | −5 |
| 13.95 | 29.10 | −7 | 16 | −2 |
| 10.35 | 28.09 | −7 | 16 | 1 |
| 38.63 | 31.23 | −7 | 23 | −5 |
| 13.65 | 30.15 | −7 | 23 | −2 |
| 8.60 | 27.84 | −7 | 23 | 1 |
| 40.44 | 30.94 | −12 | 9 | −5 |
| 25.72 | 29.70 | −12 | 9 | −2 |
| 22.97 | 29.13 | −12 | 9 | 1 |
| 39.39 | 31.87 | −12 | 16 | −5 |
| 29.43 | 29.78 | −12 | 16 | −2 |
| 18.43 | 28.12 | −12 | 16 | 1 |
| 35.44 | 34.23 | −12 | 23 | −5 |
| 29.46 | 29.70 | −12 | 23 | −2 |
| 17.49 | 27.79 | −12 | 23 | 1 |
Table 5.
Data after normalization.
| 0.237276 | 0.5625 | −0.63638 | 0.96 |
| 0.237276 | 1 | −0.63638 | 0.95 |
| 0.237276 | 1.4375 | −0.63638 | 0.93 |
| 0.830466 | 0.5625 | 3.181876 | 1.01 |
| 0.830466 | 0.5625 | 1.27275 | 0.99 |
| 0.830466 | 0.5625 | −0.63638 | 0.98 |
| 0.830466 | 1 | 3.181876 | 1.03 |
| 0.830466 | 1 | 1.27275 | 0.98 |
| 0.830466 | 1 | −0.63638 | 0.95 |
| 0.830466 | 1.4375 | 3.181876 | 1.06 |
| 0.830466 | 1.4375 | 1.27275 | 1.02 |
| 0.830466 | 1.4375 | −0.63638 | 0.94 |
| 1.423656 | 0.5625 | 3.181876 | 1.05 |
| 1.423656 | 0.5625 | 1.27275 | 1.01 |
| 1.423656 | 0.5625 | −0.63638 | 0.99 |
| 1.423656 | 1 | 3.181876 | 1.08 |
| 1.423656 | 1 | 1.27275 | 1.01 |
| 1.423656 | 1 | −0.63638 | 0.95 |
| 1.423656 | 1.4375 | 3.181876 | 1.16 |
| 1.423656 | 1.4375 | 1.27275 | 1.01 |
| 1.423656 | 1.4375 | −0.63638 | 0.94 |
Table 6.
Grey relational coefficients.
| 0.390071 | 0.696203 | 0.390071 |
| 0.604727667 | 0.737515 | 0.407592 |
| 0.607344957 | 0.964033 | 0.408779 |
| 0.614303688 | 0.686588 | 0.41192 |
| 0.862176642 | 0.711658 | 0.335756 |
| 0.875982793 | 0.721038 | 0.800709 |
| 0.883899437 | 0.726393 | 0.404172 |
| 0.847461703 | 0.975808 | 0.338042 |
| 0.881726196 | 0.993408 | 0.79597 |
| 0.906745149 | 0.963457 | 0.408883 |
| 0.833240621 | 0.745625 | 0.340359 |
| 0.857139327 | 0.727474 | 0.817129 |
| 0.913158726 | 0.691472 | 0.410182 |
| 0.747680722 | 0.696155 | 0.339321 |
| 0.726802989 | 0.715286 | 0.807925 |
| 0.717592174 | 0.724437 | 0.403566 |
| 0.764143488 | 0.939178 | 0.342672 |
| 0.728114691 | 0.999995 | 0.809546 |
| 0.701832001 | 0.964321 | 0.408727 |
| 0.809366658 | 0.801149 | 0.351479 |
| 0.726802989 | 0.72017 | 0.807925 |
| 0.696831612 | 0.690732 | 0.410443 |
Table 7.
Grey relational grades of factors on internal friction angle and cohesion.
| /°C | /% | /°C | |
|---|---|---|---|
| Internal friction angle | 0.5029 | 0.8045 | 0.7765 |
| Cohesion | 0.5442 | 0.8088 | 0.7986 |
Disclaimer/Publisher’s Note: The statements, opinions and data contained in all publications are solely those of the individual author(s) and contributor(s) and not of MDPI and/or the editor(s). MDPI and/or the editor(s) disclaim responsibility for any injury to people or property resulting from any ideas, methods, instructions or products referred to in the content. |
© 2022 by the authors. Licensee MDPI, Basel, Switzerland. This article is an open access article distributed under the terms and conditions of the Creative Commons Attribution (CC BY) license (https://creativecommons.org/licenses/by/4.0/).
Share and Cite
MDPI and ACS Style
Huang, W.; Mao, X.; Wu, Q.; Zhang, J. Experimental Investigation on the Shear Characteristics of Frozen Silty Clay and Grey Relational Analysis. Sustainability 2023, 15, 180. https://0-doi-org.brum.beds.ac.uk/10.3390/su15010180
AMA Style
Huang W, Mao X, Wu Q, Zhang J. Experimental Investigation on the Shear Characteristics of Frozen Silty Clay and Grey Relational Analysis. Sustainability. 2023; 15(1):180. https://0-doi-org.brum.beds.ac.uk/10.3390/su15010180
Chicago/Turabian StyleHuang, Wanjun, Xuesong Mao, Qian Wu, and Jianxun Zhang. 2023. "Experimental Investigation on the Shear Characteristics of Frozen Silty Clay and Grey Relational Analysis" Sustainability 15, no. 1: 180. https://0-doi-org.brum.beds.ac.uk/10.3390/su15010180
Note that from the first issue of 2016, this journal uses article numbers instead of page numbers. See further details here.