
Analysis and Estimation of Short Term Residual Household Waste Production: Case Study Reunion Island
PIMENT Laboratory, University of la Reunion, 117 rue du General Ailleret, 97430 Le Tampon, Reunion, France
*
Author to whom correspondence should be addressed.
Sustainability 2023, 15(1), 348; https://0-doi-org.brum.beds.ac.uk/10.3390/su15010348
Submission received: 31 October 2022
/
Revised: 13 December 2022
/
Accepted: 20 December 2022
/
Published: 26 December 2022
(This article belongs to the Collection Municipal Solid Waste Management and Environmental Sustainability)
Abstract
:The objective of this approach is to evaluate the formation of waste production at the communal level in a small island state. The question of waste management is an important issue for all local authorities, but it is even more so in an island context. The small island areas are all the more confronted with this problem insofar as they must combine their own specific characteristics, which can be very restrictive: isolation and remoteness, centralized economy, non-competitive domestic market, geographical and climatic conditions, growing demography, social structure and economic and energy dependence. The list is certainly not exhaustive, but it is sufficient to establish a framework for reflection, where these different specificities interact strongly with the development of these territories. Although they reveal above all remarkable and fragile ecosystems, a bad waste management policy can cause irremediable damage environmentally, economically, and socially. It is therefore important to understand the implications of waste management on the island. This approach introduces an analysis, in order to express the communal specificities of the production of residual household waste, in order to bring contextualized elements of answers to the waste management strategy of Reunion Island. Indeed, dysfunctions have been noted in the collection and transfer process and more particularly, in waste disposal.
1. Introduction
Waste management is an important issue for all local governments, but it is even more so in small island developing states (SIDS) [1,2]. Small island territories are all the more confronted with this issue as they have to deal with their own specific municipalities, which can be very constraining. Indeed, the notion of scale, the demographic impact, the economic climate, lead to important problems in the territorial planning of waste management [3]. At the bottom of this problem, the vision of sustainable development is far from being a priority. Decision making is not based on sustainability, but on a short-term view, where financial obligations and other political prescriptions take precedence [4,5]. In such proportions, each territory must ensure an efficient waste management policy. Although important obstacles remain to be overcome, there have been notable victories in achieving a high threshold of efficiency [6,7,8]. The implementation of proximity in terms of waste management, makes it possible to structure economic viability on a local scale via the recovery and disposal channels. However, the provisions of this principle do not at any time mention the characteristics of its application, as the regulations in this area are not very precise [9,10]. The integration of proximity through waste management, made effective with territorial planning strategies and reaffirmed through new approaches, will be reinforced by the amplification of energy issues, precisely in the context of a territorialized understanding of energy production.
It would thus be a matter of thinking jointly about energy production and waste treatment within the framework of “local public service plans, an opportunity for joint reflection on waste management, land use planning and energy production” [11,12]. The production and composition of household waste are essential information in waste management strategies. In addition, the regulations recall the obligations of municipalities in the framework of the public service for the treatment and elimination of household waste. In order to capitalize on the data on the production and composition of household waste, municipalities and their groupings are responsible for drawing up an annual report on the cost and quality of the waste disposal service. Analyses and other representation models then allow for a more comprehensive assessment of habits, changes, and trends in waste generation in a territory. Explicitly, the issue of data supports waste management policies, notably to mobilize environmentally sound, economically viable, and socially rational strategies. Indeed, the characterization and modeling of waste generation will try to bring elements of contextualized response to waste management [13,14,15,16]. The construction of waste production is a complex process involving different variables [17,18,19]. These so-called explanatory variables make it possible to assess the relational impacts in the general conditions of the formation of the variables to be explained. Several compositional factors play a role in waste generation, such as income, demographics, household size, attitudes and behaviors, and gross domestic product [18,20,21,22,23,24,25,26]. These perspectives provide elements for the constitution of the waste formation and support the decision making in the framework of a waste management strategy. However, waste generation forecasting also appears to be important in the planning and operation of the household waste management system [27,28]. Many models are developed to predict waste generation. Regression models are widely used statistical methods to identify relationships and factors influencing waste generation [22,24,29]. In addition, the number and types of independent variables evaluated vary considerably, with many of these models considering demographic variables or socio-economic factors, among others [23,30,31,32]. Methods that allow for a single independent variable to meet the strict requirements, such as the independence of observations, homogeneity of constant variance, or normality assumption. Moreover, the validation of these models is based on real data, in this case waste production. Similar to new consumption habits, waste production is a direct consequence of human activities. Applications encourage the arrangement of observations with similar characteristics in order to design more efficient models, indeed, although noticed, the scale relations on waste production remain to be explored. In Europe, a study proposes to evaluate household waste flows in large European cities. A hierarchical analysis was performed to classify each city into a homogeneous group with a similar social and economic level [30]. In Sri Lanka, a study relates waste generation to several socio-economic factors through a cluster analysis. Group organization is distinguished by disposable income [20]. In Dublin, a study projects waste predictions into a geographic information system, which addresses the spatial criterion in the formation of waste generation [33]. In China, a study addresses this clustering principle to estimate the amount of waste in cities of different sizes, to promote the optimization of waste collection and treatment facilities [34].
In this proposal, the specificities of residual household waste generation, by population, are expressed through a regression model. Subsequently, other explanatory factors are proposed within a principal component analysis. The comparison of these two approaches allows not only to highlight the importance of the population factor in the determination of waste production, but also to draw conclusions on the differentiated waste production models. Thus, the approach is conditioned in a cluster classification of the communes of Reunion Island, indeed, within the framework of an adapted and localized strategy, such an initiative would bring additional information.
The analysis and structural modelling of residual household waste production is carried out using economic and demographic data from INSEE censuses and residual household waste production data from the documents of the public household waste collection services of the island’s municipalities. The approach mobilizes the communal demography in the formation and the prospective of the production of residual household waste, whose results can be relevant to the political decisions in the future programs of the management of waste. Due to the lack of deposits and the economic structure of the territory, many instructions may vary locally, leading to an imbalance in treatment, resulting in the massive burial of products. Because of the numerous stakes involved, the following proposal is conditioned on the communal scale. Reunion Island has 24 communes, most of them located on the coast and some of them perched on the sides of the island. With its 240 km2, the commune of Saint-Paul occupies nearly 10% of the territory, it is the largest commune of Reunion Island. As for the commune of Le Port, it is the smallest commune in the department with its 16 km2. At the crossroads of these issues, Reunion Island is faced with real decision-making tensions, a guarantee of sustainable development, its ambition is to become a territory of excellence with a “zero waste” approach by 2030.
2. Materials and Methods
2.1. Case Study
Reunion Island is an outermost territory of Europe and a French overseas department and region. The island is characterized by specific structural, territorial, and economic characteristics, as shown in Figure 1. Indeed, the territory has undergone profound changes and this situation is reinforced by a demography in full transition. The main urban centers and other economic activities have successively agglomerated on the coastal fringe, where today they maintain close relations of dependence [35,36]. Today, three-quarters of the population of Reunion Island live on the coast and the lower slopes, which corresponds to just over 630,000 people living at an altitude below 400 m. This characteristic is highlighted when we know that the island is covered up to 40% by the National Park. Waste management is particularly sensitive in Reunion, given the delay in this field and the importance of the deposits.
The insular context exacerbates the situation because the useful space for the evolution of human activities is very limited, the economic conditions make it problematic to set up circuits of recovery, valorization, and elimination of waste. Moreover, due to the nature of the subsoil in Reunion, waste can be a major source of pollution. As early as 1995, the Regional Economic and Social Council (RESC) drew up an alarming report on waste management in Reunion. Waste management has become a priority, in order to create a healthy environment for the population, to ensure the preservation of the natural heritage, all in proportions that guarantee the economic development of the island [37]. In spite of the construction objectives, in terms of infrastructures, aiming to ensure the viability of economically viable waste management channels and the ambition inspired by the new public policies, the General Council for the Environment and Sustainable Development (GCESD) once again denounces the delay in the development of Reunion Island. To date, the island is out of step with the national territory, in terms of waste management. Given the situation and the imminent end of the operation of the only two waste disposal centers in Reunion, the Sainte-Etienne and Sainte-Suzanne storage centers (2021 and 2022), it is essential to turn to a responsible waste management strategy [38]. Between isolation and remoteness, even if these specific municipalities have a strong impact on the development of the territory, they are above all undeniable assets [39]. At the crossroads of these issues, Reunion Island is faced with real decision-making tensions, a guarantee of sustainable development, and as such, it aims to become a territory of excellence with a “zero waste” approach by 2030. To date, this ambition is characterized by the ILEVA (mixed syndicate for the treatment of waste in the southern and western micro-regions of Reunion Island) household waste recovery center, which will provide an industrial tool for waste recovery in three different sectors: the sorting of recyclable waste, the methanization of the fermentable fraction of residual household waste and biowaste, and the energy recovery from solid recovered fuel (SRF) from non-recyclable waste. In the long term, more than 200,000 metric tons of waste will be recovered each year. This project is part of a territorial dynamic in favor of the circular economy and green growth [40,41].
2.2. Production of Municipal Solid Waste in Reunion
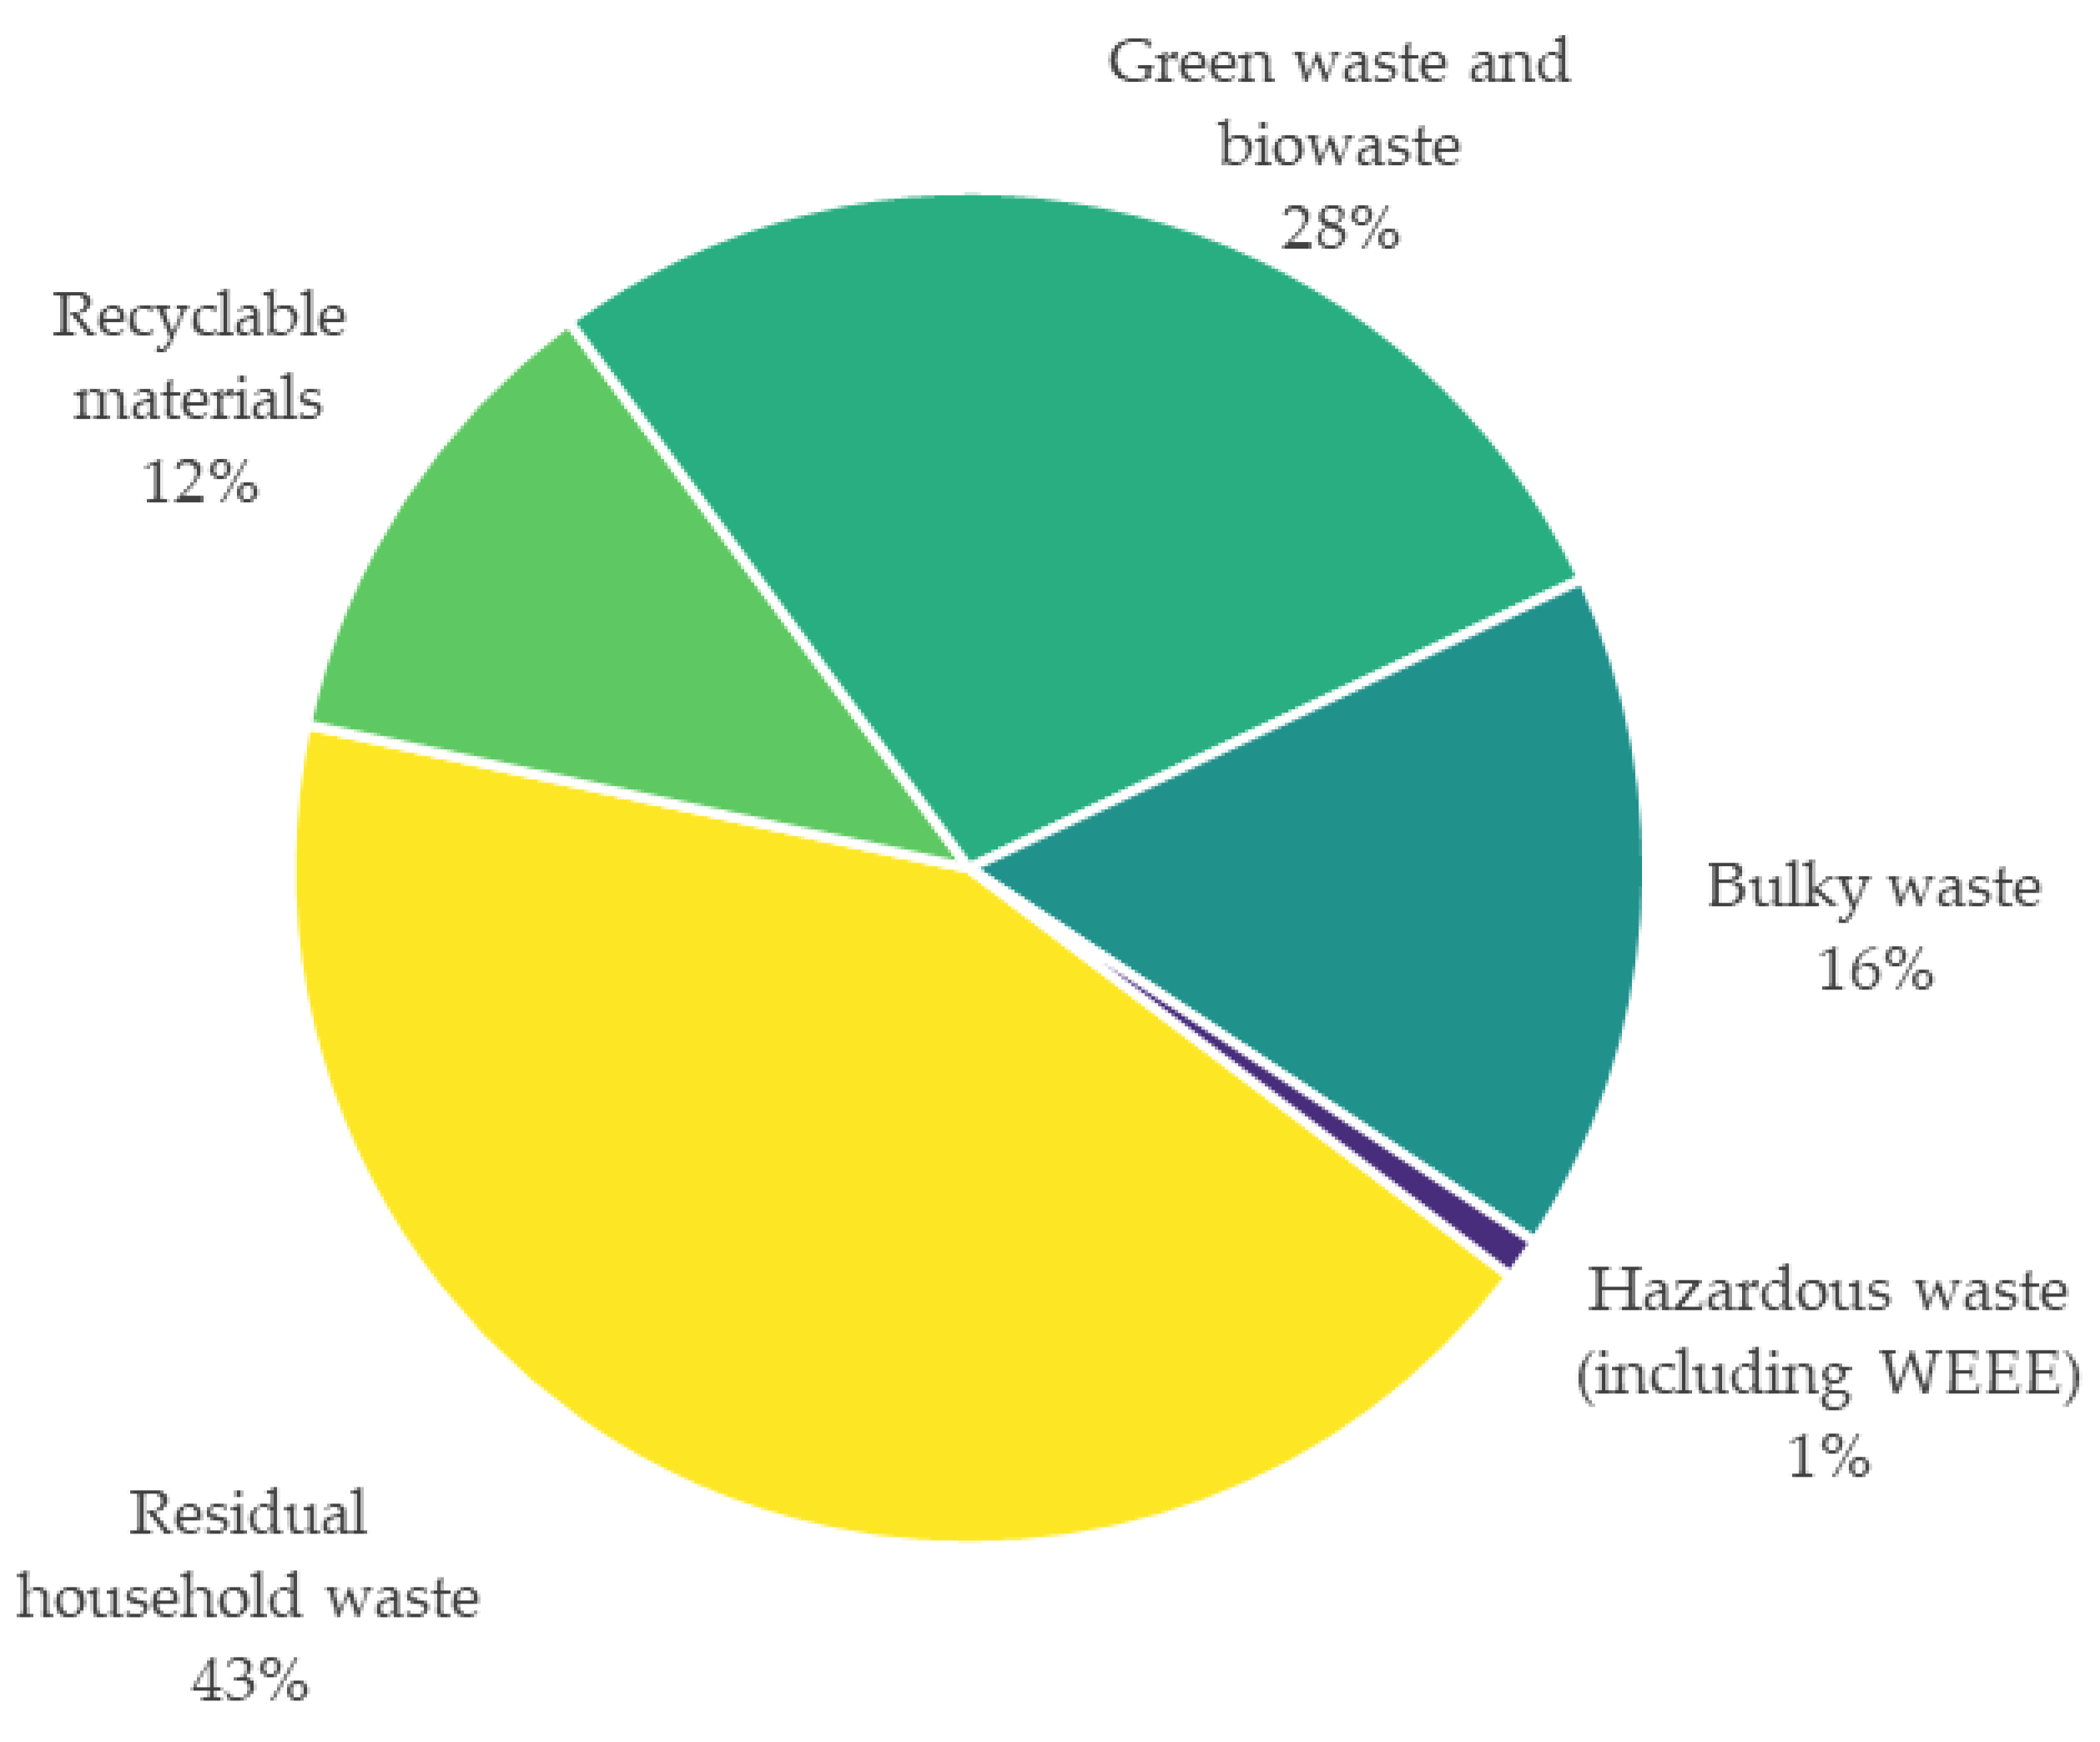
Figure 2 illustrates the fact that Reunion Island stands out on certain fractions of waste collected in the territory.
The data presented are from the SINOE® waste reference system distributed by ADEME. The proposed data are harmonized, in order to compare the observation data (flows and management costs) at all territorial levels. In 2019 [42], the total amount of the household and similar waste in Reunion Island was estimated at 208,197 tons of waste. The collection performance of household and similar waste, excluding the excavated material and rubble, per capita, in 2019 was 567 kg of waste in Reunion, a difference of 40 kg above the national average. The share of green waste and bio-waste is amply greater than the national average, while the share of recyclable materials is largely lower than the national average. Respectively, the proportions of biomass are estimated at 28 against 14% at the national level, that is to say a collection performance, per capita, evaluated at 157 kg at the local level against 79 kg recorded in France. Conversely, the proportions of recyclable materials are estimated at 12 against 20%, that is to say a collection performance per capita close to 64 kg, compared to 117 kg recorded at the national level.
Figure 3 identifies the household and similar waste streams resulting from separate collection operations, door-to-door, or at waste collection centres. Residual household waste is the most important fraction of household waste. The average proportion of residual household waste is estimated at around 23,000 tons, over the period 2005 to 2019, with an overall decrease of around 15% over this production period. The residual household waste collection performance, per capita, for 2019 was 241 kg at the local level, compared to 247 kg at the national level.
The green waste and biowaste fraction stands out in second place, it is initiated to the tune of 135,445 tons of waste on average in the territory, with a growth trend over the period 2005 to 2019, that is to say an average periodic increase of 12%. The variability of green waste and bio-waste production implies a complex management, especially in the mobilization of collection equipment and other treatment facilities. However, this result is far from matching the 85% achieved at the national level. The rate of electrical waste and electronic equipment returned to waste collection centers on the island is very close to the national rate, i.e., 65% in the local territory, compared to 75% in the national territory. Nevertheless, taking into account the relative difference in the two terms of comparison, the collection performance, per inhabitant, is approximately at the same level for 2015, i.e., between 4 and 5 kg of electrical waste and electronic equipment. Although the collection and treatment performance for hazardous waste (including WEEE) appear to be less effective than the national average, it is showing a clear improvement. The differential of household and similar wastes, is based on the particularities of the territory, especially on the problems related to the collection or on the economic balance related to the treatment of wastes, and even on the climatic modulation on some wastes. Thus, the nature and the importance of the green waste and biowaste deposit is highlighted within the climatic variables from which Reunion benefits. The tropical climate leads to a high production of biomass, and the frequency of cyclones and other tropical storms leads to a punctual and abundant production of green waste. The variation, in terms of recyclable materials, is based on the characteristics of the island.
2.3. Treatment of the Municipal Solid Waste in Reunion
The selective collection systems for the household and similar waste are in place on the island: electrical waste and electronic equipment, batteries, accumulators, lamps, textiles, end-of-life vehicles, glass, packaging, and other paper. However, most of the collected products are exported due to the lack of deposits and landfill is the dominant treatment in the management of the household and similar waste in Reunion. Residual household waste is exclusively sent to storage centers, unlike in mainland France, where it accounts for 16%, or 208,196 tons, or 83% of the waste buried in 2019. More than half of the bulky waste occupies the rest of the storage centers, with nearly 33,701 tons of waste buried over the same period, or 13% of the buried waste. The situation is annexed to the problem of the implementation of a relevant sector, in terms of waste management, in spite of the new modalities of waste treatment and valorization. Several possibilities exist, such as incineration with energy recovery, material recovery and organic recovery. The overseas island departments are territories exposed to many constraints and have a deficit, in terms of waste treatment and recovery [9]. Furthermore, the overseas departments present recycling performances below the national average, with an average of 46 kg per capita against 117 kg. In Martinique, an island territory in the Atlantic Ocean, the production of household waste per capita is estimated at 352 kg or 128,372 tons for the year 2019. On site, the management of this fraction is articulated around an energy recovery unit with energy recovery. The recovery unit has a treatment capacity of 124,000 tons per year. In addition, Martinique has the only biowaste methanization plant in the French overseas departments, with a treatment capacity of 34,000 tons of waste. Internationally, Singapore, an island city-state in Southeast Asia, has four waste-to-energy units. Following treatment, the incineration residues are taken to the Semakau landfill for burial. In 2015, the per capita production of household waste amounted to 305 kg. The treatment and energy recovery capacities contributed to reduce the volume of solid waste by about 90%. The city-state aims to reduce the production of household waste, by 30%, by 2030. Despite the renewed ambitions within the non-hazardous waste management prevention plans, the implementation of structures for sorting and treatment is difficult, especially in Reunion [38,43]. In addition, the island is behind in the number of waste management facilities.
2.4. Data Collection
The data on residual household waste production are taken from the Public Waste Disposal Service documents [44,45,46,47,48]. In accordance with the regulations in force, namely:
- The decree No. 2000-404 of 11 May 2010, taken in application of the law No. 95-101 of 2 February 1995, known as the Barnier Law, relating to the reinforcement of the protection of the environment and having for objectives to emphasize the transparency and the information of the users;
- Decree No. 2015-1827 of 30 December 2015, on various adaptation and simplification provisions in the field of waste prevention and management.
The annual report on the public waste disposal service represents an essential information tool on the household waste management. Its objective is to present, on the one hand, the prevention, collection, treatment, and recovery of household waste and, on the other hand, the technical and financial indicators related to the public service of prevention and management of the household and similar waste. In spite of the obligation to publish the document concerning the waste management and disposal service annually, the updating of the data restricts the study to the period 2015 to 2019. The layout of the economic and demographic variables comes from information disseminated by the National Institute for Statistics and Economic Studies (INSEE). The layout of different variables, such as living conditions, employment, and mobility reflect the relevance of the municipal scale. The temporality of the databases is phased on the reference year 2015, the date at which the data of household waste production, as well as the various variables, are complete for the object of study [49,50,51,52,53]. Subsequently, the forecast of the residual household waste is made according to the INSEE reference population forecasts for the year 2030 [54].
2.5. Data Analysis
An analysis of the structural modelling of the residual household waste production is carried out using demographic data from the INSEE censuses and waste production data from the records of the public household waste collection services of the island’s intermunicipalities. The analysis of the 2019 data aims to observe the current spatial distribution of household waste in the territory, and in particular, to assess the communal distribution of the communal population of Reunion.
2.6. Linear Regression Model
A linear regression model is tested to establish a relationship between an explained variable and an explanatory variable, i.e., the explanation of the residual household waste production of municipalities, according to the demography. The model is based on the Napierian logarithm function to make the data more normally distributed, in order to allow the modeling of the data, according to a curve pattern. The fitting of the model consists in determining a trend line that best approximates the scatterplot in the plane, noted mathematically, according to Equation (1):
where, y is the production of residual household waste, x is the size of the population, a is the slope of the line, i.e., the share of the residual household waste for the addition of an additional individual and b is the intercept, i.e., the irreversible and autonomous share for each of the individuals considered. The purpose of applying the regression model is to determine the effect of the population size, as well as the waste effect on the residual garbage production [27,55,56,57]. The application of the prediction of this waste fraction is performed by a linear regression model over the executive period 2015–2019 [22,24].
2.7. Principal Component Analysis
A principal component analysis (PCA) is proposed to extract and synthesize the most important information. This statistical method allows to describe a set of data in only a few variables called principal components. These principal components correspond to a linear combination of the variables under study. The information contained in the dataset is characterized, according to the inertia it contains, the objective being to identify the directions in which the total inertia is best preserved. In short, the PCA reduces the dimensions of a dataset while guaranteeing the quality of the information. In order to make the variables comparable, it is necessary to normalize them. The approach consists of transforming the data so that each variable has a standard deviation equal to one and a mean equal to zero. The standardization of the data is presented as Equation (2):
where is the mean of the values of x and is the standard deviation of x. At the end, the obtained data is the centered-reduced data. Therefore, the purpose of the principal component analysis is to represent the existing relationships between the variables and the similarities between the individuals. The application of the PCA is intended to determine the relationships between certain variables and the production of residual household waste, in fact the latter were considered to reflect the satisfaction of people’s needs and the propensity to consume [21,33,57,58]. The variables used in this framework are presented in Table 1. A hierarchical classification HCPC (hierarchical classification on principal components) is applied for the exploration of the multi-varied data. The objective is to identify groups of similar entities in the dataset. In addition to the elbow method, the optimization of the number of clusters is obtained, according to the hierarchy applied within the dendrogram. The proposed statistical analyses are performed with the R software, using the FactoMineR package [59].
3. Results
3.1. Data Analysis
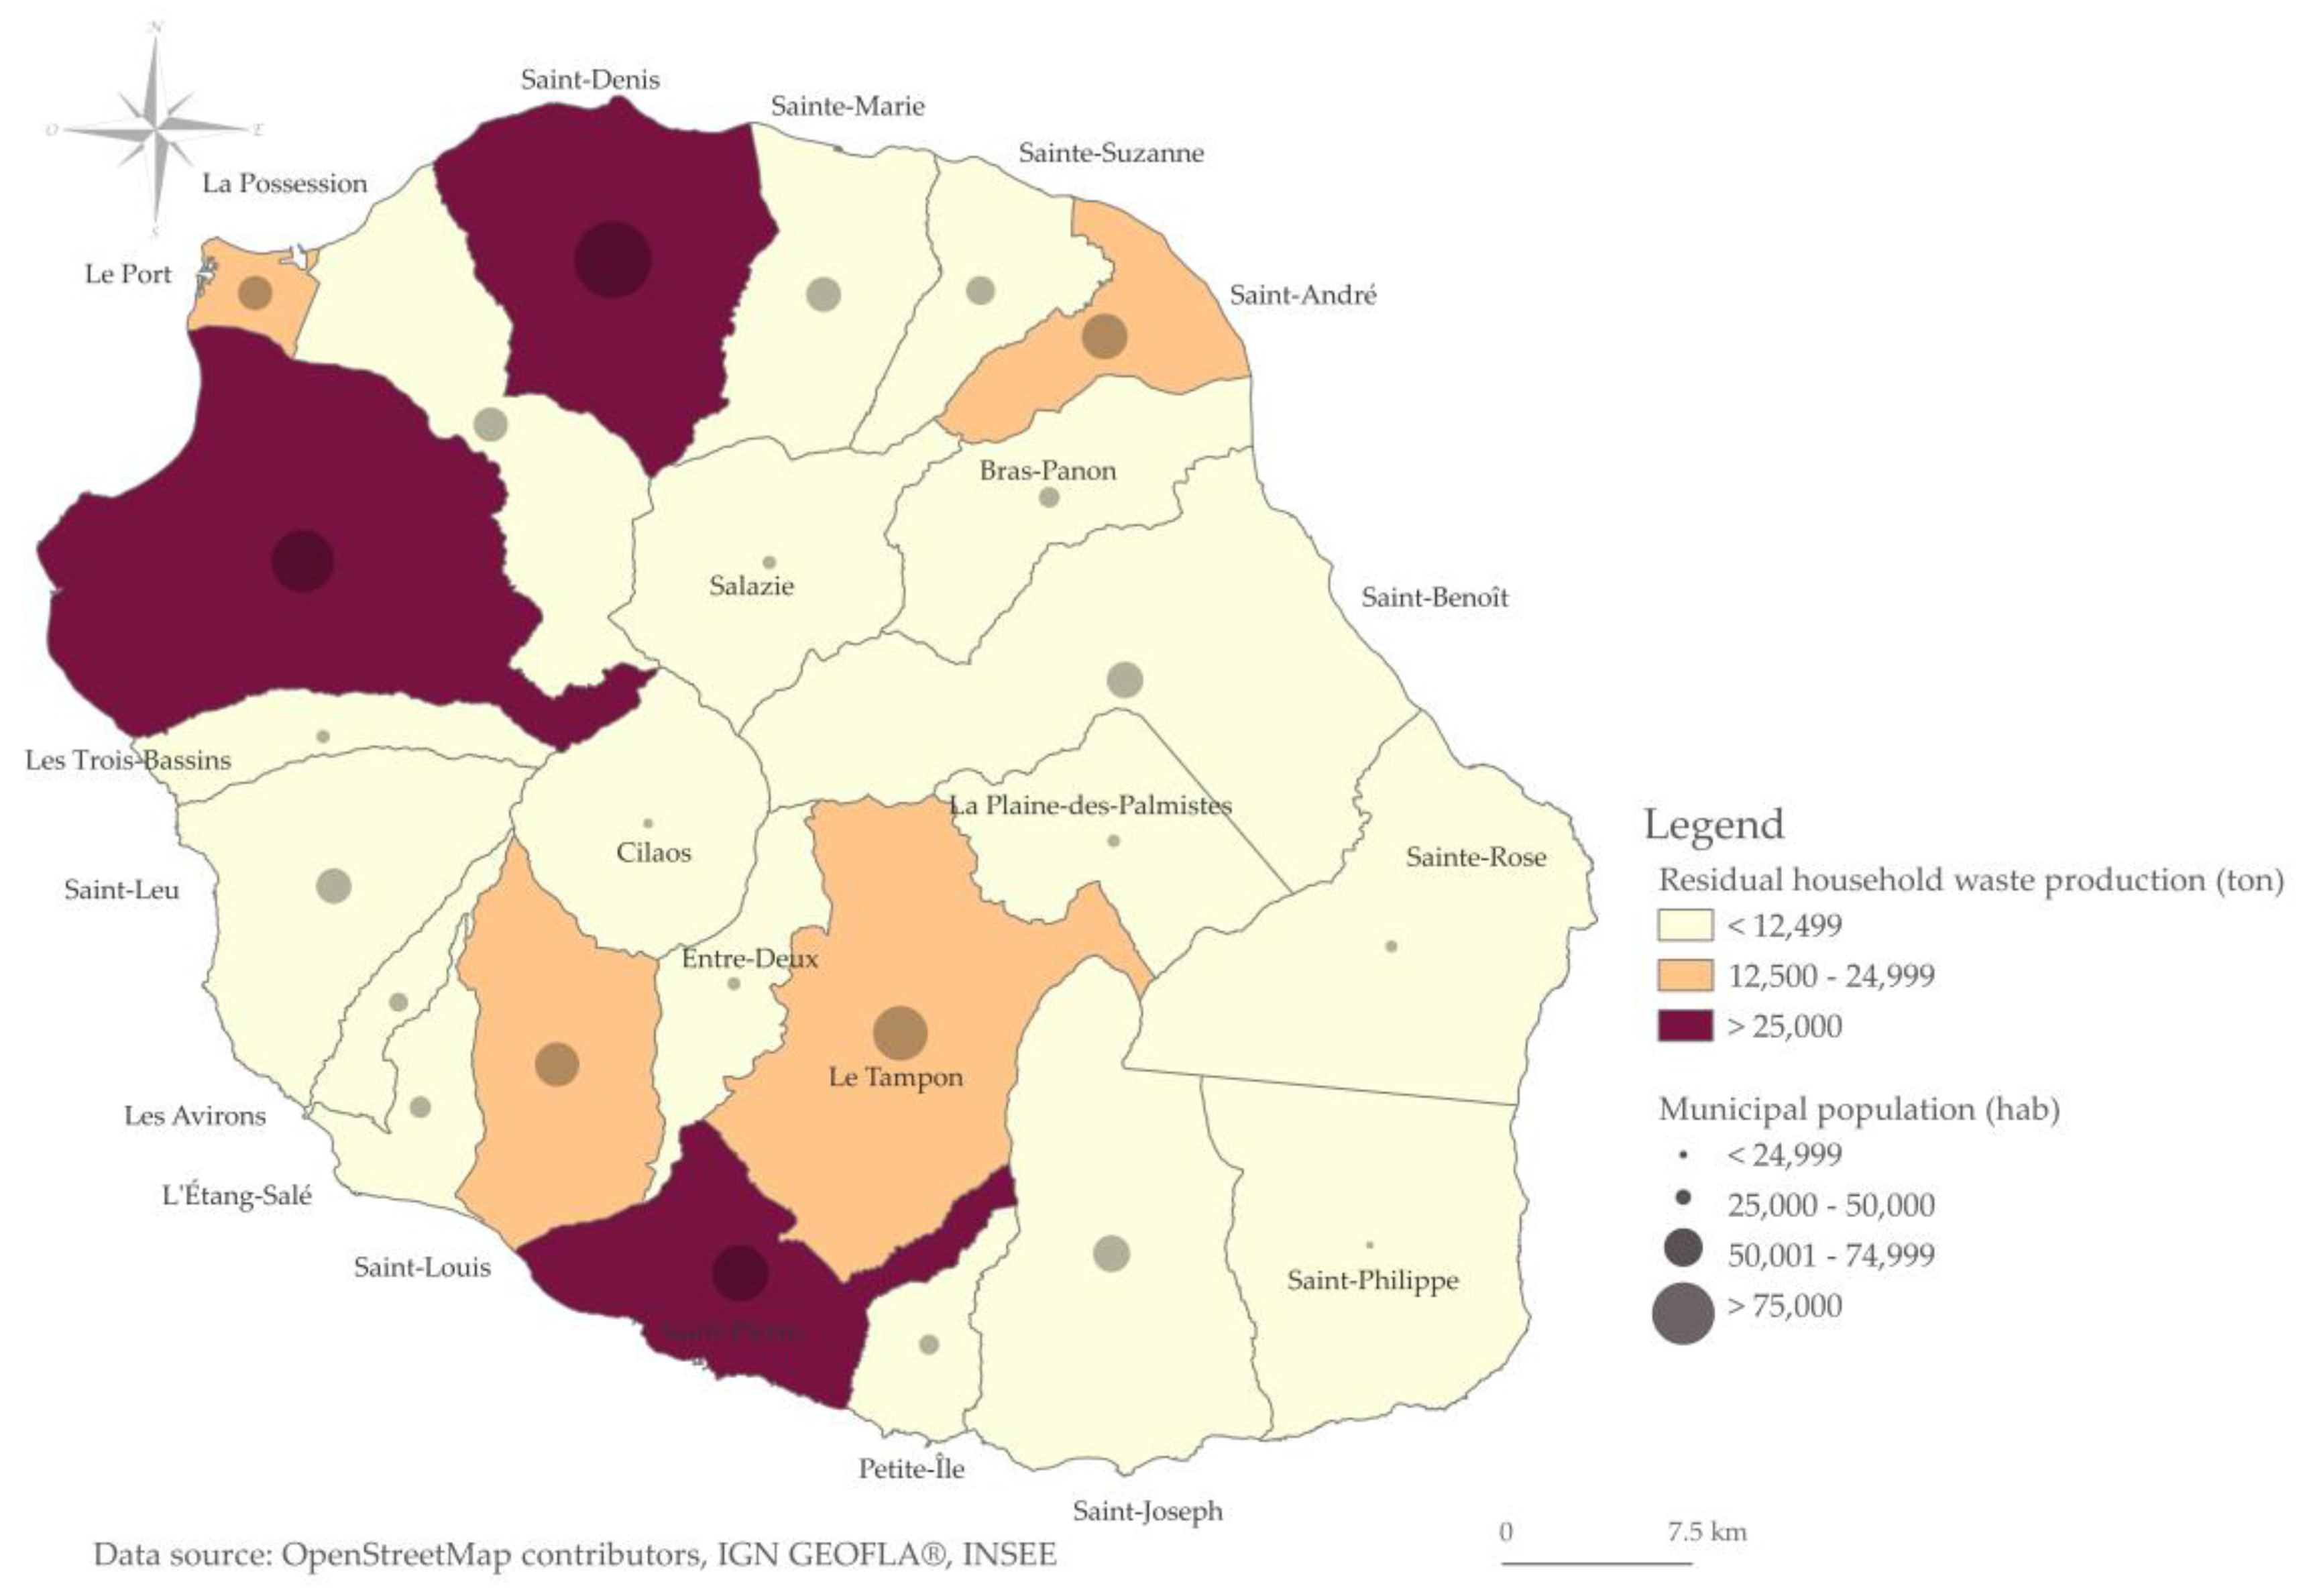
The map on Figure 4 shows the production of household waste, according to the demography at the municipal level. Saint-Denis, the capital city, has the communes of Saint-André and Sainte-Marie gravitating towards it, the latter alone accounting for 30% of the total population of Reunion. This demographic situation means that this first aggregate generated the equivalent of 68,544 tons of garbage over the same period, an average of 280 kg of garbage per capita. Incidentally, Saint-Denis is the capital of the departmental region of Reunion, whose population amounted to more than 153,000 inhabitants in the 2019 census. This demographic situation makes the commune of Saint-Denis, the most populated commune of the island. Moreover, the commune of Saint-Denis is the most important commune, in terms of production of residual household waste, with 43,265 tons generated over the reference period.
Saint-Pierre, said to be the capital of southern Reunion, amalgamates the communes of Le Tampon and Saint-Louis. This second aggregate generated more than 25% of the total production of residual household waste of Reunion in 2019, that is to say more than 58,000 tons of waste. All in all, Saint-Pierre had more than 84,000 inhabitants in 2015, making it the third most populated commune in Reunion, after Saint-Denis and Saint-Paul. The commune of Saint-Pierre remains however the second most important commune, in terms of production of residual household waste, with 24,160 tons of waste in 2019, that is to say a production of 284 kg of garbage per inhabitant. Saint-Paul forms a unique space, the largest municipality, it also has more than 100,000 inhabitants, or about 10% of the population of Reunion. This demographic context brings about 25,000 tons of residual household waste generated in 2019, that is to say a production of 229 kg of waste per inhabitant. For the rest, the illustration draws a landscape divided into three parts with a contiguous set marked on the interior of the island and the eastern coastal strip, with an average production of 251 kg per inhabitant.
The production of residual household waste is capitalized in the territory, that is to say the equivalent of 154,663 tons of waste for the equivalent of a production of 275 kg per inhabitant. The observation of the production of household waste in the territory shows a difference between the communes, indeed, the administrative entities presenting a high communal demography are those which produce more waste. In addition, the municipalities with a waste production of more than 25,000 tons have a per capita production of about 265 kg. The second class, with a waste generation between 12,500 and 25,000 tons of residual household waste, shows a per capita waste generation of about 278 kg. For the third class, the municipalities with a waste generation of more than 12,500 tons have a per capita waste generation of about 247 kg.
3.2. Linear Regression Model (R1)
The following Figure 5 gives a description of the household waste production as a function of demography, the label references and prediction data for the R1 model are given in Table 2.
The scatter plot approach allows for the comparison of two sets of values to show the relationship between them. The linear expression in the figure shows a positive influence of the population on the development of the variable under consideration. The coefficient of determination R2 measures the goodness of fit of the regression to describe the distribution of the points. The mathematical property then provides an R2 coefficient equal to 0.98, which attests that the population allows for a more or less accurate estimation of the production of residual household waste. Production, in terms of residual household waste is underestimated. Indeed, the difference between the observed values and the estimated values, amounts to 984 tons of residual household waste. The overestimation is close to an average error of less than 1% on the production of residual household waste in Reunion, in 2015. In perspective, the map in Figure 6 shows three clusters of municipalities that share certain characteristics.
A group called, “weak”, composed of seven communes, is distinguished by a low demographic level where waste production is low. This first group is diversified in that it includes the communes of Cilaos, Entre-Deux, Salazie, Trois Bassins, La Plaine-des-Palmistes, Sainte-Rose and Saint-Philippe. The demography of this first grouping concerns 5.25% of the total population of the department of Reunion, i.e., 4.70%, in terms of residual household waste production. The “weak” group concerns the communes whose population does not exceed 10,000 inhabitants and whose waste production is around 1500 tons. The analysis of this linear regression model considers an overestimation of the waste production, i.e., a difference of 318 tons of waste, between the observed value and the estimated value. The average per capita production is estimated at 247 kg.
A group called, “average”, consists of 13 municipalities whose linear regression model tends to underestimate waste production. The communes in this second group are characterized by an average population of 25,000 inhabitants, for a production of less than 10,000 tons of waste over a year. This second group can be categorized into two subgroups, the lower middle group and the upper middle group. The lower middle group consists of five communes, namely Bras-Panon, Les Avirons, Étang-Salé, Petite-Ile, and Sainte-Suzanne. The decomposition of the linear regression model through this subgroup shows an underestimation, with a difference of 1140 tons of waste. The upper middle group is characterized by the presence of eight communes, namely Saint-Benoit, Saint-André, La Possession, Le Port, Saint-Leu, Saint-Louis, Saint-Joseph, and Sainte-Marie. In addition to the communes in the lower middle group, the communes in the upper middle group have a population of more than 30,000 inhabitants and a waste production of more than 5000 tons. The commune of Sainte-Suzanne presents characteristics halfway between the lower and upper middle group, hence the uncertain classification.
The estimation profile for this group establishes an underestimate of the waste generation, with a difference of 2114 tons between the observed and estimated values. In sum, the lower middle group and the upper middle group together, express 45% of the population of Reunion, or about 400,000 people. The production of residual household waste is described in the same proportions, i.e., approximately 110,000 tons. The linear modeling of this second group allows to establish an underestimation of the waste production, with 3254 tons between the observed value and the estimated value, that is to say an underestimation of 0.97% of the initial production. The average production of residual household waste per inhabitant is about 276 kg.
A “strong” group, composed of four municipalities whose linear regression model overestimates waste production. The third grouping highlights the communes of Saint-Paul, Saint-Pierre, and Saint-Denis because of their demographic characteristics and residual household waste production. The commune of Le Tampon lies between the middle and strong groups in this cluster. The four communes of this last group represent 50% of the population and 50% of the production of the household and similar waste in Reunion Island. The demography is expressed in such a way as to describe a commune with at least 100,000 inhabitants, for a waste production of about 20,000 tons. The analysis of the estimation model shows a theoretical curve overestimating the waste production, with less than 1951 tons between the observed value and the estimated value, i.e., an overestimation of 1.02% of the initial production. The per capita production of the residual household waste is estimated at 266 kg.
3.3. Principal Component Analysis
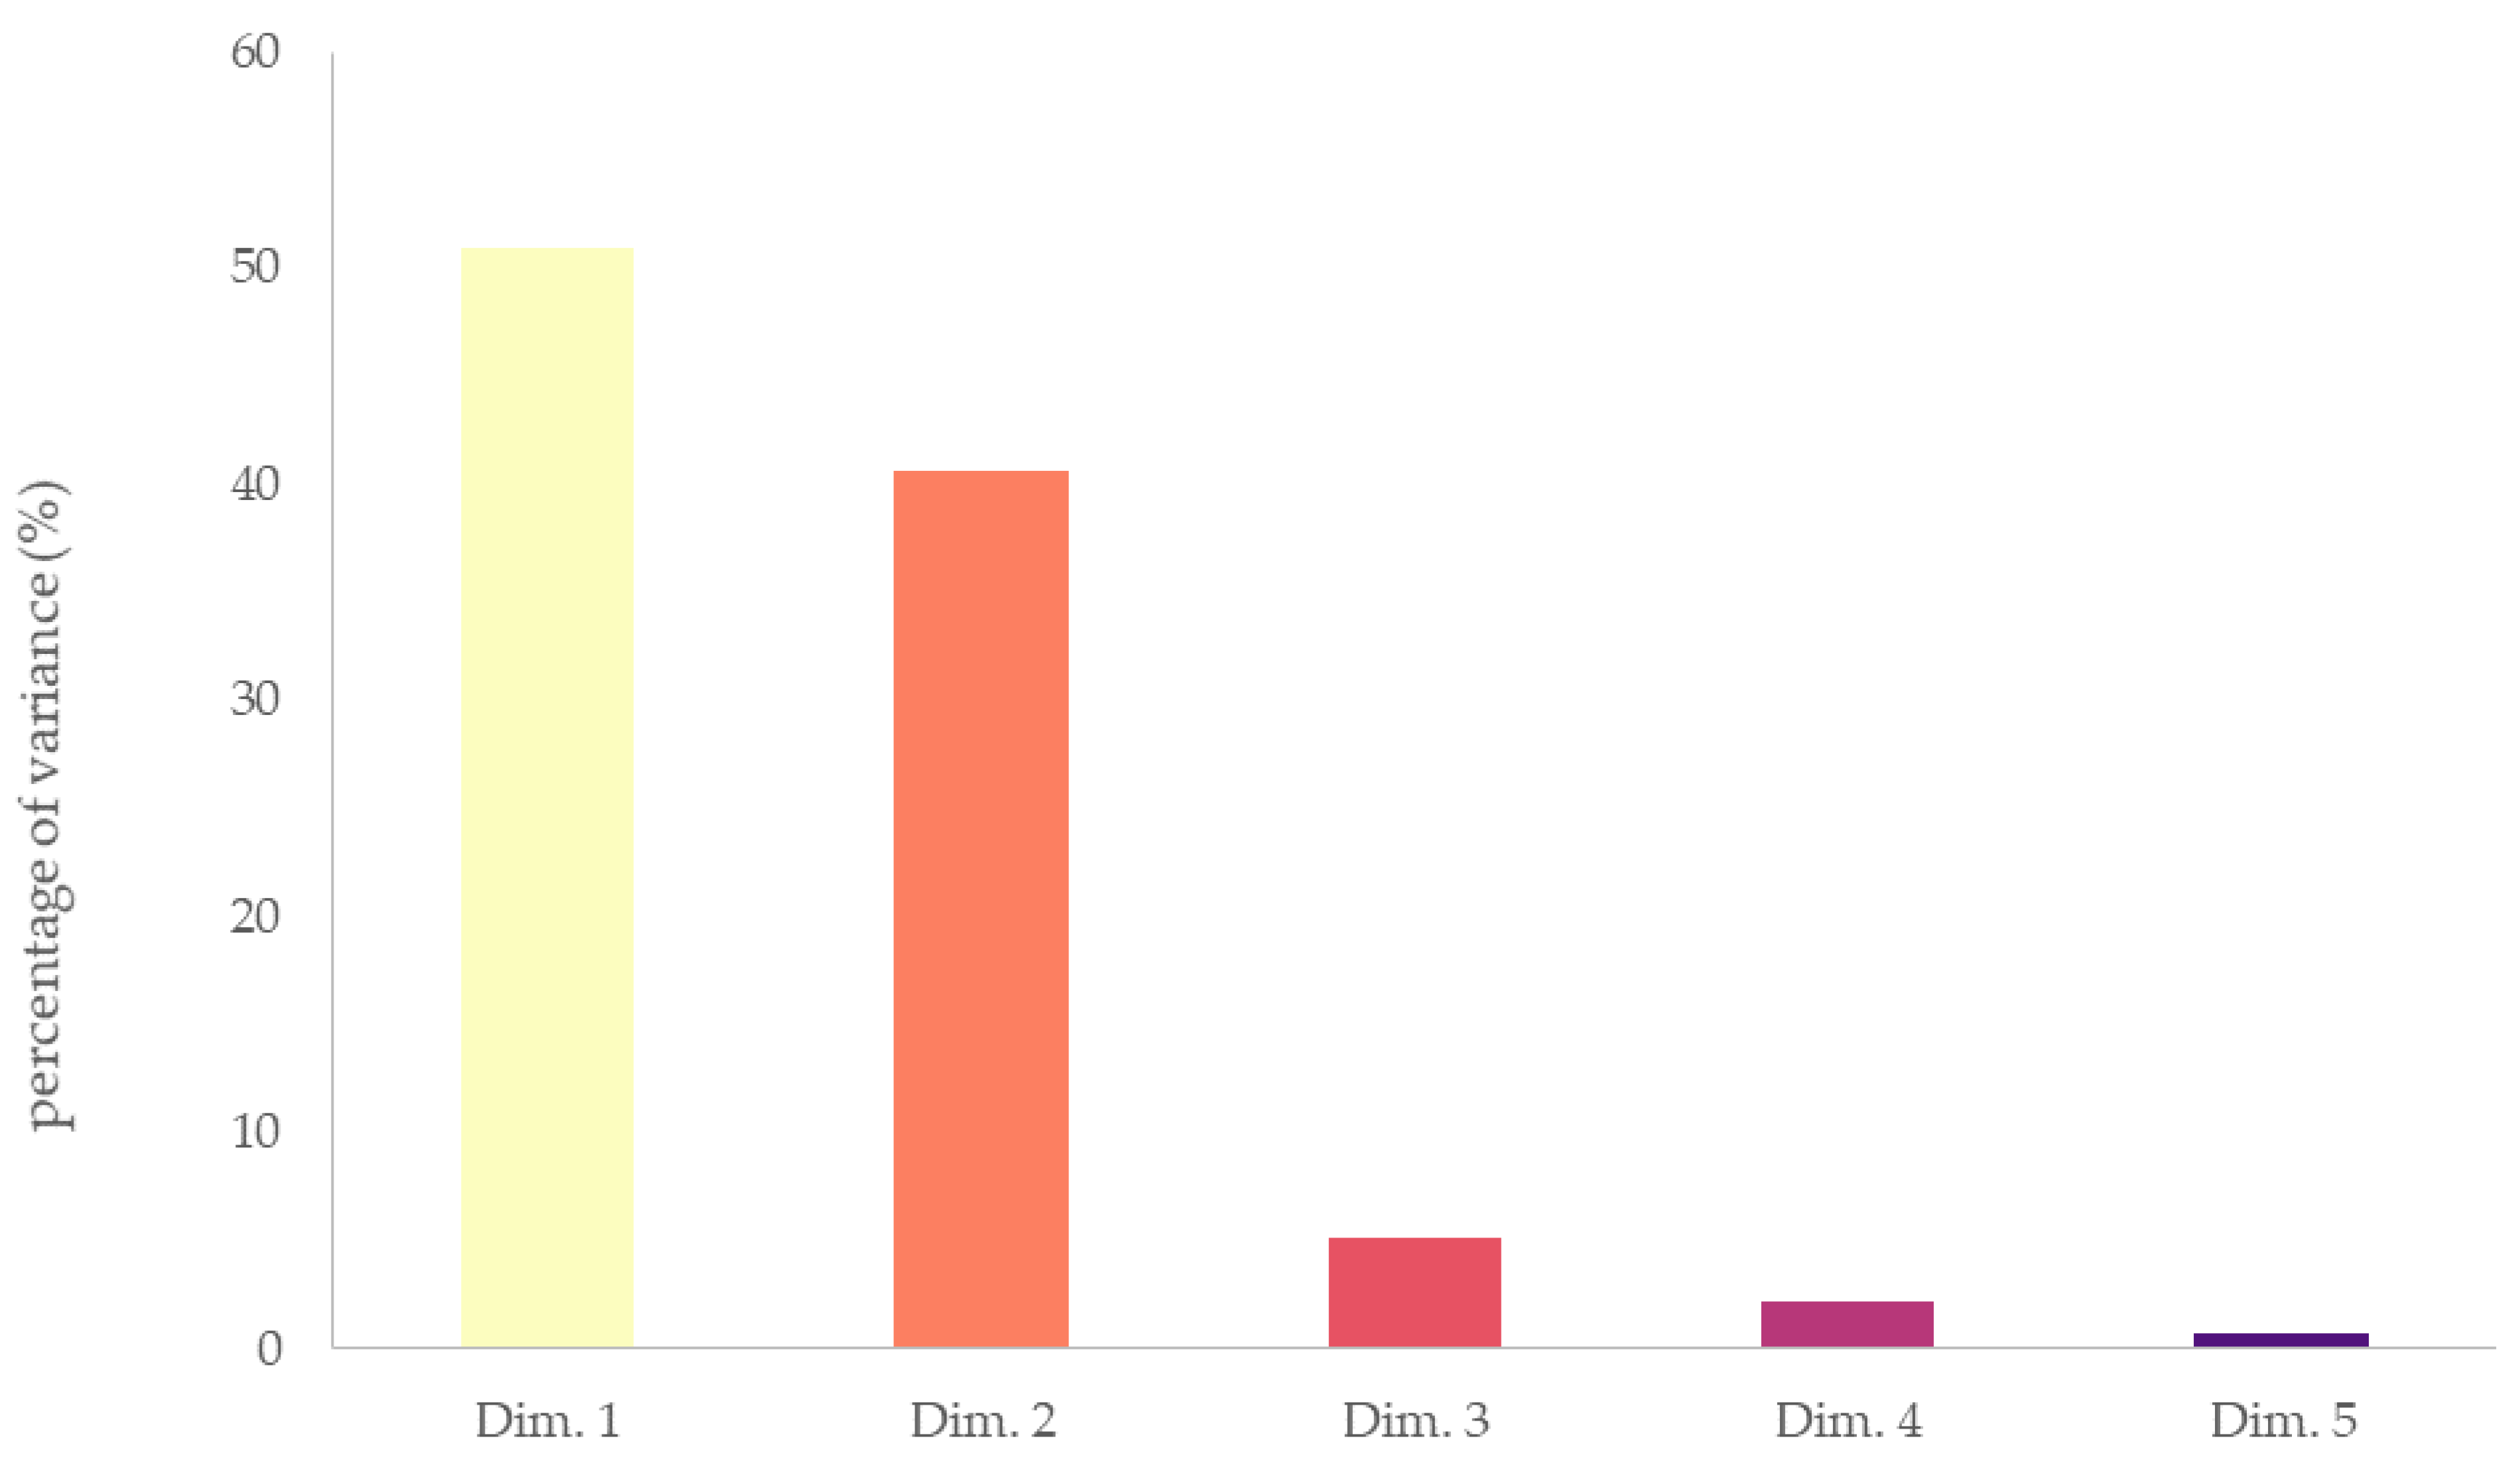
The estimation errors on the different groups considered by the linear regression model allow us to consider that demography, as an explanatory variable, consents to globally describe the production of municipal solid waste. Nevertheless, other variables can improve the understanding and therefore the formation of waste production. The principal component analysis approach addresses the behavior of the different municipalities with regard to the production of residual household waste. The eigenvalues describe the explained variance for each principal axis, as shown in Figure 7. More than 90% of the total variance is explained by the first two values, therefore the principal component analysis can be reduced to a representative projection of the variables on dimensions 1 and 2. The quality of the representation of the variables is described by the cos2 parameter. For a given variable, the cos2 parameter makes it possible to interpret the principal components under consideration. In this case, all of the variables shown by component 1 and 2 have a cos2 close to or greater than 0.80.
The contributions of the variables to the principal axes allow to express the variability in the dataset. For a given dimension, a variable with a contribution above the threshold contribution is rightly considered significant in explaining the dimension. For the present dataset, the expected threshold contribution of a variable for dimension 1 and dimension 2, is 15 points. On average, the variance retained by both dimensions is explained by variables with an average contribution close to the threshold average.
The description of the dimensions agrees to highlight the most significantly correlated variables, as shown on Figure 8.
The description of dimension 1 identifies a correlation greater than 0.75 for the variables “Share of households with a car—CAR” and “Labor force participation rate of 15–64 year olds—LF“. Conversely, dimension 1 is inversely described by the variables “Poverty rate—PR” and “Share of total social benefits—SSB” with a correlation equivalent to −0.90. The description of dimension 2 identifies a correlation of 0.87 for the variable “Production of residual household waste—PRW”. The variables “Permanent database of facilities-shops—PDS” and “Disposable Income—DI” follow the variable “Production of residual household waste—PRW”. The quality of the representation of the variables is estimated at more than 0.90, with a correlation at dimension 2, higher than 0.80. In these results, the p-values for the description of the variables considered are all below the significance level of 0.05, indicating that the description coefficients are significantly associated with a given principal component.
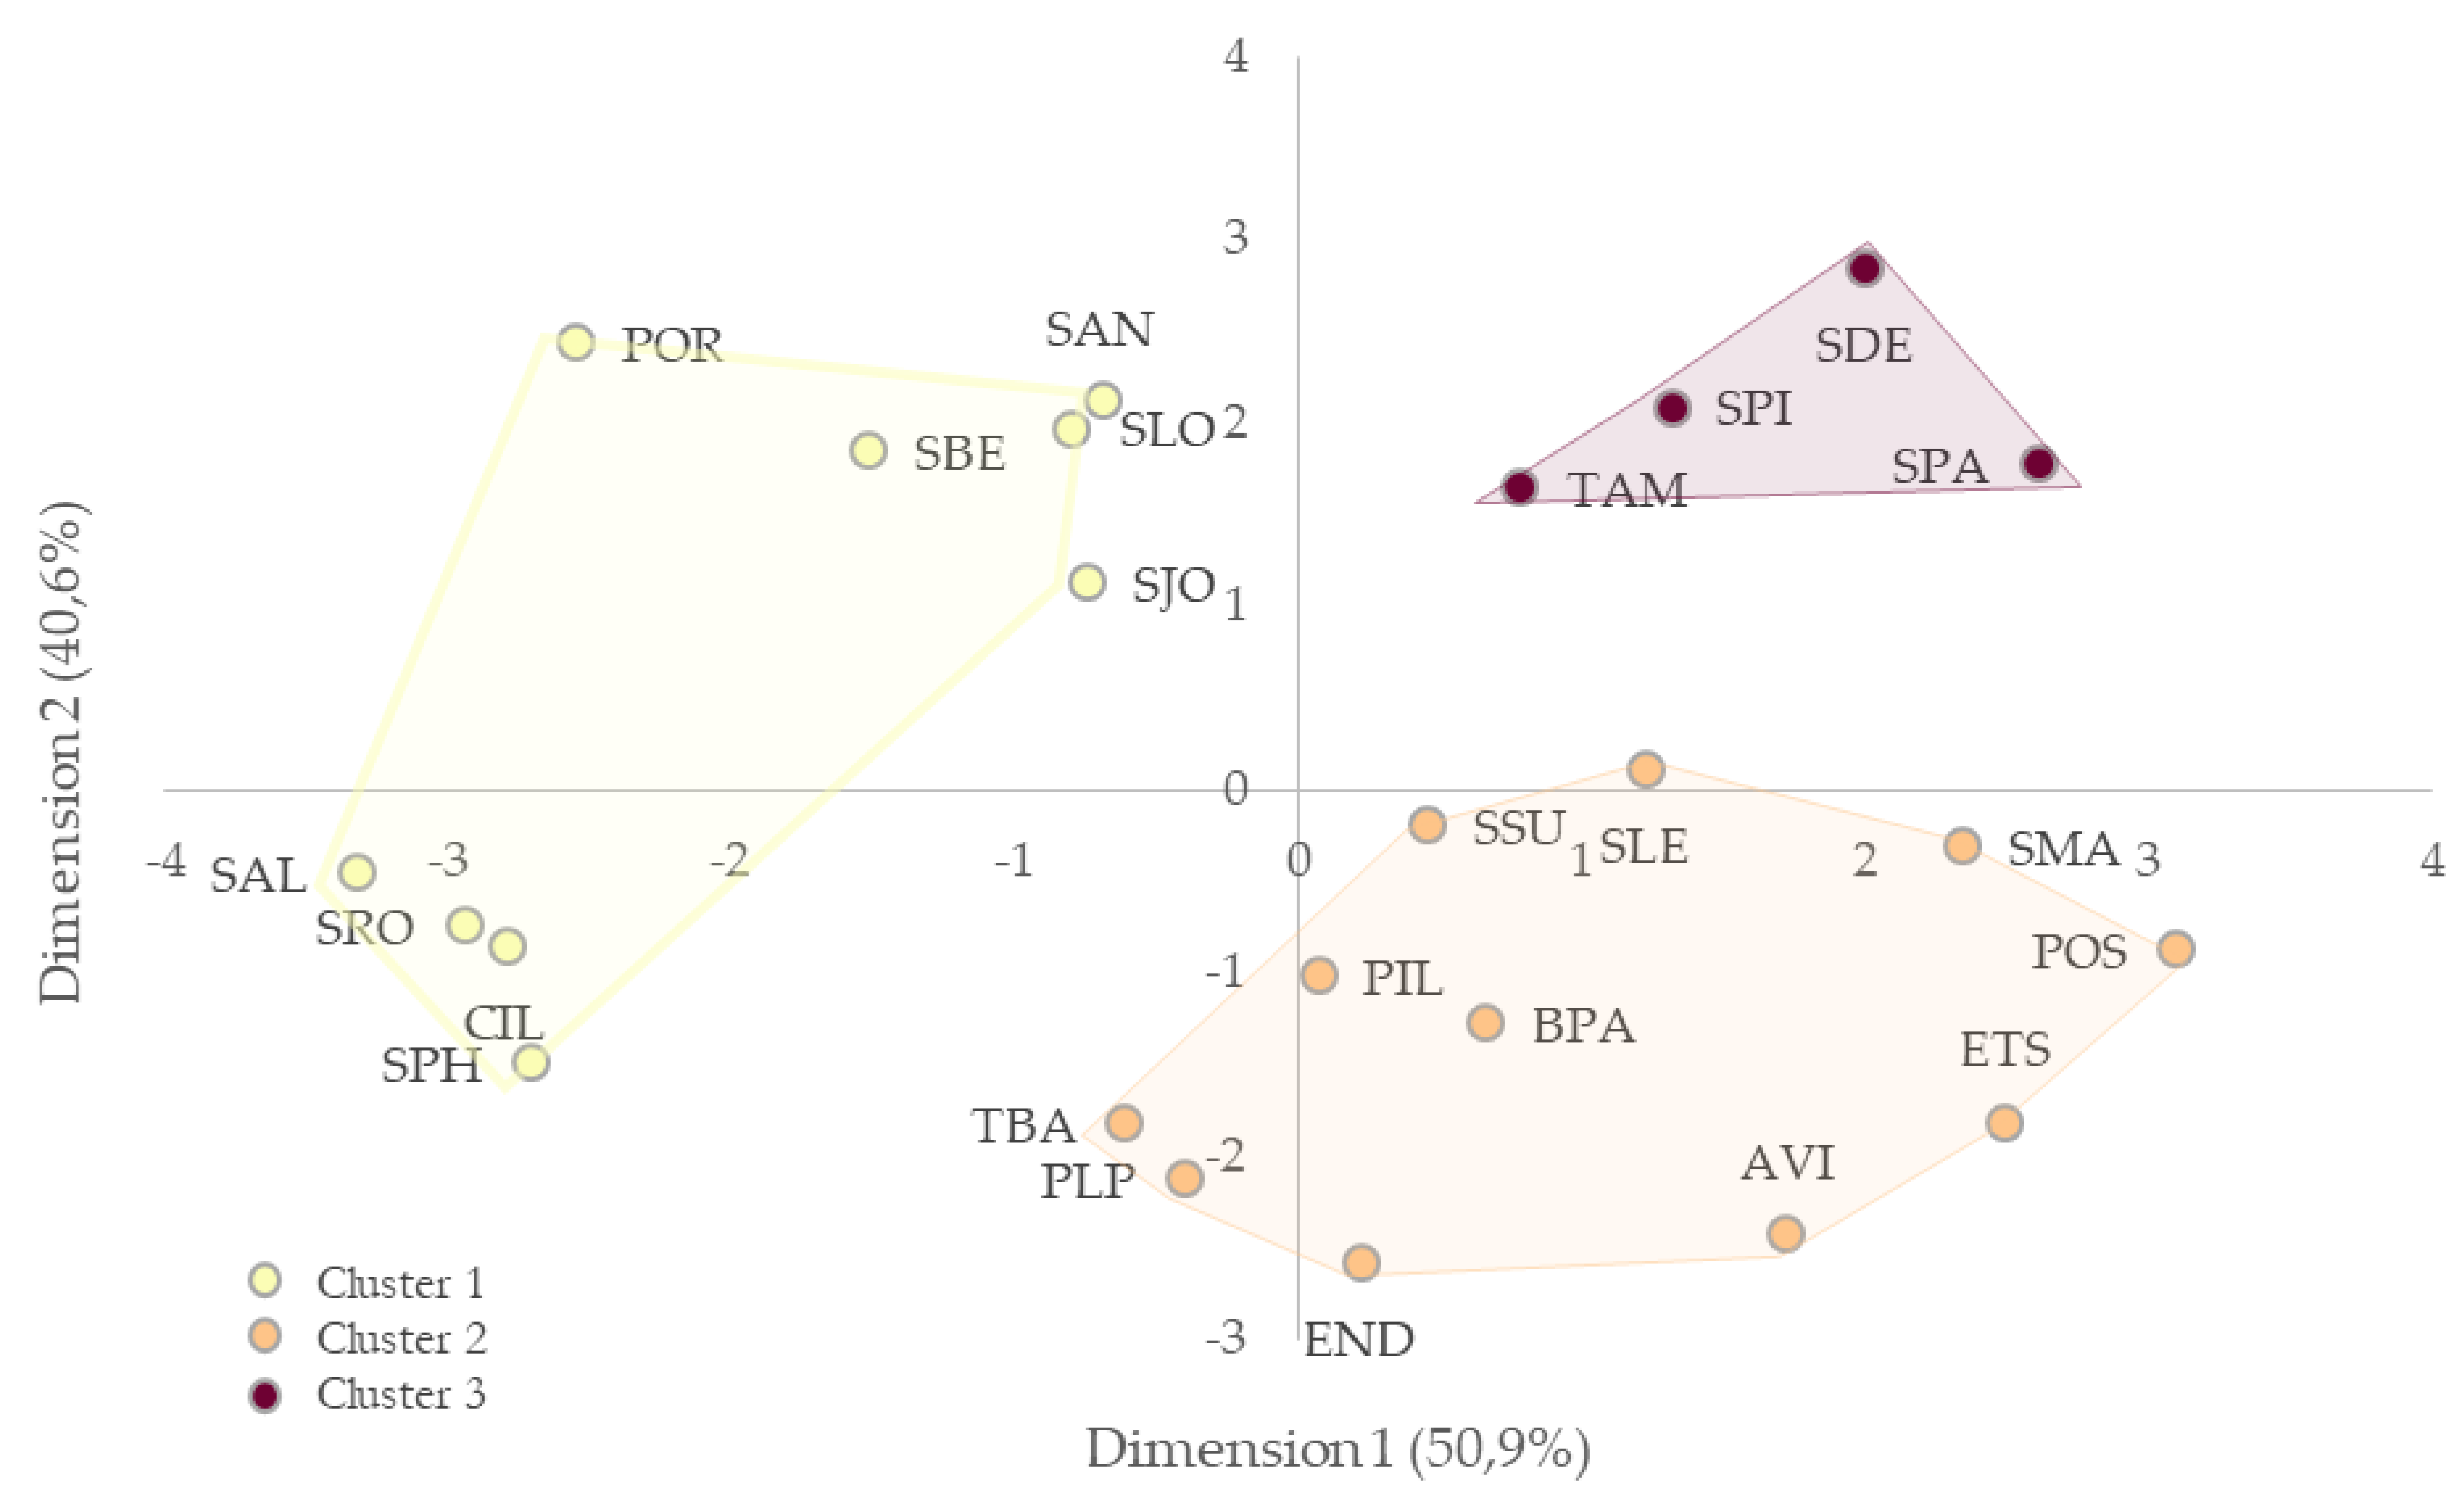
The representation of individuals in Figure 9 highlights the municipalities.
The contribution of the different points helps in the interpretation of the axes, as the inertia of the dimensions considered is represented by all of the individuals considered. The analysis of the contribution of the different individuals allows us to consider the characteristics specific to the axis. The quality of the representation of individuals on the plane defined by dimensions 1 and 2 is significant with a combined average greater than 0.85. The specific representation of the different individuals makes it possible to interpret the proximities, and even to discern certain possible similarities. The factorial design of the individuals identifies different groups of municipalities. A group of municipalities converges at the top right of the factorial design. This grouping has higher values than the other individuals within the variables considered. In proportion, Saint-Denis, Saint-Paul, Saint-Pierre, and Le Tampon contribute more than 25% to dimension 2, i.e., as much or as little to the production of municipal solid waste in Reunion. The municipalities under study are distinguished by a population that contributes to the economic and social development of their territory, and the poverty rate is below the regional average, i.e., 38%, compared with 43%. On the top left, a group of municipalities has specific characteristics, compared to the neighboring groups, particularly in terms of the high production of residual household waste. Le Port, Saint-Louis, Saint-André, Saint-Benoit, and Saint-Joseph have a poverty rate of over 48%, supported by social benefits of around 23%.
This leaves room for a strong disparity, in terms of the standard of living, which is further accentuated by a population that is poorly equipped with a vehicle, i.e., 65% of households are equipped with at least one vehicle. 8000 per person, but with a fine network of commercial facilities, i.e., one facility for every 180 people. At the bottom, a group of towns is distributed jointly on either side of the factorial plane.
On the right, a group of towns, characterized by an average production of household waste. Sainte-Suzanne, Saint-Leu, Sainte-Marie, Bras-Panon, Etang-Salé, la Possession, Petite-Ile, and les Avirons are discretized, according to an activity rate of 15 to 64 year-olds of more than 73% and a greater mobility than the other municipalities, which represent 75% of households with at least one vehicle. These municipalities are represented by a relative willingness to consume, i.e., a disposable income of more than 8000 euros per person, but the level of facilities and services in the field of commerce remains low, i.e., one facility per 280 people.
On the left, a group of towns is characterized by a low production of municipal solid waste, but torn on both sides by a population that is poorly integrated into working life, threatened by poverty, isolation, and social disparities. The representation of the municipalities stretches out in a linear fashion, indicating a similar profile in dimension 2. The town of Cilaos and its sister towns of Salazie, Saint-Philippe, and Sainte-Rose accumulate difficulties. A poverty rate of over 55%, supported by a high proportion of social benefits, and they have to compete with an available income of less than 7500 euros per person for a level of equipment that is not very diversified, since 80% of these shops are dedicated to food. The municipalities of Trois-Bassins, Entre-Deux, and La Plaine-des-Palmistes escape this rule to some extent because their standard of living is better than that of the previous municipalities, represented by an activity rate of 15 to 64 year olds close to the regional average, i.e., 70%, and a more substantial purchasing power, i.e., 9000 euros per person. Nevertheless, the municipalities in this group have a low coverage, in terms of facilities, i.e., one facility per 330 people. To go further, the variables of dimension 2 characterize the weak group, in comparison with the other municipalities, by a service in terms of equipment that is not very mobilizable and a low purchasing power. Already geographically distant from the major centers, Salazie, Cilaos, Sainte-Rose, and Saint-Philippe have to compete with a disposable income of less than 7500 euros per person for a level of equipment that is not very diversified, since 80% of these shops are dedicated to general food.
Conversely, towns such as Entre-Deux and La Plaine-des-Palmistes, are out of step because of their greater purchasing power, i.e., 9000 euros per person, but their low level of equipment, i.e., one item of equipment per 330 people. In the center, municipalities, such as Le Port, Saint-Louis, Saint-Benoit, Saint-Joseph, and Saint-André are characterized by a disposable income of less than 8000 euros per person and by a fine network of commercial facilities, i.e., one facility for every 180 people. Towns, such as Les Avirons, Bras-Panon, Etang-Salé, Petite-Ile, La Possession, and Sainte-Marie are represented by a relative willingness to consume, i.e., a disposable income of more than 8000 euros per person, but the level of commercial facilities and services remains low, i.e., one facility for every 280 people. A group of four towns converges at the top right of the factorial plane. This grouping has higher values than the other individuals within the variables considered. In terms of facilities and services, Saint-Pierre provides a significant territorial coverage, compared to Saint-Denis and Saint-Paul, i.e., one facility in the field of commerce for 110 inhabitants. The factorial plan of the individuals allows to identify a classification in three clusters of communes with specific characteristics. Indeed, according to the elbow method, the determination of the optimal number of clusters is characterized from the moment after which the distortion/inertia starts to decrease in a linear way. The K-means method supports the choice of the number of clusters and aims at grouping similar elements in these clusters.
3.4. Linear Regression Model (R2)
To support the approach, a new linear regression model is invested. The R2 model is based on the observations from the previous analysis, i.e., from the R1 linear regression model and the principal component analysis. Following the arrangement, three clusters of communes are proposed, all with similar membership profiles. The differences in partitioning are observed in the second and third groups of communes, i.e., a reorganization of the communes, observed in the medium group, in favor of the weak group. The strong group remains similar to the observations made earlier. The description of the groups is presented as follows:
- The weak group, characterized by a low residual household waste production profile, compared to the other communes, i.e., a per capita production evaluated at 257 kg. This grouping represents, on the one hand, municipalities with a service in terms of equipment that cannot be mobilized, a weak purchasing power and, moreover, is geographically distant from the major centers and, on the other hand, municipalities whose integration of people favors the economic and commercial framework, consequently a coverage in terms of equipment and services capable of satisfying the needs;
- The average group, characterized by an average production of residual household waste with a per capita production estimated at 276 kg. The formation reflects an average group, characterized by indicators, such as the poverty rate calculated at 48% and a disposable income established at 12,500 euros. The proportion of households with at least one vehicle is also low in this group, at 65%. However, the facilities and services are diversified in the area under consideration, with 1200 entities, which represents a coverage level of one facility per 230 people.
- The strong group represented by four municipalities, characterized by an average production of residual household waste, that is to say a production per inhabitant of about 268 kg, but also by variables of strong importance. This grouping of municipalities is based on a median standard of living of over 15,000 euros, which is about 10% higher than the regional average. As in the other municipalities, the poverty rate is low, due to the favorable job market in the area. In this respect, the permanent equipment database reports more than 2800 entities, i.e., almost 50% of the infrastructure in the field of commerce in Reunion, in such a way as to ensure a coverage of at least one equipment for every 145 people. Mobility is debatable in this group, especially for the commune of Saint-Denis, which shows that only 67% of households have at least one vehicle.
The synthesis in the three groups supports the classification of the communes of Reunion Island, with regard to the production of household waste, according to demography Figure 10 shows the linear profiles between the different communes. The label references and prediction data for the R2 model are given in Table 3. Forecast errors of the residual household waste generation on the R2 model.
The coefficient of determination R2 of the R2 model is, on average, lower than the R1 model, i.e., an R2 equivalent to 0.95. However, the result of the demonstration supports the approach, indeed, the proposal demonstrates a more efficient estimation of the residual household waste production of the communes of Reunion Island. The R1 linear regression model gave an estimated value of 231,432 tons against an observed value of 232,418 tons of waste. The difference between the estimates is 985 tons of residual household waste. The partitioning approach shows a result closer to the observed value, i.e., a residual waste production of 231,804 tons, which represents a difference between the estimates of 613 tons. Figure 11 shows the forecast modeling from the linear regression models for the base year, as well as for the years 2016 through 2019.
Depending on the approach, the estimates of household residual waste generation are close to the observed data. According to Table 2 and Table 3, the MAPE statistic (mean absolute percentage error) expresses the predictive quality of an estimation model as a percentage of the error. Among other things, the value proves to be a convenient indicator for comparison. The R2 regression model exhibits a lower value than the R1 regression model, i.e., 8.33%, compared to 11.81% for 2015. The specific values within the R2 regression model for the strong and medium categories are more explicit at 2.48% and 8.56%, respectively. The communes in the weak and medium weak group exhibit worse values at 10.28%. This result reflects several estimation errors partially weighted by undetermined profiles. The approach used was to predict the residual waste production data for the years 2016 to 2019. The prediction results show average estimation errors of about 1000 tons. The MAPE parameter exposes the R2 model favorably to the R1 model, i.e., 7.47 to 11.91 for the year 2016, 7.44 to 10.52 for the year 2017, 9.19 to 10.02 for the year 2018, and 5.72 to 8.58 for the year 2019, respectively. The estimation performance is better represented through the R2 regression model, compared to the R1 model.
3.5. Waste Generation Forecast
The question of data is crucial, as the proposal characterizes a territory, according to a distinct scale and period. Given the importance of data in waste management strategies, it is proposed in this perspective to evaluate the production of residual household waste, according to the reference demographic forecasts of the INSEE by 2030 [54]. The prospecting model is conditioned on the distribution of the island’s population by sex and age detailed on 1 January 2013. The modeling assumptions mobilize the three main components of the evolution of the population over a year, namely: fertility, mortality, and migration. This prospective modeling is based on three scenarios:
- Scenario 1—SC1 extends the production of the waste fraction according to the demographic forecast. The scenario follows the current trends, in fact since the year 2009, the production of residual household waste is decreasing. The reduction of the waste fraction is about −1,65%, annually;
- Scenario 2—SC2 follows the recommendations of the Regional Council of Reunion, i.e., the “Zero Waste” approach of 2018, with a reduction of residual household waste production of 72% in 2024, compared to that of 2015, and 88% in 2030 [38].The so-called voluntarist political approach is committed to the major guidelines of the LTECV;
- Scenario 3—SC3, which follows the recommendations of the General Council for the Environment and Sustainable Development (CGEDD), supported by the circular economy package, which aims at a 50% reduction of residual household waste production, in 2030, compared to 2015 [38].
The results of this forecast are shown in Figure 12.
The forecast for scenario 1—SC1 follows the trend of the projection. In 2030, a demographic forecast of 962,100 inhabitants, an estimated increase in population of 12.11%, compared to 2015. The production of residual household waste is estimated at 181,262 tons, a decrease of −22.3%, compared to 2015. The scenario corresponds to a continuation of the current trend, the forecast curve thus shows a net decrease in the production of residual household waste.
Scenario 2—SC2 shows a very proactive approach, where communities openly engage in a waste management policy. The production of residual household waste would decrease by an average of −12.87% per year over the period 2015–2024 and 13.13% over the period 2025–2030. For the year 2030, the production of residual household waste is estimated at 28,036 tons.
Scenario 3—SC3, although ambitious, is close to the current contextual elements, in fact the objectives bring the production of residual household waste to 116,815 tons, that is to say an average annual decrease of −4.51%. For the year 2030, the production of residual household waste is estimated at 116,815 tons.
4. Discussion
The improvement of living conditions, the demographic count, as well as the job market reflects the satisfaction of people’s needs, especially in terms of consumption of goods and therefore of waste production. The application of mathematical models or the statistical analysis in the characterization and forecasting of household waste production, should be emphasized. In several municipalities in Taiwan, a study was carried out to characterize the household waste generation through a linear regression model, based on several urbanization indicators, namely household population, urban planning area, drinking water connection rate, electricity consumption, number of industrial facilities in operation, education level, vehicle density, and annual income. In addition, the application brings the population variable into the composition of household waste generation, with notably a R2 > 0.8 [22]. A case study paper provides a description of household waste management in four Latin American countries: Peru, Chile, Colombia, and Brazil. This paper provides an overview of the approaches used to model the emissions and mitigation options in waste management strategies. In addition, the results demonstrate a relationship between waste generation, gross domestic product, and population [55]. In Mexico, a study initiates a mathematical approach to establish a relationship between household waste generation and different explanatory variables. Linear relationship models carried a relationship for the explanation of 51% of the waste production, per capita, with the following independent variables: education, residence rate and income per household [31]. In Abuja, a proposal aimed to assess the quantities and composition of household waste generation of 74 households from different socio-economic levels. The results revealed a statistical difference between the household size, income, and waste generation. According to this study, the larger the household size, the lower the per capita waste generation, while the higher the income, the higher the per capita generation [60]. This conclusion is supported by the identification of a negative correlation between the number of persons in a household and a lower, per capita, waste generation [29,30,61]. Municipal population is the most influential explanatory variable of waste generation, and is related to the generation of residual household waste, as highlighted in this proposal from Mexico. In this study, the variable has a R2 value of 0.985, a strong positive correlation with waste generation, which affirms the hypothesis that the greater the population, the greater the amount of municipal solid waste generated [62]. In Austria, a regression model was used to identify and quantify the differences in the amount of waste collected, based on the waste management data and socio-economic indicators. Among the indicators assessed, the results identified the household size, tax revenue, and the share of heated buildings, as the influencing factors on household waste generation [24].
In Romania, a study evaluates the amount of six residual waste fractions under certain indicators: number of residents, population age, urban life expectancy, total municipal solid waste. The results of the regression analysis show that the significant variables are the population aged 15–59 and the total municipal waste [63]. The municipal population is the most influential explanatory variable for waste generation, and is positively related to the generation of residual household waste. Studies point out the importance of this variable in the formation of waste generation, in fact, and the growth of these indicators go hand in hand [64,65]. The issue of data is crucial, and the proposal characterizes a territory, according to a scale over a distinct time period. A later work addresses the characterization of energy consumption in Reunion, according to population, the latter leads to propose a classification, by using the methods K-means and silhouette, of energy consumption entities, in particular, by dividing the territory into different subsets. This principle of sectorization aims at the implementation of a smart grid, i.e., the application of microstructures of the proximity of energy production and distribution. This vision feeds the debate on sustainable cities and neighborhoods, and to support the development of renewable energy [66]. A study proposes to quantify the household waste production, according to the socio-economic variables in the province of Vizcaya in Spain. Two models have been developed, the first one considers the whole province and the second one approaches the municipalities, according to groups. The grouping of observations with similar characteristics within a cluster by the K-means method improves the results and allows for building more robust models. The methodology identified the following variables to explain the waste generation: urban morphology, tourism activity, education level, and economic status [67].
In this approach, the proposed clustering is approached, according to the residual household waste production data and socio-economic data. The clustering principle reports a specific arrangement of entities, according to the similar characteristics and thus a different per capita production. In addition, the so-called strong group has a lower waste generation than the average group, a difference of about 8 kg. This value provides relevant information for the implementation of an adapted and localized management strategy. Indeed, for these communes in transition, specific measures can be applied, such as awareness campaigns on the waste prevention and sorting. The forecast addresses the production of residual household waste, in order to provide relevant information for political decision-making. Scenario 2—SC2 is driven by great ambitions, indeed, the objectives of 2030 provide for a reduction of 88%, compared to 2015, of the residual household waste. The Regional Council of Reunion foresees a ratio of 27 kg of residual household waste in 2030. In any case, the aim of this so-called “zero waste” approach is becoming less likely. In 2019, the production of residual household waste amounted to 208,196 tons, while the scenario presents a value of 157,170 tons, a difference of 25%. The General Council of Environment and Sustainable Development [38] questions this initiative, moreover, the results obtained in the national territory, in terms of voluntary waste management reach, at best, a ratio of 95 kg, per capita, per year. The prospective is conditioned in an active approach indeed, besides the implementation of concrete actions, the objectives are out of reach. The difference in forecast was about 5% in 2019, that is, an estimated production of 197,126 tons. Scenario 1—SC1 follows the current trends, the projections are below scenario 3—SC3, in so far as in 2030, the scenarios propose a difference of 36% of the residual household waste production. Scenario 3—SC3, remains sustainable, in fact, the efforts, in terms of prevention and waste management, contain the prospective waste fraction. Modeling is carried by an active approach, both in terms of prevention and on the issues of collection and treatment [38].
In addition to the application of very proactive measures, through the quantities of residual household waste, the results of the 2017 waste characterization campaign; MODECOM, on the island propose detour potentials [42]. Indeed, material recovery concerns more than 100 kg per capita in residual household waste. The organic recovery deposit in this waste fraction represents nearly 100 kg per capita. Finally, the potential for detour, in terms of energy recovery, is estimated at over 190,000 tons or 250 kg per capita [42].
5. Conclusions
Waste management is an important issue in an insular context. It remains a complex discipline, especially in such an approach, it appears necessary to develop effective solutions, in terms of waste management. The search for innovative and efficient solutions tends to contribute to the effort of “refocusing” for the territory. It is part of a local development policy where the objectives are prevention, reduction, and reuse. The methodology presented approaches the principle of the communal scale, in the sense that a fine scale brings a reflection of proximity to the problem. The qualification of lifestyles, the development of the job market, or the expressions of mobility support the choice and the relevance of this scale. The approach is defined by the use of a linear regression model and a principal component analysis, in order to better understand the formation of residual household waste production in Reunion Island.
The results suggest the arrangement of individuals, in such a way as to consider the partitioning of the communes of Reunion Island into production groups. The classification into three groups of different individuals suggests similar profiles of belonging, thus proposing different contextualized environments. Such an approach addresses intra-class characteristics, in order to help understand residual household waste production. The communes being what they are, the approach distinguishes locally the latter, which brings a reading of the individual specificities characterizing the disparities in exercise in the territory of Reunion. Thus, the characterization of the forecasting models addresses the need to partition the territory into a panoply of groups of similar affiliations. In sum, the methodology partitions the territory into three clusters, where the production of residual household waste is expressed in the most accurate way. The purpose of the residual household waste forecast is to inform strategic choices. In view of the issues that will require important decisions in terms of waste management, the analysis of the results shows the relevance of the municipal scale. Indeed, the method of estimation R2, by a classification of the territories, approaches the question of the management of waste, in order to express answers of proximity, contextualized to the localized problems. To date, the island is out of step with the national territory, in terms of waste management. Faced with this situation and the imminent end of the operation of the only two waste storage centers on Reunion Island, it is essential to turn to a responsible waste management strategy [38].
In perspective, a multi-variate composition of the residual household waste formation, over the long term, and further research on a finer scale, such as the neighborhood would provide relevant insight into waste management strategies in Reunion. In fact, the demographic growth accompanies the increase in the production of residual household waste, but does not seem to be sufficient to explain it completely.
Problems arise on the island, in terms of dependence or structural factors, and waste management has become a priority, in order to constitute a healthy environment for the population on the one hand, and to ensure the preservation of the natural heritage, on the other hand, and all this in proportions that guarantee the good economic development of the island. Such an approach is instituted in a whole, where several actors intervene. Moreover, the question of temporality proposes an opening on the effects of scales, the method of clustering is conditioned on a set of data supposed to retranscribe the information of the moment on the scale of the territory. It would be relevant to consider, especially in the waste framework, the updating of data on a recurrent dimension, for example, on a monthly period, in order to distinguish the effects of seasonality.
Author Contributions
All authors have read and agreed to the published version of the manuscript.
Funding
This research was supported by the Region Reunion (France) PO 2014–2020 as part of the funding of a research thesis in the PIMENT laboratory at the Reunion Island University.
Institutional Review Board Statement
Not applicable.
Informed Consent Statement
Not applicable.
Data Availability Statement
Not applicable.
Conflicts of Interest
The authors declare no conflict of interest.
References
- Dehoorne, O. The advent of mass tourism in the tropics. Elements of reflection on tourism issues in the Caribbean. Études Caribéennes 2006. [Google Scholar] [CrossRef]
- Gay, J.-C. The Development of Tourism in the Intertropical Islands. Mappe Monde 2000, 58, 17–22. [Google Scholar] [CrossRef]
- Eckelman, M.J.; Ashton, W.; Arakaki, Y.; Hanaki, K.; Nagashima, S.; Malone-Lee, L.C. Island Waste Management Systems: Statistics, Challenges, and Opportunities for Applied Industrial Ecology. J. Ind. Ecol. 2014, 18, 306–317. [Google Scholar] [CrossRef]
- Hornsby, C.; Ripa, M.; Vassillo, C.; Ulgiati, S. A Roadmap towards Integrated Assessment and Participatory Strategies in Support of Decision-Making Processes. The Case of Urban Waste Management. J. Clean. Prod. 2017, 142, 157–172. [Google Scholar] [CrossRef]
- Fuldauer, L.I.; Ives, M.C.; Adshead, D.; Thacker, S.; Hall, J.W. Participatory Planning of the Future of Waste Management in Small Island Developing States to Deliver on the Sustainable Development Goals. J. Clean. Prod. 2019, 223, 147–162. [Google Scholar] [CrossRef]
- Caro, M. Household Waste Management in the DCOM, Notes from the Issuing Institute 2008. Available online: https://www.iedom.fr/IMG/pdf/ni-2008-09_gestion_dechets_menagers_dans_dcom (accessed on 1 December 2022).
- Tan, R.B.H.; Khoo, H.H. Impact Assessment of Waste Management Options in Singapore. J. Air Waste Manag. Assoc. 2006, 56, 244–254. [Google Scholar] [CrossRef] [Green Version]
- Willmott, L.; Graci, S. Solid Waste Management in Small Island Destinations: A Case Study of Gili Trawangan, Indonesia. Téoros Rev. Rech. Tour. 2012, 31, 71–76. [Google Scholar]
- Durand, M.; Bahers, J.-B.; Beraud, H. Towards a circular economy... of proximity? A variable geometry spatiality. Déchets Sci. Tech. 2016, 15, 555589. [Google Scholar]
- Mery, J.; Mtibaa, R.; Torre, A. Proximity dynamics and waste management: Apllication to landfill. Int. J. Sci. Res. 2009, 9, hal-00473256. [Google Scholar]
- Prévot, H. Energy Recovery from Waste Treatment; Ministry of Economy, Finance and Industry: Paris, France, 2000.
- Rocher, L. The Contradictions of Integrated Urban Waste Management: Incineration between Energy Recovery and Social Rejection. 2009, p. 9. Available online: http://www.cairn.info/revue-flux-2008-4-page-22.html (accessed on 1 December 2022).
- Beigl, P.; Lebersorger, S.; Salhofer, S. Modelling Municipal Solid Waste Generation: A Review. Waste Manag. 2008, 28, 200–214. [Google Scholar] [CrossRef]
- Dyson, B.; Chang, N.-B. Forecasting Municipal Solid Waste Generation in a Fast-Growing Urban Region with System Dynamics Modeling. Waste Manag. 2005, 25, 669–679. [Google Scholar] [CrossRef] [PubMed]
- Eriksson, O.; Olofsson, M.; Ekvall, T. How Model-Based Systems Analysis Can Be Improved for Waste Management Planning. Waste Manag. Res. 2003, 21, 488–500. [Google Scholar] [CrossRef] [PubMed]
- Fu, H.; Li, Z.; Wang, R. Estimating Municipal Solid Waste Generation by Different Activities and Various Resident Groups in Five Provinces of China. Waste Manag. 2015, 41, 3–11. [Google Scholar] [CrossRef] [PubMed]
- Bovea, M.D.; Ibáñez-Forés, V.; Gallardo, A.; Colomer-Mendoza, F.J. Environmental Assessment of Alternative Municipal Solid Waste Management Strategies. A Spanish Case Study. Waste Manag. 2010, 30, 2383–2395. [Google Scholar] [CrossRef] [PubMed]
- Cherian, J.; Jacob, J. Management Models of Municipal Solid Waste: A Review Focusing on Socio Economic Factors. IJEF 2012, 4, p131. [Google Scholar] [CrossRef] [Green Version]
- Zurbrügg, C.; Gfrerer, M.; Ashadi, H.; Brenner, W.; Küper, D. Determinants of Sustainability in Solid Waste Management—The Gianyar Waste Recovery Project in Indonesia. Waste Manag. 2012, 32, 2126–2133. [Google Scholar] [CrossRef]
- Bandara, N.J.G.J.; Hettiaratchi, J.P.A.; Wirasinghe, S.C.; Pilapiiya, S. Relation of Waste Generation and Composition to Socio-Economic Factors: A Case Study. Environ. Monit. Assess. 2007, 135, 31–39. [Google Scholar] [CrossRef]
- Beede, D.; Bloom, D. Economics of the Generation and Management of Municipal Solid Waste; National Bureau of Economic Research: Cambridge, MA, USA, 1995; p. w5116. [Google Scholar]
- Chen, Y.-C. Effects of Urbanization on Municipal Solid Waste Composition. Waste Manag. 2018, 79, 828–836. [Google Scholar] [CrossRef]
- Dennison, G.J.; Dodd, V.A.; Whelan, B. A Socio-Economic Based Survey of Household Waste Characteristics in the City of Dublin, Ireland—II. Waste Quantities. Resour. Conserv. Recycl. 1996, 17, 245–257. [Google Scholar] [CrossRef]
- Lebersorger, S.; Beigl, P. Municipal Solid Waste Generation in Municipalities: Quantifying Impacts of Household Structure, Commercial Waste and Domestic Fuel. Waste Manag. 2011, 31, 1907–1915. [Google Scholar] [CrossRef] [PubMed]
- Mazzanti, M.; Zoboli, R. Municipal Waste Kuznets Curves: Evidence on Socio-Economic Drivers and Policy Effectiveness from the EU. Environ. Resour. Econ. 2009, 44, 203–230. [Google Scholar] [CrossRef]
- Qdais, H.A.A.; Hamoda, M.F.; Newham, J. Analysis of Residential Solid Waste At Generation Sites. Waste Manag. Res. J. Sustain. Circ. Econ. 1996, 15, 395–405. [Google Scholar] [CrossRef]
- Abbasi, M.; Abduli, M.; Omidvar, B.; Baghvand, A. Forecasting Municipal Solid Waste Generation by Hybrid Support Vector Machine and Partial Least Square Model. Int. J. Environ. Res. 2013, 7, 27–38. [Google Scholar]
- Nouri, N.; Poorhashemi, S.A.; Monavari, S.M.; Dabiri, F.; Hassani, A.H. Legal Criteria and Executive Standards of Solid Waste Disposal Subjected to Solid Waste Management Act. SSRN J. 2011, 5, 971–980. [Google Scholar] [CrossRef]
- Ojeda-Benítez, S.; Vega, C.A.; Marquez-Montenegro, M.Y. Household Solid Waste Characterization by Family Socioeconomic Profile as Unit of Analysis. Resour. Conserv. Recycl. 2008, 52, 992–999. [Google Scholar] [CrossRef]
- Beigl, P.; Wassermann, G.; Schneider, F.; Salhofer, S. Forecasting Municipal Solid Waste Generation in Major European Cities. 2004. Available online: https://www.researchgate.net/publication/250457873_Forecasting_Municipal_Solid_Waste_Generation_in_Major_European_Cities (accessed on 1 December 2022).
- Benítez, S.O.; Lozano-Olvera, G.; Morelos, R.A.; de Vega, C.A. Mathematical Modeling to Predict Residential Solid Waste Generation. Waste Manag. 2008, 28, S7–S13. [Google Scholar] [CrossRef]
- Hockett, D.; Lober, D.J.; Pilgrim, K. Determinants of Per Capita Municipal Solid Waste Generation in the Southeastern United States. J. Environ. Manag. 1995, 45, 205–217. [Google Scholar] [CrossRef] [Green Version]
- Purcell, M.; Magette, W.L. Prediction of Household and Commercial BMW Generation According to Socio-Economic and Other Factors for the Dublin Region. Waste Manag. 2009, 29, 1237–1250. [Google Scholar] [CrossRef]
- Pan, A.; Yu, L.; Yang, Q. Characteristics and Forecasting of Municipal Solid Waste Generation in China. Sustainability 2019, 11, 1433. [Google Scholar] [CrossRef] [Green Version]
- Besson, L. Insee One out of Four Reunionese Lives in les Hauts; Insee Flash n°89; INSEE: Paris, France, 2017.
- Jauze, J.-M.; Ninon, J. Dynamics and expressions of peri-urbanization in Reunion. Cah. D’outre-Mer 1999, 52, 143–168. [Google Scholar] [CrossRef]
- C.E.S.R Waste in Reunion. 1995.
- CGEDD. Waste Management on Reunion Island. 2018. Available online: https://www.vie-publique.fr/sites/default/files/rapport/pdf/184000810.pdf (accessed on 1 December 2022).
- Bertrand, F.; Richard, E. Adaptation of island territories: Elements of reflection from two French islands (Ré and Réunion). VertigO 2011, 10, 10473. [Google Scholar] [CrossRef]
- Energy Regulation Commission Deliberation N°2020-028. 2020. Available online: https://www.cre.fr/content/download/21993/file/200206_2020-028_ILEVA.pdf (accessed on 1 December 2022).
- ILEVA. Consultation Organized by ILEVA on the “Run’Eva” Project with Waste Incineration-CSR. 2020. Available online: https://runeva.re/wp-content/uploads/2019/12/LB_Contribution-Concertation_RUNEVA-incinerateur-UVE_12112019-1.pdf (accessed on 1 December 2022).
- ADEME. Waste Key Figures: 2017–2019, ©ADEME Éditions. Décembre 2017. Available online: https://presse.ademe.fr/2018/05/nouvelle-edition-de-dechets-chiffres-cles-disponible-2017.html (accessed on 1 December 2022).
- Rocher, L. Between Sectors and Territories, Waste Management through the Prism of Planning. 2015, p. 18, Posted on 28 July 2019. Available online: http://journals.openedition.org/pmp/9485 (accessed on 1 December 2022).
- CASUD. Report on the Price and Quality of the CASUD Household Waste Collection and Disposal Service. 2016, p. 41. Available online: https://www.casud.re/fileadmin/user_upload/Environnement_Cadre_de_Vie/Les_rapports_annuels/SPED_2016.pdf (accessed on 1 December 2022).
- CINOR. Report on the Price and Quality of the CINOR Household Waste Collection and Disposal Service. 2016. [Google Scholar]
- CIREST. Report on the Price and Quality of the CIREST Household Waste Collection and Disposal Service. 2016. Available online: https://s3.eu-central-1.wasabisys.com/mybucketci/RAPPORT-SPPGD-2016.pdf (accessed on 1 December 2022).
- CIVIS. Report on the Price and Quality of the CIVIS Household Waste Collection and Disposal Service. 2016. Available online: https://www.civis.re/index.php/telechargements/item/sped-2016 (accessed on 1 December 2022).
- TCO. Report on the Price and Quality of the TCO Household Waste Collection and Disposal Service. 2016. Available online: https://www.tco.re/wp-content/uploads/2017/07/sped_2016.pdf (accessed on 1 December 2022).
- INSEE. INSEE Household Income and Poverty in 2015 2019. INSEE-DGFIP-Cnaf-Cnav-CCMSA, Fichier Localisé Social et Fiscal; INSEE: Paris, France, 2019.
- INSEE. INSEE Household Disposable Income Distribution Indicators 2018. INSEE-DGFIP-Cnaf-Cnav-CCMSA, Fichier Localisé Social et Fiscal; INSEE: Paris, France, 2019.
- INSEE. INSEE Household Automobile Equipment in 2015–2018; INSEE: Paris, France, 2017.
- INSEE. Census of the Legal Population 2015 by Commune in Reunion 2017; Insee Flash Reunion No. 116; INSEE: Paris, France, 2017.
- INSEE. Permanent Equipment Base 2015 2016. Enumeration of facilities in 2015 (commerce, services, health, etc.)Permanent database of facilities (BPE); INSEE: Paris, France, 2016.
- Merceron, S. Reunion’s Population by 2050: As Many Seniors as Young People; Insee Analyses Réunion No. 29; INSEE: Paris, France, 2017.
- Cohen, B. Modelling Approaches for Greenhouse Gas Emissions Projections from the Waste Sector. Sustain. Prod. Consum. 2017, 10, 15–20. [Google Scholar] [CrossRef]
- Mukherjee, S.; Osuna, E.; Girosi, F. Nonlinear Prediction of Chaotic Time Series Using Support Vector Machines. In Proceedings of the Neural Networks for Signal Processing VII, Amelia Island, FL, USA, 24–26 September 1997; pp. 511–520. [Google Scholar]
- Sokka, L.; Antikainen, R.; Kauppi, P.E. Municipal Solid Waste Production and Composition in Finland—Changes in the Period 1960–2002 and Prospects until 2020. Resour. Conserv. Recycl. 2007, 50, 475–488. [Google Scholar] [CrossRef]
- Duan, N.; Li, D.; Wang, P.; Ma, W.; Wenga, T.; Zhong, L.; Chen, G. Comparative Study of Municipal Solid Waste Disposal in Three Chinese Representative Cities. J. Clean. Prod. 2020, 254, 120134. [Google Scholar] [CrossRef]
- Husson, F.; Josse, J.; Pages, J. Principal Component Methods—Hierarchical Clustering—Partitional Clustering: Why Would We Need to Choose for Visualizing Data? Appl. Math. Dep. 2010, 17, 1–17. [Google Scholar]
- Ogwueleka, T.C. Survey of Household Waste Composition and Quantities in Abuja, Nigeria. Resour. Conserv. Recycl. 2013, 77, 52–60. [Google Scholar] [CrossRef]
- Qu, X.; Li, Z.; Xie, X.; Sui, Y.; Yang, L.; Chen, Y. Survey of Composition and Generation Rate of Household Wastes in Beijing, China. Waste Manag. 2009, 29, 2618–2624. [Google Scholar] [CrossRef]
- Araiza-Aguilar, J.A.; Rojas-Valencia, M.N.; Aguilar-Vera, R.A. Forecast Generation Model of Municipal Solid Waste Using Multiple Linear Regression. Glob. J. Environ. Sci. Manag. 2020, 6, 1–14. [Google Scholar] [CrossRef]
- Ghinea, C.; Drăgoi, E.N.; Comăniţă, E.-D.; Gavrilescu, M.; Câmpean, T.; Curteanu, S.; Gavrilescu, M. Forecasting Municipal Solid Waste Generation Using Prognostic Tools and Regression Analysis. J. Environ. Manag. 2016, 182, 80–93. [Google Scholar] [CrossRef] [PubMed]
- Kolekar, K.; Hazra, T.; Chakrabarty, S. A Review on Prediction of Municipal Solid Waste Generation Models. Procedia Environ. Sci. 2016, 35, 238–244. [Google Scholar] [CrossRef]
- Alzamora, B.R.; Barros, R.T.D.V.; de Oliveira, L.K.; Gonçalves, S.S. Forecasting and the Influence of Socioeconomic Factors on Municipal Solid Waste Generation: A Literature Review. Environ. Dev. 2022, 44, 100734. [Google Scholar] [CrossRef]
- Bénard-Sora, F.; Praene, J.P. Territorial Analysis of Energy Consumption of a Small Remote Island: Proposal for Classification and Highlighting Consumption Profiles. Renew. Sustain. Energy Rev. 2016, 59, 636–648. [Google Scholar] [CrossRef] [Green Version]
- Oribe-Garcia, I.; Kamara-Esteban, O.; Martin, C.; Macarulla-Arenaza, A.M.; Alonso-Vicario, A. Identification of Influencing Municipal Characteristics Regarding Household Waste Generation and Their Forecasting Ability in Biscay. Waste Manag. 2015, 39, 26–34. [Google Scholar] [CrossRef]
Figure 1.
Reunion Island, the case study.

Figure 2.
Distribution of the municipal solid waste in Reunion in 2019.

Figure 3.
Evolution in the amount of municipal solid waste in Reunion, from 2005 to 2019.

Figure 4.
Residual household waste production and municipal demography of Reunion.

Figure 5.
Linear regression model—population/waste generation.

Figure 6.
Clustering, according to the linear regression model R1.

Figure 7.
Decomposition of the total inertia on the components of the ACP.

Figure 8.
Graph of the variables.

Figure 9.
Graph of the individuals.

Figure 10.
Linear regression model R2—population/waste generation.

Figure 11.
Projection of residual household waste production to 2030.

Figure 12.
Projection of residual household waste production to 2030.


Table 1.
Table of the principal component analysis variables.
| Acronym | Name | Unit |
|---|---|---|
| PRW | Production of residual household waste | ton |
| PDS | Permanent database of facilities-shops | - |
| CAR | Share of households with a car | % |
| LF | Labor force participation rate of 15 to 64 year olds | % |
| PR | Poverty rate | % |
| SSB | Share of total social benefits | % |
| DI | Disposable income | € |
Table 2.
Forecast errors of the residual household waste generation on the R1 model.
| Data | Variance Indicators | |||||||
|---|---|---|---|---|---|---|---|---|
| Class | Label | Municipalities | Observed Production RHW | Estimated Production RHW | R2 | MAD | RMSE | MAPE |
| Strong | SDE | Saint-Denis | 42,799 | 40,844 | ||||
| Strong | SPA | Saint-Paul | 24,380 | 29,334 | ||||
| Strong | SPI | Saint-Pierre | 25,684 | 23,080 | ||||
| Strong | TAM | Le Tampon | 18,680 | 20,951 | ||||
| Average | SAN | Saint-Andre | 16,758 | 15,112 | ||||
| Average | SLO | Saint-Louis | 16,741 | 14,556 | ||||
| Average | SBE | Saint-Benoit | 11,291 | 10,205 | ||||
| Average | SJO | Saint-Joseph | 8864 | 10,169 | ||||
| Average | POR | Le Port | 10,380 | 9482 | ||||
| Weak | SAL | Salazie | 1483 | 1923 | ||||
| Weak | SRO | Sainte-Rose | 1824 | 1716 | ||||
| Weak | CIL | Cilaos | 1698 | 1386 | ||||
| Weak | SPH | Saint-Philippe | 1414 | 1315 | ||||
| Average | SLE | Saint-Leu | 7539 | 9090 | ||||
| Average | SMA | Sainte-Marie | 9621 | 8871 | ||||
| Average | POS | La Possession | 7810 | 8795 | ||||
| Average | SSU | Sainte-Suzanne | 6707 | 6133 | ||||
| Average | ETS | L’Etang-Sale | 4123 | 3792 | ||||
| Average | BPA | Bras-Panon | 3549 | 3352 | ||||
| Average | PIL | Petite-Ile | 3730 | 3182 | ||||
| Average | AVI | Les Avirons | 2585 | 2942 | ||||
| Weak | TBA | Les Trois-Bassins | 1607 | 1852 | ||||
| Weak | END | Entre-Deux | 1604 | 1754 | ||||
| Weak | PLP | La Plaine-des-Palmistes | 1546 | 1596 | ||||
| Total | 232,418 | 231,432 | 0.985 | 1066 | 1537 | 11.81% | ||
Table 3.
Forecast errors of the residual household waste generation on the R2 model.
| Data | Variance Indicators | |||||||
|---|---|---|---|---|---|---|---|---|
| Class | Labels | Municipalities | Observed RHW Production | Estimated RHW Production | R2 | MAD | RMSE | MAPE |
| Strong | SDE | Saint-Denis | 42,799 | 42,114 | 0.905 | 1952 | 2221 | 7.92 |
| Strong | SPA | Saint-Paul | 24,380 | 26,782 | ||||
| Strong | SPI | Saint-Pierre | 25,684 | 22,240 | ||||
| Strong | TAM | Le Tampon | 18,680 | 19,958 | ||||
| Average | SAN | Saint-Andre | 16,758 | 16,164 | 0.987 | 339 | 410 | 8.56 |
| Average | SLO | Saint-Louis | 16,741 | 16,673 | ||||
| Average | SBE | Saint-Benoit | 11,291 | 10,841 | ||||
| Average | SJO | Saint-Joseph | 8864 | 9581 | ||||
| Average | POR | Le Port | 10,380 | 10,061 | ||||
| Average | SAL | Salazie | 1483 | 1985 | ||||
| Average | SRO | Sainte-Rose | 1824 | 1767 | ||||
| Average | CIL | Cilaos | 1698 | 1421 | ||||
| Average | SPH | Saint-Philippe | 1414 | 1348 | ||||
| Weak | SLE | Saint-Leu | 7539 | 8988 | ||||
| Weak | SMA | Sainte-Marie | 9621 | 8768 | ||||
| Weak | POS | La Possession | 7810 | 8692 | ||||
| Weak | SSU | Sainte-Suzanne | 6707 | 6038 | ||||
| Weak | ETS | L’Etang-Sale | 4123 | 3714 | 0.970 | 522 | 661 | 10.28 |
| Weak | BPA | Bras-Panon | 3549 | 3278 | ||||
| Weak | PIL | Petite-Ile | 3730 | 3110 | ||||
| Weak | AVI | Les Avirons | 2585 | 2873 | ||||
| Weak | TBA | Les Trois-Bassins | 1607 | 1800 | ||||
| Weak | END | Entre-Deux | 1604 | 1704 | ||||
| Weak | PLP | La Plaine-des-Palmistes | 1546 | 1549 | ||||
| Total | 232,418 | 231,449 | ||||||
Disclaimer/Publisher’s Note: The statements, opinions and data contained in all publications are solely those of the individual author(s) and contributor(s) and not of MDPI and/or the editor(s). MDPI and/or the editor(s) disclaim responsibility for any injury to people or property resulting from any ideas, methods, instructions or products referred to in the content. |
© 2022 by the authors. Licensee MDPI, Basel, Switzerland. This article is an open access article distributed under the terms and conditions of the Creative Commons Attribution (CC BY) license (https://creativecommons.org/licenses/by/4.0/).
Share and Cite
MDPI and ACS Style
Fontaine, L.; Morau, D.; Praene, J.-P. Analysis and Estimation of Short Term Residual Household Waste Production: Case Study Reunion Island. Sustainability 2023, 15, 348. https://0-doi-org.brum.beds.ac.uk/10.3390/su15010348
AMA Style
Fontaine L, Morau D, Praene J-P. Analysis and Estimation of Short Term Residual Household Waste Production: Case Study Reunion Island. Sustainability. 2023; 15(1):348. https://0-doi-org.brum.beds.ac.uk/10.3390/su15010348
Chicago/Turabian StyleFontaine, Ludovic, Dominique Morau, and Jean-Philippe Praene. 2023. "Analysis and Estimation of Short Term Residual Household Waste Production: Case Study Reunion Island" Sustainability 15, no. 1: 348. https://0-doi-org.brum.beds.ac.uk/10.3390/su15010348
Note that from the first issue of 2016, this journal uses article numbers instead of page numbers. See further details here.