Article

Growth Performance, Gut Health, Welfare and Qualitative Behavior Characteristics of Broilers Fed Diets Supplemented with Dried Common (Olea europaea) Olive Pulp

by
Anna Dedousi
1,*,
Charalampos Kotzamanidis
1,
Maria-Zoi Kritsa
1,
Antiopi Tsoureki
2,
Aggeliki Andreadelli
2,
Sotiris I. Patsios
3 and
Evangelia Sossidou
1
1
Veterinary Research Institute, Hellenic Agricultural Organization DIMITRA, 57001 Thessaloniki, Greece
2
Institute of Applied Biosciences, Centre for Research and Technology Hellas, 6th km Charilaou-Thermi Road, Thermi, 57001 Thessaloniki, Greece
3
Laboratory of Natural Resources and Renewable Energies, Chemical Process & Energy Resources Institute (CPERI), Centre for Research and Technology-Hellas (CERTH), Thermi, 57001 Thessaloniki, Greece
*
Author to whom correspondence should be addressed.
Sustainability 2023, 15(1), 501; https://0-doi-org.brum.beds.ac.uk/10.3390/su15010501
Submission received: 6 December 2022 / Revised: 22 December 2022 / Accepted: 24 December 2022 / Published: 28 December 2022
(This article belongs to the Special Issue Recent Advances in Poultry Management)

Abstract

:
The present study investigated the dietary impact of dried olive pulp (OP) on growth performance, gut health and some welfare and behavior characteristics of broilers. It was conducted in a commercial poultry farm using 108 13 day-old Ross male broilers. Chickens were equally and randomly assigned to 3 dietary treatments, CON, OP3 and OP6, based on the incorporation rate of OP in the ration (0%, 3%, and 6%, respectively). A beneficial impact on foot pad dermatitis (FPD) and feather cleanliness of OP-fed broilers was recorded. No adverse effects on qualitative behavior characteristics evaluated and on the overall growth performance of chickens were observed. No significant differences in the fecal microbiota population were observed among the groups. Changes of β-diversity in an age-dependent way were only observed. The feces of chickens across all age and dietary groups were mainly dominated by the phylum Firmicutes (62.3 to 95.1%), mainly represented by the genus Lactobacillus (32.9 to 78.2%), Proteobacteria (2.0 to 35.6%), and Actinobacteria (1.5 to 11.4%). Supplementing broilers’ diets with 3% and 6% OP beneficially affected chickens’ health and welfare without compromising their growth performance and gut health.

1. Introduction

Poultry gut health has wide implications for birds’ systemic health, animal welfare, production efficiency, food safety, and environmental impact [1]. Factors affecting intestinal health are diet, microbiota and environment. [2]. The gut microbiota is a very important organ because it modulates several physiological functions such as nutrition, metabolism, and immunity, thus, maintaining the health of the host. It also affects host behavior and physiology [3,4]. Moreover, modulating microbiota composition, through, for instance, anti- or probiotic treatment, influences anxiety, stress and activity [5,6], as well as the serotonergic and immune systems in rodents [7,8]. Similarly, in poultry, changes in microbiota composition influence fearfulness, memory, as well as serotonergic and immune systems [9,10,11]. Later studies in laying hens have shown that microbiota transplantation at earlylife affects behavioral responses, serotonin and immune characteristics in chicken lines divergently chosen on feather pecking [12]. Microbiota is defined by host genes and the environment, with nutrition being one of the most significant factors. Alterations in the dietary composition may, thus, cause changes in microbiota [13].
Using antibiotics as growth promoters in farm animals has been totally forbidden by the European Union (EU) since 2006 (EC Regulation No. 1831/2003) [14] due to their possible negative effects on animal health and food safety [15,16]. In a global effort to minimize the use of drugs in poultry and livestock production, phytogenic feed additives abundant in bioactive compounds with anti-microbial, antioxidant and anti-inflammatory properties seem promising alternatives to antibiotics [17,18]. They have positive effects on farm animals since they improve growth parameters by ameliorating diet properties, promoting animals’ production performance, and improving food quality [17]. Additionally, plant-derived feed supplements have been recently obtaining interest as a way of maintaining gut health in poultry [19,20]. One such feed additive of plant origin is olive pulp (OP), which is a by-product of the olive oil extraction process. As it is well known, the olive oil industry produces large quantities of by-products that are harmful to the environment, which in recent years have been attempted to be further exploited within the principles of the circular economy [21]. Towards this direction, supplementing animals’ diets with olive by-products contributes to the recycling of these wastes, helping the transition to an effective circular waste-based economy [22]. Other advantages of this strategy are the lower dependence of animal production on human-consumed seeds and the decreased waste management costs [22]. Since feed represents 70% of total production costs in poultry farming, new sources of raw materials from agricultural and industrial by-products have been evaluated as feedstuff in order to decrease those costs [18,23].
OP is the remainder after the olive cake is dried. It is rich in essential fatty acids (73% oleic acid, 13% palmitic acid and 7% linoleic acid) and has elevated residual oil [24]. Moreover, it has oleuropeoside advantageous compounds such as oleuropein and phenolics like tyrosol [25]. Previous reports demonstrate that dietary polyphenols are potent antioxidants that can be utilized in poultry for improving health, growth performance and animal product quality. [26]. Thus, OP can supply animals with energy and, specifically, polyunsaturated fatty acids providing them also with various biologically active ingredients with antioxidants, antifungals, and antibacterial and anti-tumoral properties [27,28,29,30,31,32]. Furthermore, it is regarded as a good source of protein, calcium, copper and cobalt [33]. Its high nutritive value and chemical composition make OP an attractive and low-cost nutrient for farm animals [34,35].
OP has been formerly used at various incorporation rates (2–20%) in broilers’ diets in numerous studies with promising though not always consistent findings regarding birds’ performances [25,36,37,38,39,40,41,42,43,44,45]. In general, doses up to 10% do not seem to adversely affect broiler growth [25,38,39,40,43], meat quality [41,45] and health parameters [40,42,44]. On the other hand, higher dietary levels of OP have been shown to impair body weight gain, feed conversion ratio and food consumption of broilers [36,43,46]. It has been previously documented that broiler chickens fed dried OP-supplemented diets utilize OP more efficiently when its inclusion rate is increased gradually with birds’ age [41].
Current literature indicates that there is a lack of research evidence regarding the optimal inclusion rate of OP in chickens’ diets as well as its dietary impact on birds’ welfare and behavior. Moreover, the dietary effect of OP on broilers’ gut microbiota has been investigated in a limited number of studies [40,47]. On the other hand, feeding broilers with 1500 ppm of a bioactive olive pomace extract from common olive (Olea europaea) decreased some of the negative effects that a short-term fasting period caused in birds’ intestines [19]. Furthermore, in vitro studies have demonstrated the anticoccidial activity of OP extract against Eimeria oocysts in broiler chickens [48]. Taking into consideration all the above, the aim of this investigation was to assess the dietary effect of dried OP on broilers’ growth performance and gut microbiota, as well as on some welfare and qualitative behavior characteristics of birds. An additional objective of this study was to determine the optimal inclusion rate of OP in chickens’ diets.

2. Materials and Methods

2.1. Animals, Diets and Experimental Design

This trial was conducted in a Greek commercial poultry farm, and the duration of the experiment was 29 days. In total, 108 Ross male broilers, 13-day-olds, with an initial body weight (BW) of 428.01 ± 2.69 g were used in the study. Chickens were randomly accommodated in 9 consecutive floor pens of 1 m2 (12 birds/pen) in an environmentally controlled poultry house. Each pen was covered with rice husk and it was provided with nipple drinkers and a bell feeder. During the experiment, broilers were allowed free access to fresh water and feed was offered ad libitum in mash form. The stoking density in each floorpen (33 kg/m2) met the requirements of EU Directive 2007/43/EC [49]. The lighting, temperature, and relative humidity were controlled according to the Ross 308 management guidelines [50].
Broilers were equally and randomly assigned in 3 dietary treatments identified CON, OP3, and OP6, based on the inclusion rate of OP in their ration (0%, 3% and 6% respectively) with 36 chickens/group, 3 replicates-floor pens/group. A three-phase feeding program was applied in each dietary treatment, consisting of a grower diet fed from 13 to 20 days of age, a finisher 1 and a finisher 2 diet fed from 21 to 32 days of age and from 33 to 41 days of age, respectively. In total 9 diets were formulated (Table 1). In OP-diets, dried OP substituted mainly wheat and a small quantity of sunflower oil of the CON-diet in order to formulate all ratios at an isonitrogenous and isocaloric basis. The dried OP used in the investigation was a commercial animal feed supplement in the form of flour (Sparta INNOLIVE®, Sparta Life S.A., Sparta, Greece), and its’ nutrient and fatty acid composition are described in detail by [51].

2.2. Production Traits and Fecal Sampling

Broilers’ body weight (BW) was determined at the onset of the experiment (13 days of age) and at 20, 27, 34 and 41 days of age. Body weight gain (BWG) and feed consumption (FC) per bird were calculated on weekly intervals as well as for the whole experimental period (13–41 days of age). Based on FC and BWG, the feed conversion ratio (FCR) per bird was calculated both at weekly intervals and during the entire experiment. The mortality rate was recorded daily.

2.3. Welfare and Behavior Indicators

At the age of 34 and 41 days, the chickens of each treatment group were individually evaluated for feather cleanliness, foot pad dermatitis (FPD), and hock burn, as well as for quality behavior traits, according to the Welfare Quality (2009) protocol [52]. First, observations of the quality behavior characteristics (active, fearful, depressed, calm, bored, friendly and feeding behavior) were undertaken in order to avoid confounding data due to handling stress. For the quality behavior traits, individual visual observations were performed (no recording) with a duration of 2 min for each pen. In each group, the number of birds expressing a specific type of behavior was noted, and then it was divided by the total number of live birds in this group and multiplied by 100. All observations were performed at the same time, 9 o’clock in the morning, by the same assessor at each evaluation period (34 and 41 days of age).
Then, each bird was gently held by one person, and its breast was examined for the feather cleanliness assessment by scoring on a 3-point scale: Score 0—completely clean feathers; Score 1—slight feather soiling; Score 2—moderate feather soiling; and Score 3—severe feather soiling. The percentage of chicks presenting each score was then calculated. Both feet of birds were examined for the presence of foot pad dermatitis (swelling-bubble foot) or hock burn, and scores were assessed according to the following: (a) FPD: 0—no evidence of FPD; Score 1 & 2—minimal evidence of FPD, Score 3 & 4—evidence of FPD. (b) Hock burn 0—no evidence of hock burn; Score 1 & 2—minimal evidence of hock burn. Score 3 & 4—evidence of hock burn. The percentage of birds with each scoring category was then estimated.

2.4. Microbiota Analysis

2.4.1. Sample Collection and Processing

At the onset of the experiment (13 days of age), two samples of fresh feces (approximately 1 g each) were randomly collected from 2-floor pens (1 sample per floor pen) for microbiota analysis. At the middle (27 days of age) and at the end of the trial (41 days of age), 9 samples of fresh feces in each time point (1 sample/pen-floor) were collected for microbiota analysis. At each time point, approximately 1 g of fresh feces/pen–on the floor was aseptically gathered by the plastic glove of one use from 5 different points of each pen (4 corners and the center) and was put in sterile plastic tubes. Upon collection, the samples were kept frozen at −20 °C preceding DNA extraction. Total genomic DNA was isolated using the Quick-DNA fecal/soil Microbe Microprep Isolation Kit (Irvine, CA, USA) following the manufacturer’s protocol. Afterward, genomic DNA was stored at −20 °C until further analysis.

2.4.2. 16S rRNA Library Construction and Sequencing

DNA concentration of samples was measured using a Qubit 4.0 Fluorometer with the Qubit® dsDNA BR assay kit (Invitrogen, Carlsbad, CA, USA). Bacterial community composition was assessed through sequencing of the V3–V4 hypervariable regions of the prokaryotic 16S ribosomal RNA gene (16S rRNA). Library construction was performed following Illumina’s 16S Metagenomic Sequencing Library Preparation (15044223 B) protocol, using 2× KAPA HiFi HotStart ReadyMix Reagent (KAPA BIOSYSTEMS, Woburn, MA, USA). Gene-specific primers described in Klindworth et al. [53] were used for amplification of the V3–V4 hypervariable regions after addition at the 5′ end of an Illumina (Illumina Inc., San Diego, CA, USA) overhang adapter nucleotide sequence. The sequences of the primers used are presented in Table S1. PCR amplicon and library purification from primer-dimer species and unincorporated primers was performed using Agencourt AMPure XP magnetic beads (Beckman Coulter-Life Sciences, Indianapolis, IN, USA). Library quantification was conducted through fluorometric quantification with the Qubit® dsDNA BR assay kit, and size evaluation was performed on a Fragment Analyzer system (Agilent Technologies Inc., Santa Clara, CA, USA) with a DNF-915 dsDNA Reagent kit. The libraries’ molarity was assessed by a qPCR performed on a RotorGene Q thermocycler (Qiagen, Hilden, Germany) using the KAPA Library Quantification kit for Illumina sequencing platforms (KAPA BIOSYSTEMS, Woburn, MA, USA). Sequencing was performed on a MiSeq platform using the MiSeq® reagent kit v3 (2 × 300 cycles) (Illumina, San Diego, CA, USA).

2.5. Statistical Analysis

The statistical analysis of the data was performed using Jeffreys’s Amazing Statistics Program JASP (v 0.14; JASP Team, 2020) software [54]. The significance of the differences in the percentages of feather cleanliness, foot pad dermatitis (FPD), hock burn and qualitative behavior traits among dietary treatments was assessed by the Chi-square test. For the analysis of broilers’ growth performance: BW, BWG, FC and FCR, the normality of the data was tested employing the Shapiro-Wilk test; Homogeneity of variance was evaluated with Levene’s test. One-way ANOVA was used to compare the average values of the parameters evaluated among groups. Post hoc analysis was performed using Tukey’s test. When the distribution was not normal, the non-parametric tests Kruskal-Wallis and Mann-Whitney were used to make the comparisons. All comparisons were made at a significance level of p ≤ 0.05.

Bioinformatic Analysis

Bacterial community analysis was performed using Quantitative Insights Into Microbial Ecology2 (Qiime2) (version 2020.8) [55]. Raw reads were imported into QIIME2 and were trimmed for adapters using the cutadapt plug-in [56]. Paired-end trimmed reads were joined using the VSEARCH plug-in [57], and quality filtering was performed with a minimum quality score of 28. Reads passing filters were dereplicated and clustered into Operational Taxonomic Units (OTUs) with 99% sequence similarity using the VSEARCH tool [57] and the open-reference method. Subsequently, chimera filtering was conducted with the VSEARCH plug-in [57], and sequence taxonomy was assigned by aligning the sequences against the SILVA 132 reference database [58] at 99% sequence identity using the BLAST plug-in [59]. Archaeal, mitochondrial, chloroplastic and unassigned sequences were removed from the data.
The resulting OTU table and biom file were imported in R (version 4.0.3) [60] for further processing. OTU counts and taxonomic assignment were merged into a phyloseq and an ampvis2 object and analyzed using the phyloseq [61] and amvis2 [62] R packages, respectively. Results visualization was performed by combining functions provided by the ggplot2 R package [63]. All bar plots were normalized to 100% as abundance estimations within each sample, so percentages do not reflect the true biomass fraction of each sample.
The α-diversity was calculated with the phyloseq package using the Observed, Chao1, and ACE (abundance-based coverage estimator) indices for richness estimation as well as the Shannon, Simpson, Inverse Simpson, and Fisher indices for evenness estimation. Kruskal-Wallis non-parametric test was used to determine significant differences in the α-diversity and the relative abundance across treatments.
To assess the similarity of microbiome structure in samples, the β-diversity was calculated using the Bray-Curtis index. Principal coordinate analysis (PCoA) based on the Bray-Curtis distance matrix was performed; results visualization was performed by combining functions provided by the ggplot2 and MicrobiotaProcess R packages [64]. ANOSIM was performed using the vegan package [65].
For investigating the differences in taxonomic abundances at phylum, family, genus, and species level between CON and dietary treatment groups and between the different dietary treatments, differential abundance analysis was conducted with the DESeq2 (v) R package [66]. Prior to the analysis, OTUs were agglomerated at the species level. The Wald significance test was used for p-value calculation. Log2(fold-change) values were shrunk with the ‘apeglm’ method [67]. The thresholds used for defining differentially abundant taxa were p value < 0.01 and |log2(fold-change)| > 0.5.

2.6. Availability of Data and Materials

Raw fastq files are available through the NCBI Sequence Read Archive under the BioProject ID PRJNA885374.

3. Results

3.1. Growth Performance

The incorporation of OP in broilers’ diet had a significant impact (p < 0.05) on their BW, BWG, FC and FCR (Table 2). However, at 41 days of age, birds of all groups presented similar BW (p > 0.05), while BWG, FC and FCR for the whole experimental period were not significantly different among dietary treatments (p > 0.05), as indicated in Table 2. OP-fed broilers presented significantly lower BW at 20 days of age compared to controls (p < 0.05). At 27 days of age, control birds and those that received 6% OP with their diet had significantly higher BW compared to OP3 chicks (p < 0.05). A similar pattern regarding BW was recorded at day 34 of age; however, the observed differences were significant only between CON and OP3 groups (p < 0.05). During the grower phase (13–20 days of age), CON chicks presented significantly higher BWG compared to OP birds (p < 0.05), whereas FC and FCR did not differ significantly among groups (p > 0.05). From 21 to 27 days of age, similar BWG and FCR were recorded among dietary treatments (p > 0.05), while CON birds presented significantly lower FC compared to OP chicks (p < 0.05). From 28 to 34 days of age, FCR was higher for OP broilers compared to controls, with significant differences being observed between CON and OP6 groups (p < 0.05). At this period, BWG and FC were not significantly different among groups. From 35 to 41 days of age, broilers from all groups presented similar BWG (p > 0.05). However, OP birds consumed significantly less feed compared to controls (p < 0.05). The observed differences in FC during this period resulted in significant differences in the FCR among all dietary treatments (p < 0.05). In particular, the best FCR was recorded in the OP3 group, followed by OP6 and CON groups (p < 0.05). During the feeding trial, no deaths were observed among dietary treatments.

3.2. Welfare and Behavior Indicators

Data in Table 3 display the dietary influence of OP on broilers’ feather cleanliness as evaluated at the age of 34 and 41 days of their life. At 34 days of age, the percentage of CON chickens with moderate feather soiling (score 2) was significantly higher compared to OP birds (p < 0.05). At 41 days of age, the highest percentage of broilers with completely clean feathers (score 0) was recorded in the OP group and the lowest one in the CON group (p < 0.05). Moreover, at this time point, a lower percentage of chickens with moderate feather soiling (score 2) was found in OP groups compared to controls, and the observed differences were found significant between CON and OP6 groups (p < 0.05).
A significantly higher percentage of broilers with no evidence of FPD (score 0) was observed in OP-fed broilers compared to controls (p < 0.05) on both days 34 and 41 of their age (Table 3). Similar results were found for the percentages of broilers evaluated with scores 1 and 2 (indicating minimal evidence of FPD), with the observed differences among groups presented in detail in Table 3. Finally, at day 41 of age, the percentage of CON chickens that were evaluated with a score of 3 for FPD was higher than that recorded in OP birds, with significant differences being noticed between CON and OP3 groups (p < 0.05).
In the present study, the broilers of all experimental groups were evaluated with very good scores for hock burn, indicating no evidence of such welfare issue (Table 3). In addition, the incorporation of OP in broilers’ diet had no significant effect (p > 0.05) on hock burn (Table 3) or the qualitative behavior characteristics evaluated (Table 4).

3.3. Dietary Effects of OP on Fecal Microbiome

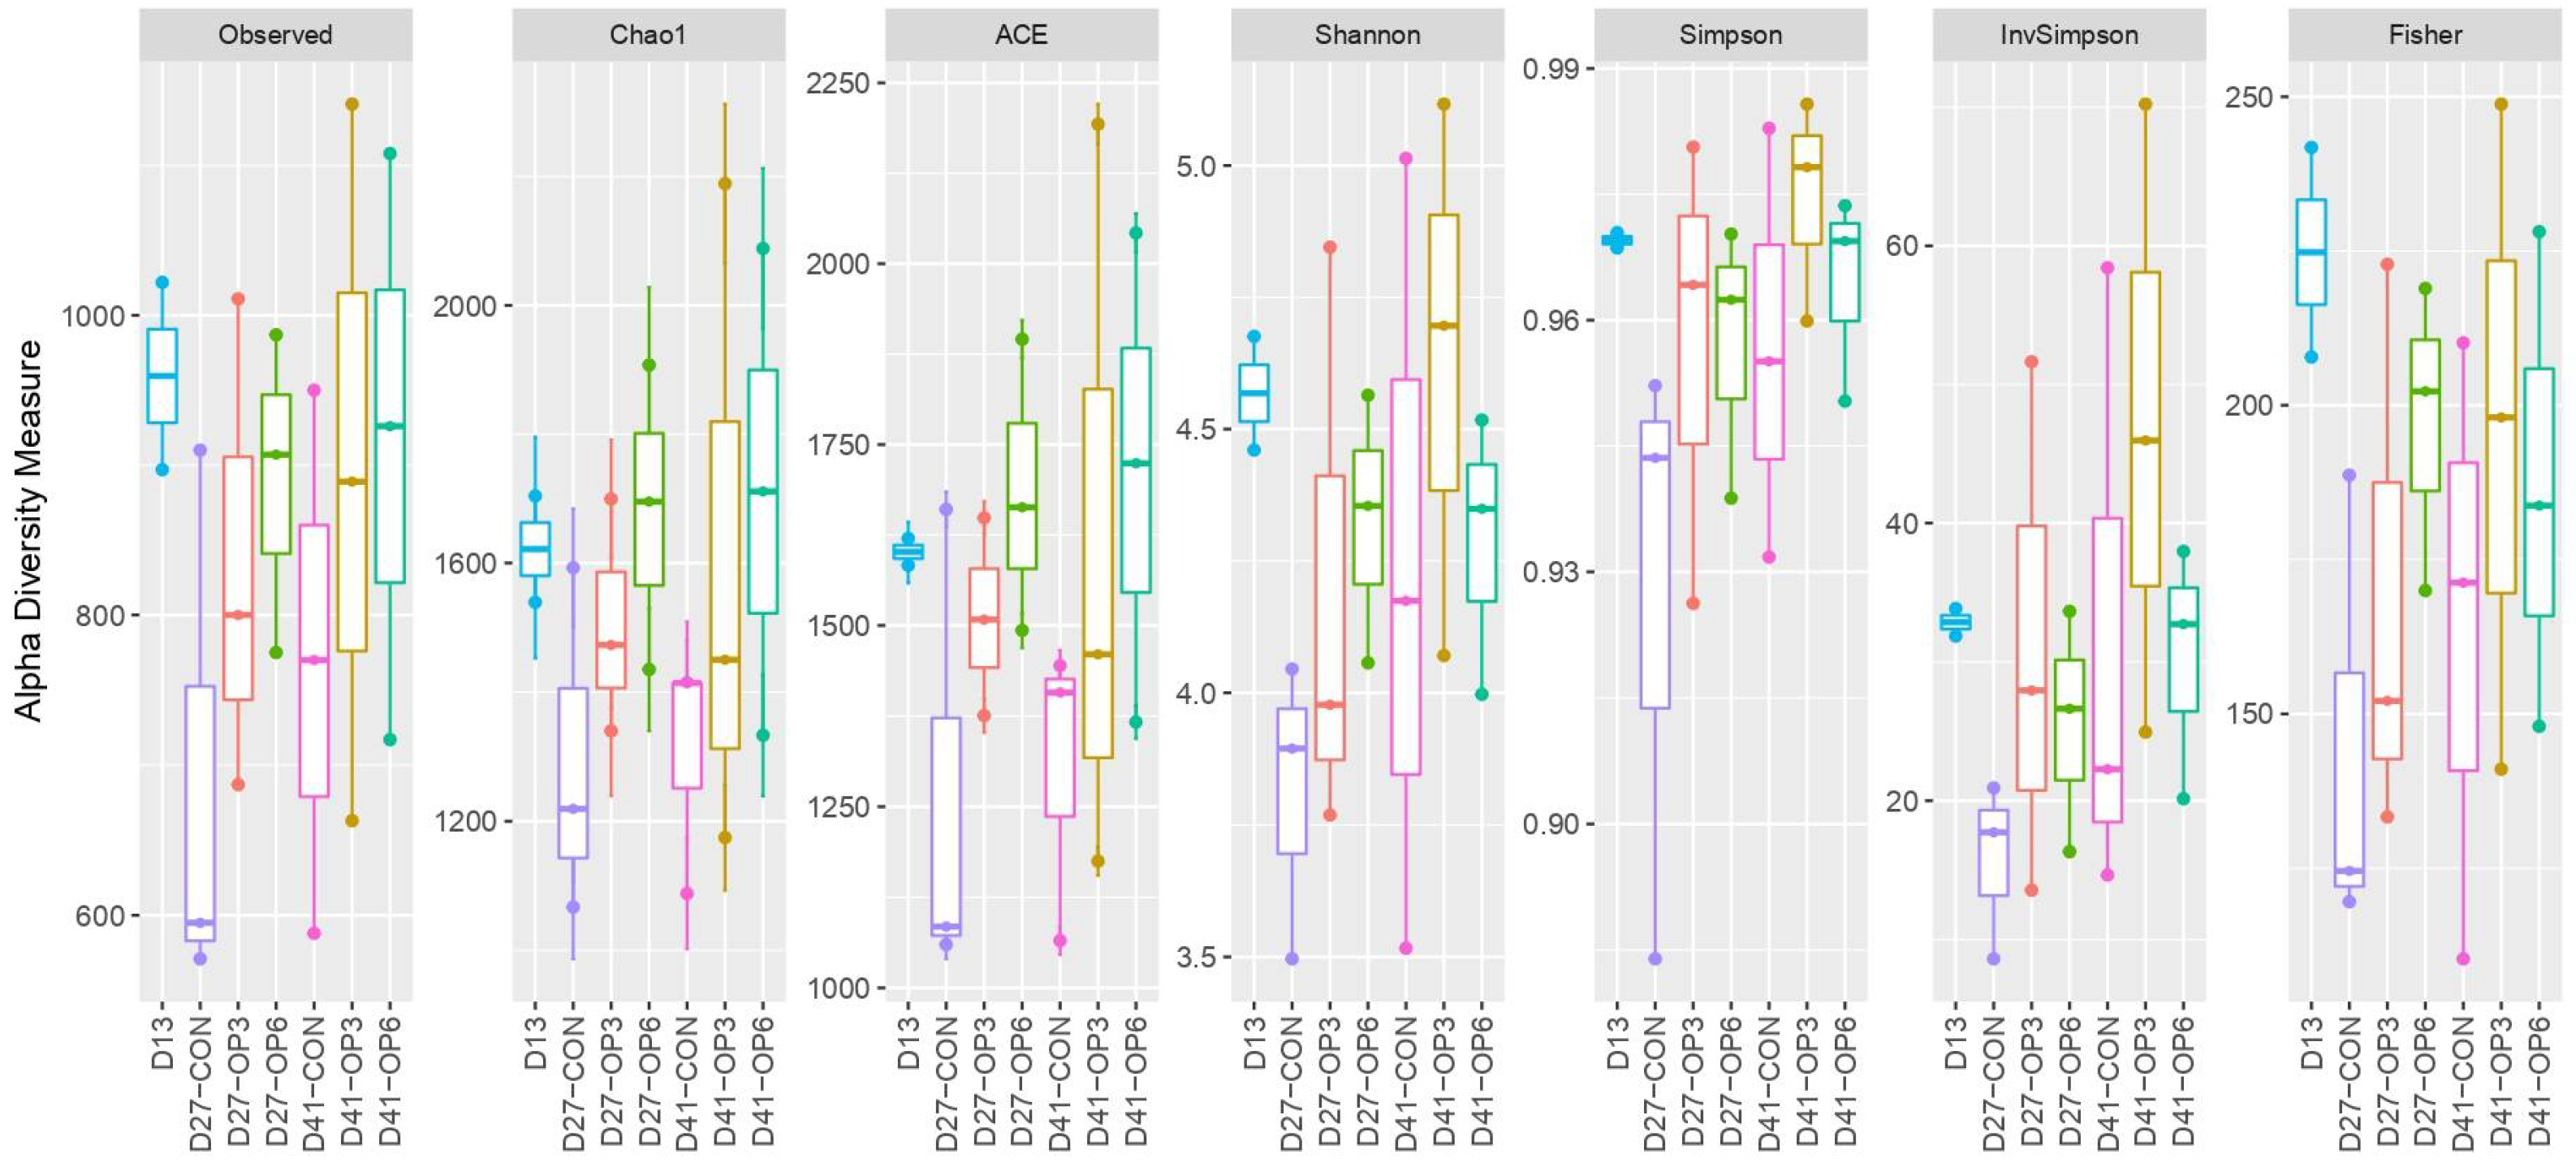
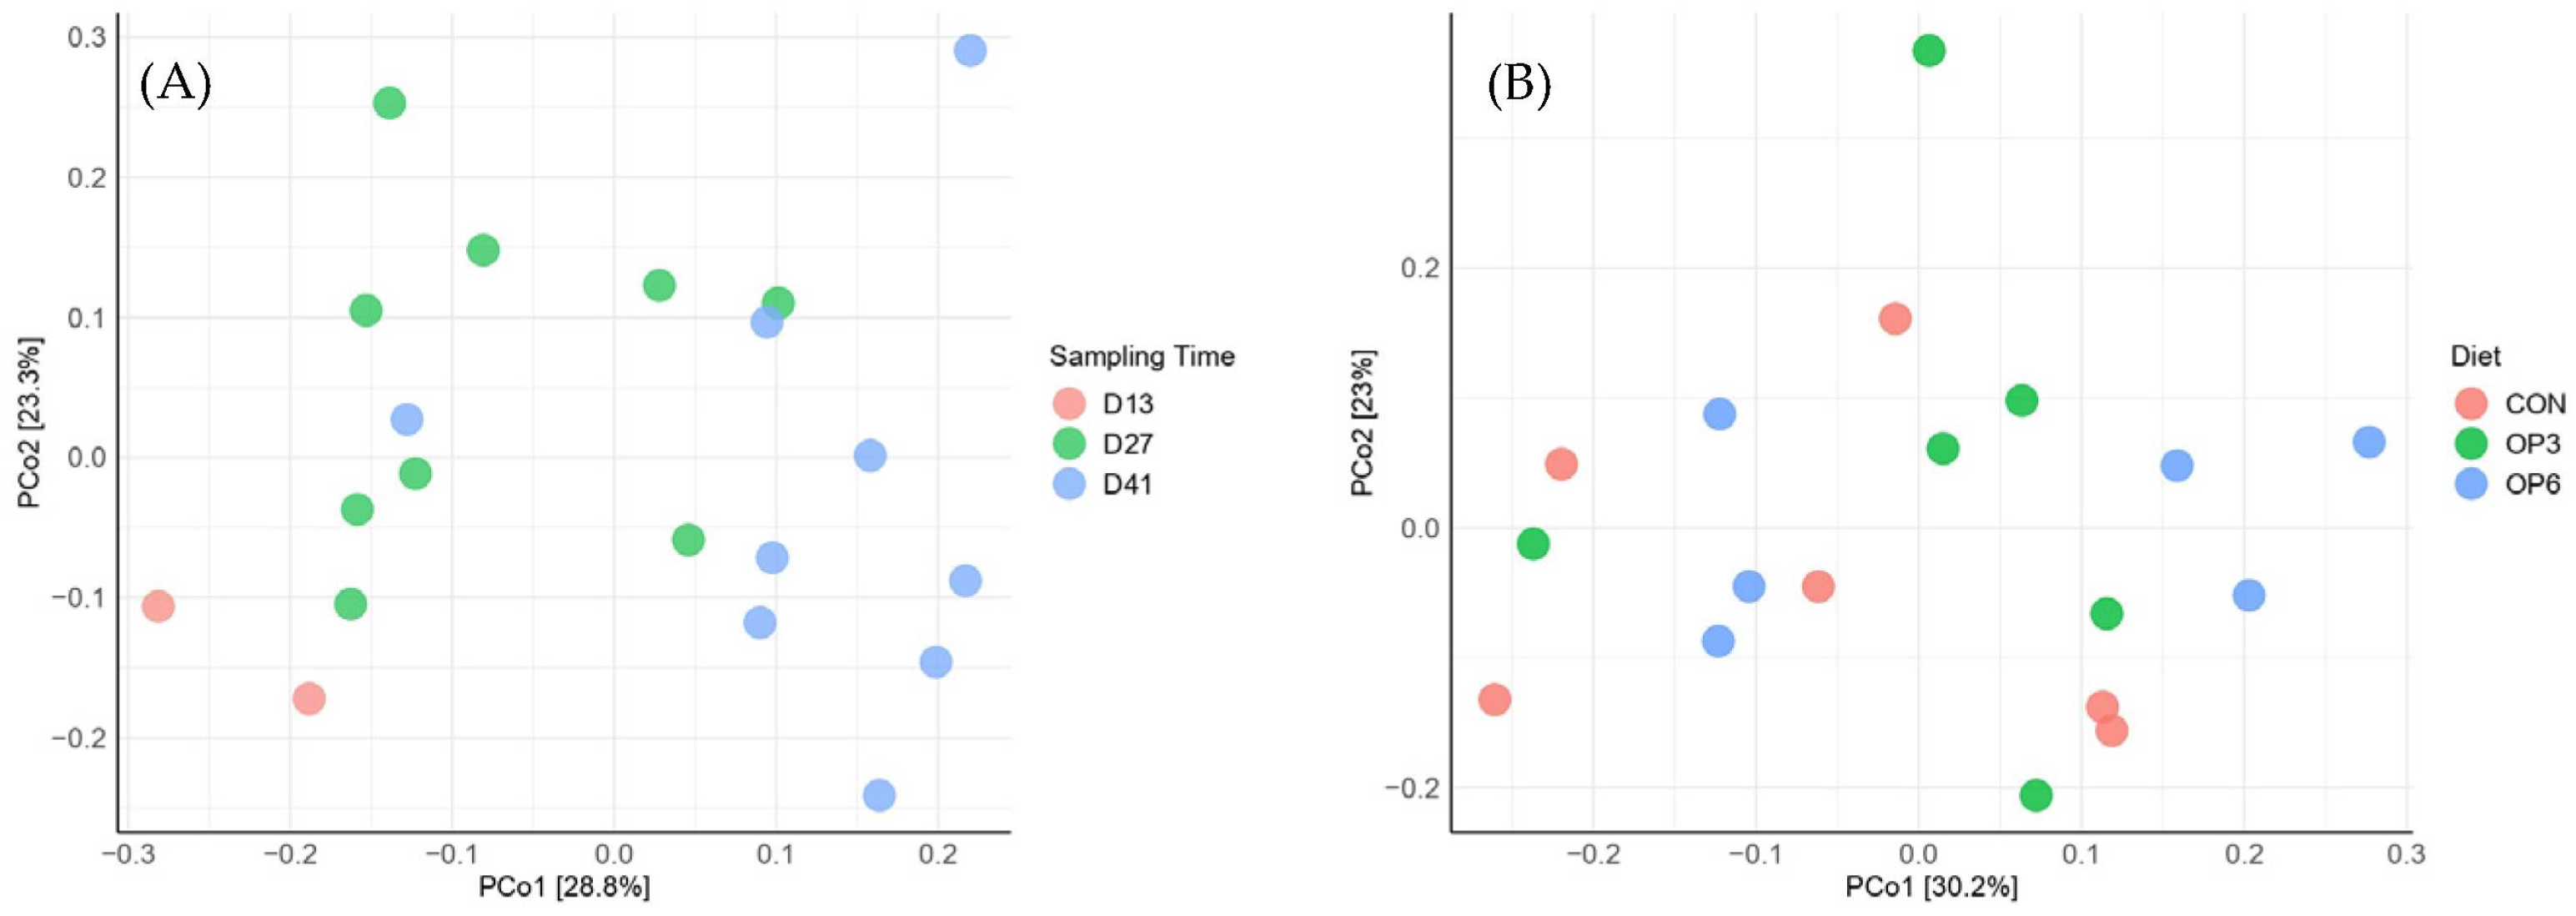
3.3.1. Microbiome Diversity Measures

To evaluate the fecal microbial diversity in response to OP feeding, α-diversity was compared between the control and the OP-fed groups. For the statistical tests, samples were grouped into three categories named (a) based on diet, (b) based on sampling time and (c) based on both diet and sampling time. Calculation of richness and evenness indices showed that no statistically significant differences were found among all groups over time, indicating that OP does not modulate the richness and biodiversity of fecal microbial communities (Figure 1). However, though not statistically significant, a numerical increase of indices for richness estimation (Observed, Chao1, and ACE) in OP6 related to the OP3 dietary group by 27 and 41 days of age was observed, indicating a direct relationship between the OP dose and fecal microbial diversity.
The β-diversity analysis was performed to estimate the difference or the similarity in the microbiome composition among groups. Pairwise ANOSIM revealed that the microbial composition was significantly affected by age (p = 0.0027, R = 0.3268; Table S2); PCoA visualization of the β-diversity among samples collected at the onset of the experiment (13 days of age), at 27 days of age, and at the end of the study (41 days of age) revealed a trend of clustering of microbial communities based on sampling time (Figure 2A). On the other hand, pairwise ANOSIM did not show significant differences in microbial composition among samples from different dietary treatments (p = 0.4947, R = −0.01152; Table S3); PCoA plots showed that there was no clear clustering of the samples based on the different dietary treatments (Figure 2B).

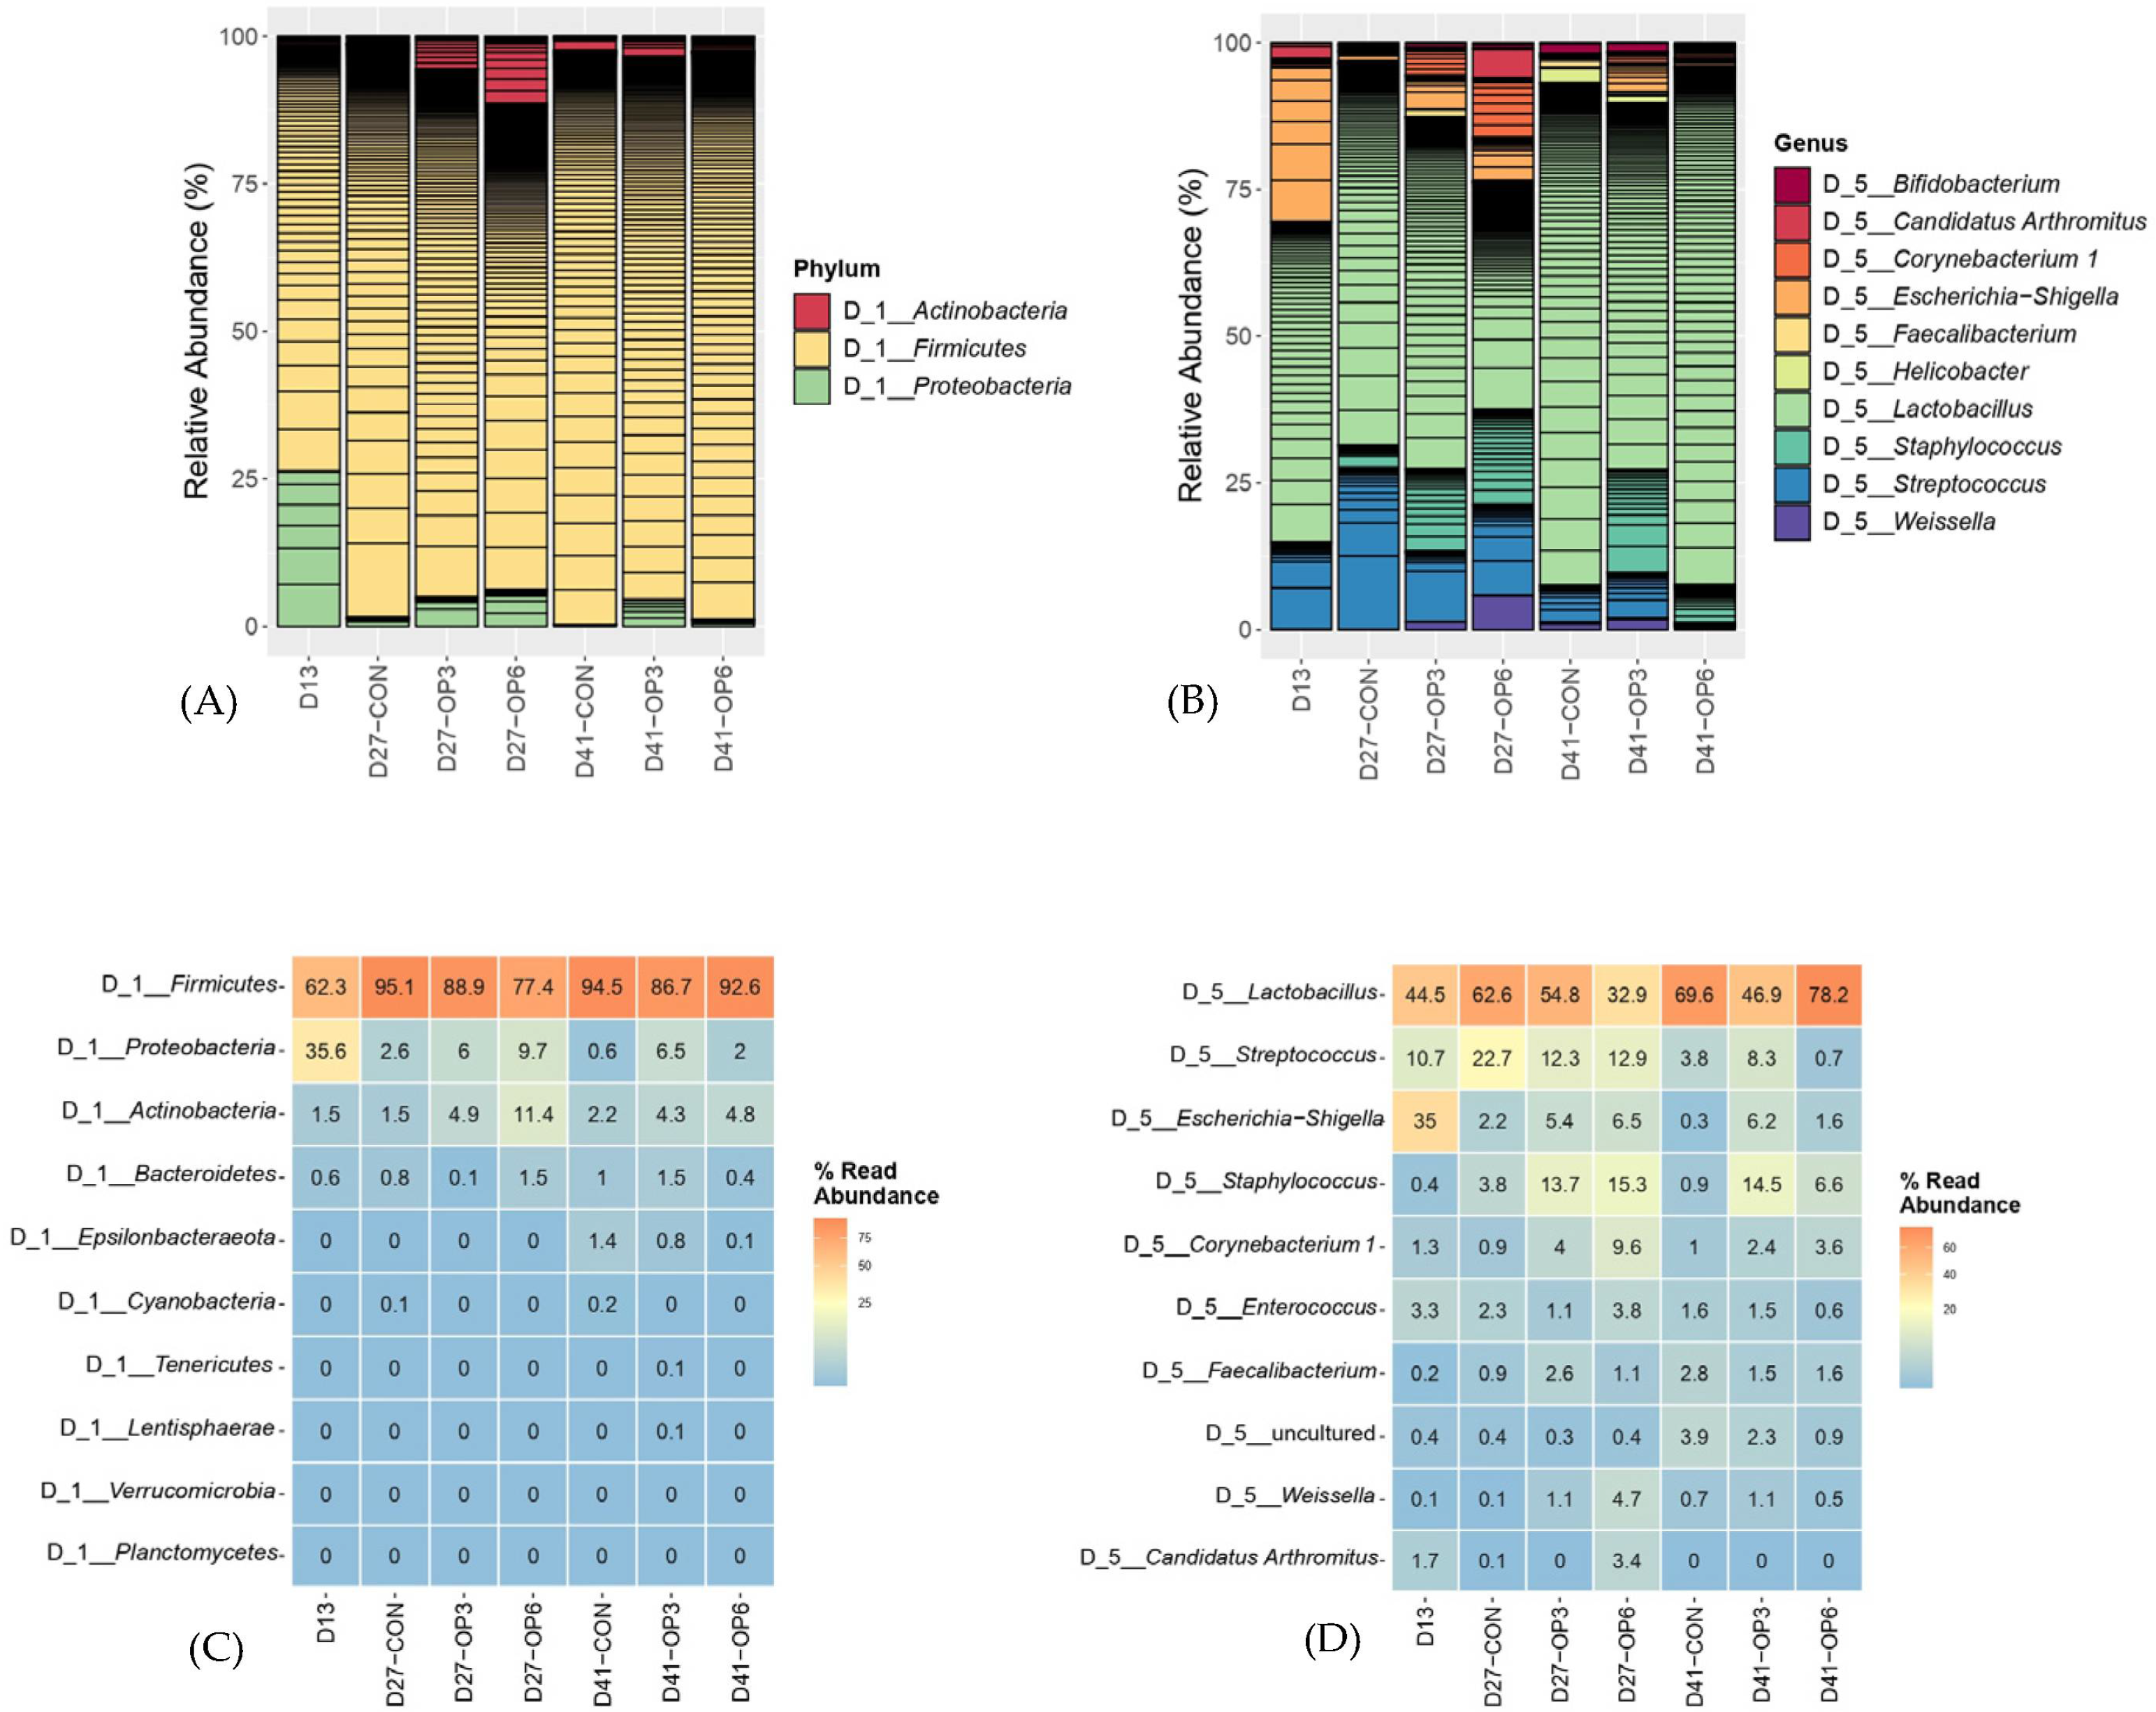
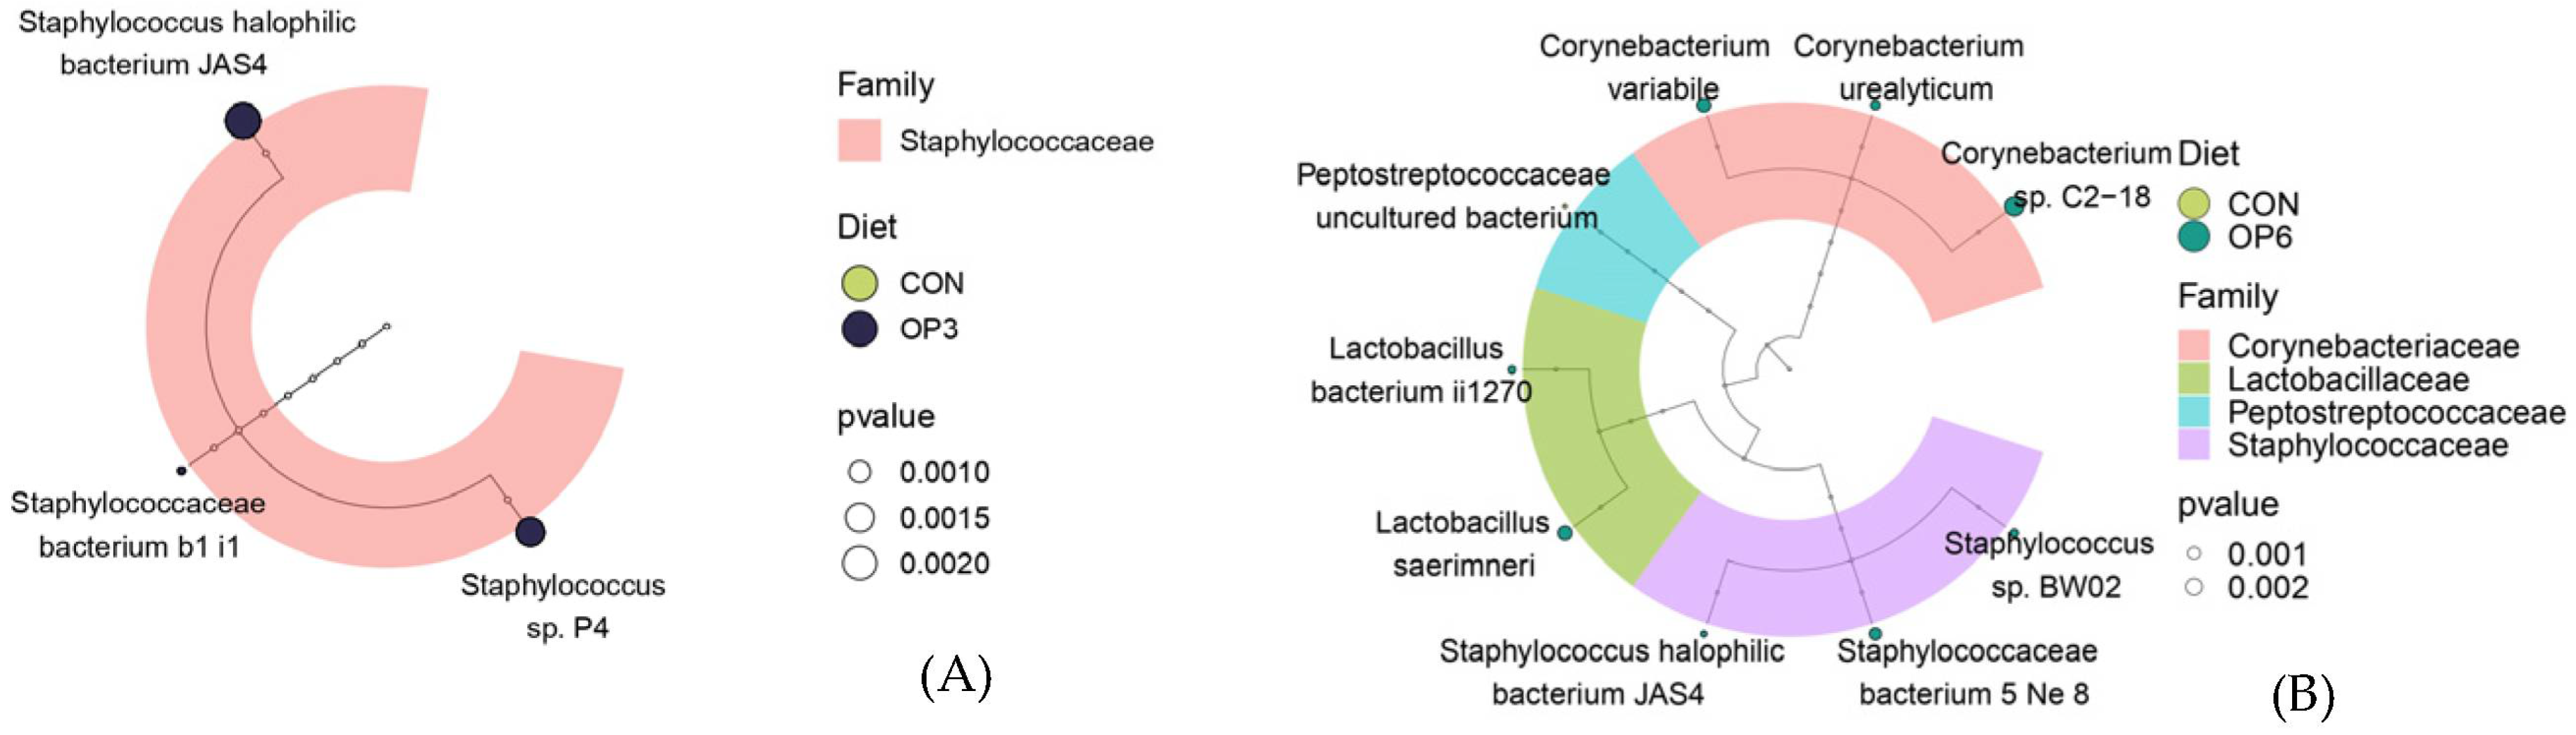
3.3.2. Microbial Community Composition

To obtain further insights into the impact of OP feeding on the fecal microbiome, we assessed the relative abundance of bacterial taxa in samples collected at the onset of the experiment (13 days of age), at 27 days of age, and at the end of the study (41 days of age). Calculation of the relative abundance at different levels from phylum to genus and multiple test comparisons revealed that the predominant taxa were similar between the different dietary treatments at 27 and 41 days of age as well as between the OP groups and the control group at each time point. Firmicutes (62.3 to 95.1%), Proteobacteria (2.0 to 35.6%), and Actinobacteria (1.5 to 11.4%) formed the vast majority of microbiota at the phylum level across all age and dietary groups (Figure 3A,C). At the genus level, Lactobacillus (32.9 to 78.2%) was the dominant genera in the feces of chicken in all OP and CON groups, followed by Streptococcus (0.7 to 22.7%) and Staphylococcus (0.9 to 15.3%) (Figure 3B,D). Though not statistically significant, a numerical increase and decrease in shifts in the main genera were observed in the OP6 and OP3 dietary groups compared to CON, at 41 days of age; Interestingly, an increase in Staphylococcus (0.9 to 14.5%) in OP dietary treatments compared to CON has been revealed.
To identify differential taxa between CON and OP dietary treatment groups an abundant differential analysis has been performed. The staphylolococcaceal family was significantly more present in the OP3 dietary group than in the CON group, at 41 days of age (Figure 4A, Table S4). At the same time point, testing between OP6 dietary treatment group and CON group showed that four families (Lactobacillaceae, Staphylococcaceae, Corynebacteriaceae, and Peptostreptococcaceae) were enriched in OP6 group (Figure 4B, Table S5).

4. Discussion

This is the first report that investigates the impact of OP on welfare and behavior traits of broilers. The studied inclusion rates were chosen according to the results of a previous study of ours carried out in laying hens [51]. In our former report, a positive dietary effect of dried OP on welfare parameters of hens was found in incorporation rates ranging from 3% to 6%. Thus, we decided to perform this trial using the lowest (3%) and the highest dose rates (6%) based on the beneficial impact on hens’ welfare characteristics. Moreover, the chickens used in the present trial were selected from a commercial flock that was introduced in poultry house at the age of 1 day-old. A 12-days adaptation period was used before starting the experiment, in order to provide chickens the appropriate time to adjust to the new poultry house environment and also reduce stress factors related to their transport from the hatchery to the poultry farm. In addition, this period was also required for the stabilization of their body weight.
The present study revealed that the addition of 3% and 6% OP in growers’ diet retarded BWG of chickens during this period and resulted in their lower BW at day 20 compared to controls. However, during the growing phase, the chickens of all groups consumed similar amount of feed. This finding indicates the compromised nutrient utilization of feed in OP fed growers in comparison to control birds due to the high fiber content of OP, and consequently to the higher fiber content of OP diets compared to CON diet, confirming previous reports [36,43]. It seems that the immature digestive system of young broilers, which still develops at the age of 28 days of age [68,69] is not capable of digesting the high fiber content of OP diets. Jiménez-Moreno et al. [70] indicated that moderate amounts of structural insoluble fiber (2.5%) rather than (5%) are required to improve gizzard development, gastrointestinal function and nutrient digestibility in young broilers 21 days of age. Commercial broiler diets are typically formulated to contain a maximum of 2–3% crude fiber [71]. In the present study, CON diets were within crude fiber content recommendations in all three feeding phases, whereas OP diets exceeded them, as indicated by the chemical composition of experimental ratios. In line with our findings, Papadomichelakis et al. [41] also observed a negative impact in broilers growth performance when they consumed diets containing 5% of dried OP compared to controls during the grower phase. Thus, in order to provide young broilers the time required for their digestive system to adapt to the introduction of fibrous OP to their diets, these authors suggested the gradual increase of OP in birds fed with age.
It has been previously documented that broiler chickens undergoing compensatory growth also exhibit greater than normal feed intake relative to body weight and some associated digestive adaptation [72]. The results of this trial concerning FC during the period from 21 to 27 days of life are in agreement with the aforementioned authors. More specifically, in order to cover their needs for maintenance and growth, OP-fed broilers consumed significantly greater amounts of feed compared to CON birds during 21 to 27 days of life. The increased FC observed in OP-fed broilers resulted in similar BWG among chickens of all groups during 21 to 27 days of life. However, despite the similarities in BWG during this time period, only the chicks that consumed diets with 6% OP managed to achieve similar BW with control chicks. Increased feed intake in broilers fed finisher diets with 5% OP have also been recorded in previous reports [45]. During the last two weeks of the finishing period, considerable differences of FCR were recorded among groups. At first, a deterioration of FCR in OP-fed broilers compared to controls was recorded from 28 to 34 day of life followed by the opposite result the next period (35–41 d). The observed differences in feed efficiency were the net result of the numerical or significant differences in FC seen among groups during each time period.
Despite the observed differences in productive traits of broilers as recorded at weekly intervals among groups, overall growth performance of chickens as indicated by final BW at 41 day of life, BWG, FC and FCR during the whole experimental period (13–41 d) was not affected by the addition of OP in birds’ diet. These data imply the capability of broilers to adapt to and efficiently utilize diets containing OP at levels of 3% and 6% gradually with age without compromising their growth. The mechanisms implicated in this adaptation could be a combination of factors acting individually or synergistic to a more functional digestive tract. Both the type of diet (higher fiber content in OP ratios compared to control) and the age of broilers with continue developing gastrointestinal system play a key role. Inclusion of insoluble dietary fiber in broiler diets has been shown to regulate intestinal morphology, gut microbiota, nutrient absorption, digestive organ development, and growth performance [73]. However, limited factors such as digestive enzymes’ secretion and activities, as well as the surface area for absorption, prevent young broilers with an immature gastrointestinal tract to properly digest and absorb nutrients [74]. As the chickens grow, these issues are improving, resulting in the amelioration of nutrient utilization. Additionally, the role that the microbiome plays, or the absence of it, in the development of young chicks, must be taken into account. The gastrointestinal tract of the hatchling is sterile [75] but is quickly colonized by microbiome through the feed and environment. It is worth mentioning that a stable microbiome, with high-species diversity and an even distribution of predominant species, is established by the third week of life [76,77].
The results of this investigation concerning overall growth performance are in agreement with those observed by other researchers who evaluated the in feed inclusion of OP in broilers’ diet, at various incorporation rates such as 5% and 10% [25,38,39,46], 2%, 4%, 6% and 8% [40], 5% [42,43], 2.5%, 5% and 7.5% [36] and 6% [37]. On the other hand, lower BW at slaughter, increased feed intake and FCR in broilers fed grower and finisher ratios containing 2.5% and 5% olive paste flour respectively compared to controls, was reported by Fotou et al. [45]. Moreover, decreased FC [37,43,46], deterioration of FCR [37,41,42,43], decreased BWG [36,37] and final BW [36,37,43] of broilers fed diets supplemented with OP at rates of 8% [41,42], 3% and 9% [37], 10% [36,43], 15% [43] and 20% [46] compared to control chicks have been previously documented. The deterioration of OP fed broilers’ productive traits in former reports has been attributed to the high crude fiber content of OP, and consequently OP diets that have been shown to negatively affect nutrient utilization [36,43,45]. Finally, Saleh et al. [44] observed higher BWG in broilers with 35 days of age that consumed diets containing 4% OP compared to control chickens.
The lack of consistency of our results considering the dietary effect of OP in broiler growth performance with those formerly reported in similar studies could be due to differences in the composition of OP and diets used, the dose rate of OP, as well as chickens age and hybrid. The crude fiber content of olive by- products used is of great importance. Similar to other agro-industrial by-products, dried olive residues are characterized by a high variability in the chemical composition, due to different oil extraction methods and olive varieties, or the following processing out such as drying or destoning [78]. Destoning, has been shown to reduce the crude fiber content of dried OP thus allowing higher dietary dried OP incorporation rates without negative impact on growth performance of broiler chickens [25].
The incorporation of OP in broilers’ diet at both studied levels (3% and 6%) had a positive effect on both FPD and the cleanliness of the birds’feathers as evaluated at day 34 and 41 of their life. This finding is very important for chickens health and welfare but also from the farmers’ financial point of view. It is well known that FPD is a very common and well recognized problem in broiler industry [79], that negatively affects birds productivity and welfare [80] especially when lesions are severe and painful and it has been associated with reduced mobility, lameness and consequently with behavioral restrictions of birds [81,82]. It has also been shown that FPD is highly correlated to systemic bacterial infections since pathogens can invade to the chickens through damaged epithelium on the foot pads causing bumblefoot [83]. Furthermore, financial losses due to FPD are mainly attributed to slaughterhouse condemnation of carcasses with contact dermatitis lesions [79]. Chicken legs are a highly profitable by-product for the industry, and poor footpad conditions due to FPD downgrade the product quality, resulting in condemnations and downgrading and, consequently, in loss of income [81]. On the other hand, plumage cleanliness is important for thermoregulation and when the feathers are wet or soiled by bedding material they may lose their protective properties, having negative effects on the welfare of birds [84]. Dirty feathers can provide information regarding chickens living conditions and feather cleanliness estimation is a good indicator for management quality and litter humidity [85].
FPD is a multifactorial problem with litter quality, nutrition and gut health being some of the factors implicated in its’ incidence [79,80,81]. The most important risk factor for the development of FPD is considered the litter condition [86]. The litter moisture and ammonia concentration from accumulated fecal material can burn and weaken the dermis of the footpad [87], with an increased severity of FPD resulting from the prolonged exposure of feet to wet litter. Moisture causes the outer layer of the dermis to soften, posing a risk of microbial contamination, leading to necrosis [88]. In a number of studies, dirty feathers and FPD are highly correlated; possibly due to a common cause which is litter humidity [84,89,90]. Moreover, birds with FPD prefer to spend more time sitting due to pain, thus soiling their feathers [81]. The results of the present study confirm the findings of the aforementioned authors.
The precise mechanism implicated in the positive nutritional effect of OP in both FPD and feather cleanliness of broilers observed in this study is presently unknown and requires further investigation due to the lack of similar studies in available literature. As mentioned above, nutrition and diet composition are considered major factors in the onset of FPD because they have a direct effect on feces moisture and eventually litter quality as well as on gut health. Our findings could be partially attributed to the higher fiber content of OP diets compared to the control diet which might have ameliorated either litter quality or gut health of birds or both. It has been previously documented that dietary fiber intake can directly influence wet litter, depending on the type, source, level and chemical composition of the fiber, as well as the diet composition [91]. Dietary non-starch polysaccharides (NSP), specifically insoluble NSP, have been shown to provoke beneficial effects on gut health, litter quality and nutrient utilization, by increasing crop and gizzard activity, stimulating digestive enzyme production and enhancing bacterial fermentation in the hind gut [91]. The presence of NSP in the cell wall of OP has been documented by several authors [25,38,39]. A number of studies have reported that adding lignocellulose-based products like OP [46] in poultry diets positively affects fecal consistency and litter quality [92,93,94,95]. In part, this could be due to the presence of fiber that increases digesta retention time and water holding capacity, leading to increased water absorption in the gastrointestinal tract and thus decreased moisture in the excreta. Furthermore, short chain fatty acids (SCFAs), the final products of fermentation of dietary fiber by the intestinal microbiota, have been shown to enhance the absorption of water [96,97]. Moreover, previous reports demonstrated that SCFAs, such as propionate and acetate, present toxic effects on some pathogenic bacteria [98,99].
The higher percentage of birds with no evidence of FPD and completely clean feathers recorded in OP groups compared to CON could also be due to the advantageous for the skin health effect of OP bioactive compounds like polyunsaturated fatty acids (PUFA) and polyphenols. Former reports demonstrate that oils with high content of essential fatty acids ameliorate skin hydration, regenerate the damaged epidermal lipid barrier and modulate skin metabolism [100]. Additionally, plant polyphenols are regarded as important substances for skin function, with hydrating, smoothing and softening actions [101,102,103]. Since this is the first study investigating the dietary effect of OP in FPD and feather cleanliness of broilers, comparison of our findings cannot be made. However, the results of a recent similar trial carried out in laying hens confirm the dietary impact of OP in keratin components of the skin [51]. In particular, Dedousi et al. [51] observed improved belly feather condition and longer claws in laying hens fed diets with 3–6% incorporation rates of OP compared to the CON diet.
No welfare issues in respect of hock burns were recorded in the present study. Even though nutrition plays an important role in the incidence of leg problems in broilers and consequently to possible behavior changes, the incorporation of OP in broilers’ diet did not affect the qualitative behavior characteristics evaluated. These results could be attributed to the minimal evidence of FPD observed in birds of all groups. It has been previously shown that severe lesions of FPD have been associated with hock burns [89,104] and behavioral restrictions of chickens [81,89] and turkeys [105] such as reduced activity due to pain.
To improve our understanding of the mechanisms involved in the positive dietary effect of OP in both FPD and feather cleanliness of broilers observed in this study, we examined the impact of OP in modulating fecal microbiota. Fecal samples were utilized in this study due to concerns that cloacal swabs may not collect enough material for sufficient analysis and the need to not sacrifice birds. Estimation of the α and β-diversity in response to OP feeding showed that there was no significant effect of dietary treatments on fecal microbiota diversity; only changes of β-diversity on an age dependent way were observed. Although in a limited number, previous studies in broilers also revealed that OP did not affect the diversity of the chicken ceacal microbiota. According to them, no significant differences were observed in cecum microbiota of broilers fed 2–8% OP [40] or 750 ppm of a bioactive olive pomace extract from common olive (Olea europaea) [47] compared to those fed the control diets.
The feces of chickens across all age and dietary groups were mainly dominated by the phylum Firmicutes (62.3 to 95.1%) mainly represented by the genus Lactobacillus (32.9 to 78.2%), Proteobacteria (2.0 to 35.6%), and Actinobacteria (1.5 to 11.4%) (Figure 3A–D). These results are in agreement with previous studies which reported the same dominant phyla in the cecal [106] and fecal microbiota [107] in chickens. Although it has been shown that bioactive compounds of olive pomace such as oleuropein and hydroxytyrosol [108] as well as the use of fiber as a tool in order to encourage extended digesta passage rate in the fore gut can help to promote beneficial microbiota [91], in our study we found that the incorporation of OP in broilers’ diet at both studied levels (3% and 6%) did not modify the relative abundance of taxa in feces.
Strikingly, though not statistically significant, at the genus level a numerical increase in Staphylococcus (0.9 to 14.5%) in OP dietary treatments compared to CON was revealed. Differential abundant analysis also confirmed differentially enrichment with Staphylococcaceae of OP3 and OP6 microbiota compared to CON. Lactobacillaceae was also one of the differentially abundant taxa which were identified to be enriched in 41 days of age samples from birds treated with OP6, compared to CON. The latter is in agreement with previous studies reporting Lactobacillus was identified at increased counts in ileal samples of birds fed with olive leaves and pomace extracts compared to that of the CON [47,108,109]. Differentially enrichment of Lactobacillaceae in OP6 dietary treatment could be attributed to their ability to metabolize phenolic compounds contained in OP thus favoring their growth [110]. Lactobacilli have a principal role in shaping the immune system repertoire by improving antibody-mediated immune responses and modulating cytokine expression [111]. On the other hand, staphylococci constitute a common part of chicken intestinal microbiota acting as symbiotic or pathogenic [112]. Similar to our findings, Staphylococcaceae have also been recorded in broiler fecal microbiota samples in former reports [113].
Overall, comparing the OP treated groups with their respective control groups, our results suggest that OP treatments did not significantly affect the fecal microbiota population and consequently positive dietary effects of OP on both FPD and feather cleanliness of broilers are not ascribed to the modulation of gut microbiota. They could however be attributed to the skin health beneficial [101,102,103] and immunomodulatory effects of the bioactive compounds of OP [47]. These results are in agreement with previous studies which have been proposed that positive effects of OP in pigs and chickens are related to its anti-inflammatory properties rather than to alterations in gut microbial ecology and function [47,114]. However, it should be noted that our results should be evaluated with caution; it has been proposed that fecal samples from chickens can be used to detect changes in the intestinal microbial community but the two microbiota differ significantly in diversity and the fecal microbiota does not accurately represents the intestinal one [107,115].

5. Conclusions

The current study revealed that supplementing broilers’ diet with dried OP positively affected both FPD and feather cleanliness of birds. These observations demonstrate the potential health and welfare benefits for OP fed chickens and also indicate a possible cost –benefit relation for the producers. The non-significant differences observed among dietary treatments regarding fecal microbial population indicate that the positive dietary effects of OP on both FPD and feather cleanliness could possibly be related to the higher fiber content of OP diets compared to control diet which might have ameliorated litter quality rather than gut health of birds. They could also be associated with the skin health beneficial effect and the anti-inflammatory properties of OP bioactive compounds like PUFA and polyphenols, however further investigation is necessary to verify the exact mechanism implicated in those results. The addition of OP in broilers’ diet at both studied levels (3% and 6%) did not adversely affect the qualitative behavior characteristics evaluated as well as the overall growth performance of chicks. These data imply the capability of broilers to adapt to and efficiently utilize diets containing OP at both levels of 3% and 6% gradually with age without compromising their growth.
Taking into account the encouraging findings of our research on the parameters studied, the nutritional effect of OP on the quality and organoleptic characteristics of broilers’ meat could be explored in the future. A more detailed investigation of the intestinal microbiome could also be conducted to assess the potential probiotic action of some of the bioactive substances of the olive paste.

Supplementary Materials

The following supporting information can be downloaded at: https://0-www-mdpi-com.brum.beds.ac.uk/article/10.3390/su15010501/s1, Table S1: Sequences of primers for NGS libraries.; Table S2: Pairwise ANOSIM analysis of the chicken fecal microbiota comparing samples from different age groups.; Table S3: Pairwise ANOSIM analysis of the chicken fecal microbiota comparing samples from different dietary treatments.; Table S4: Differential abundance analyses of 41-day fecal samples, comparing OP3 to the untreated group CON.; Table S5: Differential abundance analyses of 41-day fecal samples, comparing OP6 to the untreated group CON.

Author Contributions

Conceptualization, A.D. and E.S.; methodology, A.D., C.K., A.T. and A.A.; software, A.D., M.-Z.K., S.I.P. and C.K; validation, A.D., C.K. and E.S.; formal analysis, A.D., C.K., A.T. and A.A.; investigation, A.D., M.-Z.K. and C.K.; resources, S.I.P. and E.S.; data curation, A.D. and E.S.; writing—Original draft preparation, A.D. and C.K.; writing—Review and editing, E.S. and S.I.P.; visualization, M.-Z.K., A.T. and A.A.; supervision, E.S.; project administration, A.D., S.I.P. and E.S.; funding acquisition, E.S. All authors have read and agreed to the published version of the manuscript.

Funding

This research was funded by the Veterinary Research Institute, Hellenic Agricultural Organization DIMITRA, grant number 22.1681.255.

Institutional Review Board Statement

The study was conducted in accordance with the Declaration of Helsinki and approved by the Committee for Research Ethics of Hellenic Agricultural Organization DIMITRA (22072/26 April 2021).The Research Ethics Committee of Hellenic Agricultural Organization-DIMITRA has approved the experimental protocol and implemented animal care procedures of the investigation (22072/26 April 2021).

Informed Consent Statement

Not applicable.

Data Availability Statement

The data presented in this study are available on request from the corresponding author. The data are not publicly available due to privacy.

Acknowledgments

We sincerely thank DIMITRIADIS CHRISTOS S.A. poultry farm that valuably contributed in this research by offering the experimental animals and facilities. We are also thankful to SPARTA LIFE S.A. for providing the dried OP used in this trial.

Conflicts of Interest

The authors declare no conflict of interest.

References

  1. Diaz Carrasco, J.M.; Casanova, N.A.; Fernández Miyakawa, M.E. Microbiota, Gut Health and Chicken Productivity: What Is the Connection? Microorganisms 2019, 7, 374. [Google Scholar] [CrossRef] [PubMed] [Green Version]
  2. Ducatelle, R.; Goossens, E.; De Meyer, F.; Eeckhaut, V.; Antonissen, G.; Haesebrouck, F.; Van Immerseel, F. Biomarkers for monitoring intestinal health in poultry: Present status and future perspectives. Vet. Res. 2018, 49, 43. [Google Scholar] [CrossRef] [PubMed] [Green Version]
  3. O’Mahony, S.M.; Clarke, G.; Borre, Y.E.; Dinan, T.G.; Cryan, J.F. Serotonin, tryptophan metabolism and the brain-gut-microbiome axis. Behav. Brain Res. 2015, 277, 32–48. [Google Scholar] [CrossRef] [PubMed]
  4. Foster, J.A.; Rinaman, L.; Cryan, J.F. Stress & the gut-brain axis: Regulation by the microbiome. Neurobiol. Stress 2017, 7, 124–136. [Google Scholar] [CrossRef] [PubMed] [Green Version]
  5. Hoban, A.E.; Moloney, R.D.; Golubeva, A.V.; McVey Neufeld, K.A.; O’Sullivan, O.; Patterson, E.; Stanton, C.; Dinan, T.G.; Clarke, G.; Cryan, J.F. Behavioural and neurochemical consequences of chronic gut microbiota depletion during adulthood in the rat. Neuroscience 2016, 339, 463–477. [Google Scholar] [CrossRef] [PubMed]
  6. Ceylani, T.; Jakubowska-Doğru, E.; Gurbanov, R.; Teker, H.T.; Gozen, A.G. The effects of repeated antibiotic administration to juvenile BALB/c mice on the microbiota status and animal behavior at the adult age. Heliyon 2018, 4, e00644. [Google Scholar] [CrossRef] [PubMed]
  7. Cao, Y.-N.; Feng, L.-J.; Liu, Y.-Y.; Jiang, K.; Zhang, M.-J.; Gu, Y.-X.; Wang, B.-M.; Gao, J.; Wang, Z.-L.; Wang, Y.-M. Effect of Lactobacillus rhamnosus GG supernatant on serotonin transporter expression in rats with post-infectious irritable bowel syndrome. WJG 2018, 24, 338–350. [Google Scholar] [CrossRef]
  8. Yousefi, B.; Eslami, M.; Ghasemian, A.; Kokhaei, P.; Salek Farrokhi, A.; Darabi, N. Probiotics importance and their immunomodulatory properties. J. Cell. Physiol. 2019, 234, 8008–8018. [Google Scholar] [CrossRef]
  9. Cox, C.M.; Dalloul, R.A. Immunomodulatory role of probiotics in poultry and potential in ovo application. Benef. Microbes 2015, 6, 45–52. [Google Scholar] [CrossRef]
  10. Parois, S.; Calandreau, L.; Kraimi, N.; Gabriel, I.; Leterrier, C. The influence of a probiotic supplementation on memory in quail suggests a role of gut microbiota on cognitive abilities in birds. Behav. Brain Res. 2017, 331, 47–53. [Google Scholar] [CrossRef]
  11. Yan, F.F.; Wang, W.C.; Cheng, H.W. Bacillus subtilis based probiotic improved bone mass and altered brain serotoninergic and dopaminergic systems in broiler chickens. J. Funct. Foods 2018, 49, 501–509. [Google Scholar] [CrossRef]
  12. van der Eijk, J.A.J.; de Vries, H.; Kjaer, J.B.; Naguib, M.; Kemp, B.; Smidt, H.; Rodenburg, T.B.; Lammers, A. Differences in gut microbiota composition of laying hen lines divergently selected on feather pecking. Poult. Sci. 2019, 98, 7009–7021. [Google Scholar] [CrossRef] [PubMed]
  13. Wang, H.; Liang, S.; Li, X.; Yang, X.; Long, F.; Yang, X. Effects of encapsulated essential oils and organic acids on laying performance, egg quality, intestinal morphology, barrier function, and microflora count of hens during the early laying period. Poult. Sci. 2019, 98, 6751–6760. [Google Scholar] [CrossRef] [PubMed]
  14. EUR-lex. Regulation (EC) No 1831/2003 of the European Parliament and of the Council of 22 September 2003 on Additives for Use in Animal Nutrition. 2003. Available online: https://eur-lex.europa.eu/legal-content/EN/TXT/?uri=CELEX%3A32003R1831 (accessed on 12 January 2022).
  15. The Community Summary Report on Trends and Sources of Zoonoses and Zoonotic Agents in the European Union in 2007. EFSA J. 2009, 7, 223r. [CrossRef]
  16. Fernando, U.; Biswas, D.; Allan, B.; Willson, P.; Potter, A.A. Influence of Campylobacter jejuni fliA, rpoN and flgK genes on colonization of the chicken gut. Int. J. Food Microbiol. 2007, 118, 194–200. [Google Scholar] [CrossRef] [PubMed]
  17. Papatsiros, V.G.; Katsoulos, P.D.; Koutoulis, K.C.; Karatzia, M.; Dedousi, A.; Christodoulopoulos, G. Alternatives to antibiotics for farm animals. CABI Rev. 2013, 8, 32. [Google Scholar] [CrossRef]
  18. Lillehoj, H.; Liu, Y.; Calsamiglia, S.; Fernandez-Miyakawa, M.E.; Chi, F.; Cravens, R.L.; Oh, S.; Gay, C.G. Phytochemicals as antibiotic alternatives to promote growth and enhance host health. Vet. Res. 2018, 49, 76. [Google Scholar] [CrossRef] [Green Version]
  19. Herrero-Encinas, J.; Blanch, M.; Pastor, J.J.; Menoyo, D. Diet Supplementation with a Bioactive Pomace Extract from Olea europaea Partially Mitigates Negative Effects on Gut Health Arising from a Short-Term Fasting Period in Broiler Chickens. Animals 2020, 10, 349. [Google Scholar] [CrossRef] [Green Version]
  20. Rebollada-Merino, A.; Bárcena, C.; Ugarte-Ruiz, M.; Porras, N.; Mayoral-Alegre, F.J.; Tomé-Sánchez, I.; Domínguez, L.; Rodríguez-Bertos, A. Effects on Intestinal Mucosal Morphology, Productive Parameters and Microbiota Composition after Supplementation with Fermented Defatted Alperujo (FDA) in Laying Hens. Antibiotics 2019, 8, 215. [Google Scholar] [CrossRef] [Green Version]
  21. Salomone, R.; Ioppolo, G. Environmental impacts of olive oil production: A Life Cycle Assessment case study in the province of Messina (Sicily). J. Clean. Prod. 2012, 28, 88–100. [Google Scholar] [CrossRef]
  22. Zangeneh, S.; Torki, M. Effects of B-Mannanase Supplementing of Olive Pulp-Included Diet on Performance of Laying Hens, Egg Quality Characteristics, Humoral and Cellular Immune Response and Blood Parameters. Glob. Vet. 2011, 7, 391–398. [Google Scholar]
  23. Upadhaya, S.D.; Kim, I.H. Efficacy of Phytogenic Feed Additive on Performance, Production and Health Status of Monogastric Animals—A Review. Ann. Anim. Sci. 2017, 17, 929–948. [Google Scholar] [CrossRef] [Green Version]
  24. Ibrahim, N.S.; Sabic, E.M.; Abu-Taleb, A.M. Effect of inclusion irradiated olive pulp in laying quail diets on biological performance. J. Radiat. Res. Appl. Sci. 2018, 11, 340–346. [Google Scholar] [CrossRef] [Green Version]
  25. Sayehban, P.; Seidavi, A.; Dadashbeiki, M.; Ghorbani, A.; Araújo, W.A.G.; Albino, L.F.T. Effects of Different Levels of Two Types of Olive Pulp with or without Exogenous Enzyme Supplementation on Broiler Performance and Economic Parameters. Rev. Bras. Cienc. Avic. 2016, 18, 489–500. [Google Scholar] [CrossRef] [Green Version]
  26. Abdel-Moneim, A.E.; Shehata, A.M.; Alzahrani, S.O.; Shafi, M.E.; Mesalam, N.M.; Taha, A.E.; Swelum, A.A.; Arif, M.; Fayyaz, M.; Abd El-Hack, M.E. The role of polyphenols in poultry nutrition. J. Anim. Physiol. Anim. Nutr. 2020, 104, 1851–1866. [Google Scholar] [CrossRef] [PubMed]
  27. Visioli, F.; Poli, A.; Gall, C. Antioxidant and other biological activities of phenols from olives and olive oil. Med. Res. Rev. 2002, 22, 65–75. [Google Scholar] [CrossRef] [PubMed]
  28. Omar, S.H. Oleuropein in Olive and its Pharmacological Effects. Sci. Pharm. 2010, 78, 133–154. [Google Scholar] [CrossRef] [Green Version]
  29. Barbaro, B.; Toietta, G.; Maggio, R.; Arciello, M.; Tarocchi, M.; Galli, A.; Balsano, C. Effects of the Olive-Derived Polyphenol Oleuropein on Human Health. IJMS 2014, 15, 18508–18524. [Google Scholar] [CrossRef] [Green Version]
  30. Bulotta, S.; Celano, M.; Lepore, S.M.; Montalcini, T.; Pujia, A.; Russo, D. Beneficial effects of the olive oil phenolic components oleuropein and hydroxytyrosol: Focus on protection against cardiovascular and metabolic diseases. J. Transl. Med. 2014, 12, 219. [Google Scholar] [CrossRef] [Green Version]
  31. Casamenti, F.; Grossi, C.; Rigacci, S.; Pantano, D.; Luccarini, I.; Stefani, M. Oleuropein Aglycone: A Possible Drug against Degenerative Conditions. Vivo Evid. Eff. Against Alzheimer’s Dis. 2015, 45, 679–688. [Google Scholar] [CrossRef]
  32. Duborija-Kovacevic, N.; Shavrina, K. New findings on the pharmacodynamic actions of olive oil: Our contribution to better evidence about its remedial properties. Prog. Nutr. 2018, 20, 30–38. [Google Scholar] [CrossRef]
  33. Abd El-Galil, K.; Morsy, A.S.; Emam, K.R.S.; Hassan, A.M. Physiological responses and productive performance of laying hens fed olive cake under South Sinai conditions. Egypt. Poult. Sci. J. 2017, 37, 293–304. [Google Scholar]
  34. Ranalli, A.; Pollastri, L.; Contento, S.; Di Loreto, G.; Iannucci, E.; Lucera, L.; Russi, F. Acylglycerol and Fatty Acid Components of Pulp, Seed, and Whole Olive Fruit Oils. Their Use to Characterize Fruit Variety by Chemometrics. J. Agric. Food Chem. 2002, 50, 3775–3779. [Google Scholar] [CrossRef]
  35. Tufarelli, V.; Introna, M.; Cazzato, E.; Mazzei, D.; Laudadio, V. Suitability of partly destoned exhausted olive cake as by-product feed ingredient for lamb production. J. Anim. Sci. 2013, 91, 872–877. [Google Scholar] [CrossRef] [Green Version]
  36. Rabayaa, E.; Omar, J.M.A.; Othman, R.A. Utilization of Olive Pulp in Broiler Rations. An-Najah Univ. J. Res. 2001, 15, 133–144. [Google Scholar]
  37. Mohamed, M.E.; Ali, A.M.; Shetaewi, M.M.; Said, K.I.; Abdel-Ghaffar, M.A. Utilization of Olive Pomace Meal and Orange By-Product Meal In Broiler Rations. Sinai J. Appl. Sci. 2013, 2, 113–128. [Google Scholar] [CrossRef] [Green Version]
  38. Al-Harthi, M.A. The efficacy of using olive cake as a by-product in broiler feeding with or without yeast. Ital. J. Anim. Sci. 2016, 15, 512–520. [Google Scholar] [CrossRef]
  39. Al-Harthi, M. The Effect of Olive Cake, with or Without Enzymes Supplementation, on Growth Performance, Carcass Characteristics, Lymphoid Organs and Lipid Metabolism of Broiler Chickens. Rev. Bras. Cienc. Avic. 2017, 19, 83–90. [Google Scholar] [CrossRef] [Green Version]
  40. Sateri, S.; Seidavi, A.; Bouyeh, M.; Neumann, P.; Kutzler, M.; Laudadio, V.; Loperfido, F.; Tufarelli, V. Effect of olive meal and supplemental enzymes on performance traits, blood biochemistry, humoral immunity response and caecal microbiota of broilers. SA J. An. Sci. 2017, 47, 804. [Google Scholar] [CrossRef] [Green Version]
  41. Papadomichelakis, G.; Pappas, A.C.; Tsiplakou, E.; Symeon, G.K.; Sotirakoglou, K.; Mpekelis, V.; Fegeros, K.; Zervas, G. Effects of dietary dried olive pulp inclusion on growth performance and meat quality of broiler chickens. Livest. Sci. 2019, 221, 115–122. [Google Scholar] [CrossRef]
  42. Pappas, A.C.; Tsiplakou, E.; Papadomichelakis, G.; Mitsiopoulou, C.; Sotirakoglou, K.; Mpekelis, V.; Haroutounian, S.A.; Fegeros, K.; Zervas, G. Effects of olive pulp addition to broiler diets on performance, selected biochemical parameters and antioxidant enzymes. J. Hellenic Vet. Med. Soc. 2019, 70, 1687–1696. [Google Scholar] [CrossRef] [Green Version]
  43. ELbaz, A.M.; Thabet, H.; Gad, G. Productive and Physiological Performance of Broilers Fed Diets Containing Different Levels of Olive Pulp. J. Anim. Poult. Prod. 2020, 11, 435–439. [Google Scholar] [CrossRef]
  44. Saleh, A.A.; Paray, B.A.; Dawood, M.A.O. Olive Cake Meal and Bacillus licheniformis Impacted the Growth Performance, Muscle Fatty Acid Content, and Health Status of Broiler Chickens. Animals 2020, 10, 695. [Google Scholar] [CrossRef]
  45. Fotou, E.; Moulasioti, V.; Angelis, I.; Tsiouris, V.; Patsias, A.; Tellis, C.; Moussis, V.; Boti, M.; Tsoukatos, D. Influence of dietary olive paste flour on the performance and oxidative stress in chickens raised in field conditions. J. Hellenic Vet. Med. Soc. 2021, 72, 3239–3248. [Google Scholar] [CrossRef]
  46. Saleh, A.; Alzawqari, M. Effects of Replacing Yellow Corn with Olive Cake Meal on Growth Performance, Plasma Lipid Profile, and Muscle Fatty Acid Content in Broilers. Animals 2021, 11, 2240. [Google Scholar] [CrossRef]
  47. Herrero-Encinas, J.; Blanch, M.; Pastor, J.J.; Mereu, A.; Ipharraguerre, I.R.; Menoyo, D. Effects of a bioactive olive pomace extract from Olea europaea on growth performance, gut function, and intestinal microbiota in broiler chickens. Poult. Sci. 2020, 99, 2–10. [Google Scholar] [CrossRef]
  48. Debbou-Iouknane, N.; Nerín, C.; Amrane, M.; Ghemghar, M.; Madani, K.; Ayad, A. In Vitro Anticoccidial Activity of Olive Pulp (Olea europaea L. var. Chemlal) Extract Against Eimeria Oocysts in Broiler Chickens. Acta Parasit. 2019, 64, 887–897. [Google Scholar] [CrossRef] [Green Version]
  49. EUR-lex. COUNCIL DIRECTIVE 2007/43/EC of 28 June 2007 Laying down Minimum Rules for the Protection of Chickens Kept for Meat Production. 2007. Available online: https://eur-lex.europa.eu/legal-content/EN/TXT/HTML/?uri=CELEX:32007L0043&from=EN (accessed on 12 April 2022).
  50. Aviagen, W. Ross 308: Broiler’s Management and Nutrition Specification. ROSS An Aviagen Brand 2018. Available online: https://en.aviagen.com/assets/Tech_Center/Ross_Broiler/Ross-BroilerHandbook2018-EN.pdf (accessed on 20 April 2022).
  51. Dedousi, A.; Kritsa, M.-Z.; Đukić Stojčić, M.; Sfetsas, T.; Sentas, A.; Sossidou, E. Production Performance, Egg Quality Characteristics, Fatty Acid Profile and Health Lipid Indices of Produced Eggs, Blood Biochemical Parameters and Welfare Indicators of Laying Hens Fed Dried Olive Pulp. Sustainability 2022, 14, 3157. [Google Scholar] [CrossRef]
  52. Welfare Quality®. Welfare Quality® Assessment Protocol for Poultry (Broilers, Laying Hens); Welfare Quality® Consortium: Lelystad, The Netherlands, 2009.
  53. Klindworth, A.; Pruesse, E.; Schweer, T.; Peplies, J.; Quast, C.; Horn, M.; Glöckner, F.O. Evaluation of general 16S ribosomal RNA gene PCR primers for classical and next-generation sequencing-based diversity studies. Nucleic Acids Res. 2013, 41, e1. [Google Scholar] [CrossRef]
  54. JASP Team. JASP (Version 0.14) [Computer Software]. Available online: https://jasp-stats.org/previous-versions/ (accessed on 21 December 2020).
  55. Bolyen, E.; Rideout, J.R.; Dillon, M.R.; Bokulich, N.A.; Abnet, C.C.; Al-Ghalith, G.A.; Alexander, H.; Alm, E.J.; Arumugam, M.; Asnicar, F.; et al. Reproducible, interactive, scalable and extensible microbiome data science using QIIME 2. Nat. Biotechnol. 2019, 37, 852–857. [Google Scholar] [CrossRef]
  56. Martin, M. Cutadapt removes adapter sequences from high-throughput sequencing reads. EMBnet J. 2011, 17, 10. [Google Scholar] [CrossRef]
  57. Rognes, T.; Flouri, T.; Nichols, B.; Quince, C.; Mahé, F. VSEARCH: A versatile open source tool for metagenomics. PeerJ 2016, 4, e2584. [Google Scholar] [CrossRef] [PubMed] [Green Version]
  58. Quast, C.; Pruesse, E.; Yilmaz, P.; Gerken, J.; Schweer, T.; Yarza, P.; Peplies, J.; Glöckner, F.O. The SILVA ribosomal RNA gene database project: Improved data processing and web-based tools. Nucleic Acids Res. 2012, 41, D590–D596. [Google Scholar] [CrossRef] [PubMed]
  59. Camacho, C.; Coulouris, G.; Avagyan, V.; Ma, N.; Papadopoulos, J.; Bealer, K.; Madden, T.L. BLAST+: Architecture and applications. BMC Bioinform. 2009, 10, 421. [Google Scholar] [CrossRef] [Green Version]
  60. R Core Team. 2020. Available online: http://www.r-project.org/index.html (accessed on 15 December 2020).
  61. McMurdie, P.J.; Holmes, S. phyloseq: An R Package for Reproducible Interactive Analysis and Graphics of Microbiome Census Data. PLoS ONE 2013, 8, e61217. [Google Scholar] [CrossRef] [Green Version]
  62. Andersen, K.S.; Kirkegaard, R.H.; Karst, S.M.; Albertsen, M. Ampvis2: An R Package to Analyse and Visualise 16S RRNA Amplicon Data. bioRxiv 2018. [Google Scholar] [CrossRef] [Green Version]
  63. Wickham, H. ggplot2: Elegant Graphics for Data Analysis; Springer: Cham, Switzerland, 2016; ISBN 978-3-319-24275-0. [Google Scholar]
  64. MicrobiotaProcess: An R Package for Analysis, Visualization and Biomarker Discovery of Microbiome. Available online: https://github.com/YuLab-SMU/MicrobiotaProcess (accessed on 22 April 2022).
  65. Oksanen, J.; Blanchet, F.G.; Friendly, M.; Kindt, R.; Legendre, P.; McGlinn, D.; Minchin, P.R.; O’Hara, R.B.; Simpson, G.L.; Solymos, P.; et al. Vegan: Community Ecology Package. Available online: https://CRAN.R-project.org/package=vegan (accessed on 23 March 2022).
  66. Love, M.I.; Huber, W.; Anders, S. Moderated estimation of fold change and dispersion for RNA-seq data with DESeq2. Genome Biol. 2014, 15, 550. [Google Scholar] [CrossRef] [Green Version]
  67. Zhu, A.; Ibrahim, J.G.; Love, M.I. Heavy-tailed prior distributions for sequence count data: Removing the noise and preserving large differences. Bioinformatics 2019, 35, 2084–2092. [Google Scholar] [CrossRef] [Green Version]
  68. Sklan, D.; Noy, Y. Functional development and intestinal absorption in the young poult. Br. Poult. Sci. 2003, 44, 651–658. [Google Scholar] [CrossRef]
  69. Thomas, D.V.; Ravindran, V.; Ravindran, G. Nutrient digestibility and energy utilisation of diets based on wheat, sorghum or maize by the newly hatched broiler chick. Br. Poult. Sci. 2008, 49, 429–435. [Google Scholar] [CrossRef]
  70. Jiménez-Moreno, E.; González-Alvarado, J.M.; de Coca-Sinova, A.; Lázaro, R.P.; Cámara, L.; Mateos, G.G. Insoluble fiber sources in mash or pellets diets for young broilers. 2. Effects on gastrointestinal tract development and nutrient digestibility. Poult. Sci. 2019, 98, 2531–2547. [Google Scholar] [CrossRef]
  71. Choct, M. Fibre—Chemistry and Functions in Poultry Nutrition. 2015. Available online: https://www.wpsa-aeca.es/aeca_imgs_docs/16478_fibra_mingan.pdf (accessed on 22 July 2022).
  72. Zubair, A.K.; Leeson, S. Compensatory growth in the broiler chicken: A review. World’s Poult. Sci. J. 1996, 52, 189–201. [Google Scholar] [CrossRef]
  73. Tejeda, O.J.; Kim, W.K. Role of Dietary Fiber in Poultry Nutrition. Animals 2021, 11, 461. [Google Scholar] [CrossRef] [PubMed]
  74. Ravindran, V.; Abdollahi, M.R. Nutrition and Digestive Physiology of the Broiler Chick: State of the Art and Outlook. Animals 2021, 11, 2795. [Google Scholar] [CrossRef] [PubMed]
  75. Harrow, S.A.; Ravindran, V.; Butler, R.C.; Marshall, J.W.; Tannock, G.W. Real-Time Quantitative PCR Measurement of Ileal Lactobacillus salivarius Populations from Broiler Chickens To Determine the Influence of Farming Practices. Appl. Environ. Microbiol. 2007, 73, 7123–7127. [Google Scholar] [CrossRef] [PubMed] [Green Version]
  76. McBurney, W.; Tannock, G.; Ravindran, V. A culture-independent approach to the analysis of the gut microflora of broilers. Proc. Aust. Poult. Sci. Symp. 2003, 15, 131–134. [Google Scholar]
  77. Rinttilä, T.; Apajalahti, J. Intestinal microbiota and metabolites—Implications for broiler chicken health and performance. J. Appl. Poult. Res. 2013, 22, 647–658. [Google Scholar] [CrossRef]
  78. Joven, M.; Pintos, E.; Latorre, M.A.; Suárez-Belloch, J.; Guada, J.A.; Fondevila, M. Effect of replacing barley by increasing levels of olive cake in the diet of finishing pigs: Growth performances, digestibility, carcass, meat and fat quality. Anim. Feed. Sci. Technol. 2014, 197, 185–193. [Google Scholar] [CrossRef]
  79. Amer, M.M. REVIEW: Footpad dermatitis (FPD) in chickens. Korean J. Food Health Converg. 2020, 6, 11–16. [Google Scholar] [CrossRef]
  80. Swiatkiewicz, S.; Arczewska-Wlosek, A.; Jozefiak, D. The nutrition of poultry as a factor affecting litter quality and foot pad dermatitis—An updated review. J. Anim. Physiol. Anim. Nutr. 2017, 101, e14–e20. [Google Scholar] [CrossRef]
  81. Freeman, N.; Tuyttens, F.A.M.; Johnson, A.; Marshall, V.; Garmyn, A.; Jacobs, L. Remedying Contact Dermatitis in Broiler Chickens with Novel Flooring Treatments. Animals 2020, 10, 1761. [Google Scholar] [CrossRef]
  82. Choi, J.; Kim, W.K. Dietary Application of Tannins as a Potential Mitigation Strategy for Current Challenges in Poultry Production: A Review. Animals 2020, 10, 2389. [Google Scholar] [CrossRef] [PubMed]
  83. Heidemann Olsen, R.; Christensen, H.; Kabell, S.; Bisgaard, M. Characterization of prevalent bacterial pathogens associated with pododermatitis in table egg layers. Avian Pathol. 2018, 47, 281–285. [Google Scholar] [CrossRef] [PubMed]
  84. Saraiva, S.; Saraiva, C.; Stilwell, G. Feather conditions and clinical scores as indicators of broilers welfare at the slaughterhouse. Res. Vet. Sci. 2016, 107, 75–79. [Google Scholar] [CrossRef] [PubMed]
  85. Arnould, C.; Butterworth, A.; Knierim, U. Standardisation of clinical scoring in poultry. In Assessment of Animal Welfare Measures for Layers and Broilers; Forkman, B., Keeling, L., Eds.; School of City and Regional Planning, Cardiff University: Cardiff, UK, 2009; pp. 7–30. ISBN 978-1-902647-79-1. [Google Scholar]
  86. Grimes, J.L.; Smith, J.; Williams, C.M. Some alternative litter materials used for growing broilers and turkeys. World’s Poult. Sci. J. 2002, 58, 515–526. [Google Scholar] [CrossRef]
  87. Kaukonen, E.; Norring, M.; Valros, A. Effect of litter quality on foot pad dermatitis, hock burns and breast blisters in broiler breeders during the production period. Avian Pathol. 2016, 45, 667–673. [Google Scholar] [CrossRef] [PubMed] [Green Version]
  88. Mayne, R.K. A review of the aetiology and possible causative factors of foot pad dermatitis in growing turkeys and broilers. World’s Poult. Sci. J. 2005, 61, 256–267. [Google Scholar] [CrossRef]
  89. de Jong, I.C.; Gunnink, H.; van Harn, J. Wet litter not only induces footpad dermatitis but also reduces overall welfare, technical performance, and carcass yield in broiler chickens. J. Appl. Poult. Res. 2014, 23, 51–58. [Google Scholar] [CrossRef]
  90. Göransson, L.; Yngvesson, J.; Gunnarsson, S. Bird Health, Housing and Management Routines on Swedish Organic Broiler Chicken Farms. Animals 2020, 10, 2098. [Google Scholar] [CrossRef]
  91. Kheravii, S.K.; Morgan, N.K.; Swick, R.A.; Choct, M.; Wu, S.-B. Roles of dietary fibre and ingredient particle size in broiler nutrition. World’s Poult. Sci. J. 2018, 74, 301–316. [Google Scholar] [CrossRef]
  92. Farran, M.T.; Pietsch, M.; Chabrillat, T. Effect of lignocellulose on the litter quality and the ready to cook carcass yield of male broilers. In Proceedings of the Actes des 10èmes Journées de la Recherche Avicole et Palmipèdes à Foie Gras, La Rochelle, France, 26–28 March 2013; pp. 917–921. [Google Scholar]
  93. Bogusławska-Tryk, M.; Szymeczko, R.; Piotrowska, A.; Burlikowska, K.; Śliżewska, K. Ileal and Cecal Microbial Population and Short-Chain Fatty Acid Profile in Broiler Chickens Fed Diets Supplemented with Lignocellulose. Pak. Vet. J. 2015, 35, 212–216. [Google Scholar]
  94. Milošević, N.; Đukić Stojčić, M.; Perić, L.; Vukić-Vranješ, M. Effect of lignocellulose on egg production and egg quality. In Proceedings of the 20th European Symposium on Poultry Nutrition, Prague, Czech Republic, 24–27 August 2015; p. P-046. [Google Scholar]
  95. Kheravii, S.K.; Swick, R.A.; Choct, M.; Wu, S.-B. Coarse particle inclusion and lignocellulose-rich fiber addition in feed benefit performance and health of broiler chickens. Poult. Sci. 2017, 96, 3272–3281. [Google Scholar] [CrossRef] [PubMed]
  96. Musch, M.W.; Bookstein, C.; Xie, Y.; Sellin, J.H.; Chang, E.B. SCFA increase intestinal Na absorption by induction of NHE3 in rat colon and human intestinal C2/bbe cells. Am. J. Physiol. Gastrointest. Liver Physiol. 2001, 280, G687–G693. [Google Scholar] [CrossRef] [PubMed] [Green Version]
  97. Gupta, N.; Martin, P.M.; Prasad, P.D.; Ganapathy, V. SLC5A8 (SMCT1)-mediated transport of butyrate forms the basis for the tumor suppressive function of the transporter. Life Sci. 2006, 78, 2419–2425. [Google Scholar] [CrossRef] [PubMed]
  98. Cherrington, C.A.; Hinton, M.; Mead, G.C.; Chopra, I. Organic Acids: Chemistry, Antibacterial Activity and Practical Applications. In Advances in Microbial Physiology; Elsevier: Amsterdam, The Netherlands, 1991; Volume 32, pp. 87–108. ISBN 978-0-12-027732-2. [Google Scholar]
  99. van der Wielen, P.W.J.J.; Biesterveld, S.; Notermans, S.; Hofstra, H.; Urlings, B.A.P.; van Knapen, F. Role of Volatile Fatty Acids in Development of the Cecal Microflora in Broiler Chickens during Growth. Appl. Environ. Microbiol. 2000, 66, 2536–2540. [Google Scholar] [CrossRef]
  100. Michalak, M.; Pierzak, M.; Kręcisz, B.; Suliga, E. Bioactive Compounds for Skin Health: A Review. Nutrients 2021, 13, 203. [Google Scholar] [CrossRef]
  101. Anunciato, T.P.; da Rocha Filho, P.A. Carotenoids and polyphenols in nutricosmetics, nutraceuticals, and cosmeceuticals: Nutricosmetics. J. Cosmet. Dermatol. 2012, 11, 51–54. [Google Scholar] [CrossRef]
  102. Nichols, J.A.; Katiyar, S.K. Skin photoprotection by natural polyphenols: Anti-inflammatory, antioxidant and DNA repair mechanisms. Arch. Dermatol. Res. 2010, 302, 71–83. [Google Scholar] [CrossRef] [Green Version]
  103. Zillich, O.V.; Schweiggert-Weisz, U.; Eisner, P.; Kerscher, M. Polyphenols as active ingredients for cosmetic products. Int. J. Cosmet. Sci. 2015, 37, 455–464. [Google Scholar] [CrossRef]
  104. Haslam, S.M.; Knowles, T.G.; Brown, S.N.; Wilkins, L.J.; Kestin, S.C.; Warriss, P.D.; Nicol, C.J. Factors affecting the prevalence of foot pad dermatitis, hock burn and breast burn in broiler chicken. Br. Poult. Sci. 2007, 48, 264–275. [Google Scholar] [CrossRef] [Green Version]
  105. Hocking, P.M.; Wu, K. Traditional and commercial turkeys show similar susceptibility to foot pad dermatitis and behavioural evidence of pain. Br. Poult. Sci. 2013, 54, 281–288. [Google Scholar] [CrossRef] [PubMed]
  106. Videnska, P.; Sedlar, K.; Lukac, M.; Faldynova, M.; Gerzova, L.; Cejkova, D.; Sisak, F.; Rychlik, I. Succession and Replacement of Bacterial Populations in the Caecum of Egg Laying Hens over Their Whole Life. PLoS ONE 2014, 9, e115142. [Google Scholar] [CrossRef] [PubMed] [Green Version]
  107. Yan, W.; Sun, C.; Yuan, J.; Yang, N. Gut metagenomic analysis reveals prominent roles of Lactobacillus and cecal microbiota in chicken feed efficiency. Sci. Rep. 2017, 7, 45308. [Google Scholar] [CrossRef] [PubMed] [Green Version]
  108. Sarıca, S.; Ürkmez, D. The use of grape seed-, olive leaf- and pomegranate peel-extracts as alternative natural antimicrobial feed additives in broiler diets. Eur. Poult. Sci. 2016, 80, 121. [Google Scholar]
  109. Amini, Z.; Parsaei, S.; Houshmand, M.; Naghiha, R. Effect of Olive leaf powder on performance and ileal bacteria count of broilers. Vet. Res. Forum. 2019, 10, 255–259. [Google Scholar] [CrossRef]
  110. García-Ruiz, A.; Bartolomé, B.; Martínez-Rodríguez, A.J.; Pueyo, E.; Martín-Álvarez, P.J.; Moreno-Arribas, M.V. Potential of phenolic compounds for controlling lactic acid bacteria growth in wine. Food Control 2008, 19, 835–841. [Google Scholar] [CrossRef]
  111. Alizadeh, M.; Shojadoost, B.; Astill, J.; Taha-Abdelaziz, K.; Karimi, S.H.; Bavananthasivam, J.; Kulkarni, R.R.; Sharif, S. Effects of in ovo Inoculation of Multi-Strain Lactobacilli on Cytokine Gene Expression and Antibody-Mediated Immune Responses in Chickens. Front. Vet. Sci. 2020, 7, 105. [Google Scholar] [CrossRef] [Green Version]
  112. Syed, M.A.; Ullah, H.; Tabassum, S.; Fatima, B.; Woodley, T.A.; Ramadan, H.; Jackson, C.R. Staphylococci in poultry intestines: A comparison between farmed and household chickens. Poult. Sci. 2020, 99, 4549–4557. [Google Scholar] [CrossRef]
  113. Videnska, P.; Rahman, M.M.; Faldynova, M.; Babak, V.; Matulova, M.E.; Prukner-Radovcic, E.; Krizek, I.; Smole-Mozina, S.; Kovac, J.; Szmolka, A.; et al. Characterization of Egg Laying Hen and Broiler Fecal Microbiota in Poultry Farms in Croatia, Czech Republic, Hungary and Slovenia. PLoS ONE 2014, 9, e110076. [Google Scholar] [CrossRef]
  114. Liehr, M.; Mereu, A.; Pastor, J.J.; Quintela, J.C.; Staats, S.; Rimbach, G.; Ipharraguerre, I.R. Olive oil bioactives protect pigs against experimentally-induced chronic inflammation independently of alterations in gut microbiota. PLoS ONE 2017, 12, e0174239. [Google Scholar] [CrossRef] [Green Version]
  115. Stanley, D.; Geier, M.S.; Chen, H.; Hughes, R.J.; Moore, R.J. Comparison of fecal and cecal microbiotas reveals qualitative similarities but quantitative differences. BMC Microbiol. 2015, 15, 51. [Google Scholar] [CrossRef] [PubMed]
Figure 1. Alpha-diversity boxplots across dietary treatment groups (CON, OP3, OP6) of day 13 (D13; onset of the experiment), 27 (D27), and 41 (D41) chickens. Richness was estimated using the Observed, Chao1, and ACE indices. Evenness was estimated using the Shannon, Simpson, Inverse Simpson, and Fisher indices. No significant differences were found between any of the treatment groups using the Kruskal-Wallis non-parametric test.
Sustainability 15 00501 g001
Figure 2. Principal coordinate analysis (PCoA) based on the Bray-Curtis distance matrix of chicken fecal microbiota by age; on day 13 (onset of the experiment), 27 and 41 chickens (A), and by dietary treatment; chickens fed with OP3% (OP3), OP6% (OP6), and control group (CON) (B). Statistical significance determined by ANOSIM is indicated in each plot.
Sustainability 15 00501 g002
Figure 3. Microbial community composition. Bar charts showing the relative abundance of the most predominant microbial phyla (A) and genera (B), in fecal samples, in each dietary treatment group and time point. Heatmap analysis of the relative abundance of the top microbial phyla (C) and genera (D) in the feces of day 13, 27 and 41 chickens, in each dietary treatment group.
Sustainability 15 00501 g003
Figure 4. The phylogenetic tree of the species was found to be differentially abundant between the groups CON and 3% (A), and 6% (B) OP dietary treatments, at 41-day fecal samples. The differentially abundant species’ names are shown. The final node’s size is proportional to the p-value for the corresponding species. The color of the node denotes the group in which the differentially abundant species are more abundant. Clades with different colors correspond to different families.
Sustainability 15 00501 g004
Table 1. Formulation and nutrient composition of diets containing Olive Pulp (OP) compared with the Control diet (CON).
Grower
(13–20 Days of Age)
Finisher 1
(21–32 Days of Age)
Finisher 2
(33–41 Days of Age)
ItemsCONOP3OP6CONOP3OP6CONOP3OP6
Ingredients
Wheat36.39533.61530.95540.9538.10535.3544.8742.13539.28
Corn252525252525252525
Soya meal31.331.431.4726.4326.5826.7222.3322.4322.6
Olive pulp036036036
Sunflower oil4.13.93.64.94.74.455.154.94.7
MCP *0.420.420.430.2150.220.220.1850.190.195
Premix 10.40.40.40.40.40.40.40.40.4
Limestone1.050.930.80.860.740.610.90.780.66
NaCl0.280.280.280.280.280.280.280.280.28
Methionine0.350.340.350.30.30.30.250.250.25
Lysine0.260.270.270.240.250.250.240.240.24
Threonine0.150.150.150.1350.1350.1350.110.110.11
RONOZYME® HiPhos0.020.020.020.0150.0150.0150.010.010.01
Mycotoxins Binder0.20.20.20.20.20.20.20.20.2
Coccidiostat0.050.050.050.050.050.050.050.050.05
Antioxidant0.0150.0150.0150.0150.0150.0150.0150.0150.015
Xylanase0.010.010.010.010.010.010.010.010.01
Total100100100100100100100100100
Chemical analysis
Crude protein (%)20.77420.820.83318.98519.00319.00817.4917.5217.57
Crude fiber (%)2.753.454.152.653.354.052.573.273.91
Fat (%)5.956.156.256.756.957.17.017.157.25
Ash (%)4.764.84.854.124.184.223.933.984.04
Calculated analysis
ME (kcal/kg)290129032903299329982999304030423044
Lysine (%)1.2561.2591.2541.1171.121.1181.0131.0091.075
Methionine (%)0.6520.6490.6480.5790.5760.5770.5110.5090.507
Ca (%)0.630.6310.630.5150.5160.5140.5140.5160.517
P (%)0.4620.4610.460.3980.3970.3970.3770.3760.375
Na (%)0.120.120.120.120.120.120.120.120.12
1 Premix Finisher contains (per kg of product): Vitamin A, 2,500,000 IU; vitamin D3, 1,250,000 IU; vitamin E, 20,000 mg; vitamin K3, 1500 mg; biotin, 35,000 mcg; folic acid, 300 mg; vitamin B1, 1500 mg; vitamin B2, 1500 mg; vitamin B6, 750 mg; vitamin B12, 6000 mcg; niacinamide, 7500 mg; calcium D-pantothenate, 3750 mg; choline chloride, 150,000 mg; carbonate (siderite), 12,500 mg; cooper as copper sulphate pentahydrate, 2500 mg; manganic oxide, 27,500 mg; zinc oxide, 20,000 mg; calcium iodate anhydrous, 300 mg; coated granulated sodium selenite, 75 mg; citric acid, 14 mg; orthophosphoric acid, 3.50 mg; butylhydroxytoluene (BHT), 35 mg; butylated hydroxyanisole (BHA), 8.75 mg; calcium carbonate, 55.90%; calcium, 22.21%; phosphorous, 0.01%. * MCP: Monocalcium Phosphate.
Table 2. Growth performance of broilers fed the control and diets containing different levels of OP. Data are presented as mean ± SE.
CONOP3OP6
Body weight (g)
Day 13428.61 ± 2.34426.39 ± 2.87429.03 ± 2.88
Day 20873.33 ± 8.18 a809.86 ± 9.70 b812.22 ± 12.45 b
Day 271346.67 ± 17.52 a1276.11 ± 19.00 b1350.71 ± 19.51 a
Day 341943.75 ± 33.79 a1791.94 ± 32.70 b1879.00 ± 30.56 ab
Day 412604.44 ± 37.062492.78 ± 38.792531.32 ± 45.67
Body weight gained (g)
13–20 d444.72 ±7.51 a383.47 ± 5.47 b383.19 ± 18.51 b
21–27 d473.33 ±18.28466.25 ± 18.19537.17 ± 18.34
28–34 d597.08 ± 24.81515.83 ± 35.63530.34 ± 37.26
35–41 d660.69 ± 30.21700.83 ± 19.14649.41 ± 34.54
Total period (13–41 d)543.96 ± 28.25516.60 ± 36.37525.03 ± 31.00
Feed consumption (g)
13–20 d754.58 ± 31.28825.00 ± 58.21845.28 ± 18.55
21–27 d1062.50 ± 25.09 a1462.36 ± 86.81 b1472.16 ± 102.20 b
28–34 d1274.03 ± 11.401483.47 ± 55.251567.12 ± 122.41
35–41 d2155.69 ± 37.29 a1501.53 ± 66.77 b1627.97 ± 67.16 b
Total period (13–41 d)1311.70 ± 157.571318.09 ± 90.681378.13 ± 101.30
FCR
13–20 d1.70 ± 0.052.16 ± 0.182.22 ± 0.11
21–27 d2.25 ± 0.053.16 ± 0.312.75 ± 0.25
28–34 d2.14 ± 0.09 a2.91 ± 0.28 ab2.96 ± 0.11 b
35–41 d3.27 ± 0.09 a2.14 ± 0.09 b2.51 ± 0.03 c
Total period (13–41 d)2.34 ± 0.182.59 ± 0.172.61 ± 0.11
a,b,c Means within a raw at a particular age with different superscripts differ significantly (p < 0.05).
Table 3. Percentage of broilers observed in the 3 dietary treatments (CON, OP3, OP6) scoring for welfare parameters (feather cleanliness, foot pad dermatitis, hock burn) at the age of 34 and 41 days of their life.
Day 34Day 41
ScoreCONOP3OP6CONOP3OP6
Feather cleanliness 1
036.1161.1151.4313.89 a47.22 b50.00 b
144.4438.8948.5747.2238.8944.12
219.44 a0.00 b0.00 b36.11 a13.89 ab5.88 b
3---2.7800
Foot pad dermatitis 2
047.22 a91.67 b82.86 b41.67 a86.11 b 79.41 b
127.78 a5.56 b2.86 b13.8911.118.82
222.22 a2.78 b8.57 ab25.00 a2,78 b2.94 b
32.780.005.7116.67 a0 b2.94 ab
4---2.7805.88
Hock burn 3
097.2294.4410094.4491.6797.06
12.782.7805.562.782.94
2---02.780
3------
402.78002.780
a,b Means within a raw at a particular age (Day 34, Day 41) for each score category 0-4 with different superscripts differ significantly (p < 0.05). 1 Feather cleanliness: Score 0: indicates completely clean feathers; Score 1: indicates slight feather soiling; Score 2: indicates moderate feather soiling and Score 3: indicates severe feather soiling; 2 Footpad dermatitis: Score 0: indicates no evidence of FPD, Score 1 & 2: indicate minimal evidence of FPD, Score 3 & 4: indicate evidence of FPD; 3 Hock burn: Score 0: indicates no evidence of Hock burn, Score 1 & 2: indicate minimal evidence of Hock burn, Score 3 & 4: indicate evidence of Hock burn.
Table 4. Percentage of broilers observed in the 3 dietary treatments (CON, OP3, OP6) scoring for qualitative behavior characteristics (active, fearful, depressed, calm, bored, friendly and feeding behavior at the age of 34 and 41 days of their life.
Quality Behavior TraitsDay 34Day 41
CONOP3OP6CONOP3OP6
Active19.4430.5622.2216.672530.55
Fearful000000
Depressed000000
Calm63.8955.5561.1172.2252.7852.78
Bored002.78000
Friendly02.78002.780
Feeding16.6711.1113.8911.1119.4416.67
No significant differences were detected among groups (p > 0.05).
Disclaimer/Publisher’s Note: The statements, opinions and data contained in all publications are solely those of the individual author(s) and contributor(s) and not of MDPI and/or the editor(s). MDPI and/or the editor(s) disclaim responsibility for any injury to people or property resulting from any ideas, methods, instructions or products referred to in the content.

