

Analysis of the Evolution of Mangrove Landscape Patterns and Their Drivers in Hainan Island from 2000 to 2020

School of Tourism, Hainan University, Haikou 570228, China
*
Author to whom correspondence should be addressed.
Sustainability 2023, 15(1), 759; https://0-doi-org.brum.beds.ac.uk/10.3390/su15010759
Submission received: 20 November 2022
/
Revised: 30 December 2022
/
Accepted: 30 December 2022
/
Published: 31 December 2022
(This article belongs to the Special Issue Sustainable Forest Management and Natural Hazards Prevention)
Abstract
:The ecological services provided by mangroves are of great value and significance in regard of the achievement of the major strategic goals of carbon neutrality and the carbon peak. Here, we first evaluated the uses of five machine learning methods combined with Sentinal-2A data band features to identify and extract mangrove forests in Dongzhai Harbor, northeast Hainan Province, China. Then, the XGBoost algorithm with the highest accuracy was selected to identify and extract information on mangrove forests on Hainan Island, focusing on five periods from 2000 to 2020. The landscape pattern index, dynamic attitude model, and mathematical statistics were integrated to analyze trends over this 20-year period. The results revealed the following: (1) The total mangrove landscape area of Hainan Island between 2000 and 2020 showed a trend of first decreasing and then increasing. In the past 20 years, the mangrove area has increased by 1315.75 ha, with an annual change rate of 65.79 ha/a. (2) From 2000 to 2020, the mangroves in Hainan Island were characterized by increased fragmentation, increased heterogeneity, decreased connectivity, and increased richness, while proportion of each landscape type tends to be equilibrated. (3) Natural factors such as the annual average temperature in the study area were the main factors driving the large-scale reduction in mangroves and the deepening of landscape fragmentation, followed by human factors, and the impact of macro-policies cannot be ignored. The results of this study can provide a significant reference for future remote sensing data extraction from mangrove forests and their ecological protection and restoration on Hainan Island.
1. Introduction
Mangroves are woody plant communities that grow in coastal intertidal zones or river mouths in tropical and subtropical regions, where they are subject to periodic seawater inundation [1]. They are significant to protect the ecological environments of coastal zones and maintaining biodiversity. Since the 1950s, global climate change and anthropogenic disturbances have caused serious damage to mangroves, and the external environment for mangrove growth has been changing in tandem with this process, thereby accelerating the community succession and the species degradation, directly reducing the productivity of mangroves, and substantially reducing their biological effectiveness [2], rendering them incapable of fulfilling their ecological service functions. Among the factors affecting mangrove growth, human disturbance mainly includes felling and agricultural reclamation [3]. The effects of climate change on mangroves are mainly caused by tropical cyclones [4], unusually high temperatures and temperature-induced pests and diseases [5]. Some scholars have also suggested that the degree to which the distribution of mangrove forests will be impacted by climate change depends on the dispersal and establishment of sea-faring propagule, which drives forest rejuvenation, gene flow, and range expansion [6]. Accordingly, the conservation and monitoring of mangrove coverage areas has become an increasingly imperative task [7,8,9].
Currently, there are two main ways to monitor mangrove coverage—traditional surveys and remote sensing. Although the traditional method can obtain more accurate data and realistic results, tidal variations and the inaccessibility of mangrove areas makes it time-consuming and laborious; hence, remote sensing has emerged as an effective alternative method to reliably monitor mangrove coverage. Lorenzo [10] first applied remote sensing technology to monitoring the dynamics of mangroves in the 1970s, and great advances have been made since then. Numerous studies has applied high resolution remote sensing and unmanned aerial vehicle dataset [11,12] to extract mangrove-related parameters from different regions via different classification techniques [13,14,15]. Many scholars in China and abroad have studied the spatial and temporal distribution characteristics of mangrove in the same areas at different times through the use of Landsat images [16,17,18]. In addition, other researchers have further used landscape pattern indices to study changes to landscape patterning [19,20,21]. The analysis of landscape patterns is a prerequisite for studying dynamic changes to a landscape [22,23]. In this respect, the analysis and study of the spatiotemporal evolution of mangrove landscape patterns can enable the visual representation of land use changes [24], which can better reveal the evolution patterns of mangroves and their complexity and interrelationships under the influence of various factors. With the development of remote sensing technology, artificial intelligence, image processing, and other fields of research, scientists have introduced machine learning algorithms (e.g., decision trees and random forests) to extract and classify mangrove communities more efficiently and accurately [25,26]. Although great progress has been achieved in the use of remote sensing monitoring technology in the study of mangroves over the past 40 years, in terms of both theoretical and applied aspects, the spatial distributions of mangrove species are intricate and complex, their patches are fragmented and fine-grained, and the accuracy of the extraction of mangrove coverage area data using traditional remote sensing images is limited. However, high-spatial-resolution remote sensing satellites can make up for the shortcoming of the low spatial resolution of traditional remote sensing images and can effectively extract the spatial distributions of mangroves through the use of hyperspectral and LiDAR. Some scholars have concluded that Sentinel-2A image data have a good estimation accuracy in relation to the mangrove leaf area index [27]. In the complete remote sensing mapping of coastal wetlands including mangroves in Guangdong, Guangxi and Hainan presented in 2020 [28], Zhou and Xu [20,29]mentioned that using sentinel-2A data as a data source for mangrove landscape patterns can result in better performance in extracting information about mangroves. Madhuri R [30] also reported that Sentinel-2A images showed better performance in comparison to Landsat 8 OLI images, because of their higher spatial resolution. However, few studies have combined machine learning with sentinel data band features to extract mangrove coverage area data.
By reviewing the related research findings, we found that although scholars have used the same datasets and classification methods to identify mangrove species, differences in accuracy persisted, implying that the use of machine learning to identify mangroves was not universally applicable, and more suitable algorithms are needed, in combination with the use of different regional environments. The contemporary research on mangrove forests in Hainan Island, China, can be divided into three types: national-scale studies containing Hainan Island [31,32], multi-province-scale studies containing Hainan Island [33,34] and some regions of Hainan Island such as DongZhai Harbor [35] and Qinglan Harbor [36]. Evidently, there is a lack of island-wide and longer-time-series research on the spatiotemporal evolution and driving forces of mangrove landscape patterns on Hainan Island. Therefore, it is necessary to explore the changes in mangrove landscape patterns and their causes on Hainan Island. Under the dual carbon target strategy, the ecological service value of mangroves cannot be ignored, and it is of great practical significance to reveal the dynamic change-trends of mangroves. Therefore, based on Sentinel-2A and Landsat datasets, in this study we applied five machine-learning algorithms to identify mangrove species and compared the extraction accuracy. We selected the machine-learning algorithm with the highest extraction accuracy vis à vis the actual situation in Hainan, and we applied it to extract mangrove coverage areas from five temporal periods from 2000 to 2020. The mangrove landscape pattern changes over these 20 years were analyzed using the landscape pattern index, dynamic attitude modeling, and gray correlation, and the driving factors were investigated to provide a scientific basis for the conservation and ecosystem restoration of mangroves in Hainan Island.
2. Overview of the Study Area
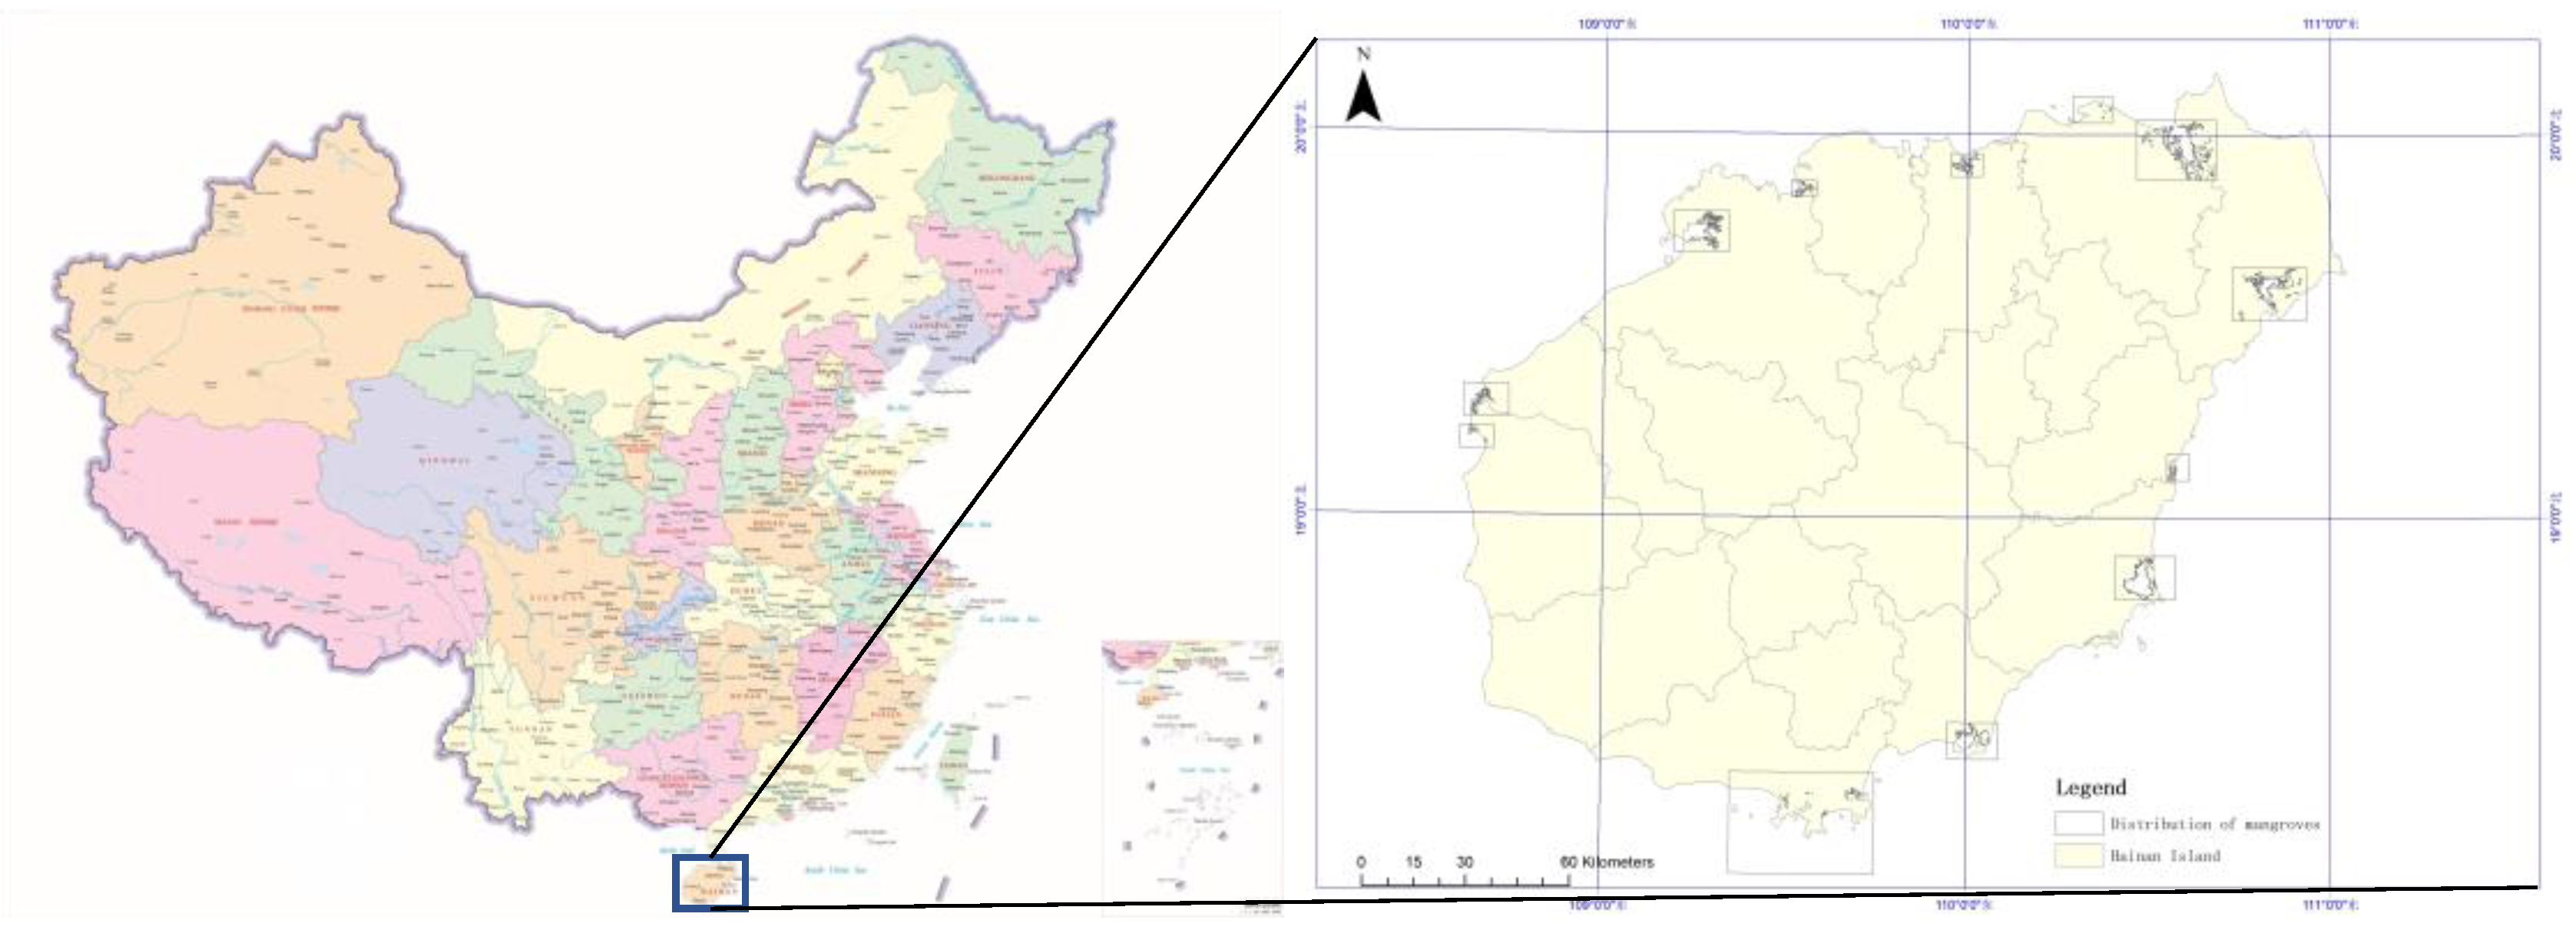
The study area was Hainan Island (Figure 1). The highest elevation of Wuzhi Mountain in the middle is 1867 meters, which is the center of the whole island, which gives way to mountains, hills, terraces, and plains as one descends to the coastline. The geological structure of the island is complex given its complicated geological evolutionary process. At the same time, there is sufficient precipitation in Hainan Island and it has a circular distribution: the average annual precipitation is 1640 mm. In the middle of Hainan Island, high terrain surrounded by low terrain has formed a number of large and small rivers, showing the characteristics of a radial water system. Hainan Island has a tropical monsoon oceanic climate, with an average annual temperature of 22.5–25.6 °C and 1780–600 annual sunshine hours.
3. Data Sources and Feature Extraction Principles
3.1. Data Sources
In this study, we selected Sentinel-2 data as a data source for the comparison of the accuracy of multiple machine learning approaches. Sentinel-2 is a high-resolution multispectral imaging satellite, with optical data in the only available set containing three bands in the red-edge range for the effective monitoring of vegetation health information. Compared with Landsat data, Sentinel-2 data have a resolution of 10 m in the B2 (B), B3 (G), B4 (R), and B8 (NIR) bands and 20 m in the remaining bands, whereas Landsat data have a resolution of 30 m. Hence, Sentinel-2 data are better able to characterize the vegetation in the study area at a fine scale. Remote sensing image information is shown in Table 1. The Landsat series of satellite data used in the study were downloaded from the USGS website (http://earthexplorer.usgs.gov) and the Sentine-2A data were obtained from the ESA website (https://scihub.copernicus.eu/). We selected remote sensing images from the months of May–September, and selected a study area that was cloud-free or with cloud coverage of less than 5% to prevent misclassifications and omissions due to cloud interference, so that we could obtain accurate mangrove information.
3.2. Data Pre-Processing
Atmospheric correction was performed on the Sentinel-2A dataset [37]. After this correction, B8A, B11, and B12 were selected for band combination, to better convey vegetation growth and soil moisture information, among other factors. We created a training camp, selecting all categories and at least 10 times the number of training samples for feature dimension classification studies in order to improve the accuracy of mangrove area extraction for the classification study. The Sentinel-2A data were changed by means of the tasseled cap transformation [38] to obtain humidity images and were fused with band combination image. The Jeffries–Matusita (J–M) distance can represent the separability between features, as shown in Table 2, with the J m distance between mangroves and non-mangroves indicating that the separability was good and thus able to meet the requirements of the classification experiments.
3.3. Principle of Feature Extraction
Because the B8A, B11, and B12 bands of the Sentinel-2A data were more sensitive to vegetation and wetlands, we could use them to extract information on large mangrove areas more accurately than other bands [39]. To further improve the extraction accuracy of mangrove data, the normalized difference vegetation index (NDVI), humidity, and texture features were taken into account in the classification process. Some studies have shown that measurements of humidity improve the classification accuracy of mangrove extraction [40]. NDVI was obtained using the B4 and B8 bands; humidity was obtained by means of tassel cap variation; and texture features were based on a grayscale co-occurrence matrix, with homogeneity, entropy, contrast, difference, angular second-order moments, and mean and standard deviation (containing 0°, 45°, 90°, and 135°) were selected as the basis for the classification of texture features. In summary, a total of 16 features were chosen, namely, five spectral features, three exponential features, and eight texture features. A total of 450 sample points were randomly generated and visually interpreted using 0.5 m Google Earth images, of which 240 were set aside as training samples (with an average area of about 1000 m2 and a minimum area of ≥300 m2) and 210 served as test samples.
4. Research Methodology
4.1. Machine-Learning Algorithms
At present, conventional machine-learning algorithms such as support vector machines and random forest algorithms have been used in the literature. To determine the best machine-learning algorithm for extracting mangrove areas in Hainan Island, a comparative study of Catboost, XGBoost, and AdaBoost, representing new machine learning algorithms and models, was conducted. Five machine-learning algorithms—CatBoost, XGBoost, AdaBoost, random forest classification, and a support vector machine model—were used to test their extraction accuracy. According to their respective performance, we selected the most suitable method to determine mangrove forest coverage areas in Hainan Island.
4.1.1. CatBoost
The traditional gradient enhancement process for sample gradient calculation depends on the sample’s own CatBoost results, which effectively avoids the prediction offset and reduces overfitting. In terms of its parameter settings, Cat Boost sets iterations = 200, depth = 8, and learning rate = 0.05.
4.1.2. XGBoost
XGBoost is a fast implementation of Gradient Boosting algorithm, which can make full use of multi-core CPUs for parallel computation, while improving the algorithm to improve overall accuracy [41]. The basic idea of the XGBoost algorithm is to first establish a base classifier/regressor and gradually add a new classifier/ egressor [42]. In this study, XGBoost algorithm parameters eta = 0.3, max_depth = 6, gamma = 0 and Colsample_by = 1.
4.1.3. AdaBoost
AdaBoost is an iterative algorithm of the boosting type. The final result is obtained via the weighted averaging of the learners [43]. In this study, the number of base estimators was 150, the learning rate was 0.05, and the loss function was linear.
4.1.4. Random Forest (RF)
Random forest is an ensemble learning algorithm based on decision trees, which combines multiple decision trees via the use of a bagging model [44]. In this study, we set the number of trees (n_estimators) to 150, the maximum number of features (max_features) to the square root of the number of features, and the maximum depth (max_depth) to 16.
4.1.5. Support Vector Machine (SVM)
A support Vector Machine is a classical machine learning algorithm theory proposed by Corinna Cortes and Vladimir Vapnik in the 1990s [45]. In this study, the parameter settings were Degree = 3, Cost = 10, and Gamma = 0.3.
In order to evaluate the effectiveness and correctness of machine-learning classification results, a confusion matrix and Kappa coefficient are usually used as accuracy evaluation indexes. The confusion matrix is a two-dimensional matrix, which takes the real surface category as each column and the actual classification category as each row. It is used to represent the correspondence between the classification category and the real surface category. It is a format for the evaluation of classification accuracy. Based on the confusion matrix, producer accuracy (PA), user accuracy (UA), and the kappa coefficient can be calculated.
Producer accuracy refers to the proportion of correctly classified pixels in the number of pixels that actually belong to this class. That is,
User accuracy refers to the proportion of the number of correctly classified pixels in the number of pixels divided into this class. That is,
Kappa coefficient is an important index used to evaluate the consistency and credibility of classification results. Compared with the overall accuracy, the kappa coefficient is more objective and can estimate the influence of different categories. That is,
The value range of the kappa coefficient is from 0 to 1, and the meanings of different values are presented in Table 3.
4.2. Landscape Pattern Index
The landscape pattern index can be used to refine landscape pattern information, and this is a common method to study landscape pattern change information and change rules in landscape ecology [46]. In this study, the mean patch area (MPS), number of patches (NP), patch density (PD), and landscape shape index (LSI) were used to characterize individual units of the landscape; the mean patch fractional dimensionality (FRAC) and aggregation (COHESION) were used to present the spatial configuration of landscape components; and the Shannon evenness index (SHEI) and Shannon diversity index (SHDI) were used to show the overall landscape. These are proven indicators of a landscape’s spatial pattern [47]. After deriving the indicators, Fragstates 4.4 was used to calculate the landscape pattern index and analyze the landscape pattern change characteristics at five time points.
4.3. Dynamic Attitude Model
The dynamic attitude can quantitatively reveal the rate of change in mangroves and is used for comparative analysis of differences and trends in mangrove changes [48]. The formula is as follows:
where K is the mangrove kinetic attitude over a timeframe. and represent the mangrove area at the start and end of the time period, respectively; T is the duration of the study.
4.4. Gray Correlation Analysis
Gray correlation analysis is a statistical analysis technique used primarily to analyze how closely parent and child factors are related in a system, so as to determine the primary and secondary factors that cause changes in the development of that system [49].
Here, r denotes for , the gray correlation; r is the value for , the number of correlation coefficients; and the discrimination coefficient is 0.5. The closer the gray correlation is to 1, the stronger the correlation is.
To quantify the drivers of change in the mangrove landscape patterns of Hainan Island, referring to the relevant studies and considering collectability of indicator data, on the basis of the relevant studies, we selected eight indicators, including population, gross regional product, gross fishery product, and mean annual temperature [50,51].
5. Results and Analysis
5.1. Comparing the Data Extraction Accuracy of Different Machine-Learning Algorithms
Five machine-learning algorithms were used to extract mangrove vegetation information from DongZhai Harbor, and their user-accuracy and production-accuracy values are presented in Table 4. The highest accuracy was attained by the XGBoost algorithm at 93.60%, followed by the AdaBoost algorithm at 87.45%, with the latter being prone to identifying certain vegetation areas with high humidity as mangroves, leading to its lower classification accuracy. Among the algorithms, XGBoost had a superior classification effect and displayed the lowest error in mangrove data extraction. The extraction results were verified using field survey results from the marine geological survey center of China geological survey of Haikou. In conclusion, the XGBoost algorithm exhibited the best classification effect, which was consistent with the actual situation in Hainan; hence, it was used as a classifier for the extraction of mangrove area data in Hainan Island.
5.2. Attitudinal Changes in Mangrove Forests of Hainan Island
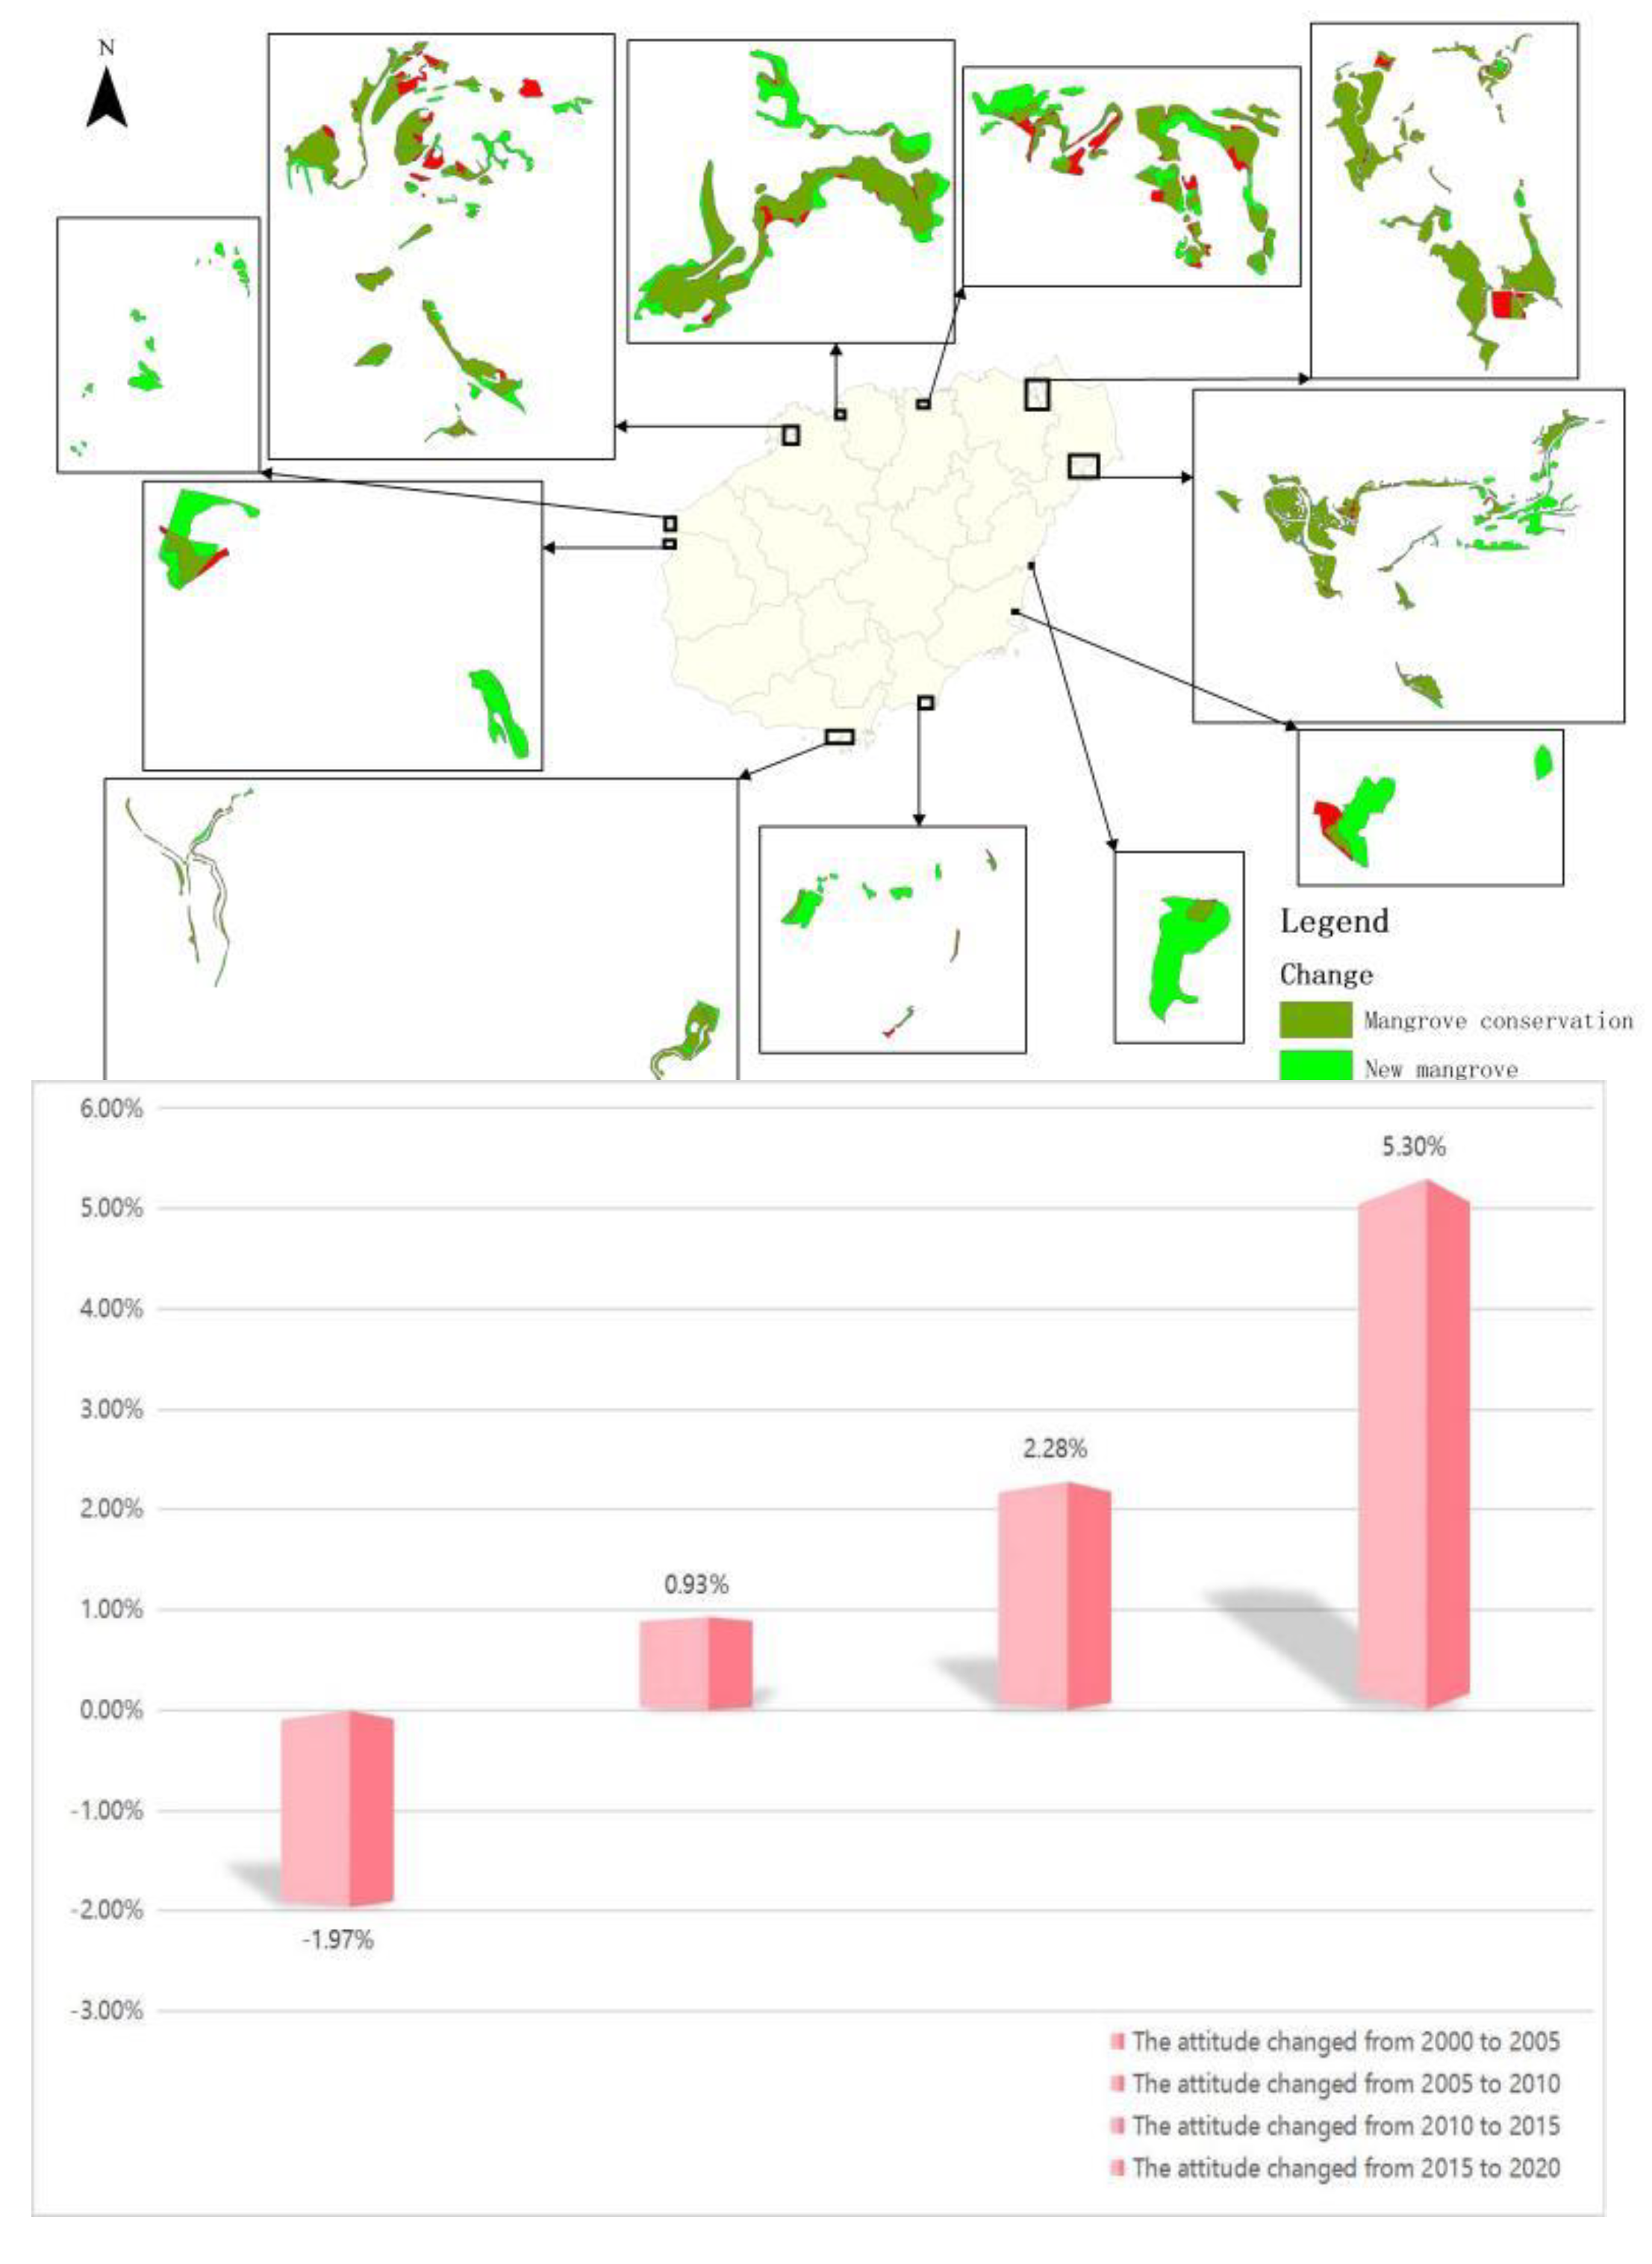
The mangrove extraction results for the five temporal periods and their dynamic attitude changes in Hainan Island from 2000 to 2020 are shown in Figure 2.
From 2000 to 2020, the mangrove area of Hainan Island showed an overall growth trend, initially decreasing and then increasing. From 2000 to 2005, the mangrove area shrunk by 393.87 ha, corresponding to a reduction of 1.97%, and then increased yearly, reaching 5312.25 ha in 2020. Overall, the mangrove area of Hainan Island experienced some fluctuations, linear growth, and undulating growth phases throughout the study period, with a total increase of 1315.75 ha or 24.77% relative to 2000, corresponding to a pronounced growth trend.
Mangrove forests on Hainan Island are mostly naturally distributed on the mudflats of coastal estuaries and harbors in Hainan Province [52]. The mangroves in the eastern and northern regions featured the same spatial variation characteristics and trends in their total area as the mangroves of Hainan Island. By contrast, mangroves in the western and southern regions expanded continuously, increasing by 168.58 ha and 108.17 ha, respectively, over the 20 years.
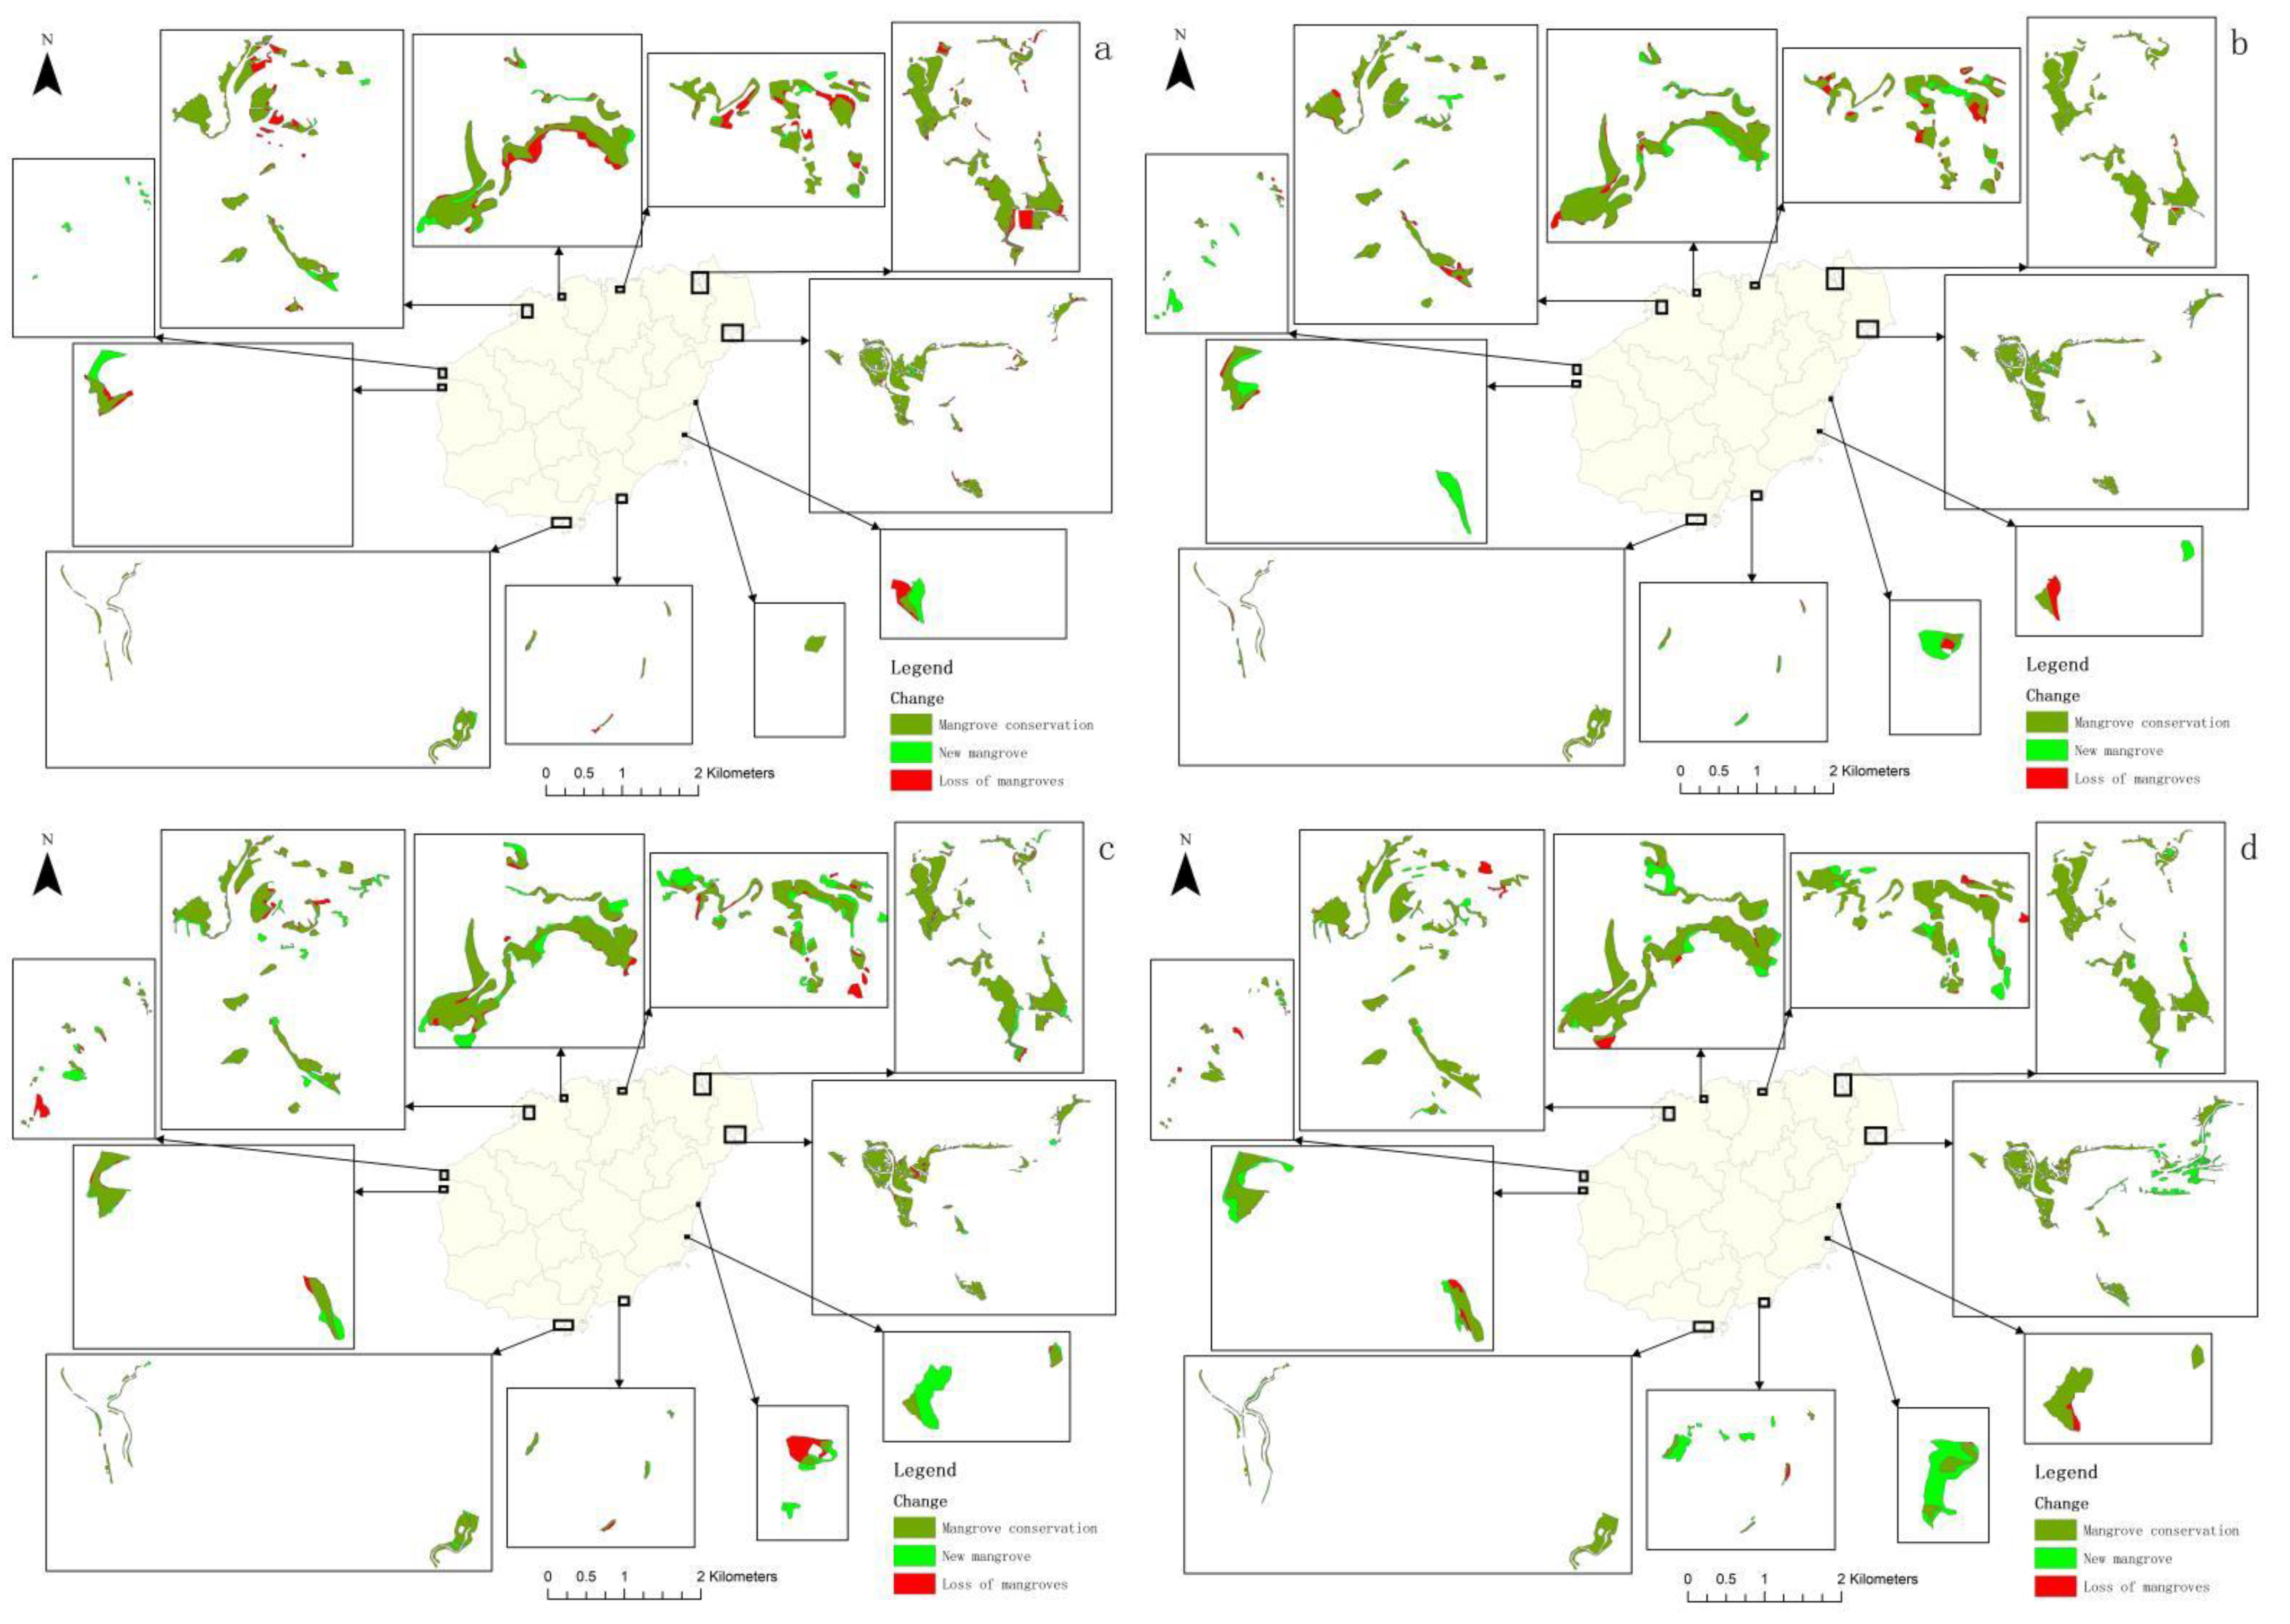
Mangroves in Hainan Island can be further divided into 11 regions according to their spatial distribution(Dongzhai Harbor, Xinying Mangrove, Qinglan Harbor, Danzhou Bay, Huachang Bay, Wanquan river estuary, Sibi Bay, Wanning Xiaohai, South Sanya, Xincun Harbor and Li’an Harbor, and Changhua River estuary). The specific characteristics of their changes in different periods were as follows (Figure 3). The area of mangroves in Dongzhai Harbor did not change much in 20-year period because Dongzhai Harbor is China’s first mangrove nature reserve, the government and related agencies are aggressively protecting it, being largest at 2139.81 ha in 2000, and then slightly declined in 2010, but increased to 2084.66 ha in 2020. Except for 20002005, the area of mangrove forest in Xinying decreased, but the other periods increased rapidly, with a total increase of 101.09 hectares after the year 2000. The area of mangroves in Qinglan Harbor did not change much between 2000 and 2015, fluctuating around 730 ha on average, but between 2015 and 2020 it increased by 283.14 ha. The area of mangroves in Danzhou Bay and Huachang Bay exhibited the same trend; both showed a downward trend from 2000 to 2010 and an upward trend from 2010 to 2020. The mangrove area of Danzhou Bay and Huachang Bay the same trend, both from 2000 to 2010 and from 2010 to 2020, the mangrove area decreased, and from 2010 to 2020 the mangrove area increased. The mangrove area of Wanquan River estuary reached 72.17 ha in 2020. The mangrove area of Xincun Harbor and Li’an Harbor remained mostly unchanged from 2000 to 2015, but after 2015 it expanded rapidly and reached 107.55 ha in 2020. The changing trend of mangrove area in Sibi Bay, Wanning Xiaohai and southern Sanya showed an increase. At the estuary of Changhua River there was an absence of mangrove wetlands in 2000 but later, in 2015, an area of 81.64 ha was detected there, which decreased slightly in 2020.
5.3. Changes in Mangrove Landscape Pattern Indexes on Hainan Island
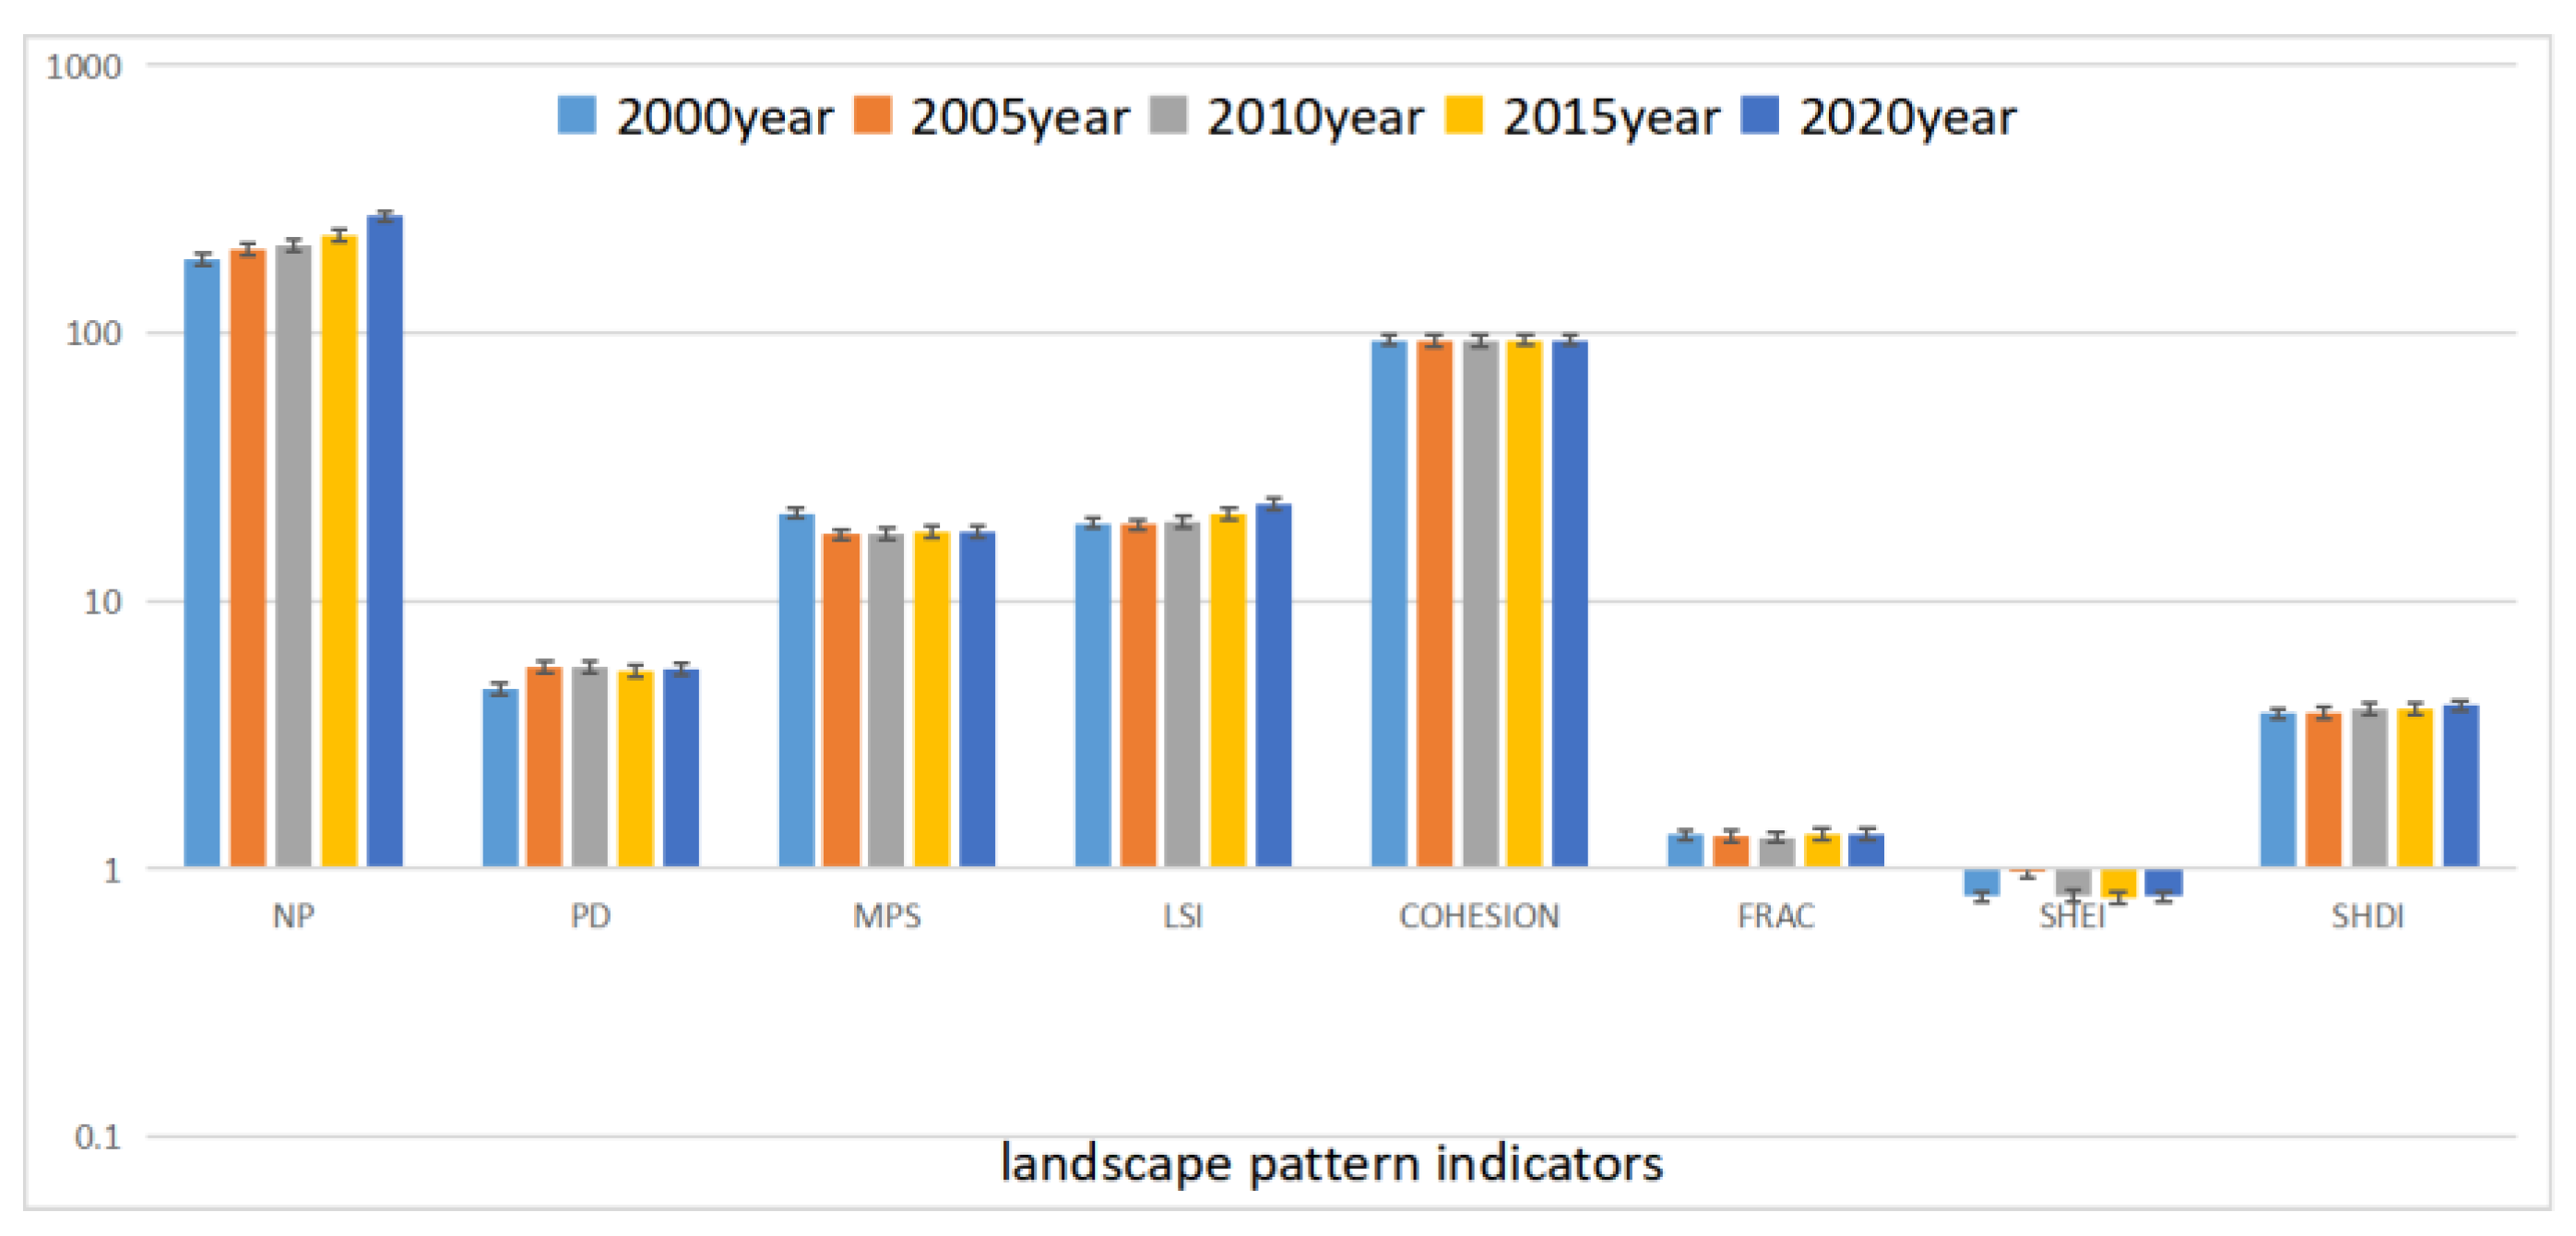
Mangrove landscape patterns refer to the spatial arrangements of mangrove patches, formed due to the combined effects of various ecological processes [53]. The characterization of landscape pattern types and levels was achieved using MPS, COHESION and FRAC. The indexes used for the characterization of landscape patterns and levels were NP, PD, LSI, SHEI, SHDI. When analyzing the characteristics of mangroves at different levels, assessing their types and landscapes, it is helpful to explore the various factors affecting the landscape patterns and change processes of mangroves and the mechanisms influencing them, thus revealing the reasons for the changes in mangrove areas. The altered landscape pattern index results for the mangrove forests of Hainan Island in the five time periods are shown in Figure 4.
5.3.1. Characteristics of Landscape Pattern Change at the Type Level
(1) The mean patch size (MPS) was 21.35 ha at its maximum in 2000, and it decreased and then increased after 2000 before falling to 18.04 ha. This indicated a deepening fragmentation of mangrove patch types.
(2) The degree of aggregation (COHESION) decreased first and then increased, remaining stable at around 94. The closer this is to 100, the more a landscape is composed of patches, thus reflecting the high degree of mangrove fragmentation, low connectivity, and discrete spatial distribution observed among mangrove patches on Hainan Island.
(3) The average patch fractional dimensionality (FRAC) remained basically constant around 1.32, with little fluctuation over time. The closer the FRAC is to two, the more complex the patch shape is and the greater the degree of human disturbance; hence, this result indicated that the overall shape of mangroves on Hainan Island was rather complex.
5.3.2. Characteristics of Landscape Pattern Change at the Landscape Level
Features at the landscape level on Hainan Island were able to reflect the landscape change characteristics of its mangroves [54].
(1) The total number of mangrove patches (NPs) on Hainan Island showed a continuous growth trend from 2000 onward, peaking at 272 in 2020, with an increase of 84 NPs or 44.7% during the 20-year period. This indicated that the fragmentation of mangrove patches on Hainan Island was increasing, whereas the patches were more discrete in their distribution, pointing to certain inhibitory effects against insect damage and fire.
(2) The patch density (PD) showed a trend of increasing, then decreasing, and then increasing again, reaching a maximum of 5.63 (pcs/ha) in 2005. This reflected the increasing heterogeneity of mangroves on Hainan Island per unit area.
(3) The landscape shape index (LSI) showed a trend of decreasing and then increasing during the 20-year period, reaching its lowest point in 19.24 in 2005, after which it rose to 23.02 in 2020, for an increase of 17.96%. This indicated that the mangrove landscape shape of Hainan Island has become complex.
(4) The Shannon evenness index (SHEI) from 2000 to 2020 showed a fluctuating trend of increasing, decreasing, and then increasing again. SHEI can be used for the comparison of prominent landscape diversity changes in different periods. When SHEI approached 1, it indicated that the dominant species in mangroves of Hainan Island were not prominent and each patch was evenly distributed in the landscape, and the highest value was 0.97 in 2005, indicating that the dominant species in mangroves of Hainan Island were not prominent and evenly distributed until 2005. The lowest value was 0.78 in 2015, indicating that the dominance ability of one or several species of mangrove in Hainan Island was gradually increasing.
(5) The Shannon diversity index (SHDI) showed a trend of increasing between 2000 and 2020, peaking at a value of 4.06 in 2020. SHDI can be used to compare and analyze the diversity and heterogeneity of mangroves more acutely over time. The SHDI continued to increase over time across the study area, indicating richer land use and increased landscape richness.
Taken together, the overall shape of the mangrove landscape on Hainan Island tended to be complex, with greater patch fragmentation and increasing heterogeneity per unit area. Richness increased between 2000 and 2020, with the proportion of each type mostly balanced.
5.4. Analysis of the Drivers of Change in Mangrove Landscape Patterns on Hainan Island
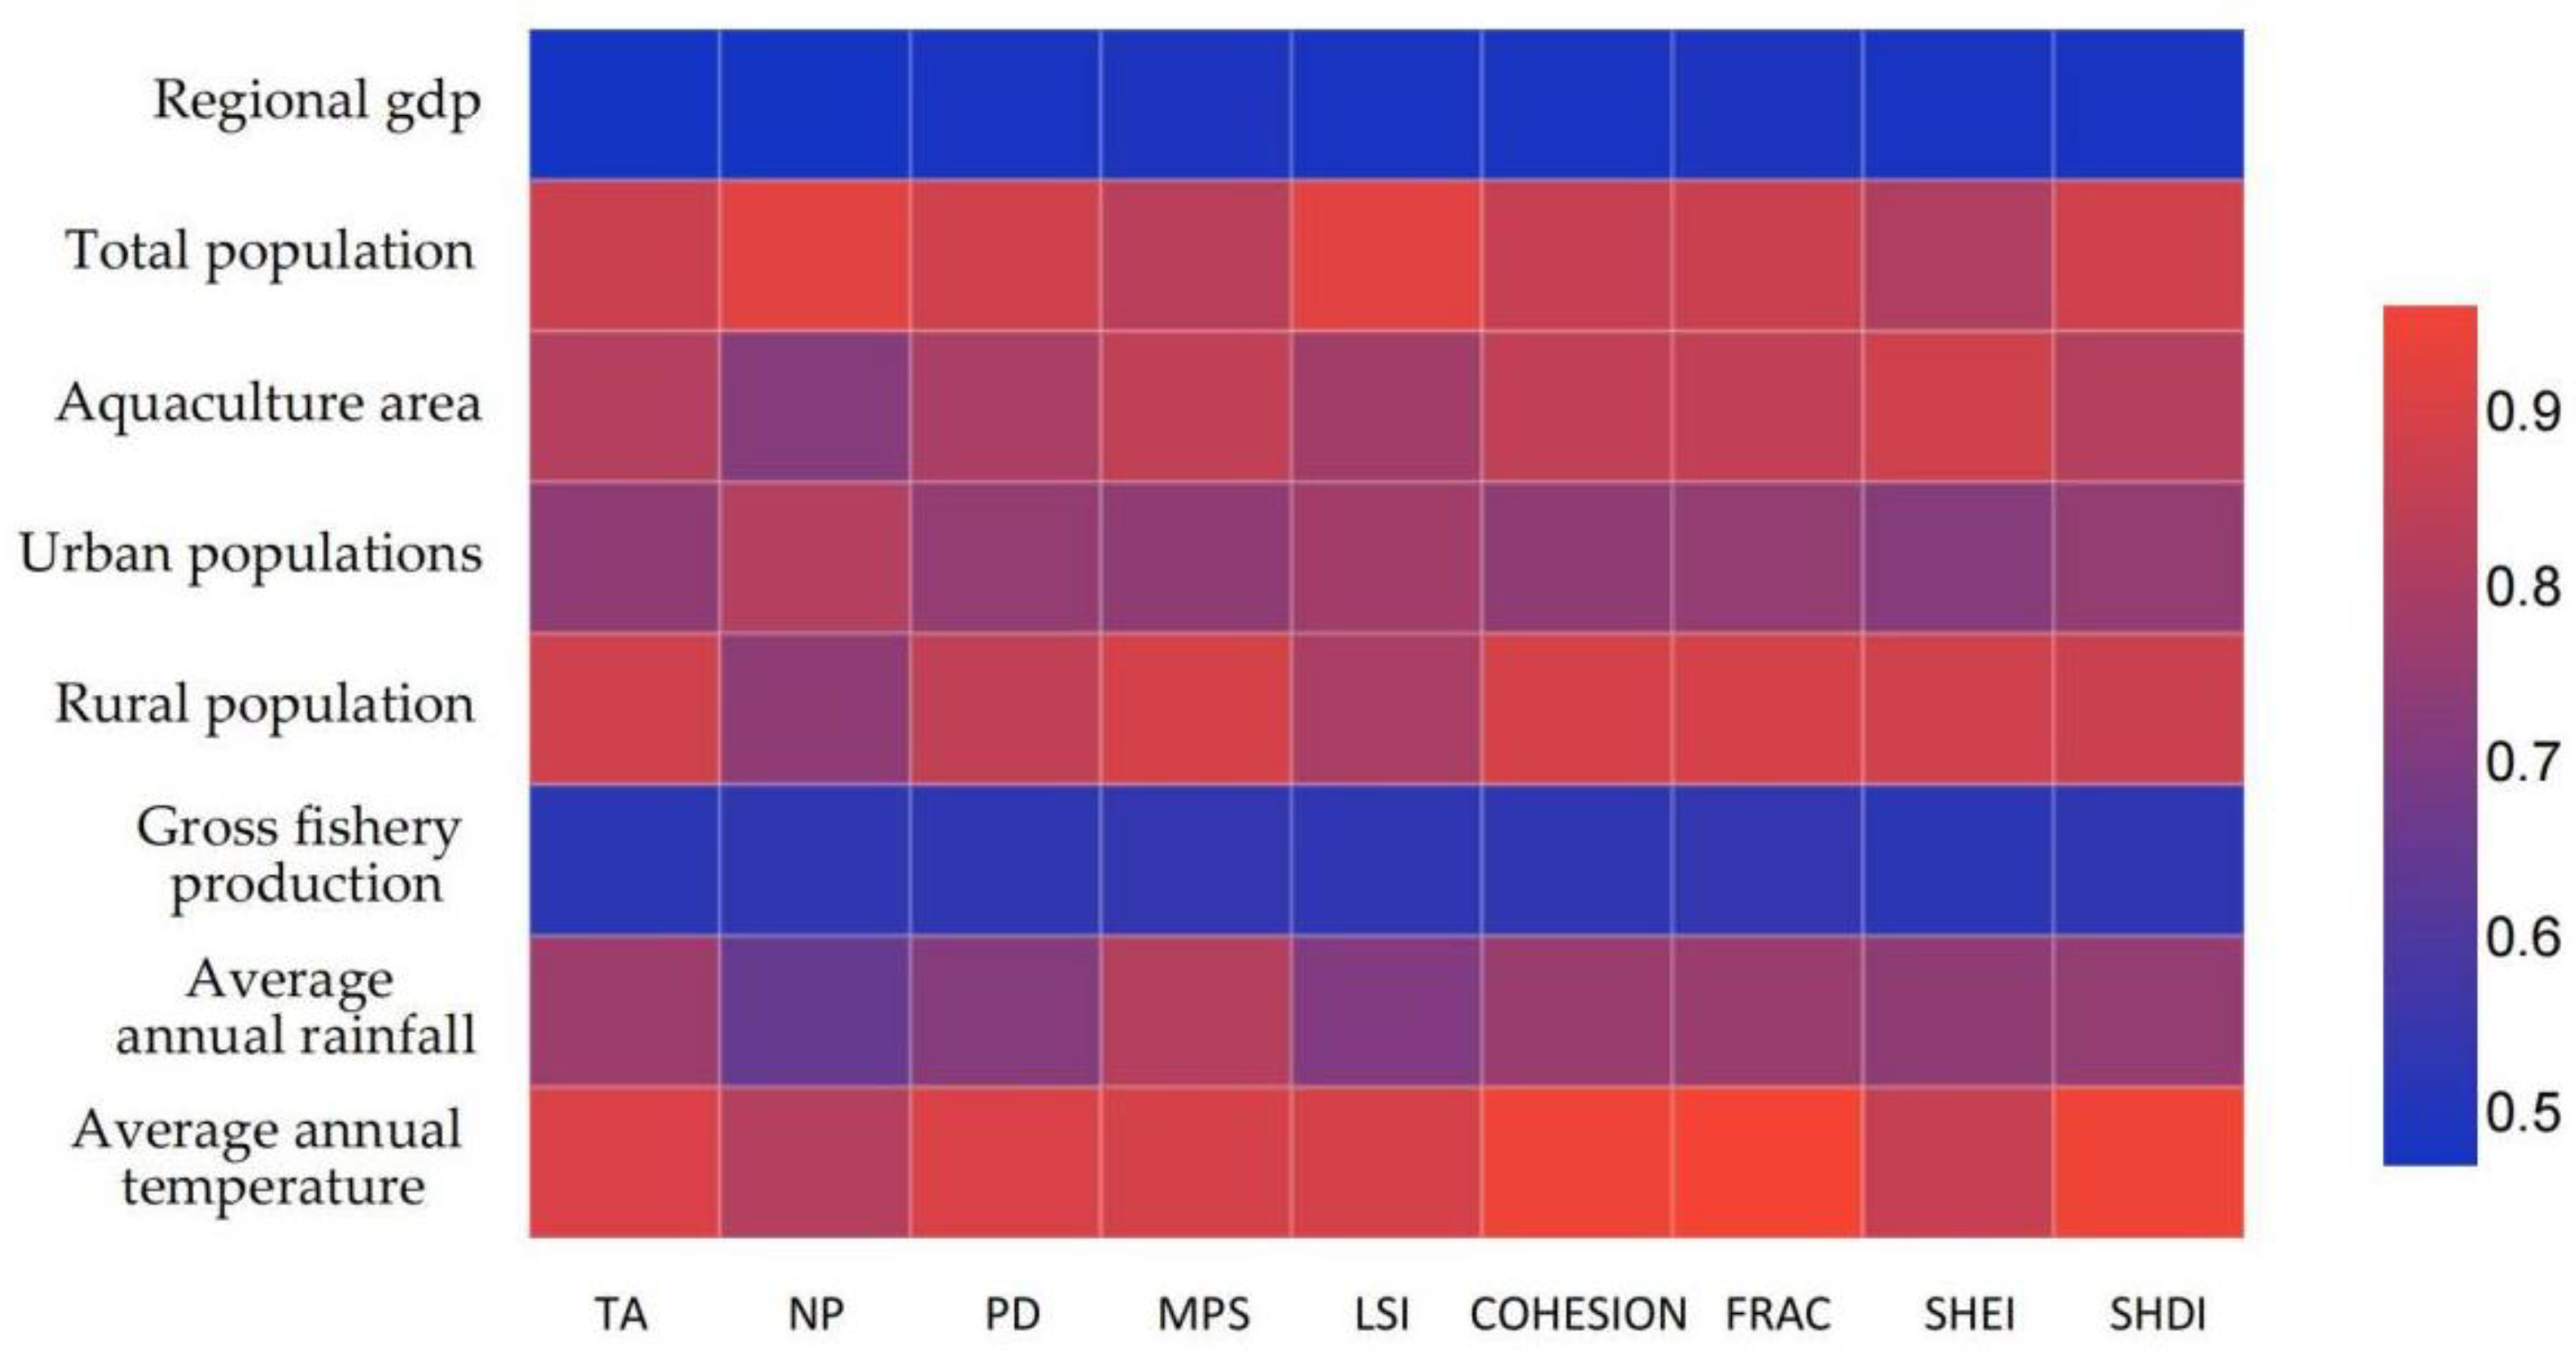
The factors affecting the changes in mangrove landscape patterns on Hainan Island can be divided into natural factors and human factors (including macro-policies). To exclude the interference of macro-policies on the gray correlation between relevant indicators and mangrove landscape pattern index, we omitted the areas of mangrove forests that were restored and newly created due to the return of ponds to forest land from 2000 to 2020. A total of eight natural and socio-economic indicators were selected, and Figure 4 shows a heat map of the gray correlation values between the relevant indicators and the mangrove landscape pattern index of Hainan Island.
5.4.1. Natural Factors
The main natural factors were precipitation variability and temperature variability. The correlation between mean annual rainfall and mean annual temperature and the landscape pattern index ranged from 0.68 to 0.99, with an average correlation value of 0.85.
(1) Based on the annual average rainfall, the average annual amount of Hainan Island during the study period was above 1400 mm, which could provide a water recharge for mangroves, increase the water surface area, and restore some of the mangroves [55]. Its gray correlation with the total area of mangroves on Hainan Island was 0.8, which, along with the dynamic attitude results, showed that the correlation between rainfall and changed mangrove area on Hainan Island was large. The gray correlation with NP was 0.68, indicating that the correlation of the deepening fragmentation of mangrove patches on Hainan Island with annual rainfall was not as significant as that with mean annual temperature. The mean correlation with the rest of the indices was 0.78, which that it is closely related to the landscape pattern of Hainan Island’s mangrove forests.
(2) Concerning mean annual temperature, most plants need sufficient light and a suitable temperature, and mangroves are no exception. During the study period, the annual mean temperature of Hainan Island exhibited a decreasing trend followed by an increasing trend, and its gray correlation with the area of mangroves on Hainan Island was 0.93 (Figure 5). This indicated that a suitable temperature was a necessary condition for the growth of mangroves, and the correlation between temperature and mangrove dynamics was strong. Furthermore, the average correlation with the other eight indices was 0.93, suggesting that annual mean temperature was a key indicator influencing the landscape pattern of mangroves on Hainan Island.
To sum up, the gray correlations between mean annual temperature and the eight landscape pattern indices were all greater than those with mean annual rainfall, i.e., mean annual temperature was more strongly correlated with the mangrove landscape pattern index on Hainan Island.
5.4.2. Anthropogenic Factors
Among the six selected socio-economic indicators—total population, urban population, rural population, gross regional product, gross fishery product, and aquaculture area—the gray correlations with the eight landscape pattern indicators ranged from 0.50 to 0.95, averaging 0.75. In terms of the average correlation between each socio-economic indicator and the landscape pattern index, the total population, rural population, and aquaculture area were strongly correlated with the mangrove landscape pattern index on Hainan Island, whereas those involving gross regional product and gross fishery product were weakly correlated.
(1) In terms of economic growth and population, the gray correlations between gross regional product, total population, urban population, and rural population with mangrove area in Hainan Island were 0.5, 0.9, 0.77, and 0.91, respectively, indicating that human activities were closely related to the dynamic changes of Hainan Island’s mangrove areas. Rapid economic development can appropriately increase the protection and restoration of mangroves [56], but at the same time, human activities can continue to encroach on the living spaces of mangroves, resulting in the degradation of mangroves. The mudflats where the mangroves grow are home to many edible seafood products, such as green crabs and mudskippers, etc. Local residents engage in an activity called ‘catching the sea’, which is the most direct source of economic income for nearby residents. Similarly, the abundance of shrimps and shellfish in the mangrove area is a vital food source for poultry, and poultry stocking in the mangrove area is expected to also cause direct harm to vulnerable mangrove seedlings [31].
(2) In terms of aquaculture area and gross fishery product, their grey correlations with the mangrove area on Hainan Island were 0.85 and 0.55, respectively. This indicated that the change in aquaculture area was more closely related to the change in mangrove area, and the gross fishery product was somewhat related to it. Previous studies have shown that increases in mangrove areas are directly related to the expansion of aquaculture ponds [57,58], and although nitrogen and phosphorus in wastewater can be used as nutrients to sustain mangrove growth [59], when their concentrations are too high, this can be toxic to mangrove plants [60]. Furthermore, the eutrophication of water bodies can lead to phenomena such as the ‘red tide’, which reduces the oxygen content and light permeability of water, making it difficult for mangrove plants to survive. Our results demonstrated that aquaculture had a large negative impact on mangroves. The development of fisheries cannot be supported by docks and harbors, and some local departments have built docks and other facilities in mangrove living areas, resulting in the fragmentation and serious destruction of mangrove patches [31].
Combining all eight factors, both socio-economic and natural, the annual mean temperature had the greatest influence on the total mangrove area, patch density, aggregation, mean patch sub-dimensionality, and Shannon diversity index on Hainan Island. The remaining landscape pattern indices were influenced primarily by the total population, rural population and aquaculture area. Anthropogenic factors directly affected the changes in mangrove areas on Hainan Island, so it was identified as the main cause of mangrove degradation on Hainan Island on a small time-scale, whereas natural factors had a stronger influence on mangrove landscape pattern on Hainan Island than man-made factors on a large time-scale.
5.4.3. Macro-Policy Factors
Aside from the natural and human factors mentioned above, relevant macro-policies are known to strongly influence land use patterns [61,62]. As early as 1998, Hainan Province adopted the Regulations on the Protection of Mangrove Forests in Hainan Province, which were later revised in 2004 and 2011 to meet the practical needs of Hainan mangrove ecological protection and restoration, but there have not been effectively implemented [63]. In 2012, 160 ha of ponds were returned to mangrove forest in DongZhai Harbor, and in 2014 the Hainan Provincial Government restored a total of 409.33 ha of mangrove forests, with another 47 ha of newly created mangroves added in 2015. Accordingly, the total area of mangroves in Hainan Island entered a period of rapid growth in 20102015. In recent years, China has attached great importance to the ecological environment and natural resources. This, coupled with Hainan Province’s vigorous development of a pilot ecological civilization zone and free-trade Harbor, has led to the government of Hainan Province to offer ecological compensation for the return of ponds to forests (wetlands). This was accomplished by issuing the ‘Hainan Province 2018–2019 Annual Return of Ponds to Forests (Wetlands) Implementation Plan’, with some artificial farming areas restored to wetlands, as well as a series of documents subsumed under the ‘13th Five-Year Plan’ to create a total of 12,000 acres of new mangroves. In this way, the area of mangroves increased significantly in the 20152020 period.
6. Discussion and Conclusions
6.1. Discussion
6.1.1. Identifying and Extracting the Mangroves of Hainan Island
In this study, the XGBoost machine algorithm was used to identify and extract data on the mangrove forest coverage area of Hainan Island for a total of five remote sensing periods over the past 20 years. In the first national mangrove resource survey conducted by the State Forestry Administration of China, Hainan Island’s mangrove forest area was 3930.3 ha in 2001, which was very close to the 3996.5 ha of mangrove forest in 2000 estimated in this study. The mangrove area of Hainan Island in 2010 and 2013, as measured by Jia Mingming [31], amounted to 3576 and 4033 ha, respectively, which were very close to the 3770.71 and 4199.85 ha, respectively, that we obtained for 2010 and 2015 in our study. This pronounced convergence is evidence of the high accuracy and reliability of the data reflecting the mangrove forest coverage areas of Hainan Island as identified and extracted in this study. However, Hainan Island’s mangrove area in the same years as measured by Peiqiang Wu, Xiaoyu Li, and Wuxia Wang [32,33,64] were not similar, perhaps due to the dissimilarity of the visual interpretation standards and the differences in image precision, which could have led to the differences in the data classification result and the dissimilarities in terms of mangrove recognition and extraction precision.
Between 2000 and 2020, the total mangrove area on Hainan Island was distinguished by a trend of expansion, undergoing a net increase of 1315.75 ha, equivalent to gaining 24.77/a, with the change in the mangrove kinetic attitude being starker before 2005 and slower afterwards. These results are consistent with the trend of an initial decrease, followed by an increase for Hainan Island’s mangrove area as identified by Wang Hao [65]. Jia Mingming [66] also found the same increasing trend in their analysis of shifts in mangrove forest coverage in China over the past 50 years. However, our results differ from the conclusions of Lei [67], who proposed that the mangrove forest on Hainan Island declined in its extent from 2010 to 2018, contrary to the continuous increasing trend we found spanning the period from 2010 to 2020. This discrepancy may be related to the acquisition time of remote sensing images and the subtle influence of climatic factors, which led to some uncertainty in the mangrove interpretation results.
Deep-learning algorithms can learn features autonomously, so as to better objectively mine the potential information of classification features, maximize the category interval as much as possible, and find the decision hyperplane that best distinguishes different features. In this study, we only extracted mangrove forests data for Hainan Island, and did not distinguish between various mangrove species; there are some shortcomings in this approach, but it also represents a promising direction of research that should be pursued in future work. In terms of mangrove data extraction, we could obtain comprehensive and detailed information and actual measurement data, and we could try to use more cutting-edge deep learning algorithms to establish superior mangrove identification models. Incorporating a feature spectrometer could enable us to obtain the spectral reflection curves of different species to improve the accuracy of mangrove community monitoring and interpretation. Therefore, looking ahead, we envision future mangrove research avenues that aim to improve mangrove species identification, advance the analysis of biophysical parameters, and select suitable deep-learning classification methods by fusing multi-resolution and multi-source datasets.
6.1.2. Drivers of Mangrove Landscapes on Hainan Island
From 2000 to 2020, the ecological environment of mangrove forests on Hainan Island deteriorated and the landscape pattern developed towards enrichment and homogenization, which was similar to the research conclusions presented by Li Ru [35] and Zhen Jianing [36] in regard to Dongzhai Port and Qinglan Port. These findings are also similar to the irregular changes in the mangrove landscape pattern of Hainan Island reported by Jia Mingming [31] and Li Xiaoyu [33], and the latter’s view that the fragmentation of Hainan Island’s mangrove landscape is decreasing [34]. Accordingly, we recommend restoring mangroves on Hainan Island by simultaneously reducing their further fragmentation, improving integrity and connectivity among patches to restore their potential ecological value, and maintaining the ecological security of the mangrove landscape.
The results showed that among the driving factors of mangrove landscape pattern changes on Hainan Island, the driving force of natural factors was stronger than that of human factors, which was similar to the conclusions of a study by Jia Mingming [31], but contradicted Li Xiaoyu’s conclusion [33] that population density was an important reason for mangrove degradation. Daniel’s study [68] suggested that rising temperatures may lead to faster growth and reproduction among mangroves, which respond more directly to precipitation. The landscape evolution mechanism of mangroves is very complex, and it is necessary to combine qualitative and quantitative analysis, to study it. In this study, we only selected eight indicators of social economy and nature, which cannot cover all the factors affecting mangroves in Hainan Island. It is necessary to obtain relevant data on the impact of local residents in mangrove areas, but it is difficult to obtain and quantify these data. Future research could focus on the collection of relevant data and the establishment of indicators. Additionally, in this study we relied on gray correlations to derive the quantitative relationship between each impact indicator and the changes in the mangrove forest area on Hainan Island. By contrast, Lei Jinrui et al. used SPSS 22.0 to conduct a Pearson bivariate correlation analysis on related indicators [67]. Our gray correlations were somewhat limited, because they could not distinguish between positive and negative relationships. Therefore, it is possible to apply geostatistical analysis methods, the construction of multiple nonlinear models, and geographic detectors to conduct an in-depth analysis of the key factors affecting the landscape patterns of mangroves and the mechanisms influencing them. Taking this multi-pronged approach could lead to more accurate and feasible solutions for mangrove forest conservation and restoration on Hainan Island.
The influence of anthropogenic factors upon mangroves is direct, and therefore they may predominate on smaller time-scales, for example, the construction of nature reserves has a direct protective effect on mangroves, and the area of mangroves has increased significantly[69]. Related studies have shown that the influence of natural factors on mangroves and other wetlands has several notable characteristics, such as a long duration of influence, through indirect and direct processes on the growth and development of mangrove trees and their community composition, which in turn can impact the landscape patterns of mangroves [70]. Similarly, the influence of macro-policies on mangroves has certain discernible characteristics; so, while anthropogenic factors have a greater influence on mangroves on smaller time-scales, natural factors and macro-policies influence them more on larger time-scales.
6.2. Conclusions
In this paper, based on the use of Aentinel-2A data, five machine-learning algorithms were used to identify and extract data on the mangrove areas of Dongzhai Port, and we determined that the most suitable algorithm for extracting the mangrove area data of Hainan Island was the XGBoost algorithm. On this basis, the mangrove areas on Hainan Island in 2000, 2005, 2010, 2015, and 2020 were extracted, and the landscape pattern and forces driving changes in mangrove areas in Hainan Island in the past 20 years were analyzed using landscape pattern indexes, dynamic model, and gray correlation degree analysis. The results showed that:
(1) Based on the results of CatBoost, XGBoost, AdaBoost, random forest classification, and a support vector machine model, the XGBoost algorithm had the highest production accuracy in the classification of mangrove data extraction and recognition in Hainan Island, reaching 93.60%, followed by the AdaBoost algorithm, which reached 87.45%.
(2) The total mangrove landscape area of Hainan Island between 2000 and 2020 showed a trend of first decreasing and then increasing. In the past 20 years, the mangrove area has increased by 1315.75 ha with an annual change rate of 65.79 ha/a.
(3) Changes to the mangrove landscape patterns on Hainan Island at the type-level were characterized by the deepening fragmentation of patches, discrete spatial distribution, and a tendency for the overall shape to be more complex. At the landscape level, the features generally exhibited deepening fragmentation, increasing heterogeneity, low connectivity, increasing richness, and a tendency for each type to become more balanced.
(4) The changes in mangrove landscape patterns on Hainan Island were the result of natural and human factors acting in concert, and the influence of macro-policies on the areas of mangrove forests on Hainan Island should not be ignored. Excluding the influence of macro-policies, natural factors such as annual average temperature were critical in driving the changes in mangrove landscape patterns on Hainan Island, and the second most important contributor was anthropogenic factors caused by the increase in population, such as the encroachment of buildings, ‘driving the sea’ and the increase in breeding industry(including fish, shrimps and crabs, shellfish, and algae, Euryale, lotus, lotus root, etc.), other than macro-policies.
Author Contributions
Writing—Original Draft Preparation, Y.L. and F.W.; Writing—Review and Editing, Y.L. and F.W.; Visualization, H.W.; data collection and analysis, Y.L.; Funding Acquisition, F.W. All authors have read and agreed to the published version of the manuscript.
Funding
This research is supported by National Key R&D Program of China (2019YFD0901301) and Hainan Federation of Social Sciences (HNSK (YB)19-09).
Institutional Review Board Statement
Not applicable.
Informed Consent Statement
Not applicable.
Data Availability Statement
Publicly available datasets were analyzed in this study. These data can be found here: http://earthexplorer.usgs.gov (accessed on 30 September 2022), https://scihub.copernicus.eu/ (accessed on 30 September 2022).
Conflicts of Interest
The authors declare no conflict of interest.
References
- Gan, J.J. Exploring the value and conservation of mangrove wetland ecosystems. Green Technol. 2019, 12, 46–47. [Google Scholar]
- Sakho, I.; Mesnage, V.; Deloffre, J.; Lafite, R.; Niang, I.; Faye, G. The influence of natural and anthropogenic factors on mangrove dynamics over 60 years: The Somone Estuary, Senegal. Estuar. Coast. Shelf Sci. 2011, 94, 93–101. [Google Scholar] [CrossRef]
- Paling, E.I.; Kobryn, H.T.; Humphreys, G. Assessing the extent of mangrove change caused by Cyclone Vance in the eastern Exmouth Gulf, northwestern Australia. Estuar. Coast. Shelf Sci. 2007, 77, 603–613. [Google Scholar] [CrossRef]
- Liang, W.; Hu, Z.N.; Li, G.Z.; Song, Y.X.; Yu, G.C.; Nong, H.Q. Landscape pattern changes and driving mechanisms of coastal wetlands in Beihai City over the past 50 years. Ocean Sci. 2016, 40, 84–93. [Google Scholar]
- Van, d.S.T.; Vanschoenwinkel, B.; Carroll, D.; Cavanaugh, K.C.; Koedam, N. Mangrove dispersal disrupted by projected changes in global seawater density. Nat. Clim. Chang. 2022, 12, 685–691. [Google Scholar]
- Ba, W.Y.; Tian, H.; Geng, L. Ecological value of mangroves and their conservation. Agrotech. Serv. 2017, 34, 92. [Google Scholar]
- Zhang, Y.Z.; Zhang, Q.L.; Hu, Y.F. Remote sensing monitoring and dynamic change analysis of the coastline of the Pearl River estuary from 2010-2017. Mar. Bull. 2019, 38, 217–224. [Google Scholar]
- Liu, K.; Peng, L.H.; Li, X.; Tan, M.; Wang, S.G. A study on monitoring interannual variability of mangrove forests based on Google Earth Engine. J. Earth Inf. Sci. 2019, 21, 731–739. [Google Scholar]
- Muditha, K.H.; Karen, E.J.; Stefan, W.M. Mangrove tree crown delineation from high-resolution imagery. Photogramm. Eng. Remote Sens. 2015, 81, 471–479. [Google Scholar]
- Lorenzo, R.; de Jesus, B.R.; Jara, R.B. Assessment of man grove forest deterioration in Zamboanga Peninsula, Phil ippines, using Landsat MSS data. Proc. Th13thinternational Symp. Remote Sens. Th Environ. 1979, 2, 1737–1745. [Google Scholar]
- MD, M.R.; David, L.; Seung, K.L.; Temilola, F.; Imran, A.; Mamoru, K. Improved assessment of mangrove forests in Sundarbans East Wildlife Sanctuary using WorldView 2 and TanDEM-X high resolution imagery. Remote Sens. Ecol. Conserv. 2019, 5, 136–149. [Google Scholar]
- Muhammad, K.; Stuart, P.; Kasper, J. Object-based approach for multi-scale mangrove composition mapping using multi-resolution image datasets. Remote Sens. 2015, 7, 4753–4783. [Google Scholar]
- Benjamin, W.H. An Object-based classification of mangroves using a hybrid decision tree-support vector machine approach. Remote Sens. 2011, 3, 2440–2460. [Google Scholar]
- Florent, T.; Marc, R.; Christophe, P.; François, F.; Daniel, I.; Françoise, D. Mapping the mangrove forest canopy using spectral unmixing of very high spatial resolution satellite images. Remote Sens. 2019, 11, 367. [Google Scholar]
- Wang, D.Z.; Wan, B.; Qiu, P.H.; Zuo, Z.J.; Wang, R.; Wu, X.C. Mapping height and aboveground biomass of mangrove forests on Hainan Island using UAV-LiDAR sampling. Remote Sens. 2019, 11, 2156. [Google Scholar] [CrossRef] [Green Version]
- Jan, S.; Pavel, R.; Zdeněk, K. Changes and trajectories of wetlands in the lowland landscape of the Czech Republic. Ecol. Eng. 2017, 108, 435–445. [Google Scholar]
- Sun, N.; Zhu, W.N.; Cheng, Q. GF-1 and Landsat observed a 40-year wetland spatiotemporal variation and its coupled environmental factors in Yangtze River estuary. Estuar. Coast. Shelf Sci. 2018, 207, 30–39. [Google Scholar] [CrossRef]
- Lv, J.X.; Jiang, W.G.; Wang, W.J.; Chen, K.; Deng, Y.; Chen, Z.; Li, T. Wetland landscape changes and their drivers in the Beijing-Tianjin-Hebei region over the past 30 years. J. Ecol. 2018, 38, 4492–4503. [Google Scholar]
- Ning, L.M. Study on the Functional Evaluation and Dynamic Change of Landscape Pattern of Wetlands in Wuhan City. Master’s Thesis, Graduate School of Chinese Academy of Sciences (Institute of Surveying and Geophysics), Wuhan, China, 2004. [Google Scholar]
- Zhou, Z.C.; Li, H.; Huang, C.; Liu, Q.S.; Liu, G.H.; He, Y.; Yu, H. Research progress on remote sensing dynamic monitoring of mangrove forests. J. Geoinf. Sci. 2018, 20, 1631–1643. [Google Scholar]
- Liu, H.Y.; Zhang, S.K.; Lv, X.G. Spatial and temporal variation of wetland landscape structure in the Sanjiang Plain. J. Geogr. 2004, 3, 391–400. [Google Scholar]
- Huang, X.; Xin, K.; Li, X.Z.; Wang, X.P.; Ren, L.J.; Li, X.Z.; Yan, Z.Z. Changes in landscape patterns and their drivers in DongZhai Harbor mangrove wetlands based on patches. J. Appl. Ecol. 2015, 26, 1510–1518. [Google Scholar]
- Zheng, X.M. Remote Sensing Monitoring and Analysis of Typical Mangrove Nature Reserves in China from 1985 to 2015. Master’s Thesis, Fujian Agriculture and Forestry University, Fuzhou, China, 2017. [Google Scholar]
- Liu, K.; Yang, Y.Y.; Shi, R.G.; Li, Q.; Wu, B.; Zheng, H.Y.; Mi, C.H. Spatial and temporal evolution of landscape patterns and drivers in the Yuqiao Reservoir watershed from 1990 to 2020. J. Agric. Resour. Environ. 2022, 1–15. [Google Scholar] [CrossRef]
- Zhang, X.H. Automatic extraction of mangrove information from Landsat8 OLI images based on decision tree method. Remote Sens. Land Resour. 2016, 28, 182–187. [Google Scholar]
- Jiang, Y.F.; Qi, J.G.; Chen, B.W.; Yan, M.; Huang, L.J.; Zhang, L. Fine classification of mangrove tree species based on UAV hyperspectral imagery and machine learning. Remote Sens. Technol. Appl. 2021, 36, 1416–1424. [Google Scholar]
- Fu, B.L.; Sun, J.; Li, Y.Y.; Zuo, P.P.; Deng, T.F.; He, H.C.; Fan D., L.; Gao, E. LAI estimation of mangrove tree species based on multispectral images and machine learning algorithms. Agric. Eng. 2022, 38, 218–228. [Google Scholar]
- Dong, D.; Wei, Z.; Wang, G.; Liu, S.W. Remote sensing mapping and analysis of coastal wetlands in Guangdong, Guangxi and Hainan. Ocean development and management 2020, 37, 95–99. [Google Scholar]
- Xu, F.; Zhang, Y.; Zhai, L.; Liu, J.; Gu, X.H. A Sentinel-2 based method for intertidal mangrove extraction. Mapp. Bull. 2020, 2, 49–54. [Google Scholar]
- Chopade, M.R.; Mahajan, S.; Chaube, N. Assessment of land use, land cover change in the mangrove forest of Ghogha area, Gulf of Khambhat, Gujarat. Expert Syst. Appl. 2023, 212, 118839. [Google Scholar] [CrossRef]
- Jia, M.M. Remote Sensing Analysis of Dynamic Changes of Mangrove Forests in China from 1973 to 2013. Ph.D. Thesis, Graduate School of Chinese Academy of Sciences (Northeast Institute of Geography and Agroecology), Changchun, China, 2014. [Google Scholar]
- Wu, P.Q. Remote Sensing Monitoring and Analysis of Mangrove Resources Changes in China in the Past 20 Years. Master’s Thesis, First Institute of Oceanography, State Oceanic Administration, Qingdao, China, 2012. [Google Scholar]
- Li, X.Y.; Zhang, D.S.; Ma, Y.; Lu, Z.Q.; He, Y.H.; Tian, H.B. Monitoring of mangrove change and its driving forces in four provinces between 1990 and 2015. Geospat. Inf. 2020, 18, 76–80. [Google Scholar]
- He, Y.H.; Zhang, D.S.; Qiu, B.W.; Li, Y.T.; Han, Y.S.; Liu, X.Z. Migration characteristics and common relationships between the center of gravity of mangrove communities in China and typical areas. J. Ecol. 2019, 38, 2326–2336. [Google Scholar]
- Li, R.; Zhu, B.Q.; Tong, X.W.; Yue, Y.M.; Gan, H.Y.; Wan, S.D. Analysis of wetland changes in DongZhaigang Nature Reserve, Hainan from 2002-2013. Remote Sens. Land Resour. 2017, 29, 149–155. [Google Scholar]
- Zhen, J.N.; Liao, J.J.; Shen, G.Z. Remote sensing monitoring and analysis of mangrove changes in Qinglan Harbor, Hainan Province since 1987. Wetl. Sci. 2019, 17, 44–51. [Google Scholar]
- Su, W.; Zhang, M.Z.; Jiang, K.P.; Zhu, D.H.; Huang, J.X.; Wang, P.X. Atmospheric correction method for Sentinel-2 satellite images. J. Opt. 2018, 38, 322–331. [Google Scholar]
- Li, B.L.; Ti, C.P.; Yan, X.Y. Derivation of coma cap transform for Landsat 8 land imager images. Mapp. Sci. 2016, 41, 102–107. [Google Scholar]
- Zhao, Z.; Xia, W.; Yan, L. Research on multi-class SVM classification method based on feature distance. Geospat. Inf. 2017, 15, 84–87. [Google Scholar]
- Zhang, X.H.; Tian, Q.J. Improving the accuracy of mangrove remote sensing identification using temperature and humidity index. Remote Sens. Land Resour. 2012, 3, 65–70. [Google Scholar]
- Zhang, H.; Ji, H.C.; Zhang, H.Y. Application of XGBoost algorithm in e-commerce product recommendation. Internet Things Technol. 2017, 2, 102–104. [Google Scholar]
- Li, K.; Wu, D.S.; Fang, L.M.; Liu, J.C. Estimation of forest volume using Sentinel-2 remote sensing image data. J. Northeast For. Univ. 2021, 49, 59–66. [Google Scholar]
- Chen, W.M.; Zhang, L.; Song, D.M.; Wang, B.; Ding, Y.X.; Xu, M.M.; Cui, J.Y. Research on hyperspectral image classification method based on AdaBoost improved random forest. Remote Sens. Technol. Appl. 2018, 33, 612–620. [Google Scholar]
- Leo, B. Random Forests. Mach. Learn. 2001, 45, 5–32. [Google Scholar]
- Guo, H.; Zhang, J.; Liu, A.W. Research on supervised classification method of remote sensing image based on SVM-Taking the Sanyangchuan area of Tianshui City as an example. Gansu Sci. Technol. 2022, 51, 52–55. [Google Scholar]
- Liu, M.Y. Remote Sensing Monitoring and Change Analysis of the Invasion of Intergrass in Coastal Wetlands in China. Ph.D. Thesis, University of Chinese Academy of Sciences (Institute of Northeast Geography and Agroecology, Chinese Academy of Sciences), Changchun, China, 2018. [Google Scholar]
- Chen, L.D.; Liu, Y.; Lv, Y.H.; Feng, X.M.; Fu, B.J. Pattern analysis in landscape ecology:current status, dilemmas and future. J. Ecol. 2008, 11, 5521–5531. [Google Scholar]
- Li, L.J.; Yang, J.W.; Jiang, D.J.; Li, J.Y.; Hou, X.Y. Spatial and temporal changes of land use in the Wuding River Basin in the 1990s. Geogr. Stud. 2005, 4, 527–534. [Google Scholar]
- Wang, C. Current Situation and Countermeasures of Comprehensive Agricultural Development in Changshu City. Master’s Thesis, Yangzhou University, Yangzhou, China, 2020. [Google Scholar]
- Liu, J.P.; Dong, C.Y.; Sheng, L.X.; Liu, Y. Changes in landscape patterns of marsh wetlands in the Xiaosanjiang Plain from 1955 to 2010 and their response to anthropogenic disturbance. Geoscience 2016, 36, 879–887. [Google Scholar]
- Xu, X.L.; Wang, X.J.; Zhu, X.P.; Jia, H.T.; Han, D.L. Analysis of the evolution of the landscape pattern of the alpine wetland of Bayinbruck Swan Lake from 1996-2015. J. Nat. Resour. 2018, 33, 1897–1911. [Google Scholar]
- Wu, R.; Wang, D.R. Study on the current situation and management measures of DongZhaigang National Nature Reserve. Mar. Dev. Manag. 2013, 30, 73–76. [Google Scholar]
- Bai, J.H.; Ouyang, H.; Yang, Z.F.; Cui, B.S.; Cui, L.J. Progress in research on changes in wetland landscape patterns. Advances in Geographical Sciences 2005, 36–45. [Google Scholar]
- Wang, B.P.; Zeng, R.; Liao, C.M.; Teng, Y.H.; Li, Y.S.; Liang, Q.X. Analysis of the evolution of mangrove wetland landscape pattern in Beihai City, Guangxi. South. Land Resour. 2019, 11, 63–64. [Google Scholar]
- Yi, A.L.; Wang, J. Quantifying the spatial and temporal evolution and driving mechanisms of wetland landscape patterns in Shanghai. J. Ecol. 2021, 41, 2622–2631. [Google Scholar]
- Guo, S. The current situation of wetland resources conservation and management in Guangdong and its countermeasures. Guangdong For. Sci. Technol. 2011, 27, 100–103. [Google Scholar]
- Robertson, A.I.; Phillips, M.J. Mangroves as filters of shrimp pond effluent: Predictions and biogeochemical research needs. Hydrobiologia 1995, 295, 311–321. [Google Scholar] [CrossRef]
- Alongi, D.M.; Chong, V.C.; Dixon, P.; Sasekumar, A.; Tirendi, F. The influence of fish cage aquaculture on pelagic carbon flow and water chemistry in tidally dominated mangrove estuaries of peninsular Malaysia. Mar. Environ. Res. 2003, 55, 313–333. [Google Scholar] [CrossRef] [PubMed]
- Feller, I.C.; Whigham, D.F.; McKee, K.L.; Lovelock, C.E. Nitrogen limitation of growth and nutrient dynamics in a disturbed mangrove forest, Indian River Lagoon, Florida. Oecologia 2003, 134, 405–414. [Google Scholar] [CrossRef] [PubMed]
- Ye, Y. Impact of aquaculture pollution on mangrove ecosystem: ‘Accelerating the change of economic development mode—Environmental challenges and opHarborunities’. In Proceedings of the 2011 Annual Conference of the Chinese Society of Environmental Sciences, Urumqi, China, 18 August 2011. [Google Scholar]
- Zhang, Y.Z.; Chen, R.S.; Wang, Y. Tendency of land reclamation in coastal areas of Shanghai from 1998 to 2015. Land Use Policy 2020, 91, 104370. [Google Scholar] [CrossRef]
- Song, K.S.; Liu, D.W.; Wang, Z.M.; Zhang, B.; Jin, C.; Li, F.; Liu, H.J. Land use changes and driving forces in the Sanjiang Plain since 1954. J. Geogr. 2008, 93–104. [Google Scholar]
- Nan, J.J.; Ning, Q.T. An analysis of the rule of law in the ecological protection and restoration of mangrove forests in Hainan. J. Hainan Trop. Mar. Coll. 2020, 27, 57–61. [Google Scholar]
- Wang, W.X. Analysis of 30-year spatial and temporal changes of mangrove forests along the South China Sea. Master’s Thesis, Lanzhou Jiaotong University, Lanzhou, China, 2017. [Google Scholar]
- Wang, H.; Ren, G.B.; Wu, P.Q.; Liu, A.C.; Pan, L.H.; Ma, Y.M.; Ma, Y.; Wang, J.J. Remote sensing monitoring of mangrove changes and analysis of landscape pattern changes in China from 1990 to 2019. J. Mar. Technol. 2020, 39, 1–12. [Google Scholar]
- Jia, M.; Wang, Z.M.; Mao, D.; Huang, C.L.; Lu, C.Y. An analysis of mangrove changes in China over the past 50 years towards the goal of sustainable development. Sci. Bull. 2021, 66, 3886–3901. [Google Scholar]
- Lei, J.R.; Chen, Z.C.; Chen, Y.Q.; Chen, S.H.; Li, Y.L.; Wu, T.T. Evolution of wetland landscape patterns and their drivers in Hainan Island, 1990-2018. J. Ecol. Environ. 2020, 29, 59–70. [Google Scholar]
- Alongi, D.M. The Impact of Climate Change on Mangrove Forests. Curr. Clim. Chang. Rep. 2015, 1, 30–39. [Google Scholar] [CrossRef]
- Lu, C.Y.; Li, L.; Wang, Z.L.; Su, Y.L.; Su, Y.; Huang, Y.F.; Jia, M.M.; Mao, D.H. The national nature reserves in China: Are they effective in conserving mangroves? Ecol. Indic. 2022, 142, 109265. [Google Scholar] [CrossRef]
- Wang, Q.Q.; Wang, X.; Zhang, W.G.; Wang, Z.B.; Xiao, D.R. Correlation of landscape change with anthropogenic and natural factors in wetlands of the northwest Yunnan Plateau. J. Ecol. 2019, 39, 726–738. [Google Scholar]
Figure 1.
The location of the study area and the spatial distribution of mangroves.

Figure 2.
Dynamic changes in mangrove areas in Hainan Island from 2000 to 2020.

Figure 3.
Changes in the mangrove forest areas of Hainan Island from 2000 to 2005 (a), 2005 to 2010 (b), 2010 to 2015 (c), and 2015 to 2020 (d).
Figure 3.
Changes in the mangrove forest areas of Hainan Island from 2000 to 2005 (a), 2005 to 2010 (b), 2010 to 2015 (c), and 2015 to 2020 (d).

Figure 4.
Landscape pattern index map of mangroves on Hainan Island.

Figure 5.
Gray correlations between relevant indicators and the landscape pattern indexes of mangroves on Hainan Island.
Figure 5.
Gray correlations between relevant indicators and the landscape pattern indexes of mangroves on Hainan Island.


Table 1.
Five-phase remote sensing image data sources.
| Name | Year | Number of Bands | Resolution (m) | Remark |
|---|---|---|---|---|
| Landsat 7 ETM+ | 2000 | 8 | 30/15 | Panchromatic band 15 m |
| Landsat5 TM | 2005 | 8 | 30/15 | Panchromatic band 15 m |
| Landsat5 TM | 2010 | 8 | 30/15 | Panchromatic band 15 m |
| Landsat8 OLI | 2015 | 11 | 30/15 | Panchromatic band 15 m |
| Sentinel 2 | 2020 | 12 | 60/20/10 | Panchromatic band 10 m |
Table 2.
Mangrove and non-mangrove vegetation separability (J m distance).
| Classification | Mangrove | Non-Mangrove |
|---|---|---|
| Mangrove | 0 | 1.86 |
| Non-mangrove | 1.86 | 0 |
Table 3.
Kappa coefficient evaluation criteria.
| Kappa | <0.00 | 0.01–0.20 | 0.21–0.40 | 0.41–0.60 | 0.61–0.80 | 0.81–1.00 |
|---|---|---|---|---|---|---|
| Degree of consistency | Very poor | delicate | feeble | medium | predominant | optimal |
| Kappa | <0.00 | 0.01–0.20 | 0.21–0.40 | 0.41–0.60 | 0.61–0.80 | 0.81–1.00 |
Table 4.
Comparison of accuracy values and Kappa coefficients of machine-learning algorithm mangrove classification results.
Table 4.
Comparison of accuracy values and Kappa coefficients of machine-learning algorithm mangrove classification results.
| Classification Method | PA | UA | Kappa Coefficient |
|---|---|---|---|
| CatBoost | 76.67% | 76.44% | 0.91 |
| XGBoost | 93.60% | 67.59% | 0.84 |
| AdaBoost | 87.45% | 64.82% | 0.78 |
| RF | 80.80% | 78.87% | 0.88 |
| SVM | 86.66% | 82.01% | 0.87 |
Disclaimer/Publisher’s Note: The statements, opinions and data contained in all publications are solely those of the individual author(s) and contributor(s) and not of MDPI and/or the editor(s). MDPI and/or the editor(s) disclaim responsibility for any injury to people or property resulting from any ideas, methods, instructions or products referred to in the content. |
© 2022 by the authors. Licensee MDPI, Basel, Switzerland. This article is an open access article distributed under the terms and conditions of the Creative Commons Attribution (CC BY) license (https://creativecommons.org/licenses/by/4.0/).
Share and Cite
MDPI and ACS Style
Li, Y.; Wen, H.; Wang, F. Analysis of the Evolution of Mangrove Landscape Patterns and Their Drivers in Hainan Island from 2000 to 2020. Sustainability 2023, 15, 759. https://0-doi-org.brum.beds.ac.uk/10.3390/su15010759
AMA Style
Li Y, Wen H, Wang F. Analysis of the Evolution of Mangrove Landscape Patterns and Their Drivers in Hainan Island from 2000 to 2020. Sustainability. 2023; 15(1):759. https://0-doi-org.brum.beds.ac.uk/10.3390/su15010759
Chicago/Turabian StyleLi, Yi, Hui Wen, and Fengxia Wang. 2023. "Analysis of the Evolution of Mangrove Landscape Patterns and Their Drivers in Hainan Island from 2000 to 2020" Sustainability 15, no. 1: 759. https://0-doi-org.brum.beds.ac.uk/10.3390/su15010759
Note that from the first issue of 2016, this journal uses article numbers instead of page numbers. See further details here.