

Methods to Reduce Flicker and Light Pollution of Low-Mounting-Height Luminaires in Urban Road Lighting

1
College of Architecture and Urban Planning, Tongji University, Shanghai 200092, China
2
School of Architecture & Urban Planning, Shenzhen University, Shenzhen 518060, China
*
Authors to whom correspondence should be addressed.
Sustainability 2023, 15(10), 8185; https://0-doi-org.brum.beds.ac.uk/10.3390/su15108185
Submission received: 15 April 2023
/
Revised: 11 May 2023
/
Accepted: 15 May 2023
/
Published: 17 May 2023
(This article belongs to the Special Issue Sustainable Outdoor Lighting)
Abstract
:Current low-mounting-height luminaires (LMHLs) have low effective luminous flux, high surface brightness, and many stray lights, resulting in high energy consumption and light interference, and the flicker effect may threaten driver safety. Currently, the flicker effect in LMHL lighting has been relatively poorly studied. However, in prior research, a Flicker Index (FI) quantification model was developed. In this study, we have modified the FI model to incorporate visual persistence, visual masking, and driving speed of the driver, and proposed a dynamic energy ratio model for quantifying flicker effects. The notion of effective luminous flux in road lighting was introduced, revealing that the reasons for high energy consumption, severe light pollution, and strong flicker effects in regular LMHLs were low effective luminous flux and high surface brightness. We recommend a low-mounting-height lighting technique that functions in both forward and reverse directions, which can significantly enhance the effective luminous flux of lighting fixtures, reducing stray light. The lighting fixtures created were tested on a road. The findings suggest that the energy consumption of both forward and reverse lighting fixtures is only 40% of the international standard requirements, resulting in 81% more energy savings than in existing LMHLs. The surface brightness of forward and reverse lighting fixtures is only 1.18 cd/m2, which is equivalent to 0.001% of the surface brightness of existing lighting fixtures. This indicates that 99.89% less invalid light is projected into the environment, indirectly reducing light pollution. Additionally, the flicker index of these fixtures is only 2% of that of existing lighting fixtures, reducing the impact of the flicker effect on drivers. This study provides insights into quantifying and mitigating the flicker effect in LMHLs, as well as presenting novel approaches and strategies for enhancing the efficiency and reducing light pollution of streetlamps.
1. Introduction
The invention of electric light sources allowed human activities to continue at night. From the 20th century onwards, cities and towns around the world have gradually applied artificial lighting at night (ALAN) [1]. In recent decades, the low cost and controllability of LED technology has prompted ALAN to expand in scale and form, which has increased night sky brightness and has changed its spectral composition, disrupting the rhythms of natural ecosystems. In Europe, more than 900 million lights account for more than 50% of public energy consumption, accounting for about 60% of relative costs and generating significant greenhouse gas emissions [2]. Research shows that 80% of the world’s population and 99% of the US and European populations live under a light-polluted sky [3]. Numerous studies have begun to reveal the impact of ALAN on human health [4], bird migration [5], plant growth [6], fish distribution [7], microbial diversity, and community respiration [8].
Road lighting plays an important role in ensuring safety during night-time travel. Unfortunately, according to various reports, street lighting is one of the largest consumers of electrical energy, accounting for approximately 40% of total urban energy consumption [9]. Additionally, the brightness contributed by street lighting to the urban sky is astonishing [10,11]. Recently published data from Galicia, Spain, show that, in the early evening, street lighting contributed 80% of the sky glow, rising to nearly 100% in the late night hours [11]. Traditional high pole streetlamps are too far from the road surface, resulting in low effective illumination. In order to meet basic lighting requirements, high-power light sources must be used, thus increasing energy consumption and providing more ineffective light to the environment [12,13,14,15,16,17]. Low-mounting-height luminaires (LMHLs) using LEDs as light sources are used in many Chinese city viaducts to replace traditional amber or yellow HPS (high-pressure sodium) lamps due to their high luminous efficiency, low energy consumption, low load, and ease of installation and maintenance [18,19,20].
LMHLs refers to luminaires installed less than 1.5 m from the ground and placed along the side of the road. Due to the proximity of the luminaire to the plane of the human visual axis, a high-luminance light source is often used to directly illuminate the center of the road in order to illuminate the broad surface of the roadway. Consequently, more light spills into the environment, and a severe glare is formed on the surface of the lamp, causing alternating lines of light and dark to appear on the road surface. This severe light spill disrupts the ecological rhythm and threatens driver safety [21,22,23]. When a driver is traveling through such an environment, the perception of visual artefacts is formed on the retina. CIE TN 006:2016 [24] defines the effect as a flicker effect, which is similar to the stroboscopic effect [22,23] in tunnel lighting (shown in Figure 1).
The stimulation of the retina by discontinuous light causes flickering. According to Bloch’s law, flash luminance and flash duration produce the same perception [25]. The strength of the flicker is related not only to the flicker frequency but also to the luminance contrast of the light signal. Experimental studies [26] have shown that, as the contrast of the squares on the CRT screen with a white background increases, the human eye perceives an increase in the integration time of the next signal. Similar studies [27,28] have also noted that a higher-stimulus luminance prolongs the time over which the human eye recognizes the next stimulus signal. One can read in CIE 88-2004 that “When the frequency is between 4 Hz and 11 Hz, and has duration of more than 20 s, discomfort may arise provided no other measures are taken” [29]. However, CIE 88-2004 focuses on the flicker effect in tunnel lighting, while research on the flicker effect in LMHLs has been seldom reported. Nonetheless, some scholars have referred to the provisions of CIE 88-2004 to investigate the flicker effect generated in outdoor road contexts [30].
Many studies have shown that the sensitivity of the human eye to flicker is related to the flicker frequency [31,32,33,34]. The International Electrotechnical Commission (IEC)-derived sensitivity reaches peak sensitivity at 8.8 Hz [35]. Bodington’s [34] research shows that the 15 Hz waveform has a greater impact on human visual sensitivity. Some papers [36,37,38,39,40] have pointed out that the negative effects of flicker include causing visual fatigue in human eyes, a decline in visual acuity [40], and other changes in visual characteristics that can further lead to physical discomfort, such as nervousness, anxiety, and irritability [41,42], which are also important factors in triggering photosensitive epilepsy [43,44,45]. Studies have shown that alternating light and dark spatial patterns [44,46,47], particularly stripes [48,49,50,51,52], can cause epilepsy. Jeavons and Harding [42] tested 170 photosensitivity patients and showed that flicker frequencies between 15 and 20 Hz are more uncomfortable and more prone to cause both a loss of direction and epileptic seizure.
CIE 88-2004 clearly states that the degree of visual discomfort caused by flicker depends on (1) the number of changes in luminance per second, (2) the total duration of stimulation, and (3) the ratio of the peak (bright) luminance to the valley (dark) luminance (i.e., the luminance modulation depth) and the steepness in the increase (rise-time). At frequencies below 2.5 Hz and above 15 Hz, the flicker effect is negligible. Conditions (1), (2), and (3) depend on the speed of the vehicle and the spacing of the streetlamps. By dividing the speed v by the distance D to the illumination device, the flicker frequency can be determined as f = v/D. Rami [53] claims that the visual discomfort caused by flicker depends on (1) the frequency at which the luminaires are passed, (2) the quantity of light penetrating into the cockpit, and (3) the distance between the luminaire and the vehicle. Van Bommel [38] thinks that the degree of discomfort depends on (1) the number of flickers occurring per second, (2) the total duration of the flicker, i.e., the total time spent in a flickering environment, and (3) the photometric properties of the luminaire, especially its peak luminance value and the sharpness of its light distribution. One thing that these hypotheses have in common is that the frequency and duration of the flicker have a notable effect; in addition, CIE 88-2004 [29] and van Bommel [54] broadly point out the effect of the ratio of the flicker peak to the valley luminance on visual discomfort. Rami also emphasizes the amount of light entering the cockpit, because this parameter determines the amount of light that the driver’s retina can accept.
The Illuminating Engineering Society (IES) [55] has published the flicker percent [56] and flicker index (FI) [57] as traditional evaluation indicators for electric light-sourced flicker; these indicators are also suitable for evaluating the flicker effect of LMHLs. However, the flicker percent and FI are not related to frequency. In previous studies, some researchers used frequency to quantify flicker, and some researchers considered the frequency, flicker percent, and shape (including duty cycle) of the light waveform, but their main object was electric light sources [22,23,58,59]. However, they rarely considered the effect of LMHL flicker light energy. The main cause of the flicker effect is the flicker light energy. A model for calculating the flicker effect in LMHLs has been proposed and published according to the IES definition of FI [22,55]:
where and . L is the luminance of the streetlamp surface, B is the ambient luminance, D is the spacing between two adjacent streetlamps, and S is the length of the luminous surface of the streetlamp. represents the contrast between streetlamp surface luminance and background luminance, and is the duty cycle. The strength of the flicker effect for a given luminaire can be evaluated by measuring four parameters (L, B, D, S) and calculating the FI [22]. However, the condition of this paper is that the observer is stationary. In actual situations, the driver is moving relative to the streetlamps. The retina receives a periodic and dynamic light energy.
Persistence of vision and visual masking are important parts of visual perception [18]. This work revised the FI model proposed in [22] based on visual persistence and visual masking, and explained the flicker effect from the perspective of dynamic energy ratio. The effective luminous flux of streetlamps and a forward and reverse low-mounting-height lighting method is proposed. This study provides assistance in quantifying flicker effects and reducing them in LMHLs. Additionally, it offers new methods and ideas for improving the efficiency of streetlights and reducing light pollution caused by stray light from streetlights.
This article is organized into the following sections: Section 2 provides an overview of both visual persistence and masking. Section 3 uses the theory from Section 2 to revise the FI model, with the essence of the scintillation effect as the energy ratio in the model. Section 4 proposes the concept of effective luminous flux of street lamps, combines the theory of Section 3 to propose forward and reverse lighting methods, and compares the lighting parameters in two practical projects. Section 5 is the discussion. Section 6 is the conclusion.
2. Human Visual Characteristics
2.1. Persistence of Vision
The visual appearance and disappearance of an image has a certain inertia. When a certain intensity of light suddenly strikes the retina, the eye does not immediately form a stable subjective feeling of stimulation, but rather experiences a short process of establishing an image. As the duration of action increases, the subjective stimulation increases first from small to maximum size, and then decreases back to a stable value. There is also a process by which the image disappears. When the light striking the retina disappears, the stimulation feeling does not disappear instantaneously, but gradually decreases according to an approximately exponential function. These have been verified in primates [60,61].
As shown in Figure 2, curve (a) is the periodic light stimulus, curve (b) is the subjective luminance perception curve of the human eye, and is the organ response establishment time. is the time of visual persistence. is the value of the periodic optical signal, and is the value of the light signal perceived by the human eyes. Consider a periodically repeated pulse of light from a source acting on a human retina, with t representing time. When the time interval of the repeated occurrence of this pulsed light is greater than in Figure 2b, a sensation of alternating bright and dark flashes will appear on the retina of the human eye.
2.2. Visual Masking
Visual masking refers to the degradation of the visibility of an object under certain conditions by the appearance of another object adjacent to it in space or time [62]. For LMHLs, the masks are uniform background flashes, and are mainly for achieving fast or instantaneous adaptations to light and dark. In this case, the streetlamp surface luminance and the background luminance appear in the eyes of the perceiving person. The processing of the light and dark adaptations that mainly occur in the retina under natural conditions can be described as the former and backward masking [63]. Battersby’s research shows that the masking effect of the background on the target is obvious when the masking is caused by a change in illumination, that is, when the target and the background appear in the human eye simultaneously [64].
The visual masking effect of the human eye is a local effect. When a driver is in relative motion within an environment illuminated with LMHLs, as the speed of motion increases, the bright image produced by an illuminated streetlamp on the retina of the human eye will mask the dark image produced by the gap between two streetlamps, and the strength of this mask depends on the brightness of the street surface, the spacing, and the speed of the vehicle. Figure 3 shows an actual picture of a laboratory simulation of light and dark masking. The camera shutter speeds are 1/30, 1/25, 1/8, and 1/5 from left to right, and the speed of the lamp relative to the camera is 0, v, 2v, 4v, and 6v, respectively. Obviously, under the same shutter speed, the greater the relative speed is, the longer the image becomes, finally becoming a continuous strip of light; in addition, the smaller the shutter speed is, the longer the exposure time and the longer the image of the lamp become, finally generating a continuous light band. The magnitude of the shutter speed is similar to the length of the human eye’s persistence time. Figure 4 illustrates the process of mapping an image onto the retina of the human eye.
3. Flicker Index Analysis
3.1. FI Model Revision
Persistence of vision and visual masking affect the value of (duty cycle). Figure 5a shows that the streetlamp image (yellow) and the background image (grey) will not be extended without visual persistence and masking effect. The image of the streetlamp (yellow) and the background (grey) will be extended with visual persistence but no masking effect, but the image that appears first covers the image that appears next, resulting in the length of streetlamp image (yellow) and background image (grey) remaining unchanged (Figure 5c). The image of the streetlamp (yellow) and the background (grey) will be extended when there both persistence of vision and masking effects are present, and the image that appears first covers the image that appears next, but the streetlamp image (yellow) will mask the background image, resulting in the lamp image being elongated and the background image being compressed (Figure 5b). When the speed is not 0, this effect is more obvious (Figure 5d).
The duty cycle of the FI model in Equation (1) is the ratio of streetlamp spacing (D) to the actual size of the streetlamp (S). That is, the driver is stationary. In this case, the duty cycle is defined as the static duty cycle, expressed as . The size of the light source perceived by the human eye has the following relationship with the actual size of the light source :
where is the conversion coefficient of perception of the human eye.
When a driver moves relative to a series of streetlamps, the streetlamps generate an image of a continuous line on the retina. Because of the persistence of vision and the masking effect, the image of the streetlamp on the retina is elongated. The size of the elongated portion is determined by the product between the visual persistence time and the relative motion velocity . The duty cycle in this state is defined as the dynamic duty cycle, expressed as . The size of the light source perceived by the human eye has the following relationship with the actual size of the light source :
In Equation (5), the human persistence of vision time is not zero. Studies have shown that under normal conditions, the human eye recognizes a coherent image at a speed of 24 frames per second, while the human eye feels comfortable with an image update speed of at least 30 frames per second [51]. The relationship between and can be derived from the function shown in Figure 6. The red line is the projection line of in the plane of and D. When the speed is 0, ; when the speed gradually increases, gradually decreases; at the position v = 0, there is a maximum value, which is .
Therefore, according to Equations (1) and (5), the revised FI model expression is:
where L is the luminance of the streetlamp surface. B is the ambient luminance. D is the spacing between two adjacent streetlamps. S is the length of streetlamp surface luminance. t is the time of persistence of vision. v is speed of the driver.
3.2. The Nature of the Flicker Effect Is the Energy Ratio
For the flicker effect to occur in a driver’s vision, two conditions must be satisfied: (1) the photo stimulation signal must have a brightness contrast, and (2) the driver must move relative to the photo stimulation signal. When relative motion occurs and there is no difference in luminance, or there is a difference in luminance without relative motion, no flicker effect occurs, and the intensity of the flicker effect is determined by both conditions. The flicker effect is evaluated by the FI, which in turn is determined by the flicker luminance contrast and the duty cycle . However, the essence of both the flicker brightness contrast and the duty cycle is the energy ratio.
The ratio of the flicker light signal brightness to the ambient brightness , which embodies the brightness contrast, is actually the human eye sensing a photo stimulation signal. Spatially, a high-brightness streetlamp and the gap between two streetlamps form a sharp brightness contrast. Due to the problem created by the projection of light and the grading of a luminaire, light and dark stripes are formed on the road surface. As shown in Figure 7, the brightness of the surface of the lamp is reduced (the value is decreased), and the human eye feels a decrease in stimulation, indicating that the received photo stimulation energy is reduced.
When a driver is not in relative motion, although there is a difference in brightness, the driver’s vision does not feel a flicker stimulus. Let the energy stimulating the human eye per unit area of the light source be ; that is, let the stimulating energy received by the human eye by a single light source in the static state be .
Since the human eye is visually inert, the image of the original light source in the eye is retained for a period of time, and the size of the light source perceived by the human eye is obviously elongated. The intensity of this sensation is determined by the product between the visual persistence time and the speed of relative motion. Let the stimulating energy received by the human eye by a single light source in the dynamic state be :
The following can be obtained from Equations (7) and (8):
It can be seen from Equation (9) that, when a driver moves relative to a light source, the human retina receives more energy, which can be calculated as . is increased by relative to ; due to the inertia of the human eye, the duration of stimulation for the human eye is prolonged, and the stimulation energy received by the retina is increased. As shown in Figure 8, the camera shutter speeds are 1/30, 1/25, 1/8, and 1/5, and the speed of the lamp relative to the camera is 0, v, 2v, 4v, and 6v. When the shutter speed is the same, the higher the relative motion speed of the lamp is, the longer the image of the lamp, the larger the area, and the higher the energy. At the same relative motion speed, the exposure time is longer, the image of the lamp is prolonged, and the energy is higher. Under the same brightness, the human eye receives more signal energy if the camera exposure time is longer (if the human eye persistence time is longer) and the speed of relative motion is faster.
Therefore, when the streetlamp spacing and are constant, it is necessary to reduce the flicker effect only when the speed approaches 0 or when the speed is very large such that is satisfied. There are two conditions here: (1) The speed approaches 0; (2) The speed is increased such that is satisfied. Under condition 1, the speed approaches zero, which is equivalent to the static state. At this time, if the value of is large, the spatial frequency will increase, and there will still be some discomfort. Under condition 2, when , that is, when the image of the previous signal remaining on the retina has not yet disappeared, the next signal will appear at , when the images of the two stimuli in the retina overlap, as shown in Figure 9. The time that the bright image of the streetlamp remains in the human eye is . If the next bright image of the streetlamp is presented within the time , the object is continuously sensed. At this time, the human eye visually senses a continuous band of light, and the flicker effect is weakened.
4. Forward and Reverse Low-Mounting-Height Lighting
The perception of road surface brightness by the human eye is determined by the luminous flux emitted by the streetlight, which is reflected by the road surface and enters the human eye. Only the luminous flux that is reflected by the road surface and enters the driver’s eye is considered effective. Increasing the effective luminous flux of streetlights is the main approach to reducing energy consumption and minimizing scattered light. As shown in Figure 10, represents the scattered luminous flux of the streetlight, represents the directional luminous flux of the streetlight that can enter the human eye, and represents the reflected luminous flux of the light source on the road surface, which is related to the reflection coefficient ρ of the road surface. represents the component of the reflected luminous flux in the driver’s line of sight, while and are the ineffective components. α is the incident angle of the light source, i.e., the angle between the normal of the road surface and the direction of the light source. φ is the angle between the direction of the driver’s line of sight and the road surface, and θ is the angle between the plane of the light source direction and the plane of the driver’s line of sight. Reducing and increasing are the primary methods for improving the efficiency of street lighting and reducing light pollution, and and are related to the optical distribution of luminaires. Increasing α and decreasing θ are the main ways to increase , and α and θ are related to the primary emission direction and height of luminaires. For traditional high mast lighting and LMHLs, the effective is small, and is large. The light is projected vertically onto the road, so α is small and θ is large. Therefore, these lighting methods and luminaires have low effective light flux entering the driver’s eyes, resulting in low utilization efficiency of effective light and increased useless light. This is also why they contribute greatly to energy consumption and light pollution.
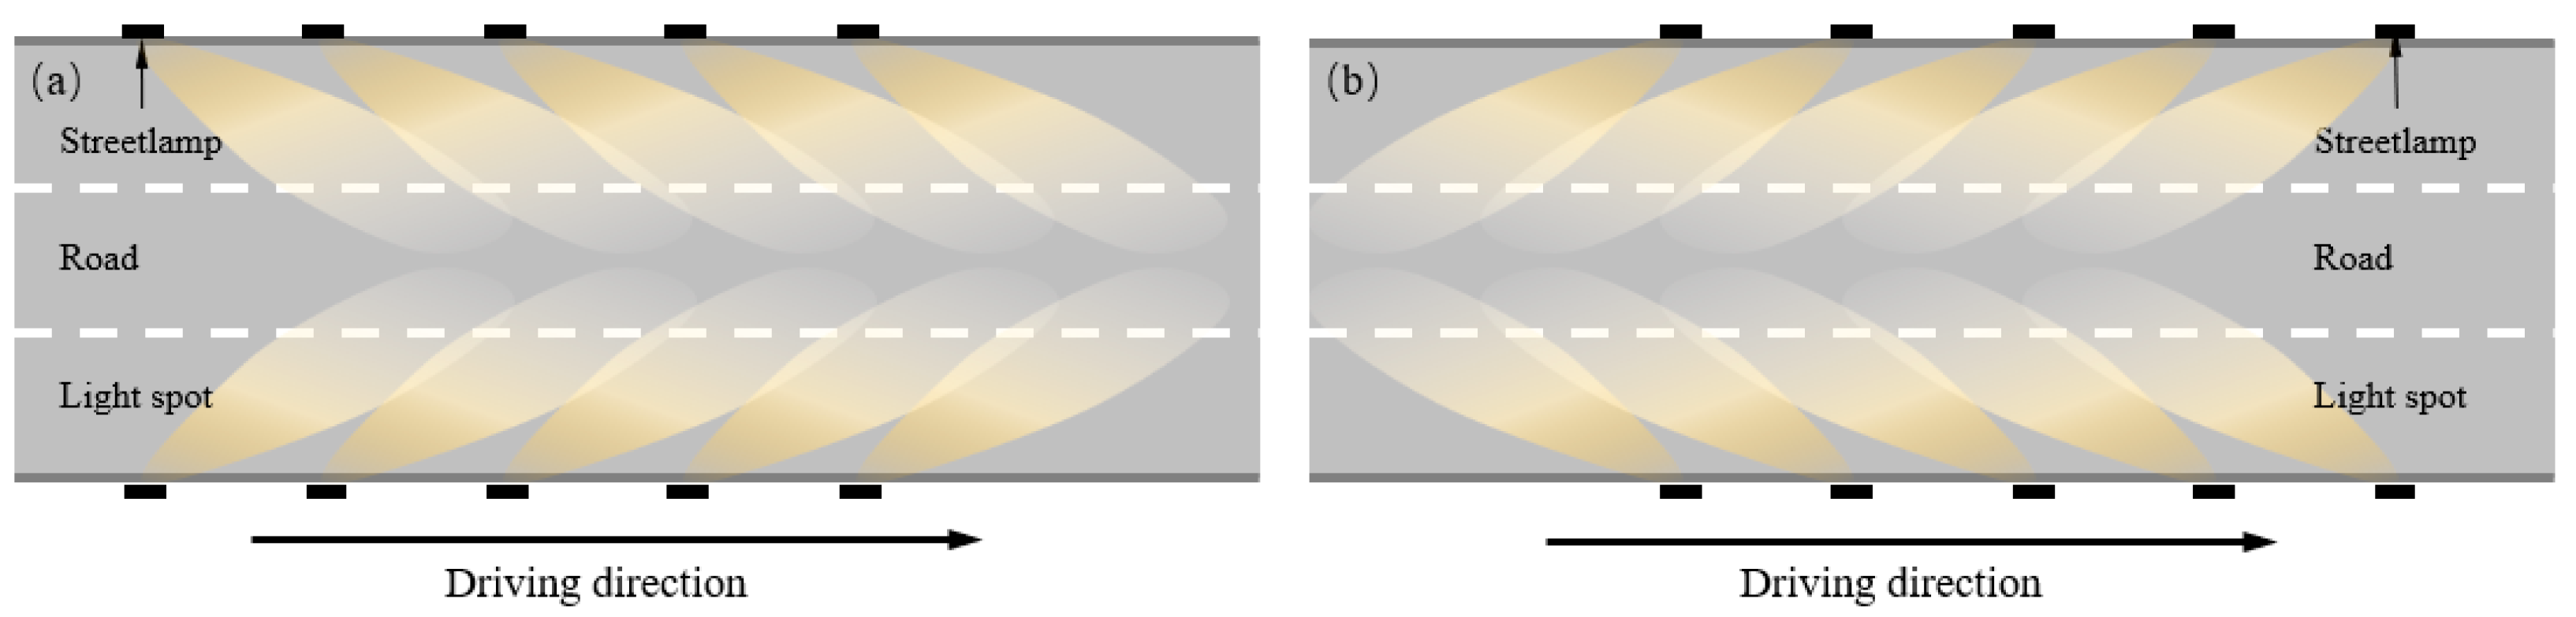
On the aforementioned analysis, we propose a low-mounting-height lighting solution with both forward and reverse lighting [21,65,66]. Forward lighting refers to the light emitted by the luminaire in the direction of the driver’s travel, as demonstrated in Figure 11a, whereas reverse lighting refers to the light emitted by the luminaire in the opposite direction to the driver’s travel, as shown in Figure 11b. These two lighting methods no longer illuminate the area near the luminaire, but illuminate the area at a certain distance from the luminaire, and the choice of forward and reverse lighting methods depends on the roughness (ρ) of the road surface. The implementation of both forward and reverse lighting methods reduces the θ, while LMHLs lead to an increase in the α angle. Both approaches result in an increment of the effective luminous flux of the luminaire. We developed a LMHL based on this principle and tested it on the Qingshan Yangtze River Bridge in Wuhan, China. Figure 12a displays the field test scene, and Figure 12b exhibits the scene’s brightness distribution. Figure 12c–e showcase the luminaire we employed, including the luminaire surface brightness, and Figure 12f depicts the brightness distribution of the bridge surface. We also tested a bridge in Shenzhen, China, using existing LMHLs that projected light directly onto the road center, as shown in Figure 13b. For both tests, we employed the Radiant Vision System Imaging Photometer and Colorimeter, as well as the luminance and glare test equipment produced by Huaying Optoelectronics (GM-2000 model). The testing apparatus was installed at a height of 1.5 m and situated 60 m away from the center of the bridge deck that was being tested. Detailed test parameters and results are available in Table 1.
The following conclusions can be drawn from the data in the tables:
- The value has a greater impact on FI value;
- The 12° irradiation method can illuminate a wider road than the 90° irradiation method;
- The main method for reducing the FI value is to coordinate the relationship between and ;
- The average road surface brightness, overall uniformity, and longitudinal uniformity of the bridges in Wuhan were found to be higher than those in Shenzhen, indicating that the lighting effect in Wuhan was superior to that in Shenzhen;
- The FI value obtained from Equation (1) for the Shenzhen bridge test is significantly higher, at 35.6%, in comparison to Wuhan’s value of 2.86%. This discrepancy is mainly due to the excessive surface luminance of the lamps utilized in Shenzhen. The average luminance of the lamps surface in Shenzhen is 9495.74 cd/m2, while that of Wuhan is only 1.18 cd/m2. As compared to the surface luminance of existing low-installation-height lamps in Shenzhen, the surface luminance of Wuhan lamps only accounts for 0.012%, which results in a 99.988% reduction in stray light;
- Based on the definition of road flicker frequency in CIE 88-2004, the flicker frequency is 7.41 Hz for the Shenzhen bridge and is 3.47 Hz for the Wuhan bridge, both of which are in the range not recommended by CIE 88-2004;
- Another approach to reduce flicker is to decrease the spacing D between luminaires, but this may result in an increase in LPD. According to the guidelines of CIE136-2000 [67], LPD should not exceed 1 W/m2. Wuhan’s tested lamps saved 60% of the electricity compared to the CIE standard, while compared to conventional low-installation-height lamps in Shenzhen, they saved 81% of electricity.
- By comparing the Threshold Increment (TI) and Flicker Index (FI) values of the two bridges, it is evident that reducing the surface luminance of lamps significantly reduces both indices.
5. Discussion
Compared with traditional high pole lamps, LMHLs are easier for workers to maintain and repair, with relatively low maintenance costs. Their installation height is aligned with the driver’s visual plane and extends along the edge of the road, facilitating the driver’s identification of the direction of the road. While LMHLs have a smaller spacing between lamps than high pole lamps, increasing the number of luminaires can lead to higher manufacturing costs. However, there is no need to set up additional support or bulky lamp posts, which is advantageous for bridges as it reduces the load on the bridge structure.
The current LMHLs direct their light directly into the center of the road. As a result, a significant proportion of the emitted light from street lamps fails to enter the driver’s visual field and scatters into the surrounding environment, resulting in a lower effective luminous flux. The effective luminous flux of the street lamp is related not only to the reflective properties of the road surface, but also to the direction of the light emission from the lamp post. The latter requires that the light emitted by the street lamp is reflected off the road surface as close to parallel as possible to the driver’s line of sight. The illumination of forward and reverse light sources should approach parallel directions with the driver’s line of sight.
Currently, the high surface brightness of LMHLs causes high contrast with the background, leading to potentially significant flicker effects and light pollution due to excessive scattered light. Of course, reducing the upward light ratio (ULR) and surface scattered light of the street lamp, improving the light efficiency of the street lamp source, and optimizing the spectral power distribution (SPD) of the street lamp are all possible measures by which to reduce the contribution of street lamps to light pollution.
Flicker is a subjective sensation in humans, which is related to factors such as the frequency, duty cycle, modulation depth, and luminance contrast of the flickering light [68]. In 1961, Kelly [69] demonstrated through experimental evidence that, with increasing luminance contrast of the stimulus, the sensitivity and peak frequency of the human eye also increase, as show in Figure 14.
The flicker effect is a parameter that needs to be considered in tunnel lighting. However, there are currently no relevant standards specifying the flicker effect in LMHL illumination. This paper refers to the calculation method and threshold for flicker frequency in tunnel lighting outlined in CIE 88-2004 [29]. The CIE recommends that flicker frequency (f) be smaller than 2.5 Hz or greater than 15 Hz, and that the flicker frequency is equal to the ratio of the streetlamp separation distance (D) to the driving speed (v). This definition is not complete for three reasons: (1). This recommendation ignores the essence of flicker as an energy ratio. Experimental studies [21,22] have shown that reducing the intensity of the light energy can effectively alleviate the degree of visual fatigue. (2). Specific studies [41,42] have shown that people with epilepsy are most sensitive to frequencies of 15–20 Hz (Figure 15). (3). Frequencies smaller than 2.5 Hz or greater than 15 Hz are inconvenient in the installation of streetlamps in practical engineering applications [21,22]. When the vehicle speed is 40 km/h, the distance between two lamps should be greater than 4.5 m or less than 0.7 m, which brings inconvenience to the installation of street lights in actual projects (Figure 16). As is widely recognized, the physiological and psychological effects experienced by drivers when operating vehicles in tunnels and open roads differ. Consequently, they may exhibit varying sensitivities to flicker frequency. In the future, it will be necessary to conduct research on the threshold values of flicker frequency in LMHL illumination under these conditions.
The present paper builds upon prior studies. The nature of the flicker effect has been thoroughly explored, particularly in Ref. [22], which analyzed light energy intensity. Nevertheless, it must be noted that the flicker index (FI) in Ref. [22] is centered on the static flicker effect. This approach does not account for the dynamic process that ensues from the relative movement between a driver and a light source, which results in periodic stimulation of human vision by means of varying light energy.
The time for streetlamps to be imaged on the retina is prolonged because of the persistence of vision. The imaged area of the street lamp on the retina increases due to visual masking. According to these two characteristics, the FI model is revised. The revised FI model, which is related to the driver’s motion state, has a larger range than the model before the revision, and is more meaningful in actual engineering. Since the persistence time of the human eye is related to the age of the observer, the received light intensity, the environment, the degree of visual fatigue, the color of the light source, and other factors, the sensations of different people will vary. Hence, the evaluation criteria must be developed further. If the persistence time (t) is less than the time taken for the second light source to appear (D/v), then the driver will visually sense a flicker. If the persistence time (t) is greater than the time taken to pass two streetlamps (D/v), the sensation of the driver will transform from a point light source to a line source, and the image of the bright area will convert into a long, bright line, masking the image of the dark area. Increasing the vehicle velocity and decreasing the inter-lamp spacing may alleviate the flicker effect, but such measures also increase the possibility of traffic accidents at higher speeds or inflate project costs through smaller spacing. Moreover, these adjustments may increase the threshold increment (TI) value. Its calculation can be found in Ref. [70]. For traditional high pole lights, the flicker effect is almost negligible, but for LMHLs, the flicker effect affects the driver’s visual comfort. When LMHLs use continuous light bars, the flicker effect is significantly reduced, but the TI value will increase significantly due to the proximity of the light-emitting surface of the street lamp to the driver’s line of sight. When using spaced luminaires, the TI value will decrease, but the FI value will increase significantly. Therefore, an evaluation of an LMHL with TI or FI alone is not comprehensive. Therefore, for LMHLs, a combination of these two indices should be used.
The key technology to reduce the flicker effect is to reduce the energy ratio of lamp surface light to ambient light. There are two ways to reduce the energy ratio: (1) Increase the ambient luminance; (2) reduce the surface luminance of the streetlamp. They have different meanings for different scenarios and people. For open roads, increasing the luminance of the background helps to improve the visibility of the target to ensure environmental safety. For closed roads, reducing the surface luminance of streetlamps is conducive to saving energy and reducing light pollution. When the surface luminance of the streetlamp decreases, the contrast with the background luminance decreases, and the stimulation to the human eye decreases. At this time, it is only necessary to adjust the uniformity of the road surface through a reasonable light distribution technology to reduce road surface streaks.
6. Conclusions
The conventional LMHLs are known to exhibit high surface brightness and serious scattered light, which consequently result in significant environmental interference and elevated energy consumption. This condition is mainly attributed to the limited effective luminous flux of the emitted light into the driver’s field of vision, leading to low light utilization efficiency. The projected light output from these fixtures is directed specifically towards the center of the road to fulfill the lighting requirements of the middle of the road. Moreover, the intense brightness of the lighting fixture surface generates a sharp contrast with the low luminance levels of the surrounding environment. As a consequence, when a driver moves relative to the LMHLs in this environment, a potent flicker effect emerges on the retina, causing visual fatigue and discomfort to the human eye. The intensity of the flicker effect is evaluated using the FI, which is a function of luminance contrast and duty cycle. The luminance contrast represents the ratio of light energy, and due to the persistence of vision and visual masking, the energy stimulus received by the retina increases while the driver moves. In this paper, an updated version of the FI model has been proposed, which offers a wider scope and practical significance than its predecessor. From the revised FI model, it is evident that two approaches can be utilized to reduce the flicker effect: reducing the luminance contrast and increasing driving speed. However, increased speed has new effects on the driver. To lower the luminance contrast, measures such as reducing the surface luminance of street lights and increasing ambient luminance must be implemented. Achieving reduced surface luminance requires new illumination angles and lighting solutions for the lighting fixtures. On the other hand, enhancing the ambient luminance can cater to the diverse needs of different groups of people, such as those with poor eyesight, and different application scenarios.
This study proposes the notion of effective luminous flux with respect to lighting fixtures. This refers to the part of luminous flux in the light generated by streetlights that is reflected through the road surface and enters a driver’s vision to elicit visual perception. Through an analysis of the effective luminous flux of lighting fixtures, we suggest two lighting methods: forward and reverse low-height lighting. Forward lighting refers to illumination in the direction of the driver’s travel and is suitable for rough road surfaces, whereas reverse lighting describes illumination in the opposite direction of the driver’s travel and is recommended for smoother road surfaces. These two lighting methodologies effectively increase the effective luminous flux emanating from the lighting fixtures, decrease the surface luminance of said fixtures (i.e., reduce scattered light), and eliminate flicker effects.
Our practical tests reveal that the energy consumption of these forward and reverse LMHLs is 60% lower than international standards and 81% lower than existing LMHLs. In terms of light pollution, the surface brightness of the forward and reverse lighting fixtures is only 1.18 cd/m2, which accounts for merely 0.001% of the surface brightness of traditional lighting fixtures. As such, stray light is reduced by 99.89%, and the flicker intensity of these fixtures is only 2% of that of existing fixtures, significantly reducing the impact of flicker effect on drivers.
This study offers valuable insights into the quantification and mitigation of the flicker effect associated with LMHLs. Furthermore, it presents novel approaches and strategies aimed at enhancing the efficiency of street lighting and decreasing light pollution stemming from stray light emitted by street lamps.
Author Contributions
Conceptualization, S.C., Y.L. and H.Z.; methodology, S.C. and H.Z.; software, B.Z.; validation, S.C. and B.Z.; writing—original draft preparation, S.C.; writing—review and editing, S.C. and Y.L.; visualization, S.C., B.Z. and X.Z. All authors have read and agreed to the published version of the manuscript.
Funding
This research was funded by the National Natural Science Foundation of China, grant number 52078357.
Institutional Review Board Statement
Not applicable.
Informed Consent Statement
Not applicable.
Data Availability Statement
Not applicable.
Conflicts of Interest
The authors declare no conflict of interest.
References
- Pérez Vega, C.; Zielinska-Dabkowska, K.M.; Schroer, S.; Jechow, A.; Hölker, F. A Systematic Review for Establishing Relevant Environmental Parameters for Urban Lighting: Translating Research into Practice. Sustainability 2022, 14, 1107. [Google Scholar] [CrossRef]
- Petritoli, E.; Leccese, F.; Pizzuti, S.; Pieroni, F. Smart lighting as basic building block of smart city: An energy performance comparative case study. Measurement 2019, 136, 466–477. [Google Scholar] [CrossRef]
- Falchi, F.; Cinzano, P.; Duriscoe, D.; Kyba, C.C.M.; Elvidge, C.D.; Baugh, K.; Portnov, B.A.; Rybnikova, N.A.; Furgoni, R. The new world atlas of artificial night sky brightness. Sci. Adv. 2016, 2, e1600377. [Google Scholar] [CrossRef]
- Malaguarnera, R.; Ledda, C.; Filippello, A.; Frasca, F.; Francavilla, V.C.; Ramaci, T.; Parisi, M.C.; Rapisarda, V.; Piro, S. Thyroid Cancer and Circadian Clock Disruption. Cancers 2020, 12, 3109. [Google Scholar] [CrossRef] [PubMed]
- Smith, R.A.; Gagné, M.; Fraser, K.C. Pre-migration artificial light at night advances the spring migration timing of a trans-hemispheric migratory songbird. Environ. Pollut. 2021, 269, 116136. [Google Scholar] [CrossRef] [PubMed]
- Singhal, R.K.; Kumar, M.; Bose, B. Eco-physiological Responses of Artificial Night Light Pollution in Plants. Russ. J. Plant Physiol. 2019, 66, 190–202. [Google Scholar] [CrossRef]
- Bassi, A.; Love, O.P.; Cooke, S.J.; Warriner, T.R.; Harris, C.M.; Madliger, C.L. Effects of artificial light at night on fishes: A synthesis with future research priorities. Fish Fish. 2021, 23, 631–647. [Google Scholar] [CrossRef]
- Hölker, F.; Wurzbacher, C.; Weißenborn, C.; Monaghan, M.T.; Holzhauer, S.I.J.; Premke, K. Microbial diversity and community respiration in freshwater sediments influenced by artificial light at night. Philos. Trans. R. Soc. Lond. B Biol. Sci. 2015, 370, 20140130. [Google Scholar] [CrossRef]
- Ożadowicz, A.; Grela, J. Energy saving in the street lighting control system—A new approach based on the EN-15232 standard. Energy Effic. 2017, 10, 563–576. [Google Scholar] [CrossRef]
- Kyba, C.C.M.; Ruby, A.; Kuechly, H.U.; Kinzey, B.; Miller, N.; Sanders, J.; Barentine, J.; Kleinodt, R.; Espey, B. Direct measurement of the contribution of street lighting to satellite observations of nighttime light emissions from urban areas. Light. Res. Technol. 2020, 53, 189–211. [Google Scholar] [CrossRef]
- Bara, S.; Rodriguez-Aros, A.; Perez, M.; Tosar, B.; Lima, R.; de Miguel, A.D.; Zamorano, J. Estimating the relative contribution of streetlights, vehicles, and residential lighting to the urban night sky brightness. Light. Res. Technol. 2019, 51, 1092–1107. [Google Scholar] [CrossRef]
- Mehri, A.; Hajizadeh, R.; Farhang Dehghan, S.; Nassiri, P.; Jafari, S.M.; Taheri, F.; Zakerian, S.A. Safety Evaluation of the Lighting at the Entrance of a Very Long Road Tunnel: A Case Study in Ilam. Saf. Health Work 2017, 8, 151–155. [Google Scholar] [CrossRef] [PubMed]
- Mehri, A.; Farhang Dehghan, S.; Abbasi, M.; Beheshti, M.H.; Sajedifar, J.; Jafari, S.M.; Khadem, M.; Hajizadeh, R. Assessment of contrast perception of obstacles in a tunnel entrance. Health Promot. Perspect. 2018, 8, 268–274. [Google Scholar] [CrossRef]
- Mehri, A.; Sajedifar, J.; Abbasi, M.; Naimabadi, A.; Mohammadi, A.A.; Teimori, G.H.; Zakerian, S.A. Safety evaluation of lighting at very long tunnels on the basis of visual adaptation. Saf. Sci. 2019, 116, 196–207. [Google Scholar] [CrossRef]
- Qin, L.; Dong, L.L.; Xu, W.H.; Zhang, L.D.; Leon, A.S. Influence of Vehicle Speed on the Characteristics of Driver’s Eye Movement at a Highway Tunnel Entrance during Day and Night Conditions: A Pilot Study. Int. J. Environ. Res. Public Health 2018, 15, 656. [Google Scholar] [CrossRef]
- Peña-García, A. Optical coupling of grouped tunnels to decrease the energy and materials consumption of their lighting installations. Tunn. Undergr. Space Technol. 2019, 91, 103007. [Google Scholar] [CrossRef]
- Grubisic, M.; Haim, A.; Bhusal, P.; Dominoni, D.M.; Gabriel, K.; Jechow, A.; Kupprat, F.; Lerner, A.; Marchant, P.; Riley, W. Light Pollution, Circadian Photoreception, and Melatonin in Vertebrates. Sustainability 2019, 11, 6400. [Google Scholar] [CrossRef]
- Ansorge, U.; Francis, G.; Herzog, M.H.; Oğmen, H. Visual masking and the dynamics of human perception, cognition, and consciousness A century of progress, a contemporary synthesis, and future directions. Adv. Cogn. Psychol. 2008, 3, 1–8. [Google Scholar] [CrossRef]
- Pena-Garcia, A.; Sedziwy, A. Optimizing Lighting of Rural Roads and Protected Areas with White Light: A Compromise among Light Pollution, Energy Savings, and Visibility. Leukos 2020, 16, 147–156. [Google Scholar] [CrossRef]
- Yoomak, S.; Jettanasen, C.; Ngaopitakkul, A.; Bunjongjit, S.; Leelajindakrairerk, M. Comparative study of lighting quality and power quality for LED and HPS luminaires in a roadway lighting system. Energy Build. 2018, 159, 542–557. [Google Scholar] [CrossRef]
- Chen, S.; Lin, Y.; Zhao, H. Effects of flicker with various brightness contrasts on visual fatigue in road lighting using fixed low-mounting-height luminaires. Tunn. Undergr. Space Technol. 2023, 136, 105091. [Google Scholar] [CrossRef]
- Chen, S.; Li, W.; Yang, S.; Zhang, B.; Li, T.; Du, Y.; Yang, M.; Zhao, H. Evaluation method and reduction measures for the flicker effect in road lighting using fixed Low Mounting Height Luminaires. Tunn. Undergr. Space Technol. 2019, 93, 103101. [Google Scholar] [CrossRef]
- Peña-García, A. The impact of lighting on drivers well-being and safety in very long underground roads: New challenges for new infrastructures. Tunn. Undergr. Space Technol. 2018, 80, 38–43. [Google Scholar] [CrossRef]
- Commission International de l’Éclairage (CIE). Visual Aspects of Time-Modulated Lighting Systems-Definitions and Measurement Models; Commission International de l’Éclairage (CIE): Vienna, Austria, 2016. [Google Scholar]
- Barlow, H.B. Temporal and spatial summation in human vision at different background intensities. J. Physiol. 1958, 141, 337–350. [Google Scholar] [CrossRef]
- Akyürek, E.G.; de Jong, R. Distortions of temporal integration and perceived order caused by the interplay between stimulus contrast and duration. Conscious. Cogn. 2017, 54, 129–142. [Google Scholar] [CrossRef] [PubMed]
- Ueno, T. Visible persistence: Effects of luminance, spatial frequency and orientation. Vis. Res. 1983, 23, 1687–1692. [Google Scholar] [CrossRef]
- Wilson, J.T.L. Effects of stimulus luminance and duration on responses to onset and offset. Vis. Res. 1983, 23, 1699–1709. [Google Scholar] [CrossRef]
- Commission International de l’Éclairage (CIE). Guide for the Lighting of Road Tunnels and Underpasses; Commission International de l’Éclairage (CIE): Vienna, Austria, 2004. [Google Scholar]
- Dondi, G.; Vignali, V.; Lantieri, C.; Manganelli, G. Effects of Flickering Seizures on Road Drivers and Passengers. Procedia Soc. Behav. Sci. 2012, 53, 711–720. [Google Scholar] [CrossRef]
- De Lange Dzn, H. Research into the dynamic nature of the human fovea-cortex systems with intermittent and modulated light. I. Attenuation characteristics with white and colored light. J. Opt. Soc. Am. 1958, 48, 777–784. [Google Scholar] [CrossRef]
- Kelly, D.H. Theory of Flicker and Transient Responses, I. Uniform Fields*. J. Opt. Soc. Am. 1971, 61, 537–546. [Google Scholar] [CrossRef]
- Rovamo, J.; Raninen, A. Modelling of Human Flicker Detection at Various Light Levels. Perception 1996, 25 (Suppl. S1), 129. [Google Scholar] [CrossRef]
- Bodington, D.; Bierman, A.; Narendran, N. A flicker perception metric. Light. Res. Technol. 2015, 48, 624–641. [Google Scholar] [CrossRef]
- Veitch, J.A.; McColl, S.L. Modulation of fluorescent light: Flicker rate and light source effects on visual performance and visual comfort. Int. J. Light. Res. Technol. 1995, 27, 243–256. [Google Scholar] [CrossRef]
- Zhang, X.; Zhao, X.; Du, H.; Rong, J. A Study on the Effects of Fatigue Driving and Drunk Driving on Drivers’ Physical Characteristics. Traffic Inj. Prev. 2014, 15, 801–808. [Google Scholar] [CrossRef]
- Qi, J. Study on Driving Fatigue Based on Ergonomics. Adv. Mater. Res. 2013, 706–708, 2119–2123. [Google Scholar] [CrossRef]
- Sturgis, S.P.; Osgood, D.J. Effects of Glare and Background Luminance on Visual Acuity and Contrast Sensitivity: Implications for Driver Night Vision Testing. Hum. Factors 1982, 24, 347–360. [Google Scholar] [CrossRef]
- Kwong, Q.J. Light level, visual comfort and lighting energy savings potential in a green-certified high-rise building. J. Build. Eng. 2020, 29, 101198. [Google Scholar] [CrossRef]
- Sullivan, J.M. Visual Fatigue and the Driver; University of Michigan Transportation Research Institute: Ann Arbor, MI, USA, 2008. [Google Scholar]
- Evans, R.W.; Digre, K.B. Light sensitivity in migraineurs. Headache 2003, 43, 917–920. [Google Scholar] [CrossRef] [PubMed]
- Jeavons, P.M.; Harding, G.F.A. Photosensitive Epilepsy: A Review of the Literature and a Study of 460 Patients; Heinemann: London, UK, 1975. [Google Scholar]
- Wilkins, A.J. Visual Stress; Oxford University Press Inc.: New York, NY, USA, 1995. [Google Scholar]
- Yoshimoto, S.; Garcia, J.; Jiang, F.; Wilkins, A.J.; Takeuchi, T.; Webster, M.A. Visual discomfort and flicker. Vis. Res. 2017, 138, 18–28. [Google Scholar] [CrossRef] [PubMed]
- Fisher, R.S.; Harding, G.; Erba, G.; Barkley, G.L.; Wilkins, A. Photic- and pattern-induced seizures: A review for the Epilepsy Foundation of America Working Group. Epilepsia 2005, 46, 1426–1441. [Google Scholar] [CrossRef]
- Marcus, D.A.; Soso, M.J. Migraine and stripe-induced visual discomfort. Arch. Neurol. 1989, 46, 1129–1132. [Google Scholar] [CrossRef]
- Chatrian, G.E.; Lettich, E.; Miller, L.H.; Green, J.R. Pattern-Sensitive Epilepsy. Epilepsia 1970, 11, 125–149. [Google Scholar] [CrossRef] [PubMed]
- Fernandez, D.; Wilkins, A.J. Uncomfortable images in art and nature. Perception 2008, 37, 1098–1113. [Google Scholar] [CrossRef] [PubMed]
- Juricevic, I.; Land, L.; Wilkins, A.; Webster, M. Visual discomfort and natural image statistics. Perception 2010, 39, 884–899. [Google Scholar] [CrossRef]
- O’Hare, L.; Hibbard, P.B. Spatial frequency and visual discomfort. Vis. Res. 2011, 51, 1767–1777. [Google Scholar] [CrossRef]
- O’Hare, L.; Hibbard, P.B. Visual discomfort and blur. J. Vis. 2013, 13, 7. [Google Scholar] [CrossRef]
- Harding, G.; Wilkins, A.J.; Erba, G.; Barkley, G.L.; Fisher, R.S. Photic- and Pattern-induced Seizures: Expert Consensus of the Epilepsy Foundation of America Working Group. Epilepsia 2005, 46, 1423–1425. [Google Scholar] [CrossRef] [PubMed]
- Jean-Paul, R.A.M.I. A driving simulator for road lighting using fixed low mounting height luminaires. In Proceedings of the Session of the CIE, Beijing, China, 4–11 July 2007. [Google Scholar]
- Bommel, W.V. Road Lighting: Fundamentals, Technology and Application, 1st ed.; Springer: Cham, Switzerland, 2015. [Google Scholar]
- Block, J.; Bullough, J.; Figueiro, M. IESNA Lighting Handbook, 9th ed.; The Illuminating Engineering Society of North America: New York, NY, USA, 2000. [Google Scholar]
- Coaton, J.R.; Marsden, A.M. Lamps and Lighting; Arnold: Loudon, UK, 1997. [Google Scholar]
- Eastman, A.A.; Campbell, J.H. Stroboscopic and Flicker Effects from Fluorescent Lamps. Illum. Eng. 1952, 47, 27–35. [Google Scholar]
- Wei, N.I. The Latest International Standardization Progress on Flicker and Stroboscopic Effect. China Light Light. 2018, 8, 21–28. [Google Scholar]
- Fei, R.W.; Lloyd, J.D.; Crapo, A.D.; Dixon, S. Light flicker test in the United States. IEEE Trans. Ind. Appl. 2000, 36, 438–443. [Google Scholar] [CrossRef]
- Enns, J.T.; Di Lollo, V. What’s new in visual masking? Trends Cogn. Sci. 2000, 4, 345–352. [Google Scholar] [CrossRef] [PubMed]
- Schnapf, J.L.; Nunn, B.J.; Meister, M.; Baylor, D.A. Visual transduction in cones of the monkey Macaca fascicularis. J. Physiol. 1990, 427, 681–713. [Google Scholar] [CrossRef]
- Bin, C.; Chuang, G.; Jian-Zhong, W. Review on Visual Masking. Adv. Psychol. Sci. 2009, 17, 1146–1155. [Google Scholar]
- Breitmeyer, B.; Öğmen, H. Visual Masking: Time Slices Through Conscious and Unconscious Vision. In Visual Masking: Time Slices Through Conscious and Unconscious Vision; Oxford University Press: Oxford, UK, 2010; Volume 41, pp. 1–384. [Google Scholar] [CrossRef]
- Yamauchi, H.; Okada, S.; Taketa, K.; Matsuda, Y.; Mori, T.; Watanabe, T.; Matsuo, Y.; Matsushita, Y. 1440/spl times/1080 pixel, 30 frames per second motion-JPEG 2000 codec for HD-movie transmission. IEEE J. Solid-State Circuits 2005, 40, 331–341. [Google Scholar] [CrossRef]
- Haitian, Z. Road Lighting: Muptidimensional Theory and Technology; Science Press: Beijing, China, 2020. [Google Scholar]
- Zhao, H. Multi-Dimensional Street Lighting System. Patent PCT/CN2013/083351, 11 September 2013. [Google Scholar]
- Commission International de l’Éclairage (CIE). Technigal Report: Guide to the Lighting of Urban Areas; Commission International de l’Éclairage (CIE): Vienna, Austria, 2000. [Google Scholar]
- Commission International de l’Éclairage (CIE). CIE 249: 2022 Visual Aspects of Time-Modulated Lighting Systems; Commission International de l’Éclairage (CIE): Vienna, Austria, 2022. [Google Scholar] [CrossRef]
- Kelly, D.H. Visual response to time-dependent stimuli. I. Amplitude sensitivity measurements. J. Opt. Soc. Am. 1961, 51, 422–429. [Google Scholar] [CrossRef]
- Commission International de l’Éclairage (CIE). Guide on the Limitation of the Effects of Obtrusive Light from Outdoor Lighting Installations, 2nd ed.; Commission International de l’Éclairage (CIE): Vienna, Austria, 2017. [Google Scholar]
Figure 1.
LMHL lighting: (a) streetlights are installed along the guardrails on both sides of the road with a maximum height of 1.5 m, (b) the light is projected directly onto the center of the road, (c) the lighting environment has alternating brightness, and (d) LMHLs are used in practice [22].
Figure 1.
LMHL lighting: (a) streetlights are installed along the guardrails on both sides of the road with a maximum height of 1.5 m, (b) the light is projected directly onto the center of the road, (c) the lighting environment has alternating brightness, and (d) LMHLs are used in practice [22].

Figure 2.
(a) Periodic light stimulation and (b) the process of human visual perception.

Figure 3.
A set of experimental simulation photos taken with a camera (LMK luminance imager).

Figure 4.
Because the relative speed and the duration of driver perception are different, the length of an image of a streetlamp on the retina of the human eye varies.
Figure 4.
Because the relative speed and the duration of driver perception are different, the length of an image of a streetlamp on the retina of the human eye varies.

Figure 5.
The relationship between the image of the lamp and the image of the background can be described as the positional relationship from (a–d). X represents the displacement. S is the length of the luminous surface of the streetlamp; D is the spacing between the streetlamps; v is the relative movement speed. Yellow represents the illuminated part of the street lamp, and grey represents the background. Regarding the length of images containing both a lamp and a background, four different scenarios are considered: (a) absence of visual persistence and masking, (b) presence of visual persistence but absence of masking, (c) presence of both visual persistence and masking, and (d) presence of motion with visual persistence and masking.

Figure 6.
The relationship between and driver’s speed v and street lamp spacing D.

Figure 7.
At the same shutter speed, the smaller the brightness of the surface of the lamp (the smaller the value), the smaller the amount of energy received by the human eye and the less the human eye is irritated.
Figure 7.
At the same shutter speed, the smaller the brightness of the surface of the lamp (the smaller the value), the smaller the amount of energy received by the human eye and the less the human eye is irritated.

Figure 8.
A set of experimental photos taken with a LMK luminance imager.

Figure 9.
Human eye retention time chart ( is the organ response establishment time).

Figure 10.
Analysis of effective luminous flux for road lighting. represents the scattered light flux of the streetlamp, represents the directional light flux of the streetlamp that can enter the human eye, is the reflected light flux of the light source on the road surface, which is related to the road surface reflection coefficient ρ. is the component of the road surface-reflected light flux in the driver’s line of sight. and are the ineffective components. α is the incident angle of the light source, i.e., the angle between the normal to the road surface and the direction of the light source. φ is the angle between the direction of the driver’s line of sight and the road surface. θ is the angle between the plane of the light source projection direction and the plane of the driver’s line of sight.

Figure 11.
(a) shows forward lighting, in which the direction of light is the same as the driver’s travel direction. (b) shows reverse lighting, in which the direction of light is opposite to the driver’s travel direction.
Figure 11.
(a) shows forward lighting, in which the direction of light is the same as the driver’s travel direction. (b) shows reverse lighting, in which the direction of light is opposite to the driver’s travel direction.

Figure 12.
Illumination test on the Qingshan Yangtze Bridge in Wuhan, China. (a) Test scene; (b) brightness distribution at the site; (c) luminaire in use; (d) brightness distribution on the bridge deck; (e,f) surface brightness of the luminaire.
Figure 12.
Illumination test on the Qingshan Yangtze Bridge in Wuhan, China. (a) Test scene; (b) brightness distribution at the site; (c) luminaire in use; (d) brightness distribution on the bridge deck; (e,f) surface brightness of the luminaire.

Figure 13.
Bridge lighting test in Shenzhen, China. (a) Test scene; (b) brightness distribution of the test scene; (c) luminaire surface brightness; (d) brightness distribution of the bridge deck.
Figure 13.
Bridge lighting test in Shenzhen, China. (a) Test scene; (b) brightness distribution of the test scene; (c) luminaire surface brightness; (d) brightness distribution of the bridge deck.

Figure 14.
Sensitivity functions of different mean background luminances, replotted from Kelly (1961).
Figure 14.
Sensitivity functions of different mean background luminances, replotted from Kelly (1961).

Figure 15.
Frequencies smaller than 2.5 Hz or greater than 15 Hz can effectively avoid the sensitive area of the human eye, but frequencies greater than 15 Hz constitute the trigger area of photosensitive epilepsy.
Figure 15.
Frequencies smaller than 2.5 Hz or greater than 15 Hz can effectively avoid the sensitive area of the human eye, but frequencies greater than 15 Hz constitute the trigger area of photosensitive epilepsy.

Figure 16.
Schematic diagram of speed-spacing.


Table 1.
Detailed testing parameters for low-installation-height lighting on bridges in two cities.
| Location | W | m | m | deg | cd/m2 | cd/m2 | m | km/h | W/m2 | cd/m2 | Hz | % | % | ||||
|---|---|---|---|---|---|---|---|---|---|---|---|---|---|---|---|---|---|
| SZ | 24 | 15 | 1.5 | 90 | 9495.74 | 34.66 | 1.0 | 40 | 2.13 | 273.97 | 1.03 | 3.12 | 0.59 | 0.42 | 7.41 | 5.4 | 35.6 |
| WH | 12 | 20 | 3.2 | 12 | 1.18 | 1.02 | 0.2 | 40 | 0.4 | 1.16 | 4.83 | 4.17 | 0.68 | 0.95 | 3.47 | 0.8 | 2.86 |
SZ: Shenzhen City; WH: Wuhan City; P: Actual power of a single luminaire; W: Width of the bridge; D: Distance between adjacent lamps; A: Angle between light projection direction and road edge; L: Average luminance of the surface of the lamp; B: Average luminance of the background; S: Length of the streetlamp surface illumination; v: Movement speed; LPD: lighting power density; : Luminaire surface luminance and background luminance contrast; : Dynamic duty cycle; : Average road surface luminance; : Overall uniformity of road surface luminance; : Longitudinal uniformity of luminance; : CIE flicker frequency calculation method; : Threshold increment; : Flicker index.
Disclaimer/Publisher’s Note: The statements, opinions and data contained in all publications are solely those of the individual author(s) and contributor(s) and not of MDPI and/or the editor(s). MDPI and/or the editor(s) disclaim responsibility for any injury to people or property resulting from any ideas, methods, instructions or products referred to in the content. |
© 2023 by the authors. Licensee MDPI, Basel, Switzerland. This article is an open access article distributed under the terms and conditions of the Creative Commons Attribution (CC BY) license (https://creativecommons.org/licenses/by/4.0/).
Share and Cite
MDPI and ACS Style
Chen, S.; Zhang, B.; Zeng, X.; Lin, Y.; Zhao, H. Methods to Reduce Flicker and Light Pollution of Low-Mounting-Height Luminaires in Urban Road Lighting. Sustainability 2023, 15, 8185. https://0-doi-org.brum.beds.ac.uk/10.3390/su15108185
AMA Style
Chen S, Zhang B, Zeng X, Lin Y, Zhao H. Methods to Reduce Flicker and Light Pollution of Low-Mounting-Height Luminaires in Urban Road Lighting. Sustainability. 2023; 15(10):8185. https://0-doi-org.brum.beds.ac.uk/10.3390/su15108185
Chicago/Turabian StyleChen, Shenfei, Bing Zhang, Xianxian Zeng, Yi Lin, and Haitian Zhao. 2023. "Methods to Reduce Flicker and Light Pollution of Low-Mounting-Height Luminaires in Urban Road Lighting" Sustainability 15, no. 10: 8185. https://0-doi-org.brum.beds.ac.uk/10.3390/su15108185
Note that from the first issue of 2016, this journal uses article numbers instead of page numbers. See further details here.