1. Introduction
1.1. Background
The European Union (EU) has set a target to diminish the release of greenhouse gas (GHG) emissions. Specifically, the EU aims to achieve a reduction of 40% by 2030 and 80% by 2050 compared to the emission levels recorded in 1990 [
1]. Currently, the building sector accounts for over 40% of worldwide energy consumption and contributes to 30% of global GHG emissions [
2]. A significant amount of energy is wasted in this sector, as most houses are not energy efficient. In Europe, more than 40% of buildings were constructed before 1960 and over 90% before 1990. The rates of replacement and extension for buildings are exceptionally low (~1% per year), and the annual reduction in energy consumption of buildings is approximately 1%. In order to accelerate the renovation rate in the EU, the European Commission has proposed in the “Renovation Wave Strategy”: the creation of zero-energy districts through the development of neighbourhood-based approaches and the integration of renewable solutions [
3]. This strategy highlights the need to develop neighbourhood-based approaches and integrate renewable solutions to create zero-energy districts. Future generations of district heating (DH) systems should be based on renewable energy and enable significant reductions in heating demand [
4]. Renovation at the district level has the potential to reduce GHG emissions by optimizing the use of various renewable energy sources (RES), exploiting economies of scale, and reducing dependency on fossil fuels [
5].
1.2. Application of Renewable Energy in District Heating
For the building sector to achieve near-zero energy building status and reduce GHG emissions, the use of RES in conjugation with an energy storage system is strongly recommended [
6]. Biomass fuels, heat pumps (HP), and solar energy are often considered for achieving a near-zero energy building status and reducing GHG emissions. Biomass fuel has gained popularity as an alternative to fossil fuels [
7]. According to Raslavičius et al. [
8], Lithuania has great potential for biomass utilization, as approximately 40% of the country’s land area is covered by forests [
9]. Among the industry sectors, sawmills and plywood manufacturers have emerged as the biggest producers of wood waste. Approximately 1.5 million m
3 of wood waste per year could be utilised as a valuable energy source. In Lithuania, where 57% of residents use DH, almost half of the heat for DH (47%) is obtained from biomass [
9].
While the combustion of biomass fuels is typically perceived as having a carbon-neutral effect, an excessive reliance on their utilization can disrupt the delicate balance of the carbon cycle and contribute to an increased concentration of GHG in the atmosphere [
7]. Forests play a critical role in the absorption of CO
2, and deforestation for the purpose of biomass production reduces the capacity of CO
2 absorption. Therefore, broader implementation of RES is necessary to achieve a carbon-neutral DH system. Sandvall et al. [
10] highlighted that the use of surplus urban heat can improve the competitiveness and profitability of DH systems compared to those with boilers.
Various types of heat pumps are considered highly promising alternative energy sources. Thygesen and Karlsson [
11] compared the application of ground source and exhaust air HP, supplemented with a PV system, for near-zero energy buildings. The research concluded that the building with a ground source HP had the lowest specific energy demand and was considerably below what is considered the limit for near-zero energy building standards in Sweden. In addition, the ground source HP had a higher solar energy fraction compared to the system with exhaust air HP.
The study by Javanshir et al. [
12] investigated the decarbonization of a Finnish city’s DH through the use of power-to-heat technologies, such as HPs, an electric boiler, and thermal storage, in conjunction with a building deep-renovation program. The results showed that the power-to-heat technologies could not meet peak heat demand during the coldest periods without reducing the city’s heat demand. However, the addition of thermal storage in one of the scenarios contributed to a 71% reduction in fossil fuel consumption [
12]. A similar study conducted by Nazari et al. [
13] concluded that the use of the PV system integrated with heat pumps could result in a reduction of up to 73% in CO
2 emissions.
Other studies have investigated alternative ways to use urban excess heat as a heat source. Khosravi et al. [
14] examined the feasibility of using HPs and heat-only boilers to recover waste heat from a data centre and concluded that HPs are a cost-effective method for doing so. Hiltunen and Syri [
15] used HP to enhance the temperature of waste heat and observed that waste heat recovery leads to a significant reduction in GHG emissions. However, the authors also found that the feasibility of waste heat recovery is highly dependent on the price of electricity. In addition, they concluded that, while waste heat recovery can reduce fossil fuel consumption, waste heat from data centres is not suitable for replacing fuel-burning heat-only boilers to meet peak demand.
However, to date, only a limited number of studies have been conducted on district-level renovation. In this context, there is a lack of systems thinking, which underscores the need to analyse new approaches that can provide a more holistic view with greater integrity and awareness of the priorities of different stakeholders in building renovations [
16]. The previously described studies [
7,
10,
12,
14,
16] have concluded that district-level renovation can be successful from an engineering perspective.
1.3. Social Obstacles Slowing down Residential Building Renovation
From a technical perspective, district-wide renovations can reduce the energy consumed by DH systems, but there are other factors that slow the pace of renovations. The implementation of such district-level renovations is highly dependent on social factors, such as support from stakeholders, including residents. Social factors such as a lack of understanding of renovation benefits, insufficient communication between stakeholders, and “Not-In-My-Backyard Syndrome” can cause negative perceptions about renovations and slow down the pace of their implementation. The willingness of tenants to participate in renovations is a crucial factor affecting the pace of renovations [
17]. The lack of capital, reliable information, and uncertainties regarding the potential benefits frequently lead to the neglect of investments in energy efficiency measures [
18]. Palm et al. [
19] studied tenants’ response to renovation in Sweden and concluded that, while tenants generally have a positive attitude toward energy efficiency measures, their understanding of the specific benefits of different measures is not always comprehensive. Additionally, the tenants often prioritized immediate financial concerns over energy efficiency improvements. Research by Yang et al. [
17] showed that residents demonstrated a positive inclination towards accepting fundamental renovation measures. However, they expressed a relative unwillingness to embrace measures focused on enhancing quality and integrating renewable energy sources.
Rose et al. [
3] examined several case studies and concluded that it is possible to implement district-level renovations and achieve cost efficiencies while reducing energy use and GHG emissions. Their research emphasized importance of maintaining good communication amongst different stakeholders, especially with residents, who are often sceptical about renovations.
Liu et al. [
20] concluded that information and policies are critical factors for renovations. A significant number of stakeholders demonstrated a lack of awareness regarding building energy efficiency and possessed limited knowledge and information regarding green building renovation. This situation was exacerbated by an imbalance of information among stakeholders and the absence of platforms (e.g., media, applications, networks) and collaborative activities that facilitated the sharing of information and experiences to promote renovation initiatives [
20].
There is a need for a tool to share information among stakeholders and demonstrate the benefits of renovations in a user-friendly way. Information technology can be used for this task. A digital platform that displays a city district as a 3D model embedded with energy consumption profiles before and after the renovation can assist engineers responsible for implementing the renovation and also promote the idea to residents. Such a platform can combine energy production from RES and energy consumption data into a holistic system that provides important information for optimization and enable efficient operation [
21].
1.4. Digital Twin Role in the Optimization of District Heating Systems
Proper optimization of a DH system is the backbone for implementing fifth-generation district heating and cooling (5GDHC) systems. These systems, characterized by decentralized and bidirectional networks operating at ground-level temperatures, rely on the direct exchange of warm and cold return flows and thermal storage to achieve a balanced heat demand to the greatest extent possible [
4]. These digital platforms can be various smart tools, such as the digital twin (DT), building information modelling (BIM), or geographic information system (GIS). The concept of DT has recently emerged in the field of civil engineering and has gained considerable attention in scholarly papers [
22]. DT refers to a combination of different technologies, often including as-built models, BIM, and the Internet of Things, with the aim of creating a copy of the built environment with specific characteristics. From a physical standpoint, the concept of DT can be employed across a range of domains, including buildings, cultural heritage, infrastructure, facilities and equipment, hydraulic engineering, and construction sites. The concept of a DT in deep renovation is a novel approach. While there are various tools available such as GIS or CityGML, they do not provide a holistic approach that is necessary for district-scale renovation. The DT should provide a single platform that can assist engineers in the design stage as well as present planned development to other stakeholders, such as residents.
Various GIS tools allow for the combination of a lifecycle assessment with renovations to increase sustainability and reduce GHG emissions. According to Jiang et al., a DT plays a crucial role in bridging the gap between physical and virtual components by establishing connections and integrating data. This is achieved through the capture of diverse data types, including point clouds, images, sensor data, and other forms, facilitated by a range of technologies and tools such as laser scans, sensors, digital image processing, and mobile devices. The collected data is then utilized to update both geometric and non-geometric information of virtual parts, enabling timely synchronization with their physical parts [
23].
Camporeale and Mercader-Moyano proposed the use of GIS-based models as a spatial framework to manage different types of data and facilitate decision making in district renovations. The methodology developed in their study evaluates the energy flexibility of the district through energy demand reduction and photovoltaic (PV) generation. The results demonstrated the hourly load profile for heating and cooling of the building cluster, as well as the thermal comfort indices [
24].
DTs provide novel approaches for the quantitative evaluation of urban energy demand and associated costs. The integration of energy consumption data into the DT of the built environment generates a highly valuable dataset, enabling automated and reliable energy demand diagnostics as well as simulations of renewable energy supply [
24]. The recreation of the built environment and landscape enables accurate simulations where energy production scenarios can be evaluated. Machete et al. [
25] found that the energy production of PV modules differs by approximately 30% when the built and natural environments are included. Weiler et al. [
26] used a 3D City Geography Markup Language (CityGML) model and concluded that the main disadvantage of combining heat pumps with PV is that only 15% of the PV electricity is used directly by the HP. Anbari et al. [
27] used 3D modelling of the built environment to efficiently place PV modules and predict wind speed using deep neural networks. In this model, power generation from wind and solar energy is combined so that energy companies can meet energy demand while reducing GHG emissions. According to Eicker et al. [
28], 3D city models have the ability to simulate energy scenarios that assist urban planners and municipal managers in developing long-term urban energy strategies. The scenarios tested in DT can provide insight into how redevelopment will turn out [
28].
The accurate site model not only allows for the simulation of potential energy generation with RES, but can also link generation with energy demand in the district, forming a single holistic system. Kohne et al. [
29] conducted a case study on a DT model for an industrial heat transfer station connecting industrial heat networks with DH systems. The aim was to establish an effective integration of low-exergy waste heat from the production processes. The case study at an industrial site showed a significant potential for waste heat recovery, reaching up to 70% and leading to a substantial reduction in the operating costs of up to 6% [
29].
There are several ways to create an accurate 3D model of a city or city district. DTs are often created based on open geospatial data and digital topographic maps. Machete et al. [
25] employed a 3D GIS model created from a topographic map, aerial and satellite imagery to explore the impact of both the built environment and the topographic relief on the solar potential. Anbari et al. [
27] used a built environment model based on CityGML and deep neural networks to determine the efficient placement of PV modules and predict wind speed. CityGML is an XML-based data model that facilitates the visualization, storage, and exchange of city models. It is used as an international standard for the exchange of the spatial information published by the Open Geospatial Consortium. The DT was created with tools such as CityGML, which can increase the accuracy of the simulated scenarios. However, it does not possess the level of detail needed to accurately represent the built and natural environment. Haghighi et al. [
30] used the CityGML format to generate a DT of the study area. This approach involved utilizing an open data model instead of traditional manual 3D modelling methods, allowing for more efficient energy simulations. The results indicated that the average use intensity of simulated heating energy deviated by less than 2.5% compared to the measured data. However, the authors concluded that using orthophotos alone to detect building heights leads to inaccuracies, particularly for objects and elements with tapering, sloping, or setback characteristics from the base. It is strongly recommended that urban geometry be improved using other complementary sources, if possible, in three dimensions, such as the LiDAR dataset or unmanned aerial vehicle (UAV) photogrammetry [
30].
To simulate energy production from solar PV modules with greater accuracy, more precise data are required. Typically, topographic data include information about the shape of building structures and roofs, as well as the elevation index. Proximities, such as antennas, chimneys, heating, ventilation, air conditioning shafts, and others, can also cast shadows on PV modules. The shadow of a single column can reduce the available energy by up to 15–19% [
31]. Therefore, it is crucial to assess the structure at a high level of detail to accurately predict energy generation from GIS. UAV photogrammetry can be a useful tool for creating the model of the built environment, which can later be augmented with BIM, GIS, energy consumption/generation data, and other features relevant to DT. Despite the growing attention given to the potential of DTs, there is limited knowledge about their development, the developers involved, and how design decisions related to DTs influence decision-making in the development of RES applications [
32].
1.5. Objective and Contribution
The literature review revealed that there is currently limited application of DT technology in district-level renovations, particularly when RES is considered. While there is a potential for DTs to create a holistic platform for engineers and stakeholders to design and implement renovations, there is a lack of comprehensive research and studies on the development, utilization, and impact of DTs in the context of deep renovation and how DTs can effectively facilitate the integration of RES, communication, and decision-making processes among stakeholders in district-level renovations. Further research is needed to bridge this gap and explore the practical implementation, benefits, and challenges associated with the use of DTs in the context of district-level renovations and energy efficiency initiatives using RES technologies.
The main objective of this paper was to evaluate the potential for deep renovation, energy generation, and supply in buildings within an urban block to achieve CO
2 neutrality through the integration of RES technologies using a digital twin model. Generally, there are three main stages for DT applications: (1) the design phase, (2) operational phase (project implementation), and (3) service phase [
33]. The design phase can be subcategorized into optimisation, data generation, and virtual evaluation. The focus of the study presented in this paper is on the design phase.
The novelty and contribution of the research presented in this paper includes several aspects:
The study proposes the integration of RES technologies, such as solar PV modules, heat pumps, and electric heaters with a DT model to achieve CO2 neutrality in buildings within an urban block. While DT models have been used in various stages of building design and operation, this study specifically focused on the design phase and utilized a DT model to evaluate the potential for deep renovation and energy generation. By incorporating energy parameters and data into the 3D model, the study provides a detailed analysis of options for electricity and heat supply using RES technologies.
- 2.
New optimization technique.
The research employs a new optimization technique to select an optimal heat pump system by minimizing the associated costs and reducing GHG emissions. This optimization technique was combined with a solar PV simulation tool, enabling a holistic approach to evaluate hybrid RES solutions for the city block. By incorporating cost and emission considerations, the study provides a comprehensive assessment of the most suitable RES technologies for the given context.
- 3.
Accurate 3D model and data.
The study utilizes an accurate 3D model of the entire city block, including residential buildings, kindergartens, and a school. This model allows for the estimation of shading from proximities and accurate calculation of the potential installed capacity of PV solar modules and PV on-site electricity generation. The heat saving potential was evaluated considering deep renovations of the buildings in the city block, including the installation of heat pumps and electric heaters. By using up-to-date data and advanced photogrammetry equipment, the research proposes more reliable energy consumption forecasts and better-informed decisions regarding supply and consumption technologies.
- 4.
Elaboration of energy renovation projects.
The application of the developed methodology enables the elaboration of more accurate energy renovation projects for buildings using RES technologies. This contributes to mitigating technical and economic risks associated with such projects and reducing overall investments. By providing a detailed analysis of deep renovation possibilities and RES integration, the study offers valuable insights for stakeholders involved in urban block developments and sustainable energy planning.
The proposed method enables a more accurate estimation of on-site energy generation from RES. This represents a crucial first step towards the implementation of the 5GDHC, which aims to utilize RES to meet residual heating or cooling needs. The ability to create accurate 3D models of the entire city block and use them to accurately assess opportunities for building renovation and installation of RES has emerged due to the rapid development of photogrammetry equipment (e.g., using UAVs) and 3D digital model creation methods. Previously, such analysis relied on outdated paper-based technical plans of building construction, which usually differed from the actual situation. The same was true for the predicted and actual energy demand of buildings. After many years of constructing buildings, the technical parameters of buildings and consumer habits have also changed. Therefore, energy consumption forecasts based on up-to-date data allow for predicting future energy demand, selecting supply and consumption technologies, and increasing supply reliability more accurately in a way that is less harmful to the environment.
In summary, the novelty and contribution of this research lies in the integration of RES technologies with a DT model in the design phase, the use of a new optimization technique for selecting optimal RES solutions, the utilization of an accurate 3D model for detailed analysis, and the contribution to more accurate energy renovation projects. These unique aspects distinguish this study from previous works and contribute to the existing body of knowledge in the field of sustainable building design and energy planning. The proposed research on city block renovation using RES and a DT concept contributes to the theoretical understanding of integrating digital technologies with renewable energy systems and optimizing building energy systems. The practical implications include accelerating building renovation, reducing energy consumption, providing user-friendly representations of results, and enabling replicability and scalability of district-level renovation strategies.
The structure of this paper is as follows: the methodology used is outlined in
Section 2.
Section 3 introduces a description of the analysed scenarios and key assumptions used in the simulation. The main results of the performed simulations are discussed in
Section 4. Finally, the main findings of the conducted study are summarized in
Section 5.
3. Scenarios and Modelling Assumptions
3.1. Description of Scenarios and Assumptions for Energy Prices
In this paper, a digital twin serves not only as a 3D digital representation of physical buildings, visualizing the geometrical features of a city block, but also as a tool of the physical system, effectively representing energy consumption data in these buildings. This capability enables the use of a digital twin in the simulation procedure. To implement this, a total of five scenarios were proposed to analyse decarbonization possibilities in heating and electricity systems when considering energy deep renovations of buildings in a city block.
In scenario 1 (further referred to as SC1), the installation of heat pumps and electric heaters is considered in each building in the analysed city block. The installed capacity of the heating system must satisfy the total demand for space heating and domestic hot water production in each building during the year (100% independence from the DH network). The source of electricity to power the heating system is the national power grid. Domestic electricity consumption is also satisfied by the power grid.
In scenario 2 (further referred to as SC2), the installation of PV modules is considered for the available rooftop areas in each building in the analysed city block. The potential of solar PV production is determined by the available space for PV modules on building rooftops. The electricity produced from the PV modules is used for domestic consumption, with any remaining demand being satisfied by the power grid.
Scenario 3 (further referred to as SC3) combines SC1 and SC2, where both heating and PV systems are installed, but they are assumed to operate independently with no interaction between them. The electricity from solar PV production is used solely for domestic consumption, with any remaining demand being satisfied by the power grid. Additionally, electricity to power HPs and EHs is supplied solely from the power grid.
In scenario 4 (further referred to as SC4), a hybrid system comprising of HPs, EHs, and PV modules is considered. The main difference from SC3 is that electricity from the solar production is used not only for domestic electricity consumption, but also to power HPs and EHs. However, this electricity is used only for DHW production, not for space heating. The remaining part of electricity (domestic, HPs, and EHs consumption) is supplied from the power grid.
Similar to SC4, scenario 5 (further referred to as SC5) considers a hybrid system comprised of HPs, EHs, and PV modules. However, the key distinction from SC4 is that the electricity generated from solar PV system is used to power HPs and EHs for both DHW production and space heating. The remaining part of electricity (domestic, HPs, and EHs consumption) is supplied from the power grid.
The main characteristics of the proposed scenarios are outlined in
Table 3.
To take into account the drastic rise in energy prices in 2022, two cases were included for each scenario with different electricity and heat prices to reflect the situation (
Table 4). Additionally, the electricity price in Lithuania was changed on 1 July 2022 as a result of the liberalization of the electricity market.
In Case A, the average prices of the previous five years 2022 (2017–2021) charged by electricity and heat suppliers were considered. In Case B, the electricity price in 2022 charged by electricity suppliers after the liberalization of the electricity market was taken into account [
41]. The heat price in Case B was assumed to be on average 65% higher than in Case A, as set by the heat supplier in 2022 [
42]. As a result, each analysed scenario was divided into two alternatives: SC_A and SC_B. Natural gas prices, set by UAB “Ignitis” in Lithuania, are used for both alternatives and are based on 2022 prices of 0.77 EUR/m
3 with a monthly fee of 3.99 EUR [
43].
3.2. Assumptions for Electricity Production Simulation
Hypothetical solar PV panels with the following main parameters were used in the simulation: nominal power—250 W, total efficiency—15%, PV module size—1.7 m
2, PV degradation rate per year—0.5%, estimated installation price based on current market prices—1000 EUR/kW. Instead of batteries, available Net-Metering protocols were used for the storage of the surplus electricity. A fixed payment of 0.054 EUR/kWh for stored and recovered electricity, as proposed by Lithuanian electricity distribution operator ESO, was used in the simulation [
38].
3.3. Assumptions for Heat Production Simulation
In the analysis, various types of heat pumps, including geothermal, air-to-water, and hybrid models, were considered. A total of 25 heat pumps with varying capacities and coefficients of performance (COP) were analysed. The range of capacities was from 25 kW to 240 kW, and the COP range was from 3.7 to 4.8. The maximum values for capacity and COP were based on the specifications provided by the heat pump manufacturers. To simplify the optimization model and reduce the computational time required for the simulations, the COP and capacity parameters of the heat pumps were assumed to be constant throughout the year. This assumption provided a reasonable approximation of the actual performance of heat pumps under typical operating conditions, given that their COP and capacity are relatively stable during the heating season. However, this assumption may not hold only under extreme weather conditions or for certain types of heat pumps, which were not applicable in this study. The annual cost of the heating system included the cost of the heat pump, its installation and maintenance, as well as the cost of electricity or gas consumption (operational costs).
It was assumed that the annual maintenance costs for gas and air-to-water heat pumps were 2% of the heat pump price, while for geothermal heat pumps, these costs were fixed at 950 EUR per year. When estimating the heating price over a 20-year period, a shorter warranty period for gas and air-to-water heat pumps was taken into account, assuming that they needed to be replaced after 10 years of operation. The second goal of the task (reduce GHG emissions) was achieved by introducing a tax of 80 EUR per tonne of CO2 emissions and minimizing the total cost per year for emissions. A discount rate of 5% was used in the simulation.
4. Results and Discussion
4.1. Results of SC1
The optimization technique presented in
Section 2.4.2 was applied to perform the optimization of heat pumps and electric heaters selection with the aim of minimizing costs and CO
2 emissions over a period of 20 years. The optimization was carried out separately for different types of buildings: apartment buildings, kindergartens, and a school. A summary of the main results of this analysis is presented in
Table 5. Most of the parameters for both cases A and B are the same, with only the total costs and the Levelized Cost of Heat (LCOH) being different, which were affected by the assumed difference in electricity and heat prices in the modelling procedure.
In the optimization, two types of heat pumps were selected: air-to-water and geothermal. Geothermal heat pumps with higher capacities were found to be optimal for larger buildings with higher heat demands (apartment buildings type IV, type VI, and the school). For other types of buildings, air-to-water heat pumps were determined to be the optimal solution. The total installed capacity of HPs for the different types of buildings in the entire city block ranged from 137 to 846 kW, primarily depending on the total heat demand of these buildings. The total installed capacity of HPs for the entire city block was 3.13 MW.
The installed capacity of EHs was determined based on the need to cover high peaks in heat demand over a short period of time. EHs are only used to cover these peaks to avoid the high installed capacity of HPs, which have comparatively higher investments. After the installation of the heating system, the average heat price for 20 years for the analysed city block was 0.0564 EUR/kWh in Case A and 0.0856 EUR/kWh in Case B. The lowest LCOH was achieved for nine-story apartment buildings (type VI), where the optimal solution was a geothermal HP. The determined solutions demonstrate that it is more cost-effective to install geothermal HPs in buildings with higher heat demands. Although these HPs require higher investments than air-to-water HPs, their lifetime is at least 20 years. In addition, because the ground temperature is more constant, geothermal HPs can operate efficiently even when the outside temperature is low, saving more energy for heating. The total costs for the city block over 20 years of operation were approximately 10.15M EUR in Case A and 15.39M EUR in Case B. These costs include the cost of the heating system and its installation, operation, and maintenance costs, as well as the cost of electricity to power HPs and EHs throughout 20 years of operation.
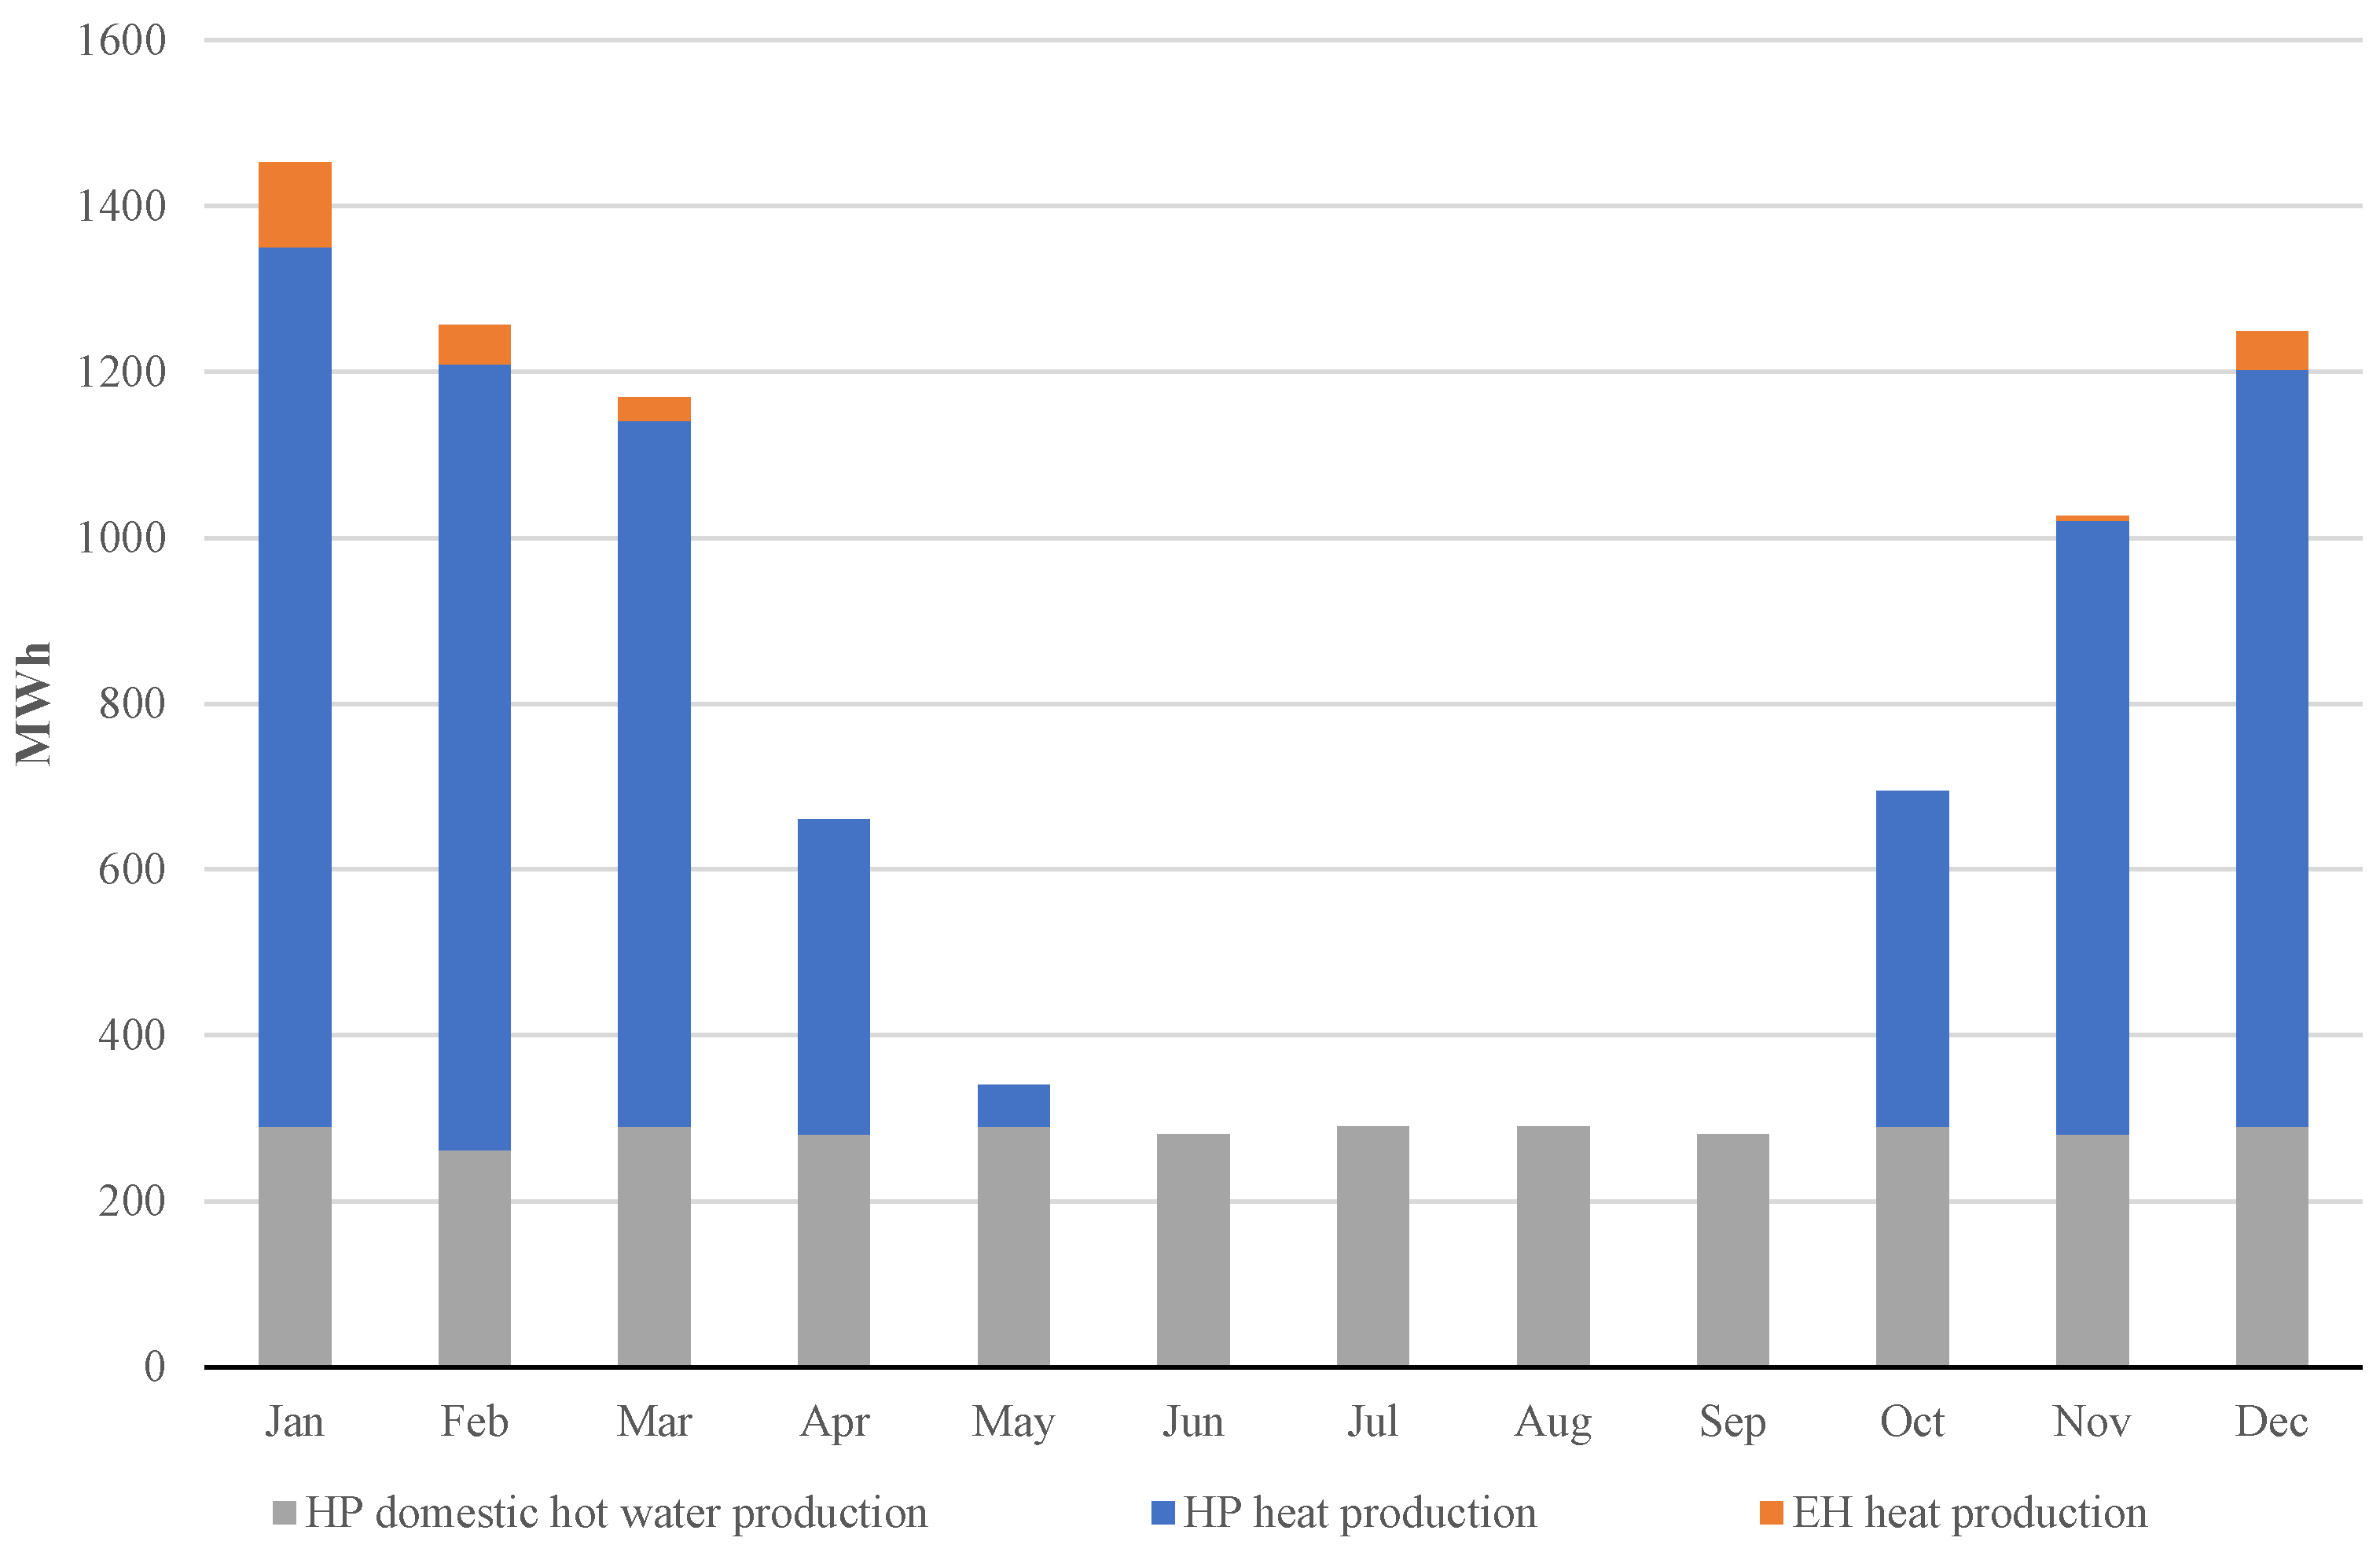
The technical performance of the analysed heating system is demonstrated by heat and DHW production. The results for the city block for each month of one year are shown in
Figure 4.
Monthly DHW production remains relatively constant throughout the year (approximately 290 MWh) and is fully covered by HPs. Space heating in the city block is required from October to May and is primarily produced by HPs. However, during the coldest months with the highest heat demand, EHs are used for a limited number of hours to cover peaks in heat demand. For example, in January, when heat demand is highest, EHs were used 8.7% of the time.
The total investments over a 20-year period were approximately 3.53M EUR. This included the cost of the heating system, its installation, and the replacement of the air-to-water HPs and EHs after 10 years of operation due to their shorter lifetime. The operation and maintenance costs of the selected heating system over a 20-year period would amount to approximately 6.62M EUR in Case A and 11.86M EUR in Case B.
The financial parameters of the entire city block in both cases did not indicate that the proposed system would be profitable, and the payback period was not reached within the 20-year modelling period. The proposed heating system results in negative NPV (−2.42M and −2.28M EUR) and negative IRR (−5.74% and −4.83%) in cases A and B, respectively. The main reason for this was the relatively high LCOH of the installed system compared to the current average heat price provided by the heat supplier: 0.0564 vs. 0.0429 EUR in Case A and 0.0856 vs. 0.0707 EUR in Case B. To achieve a PB of the analysed system in seven years, an additional 82.24% and 80.01% of financing or external support would be required in cases A and B, respectively. This represents the cost of achieving 100% independence from the DH network and the ability to produce all the required heat on-site using HPs and EHs.
However, if DH prices continue to rise rapidly, this may significantly reduce the PB and improve the economic attractiveness of these projects in the near future.
4.2. Results of SC2
In SC2, a simulation of a PV system for 20 years was performed using the Prosumer Simulation Tool presented in
Section 2.4.1, and the assumptions were discussed in
Section 3. The total installed capacity of 1882 kWp was determined based on the available rooftop space of all analysed buildings in the city block.
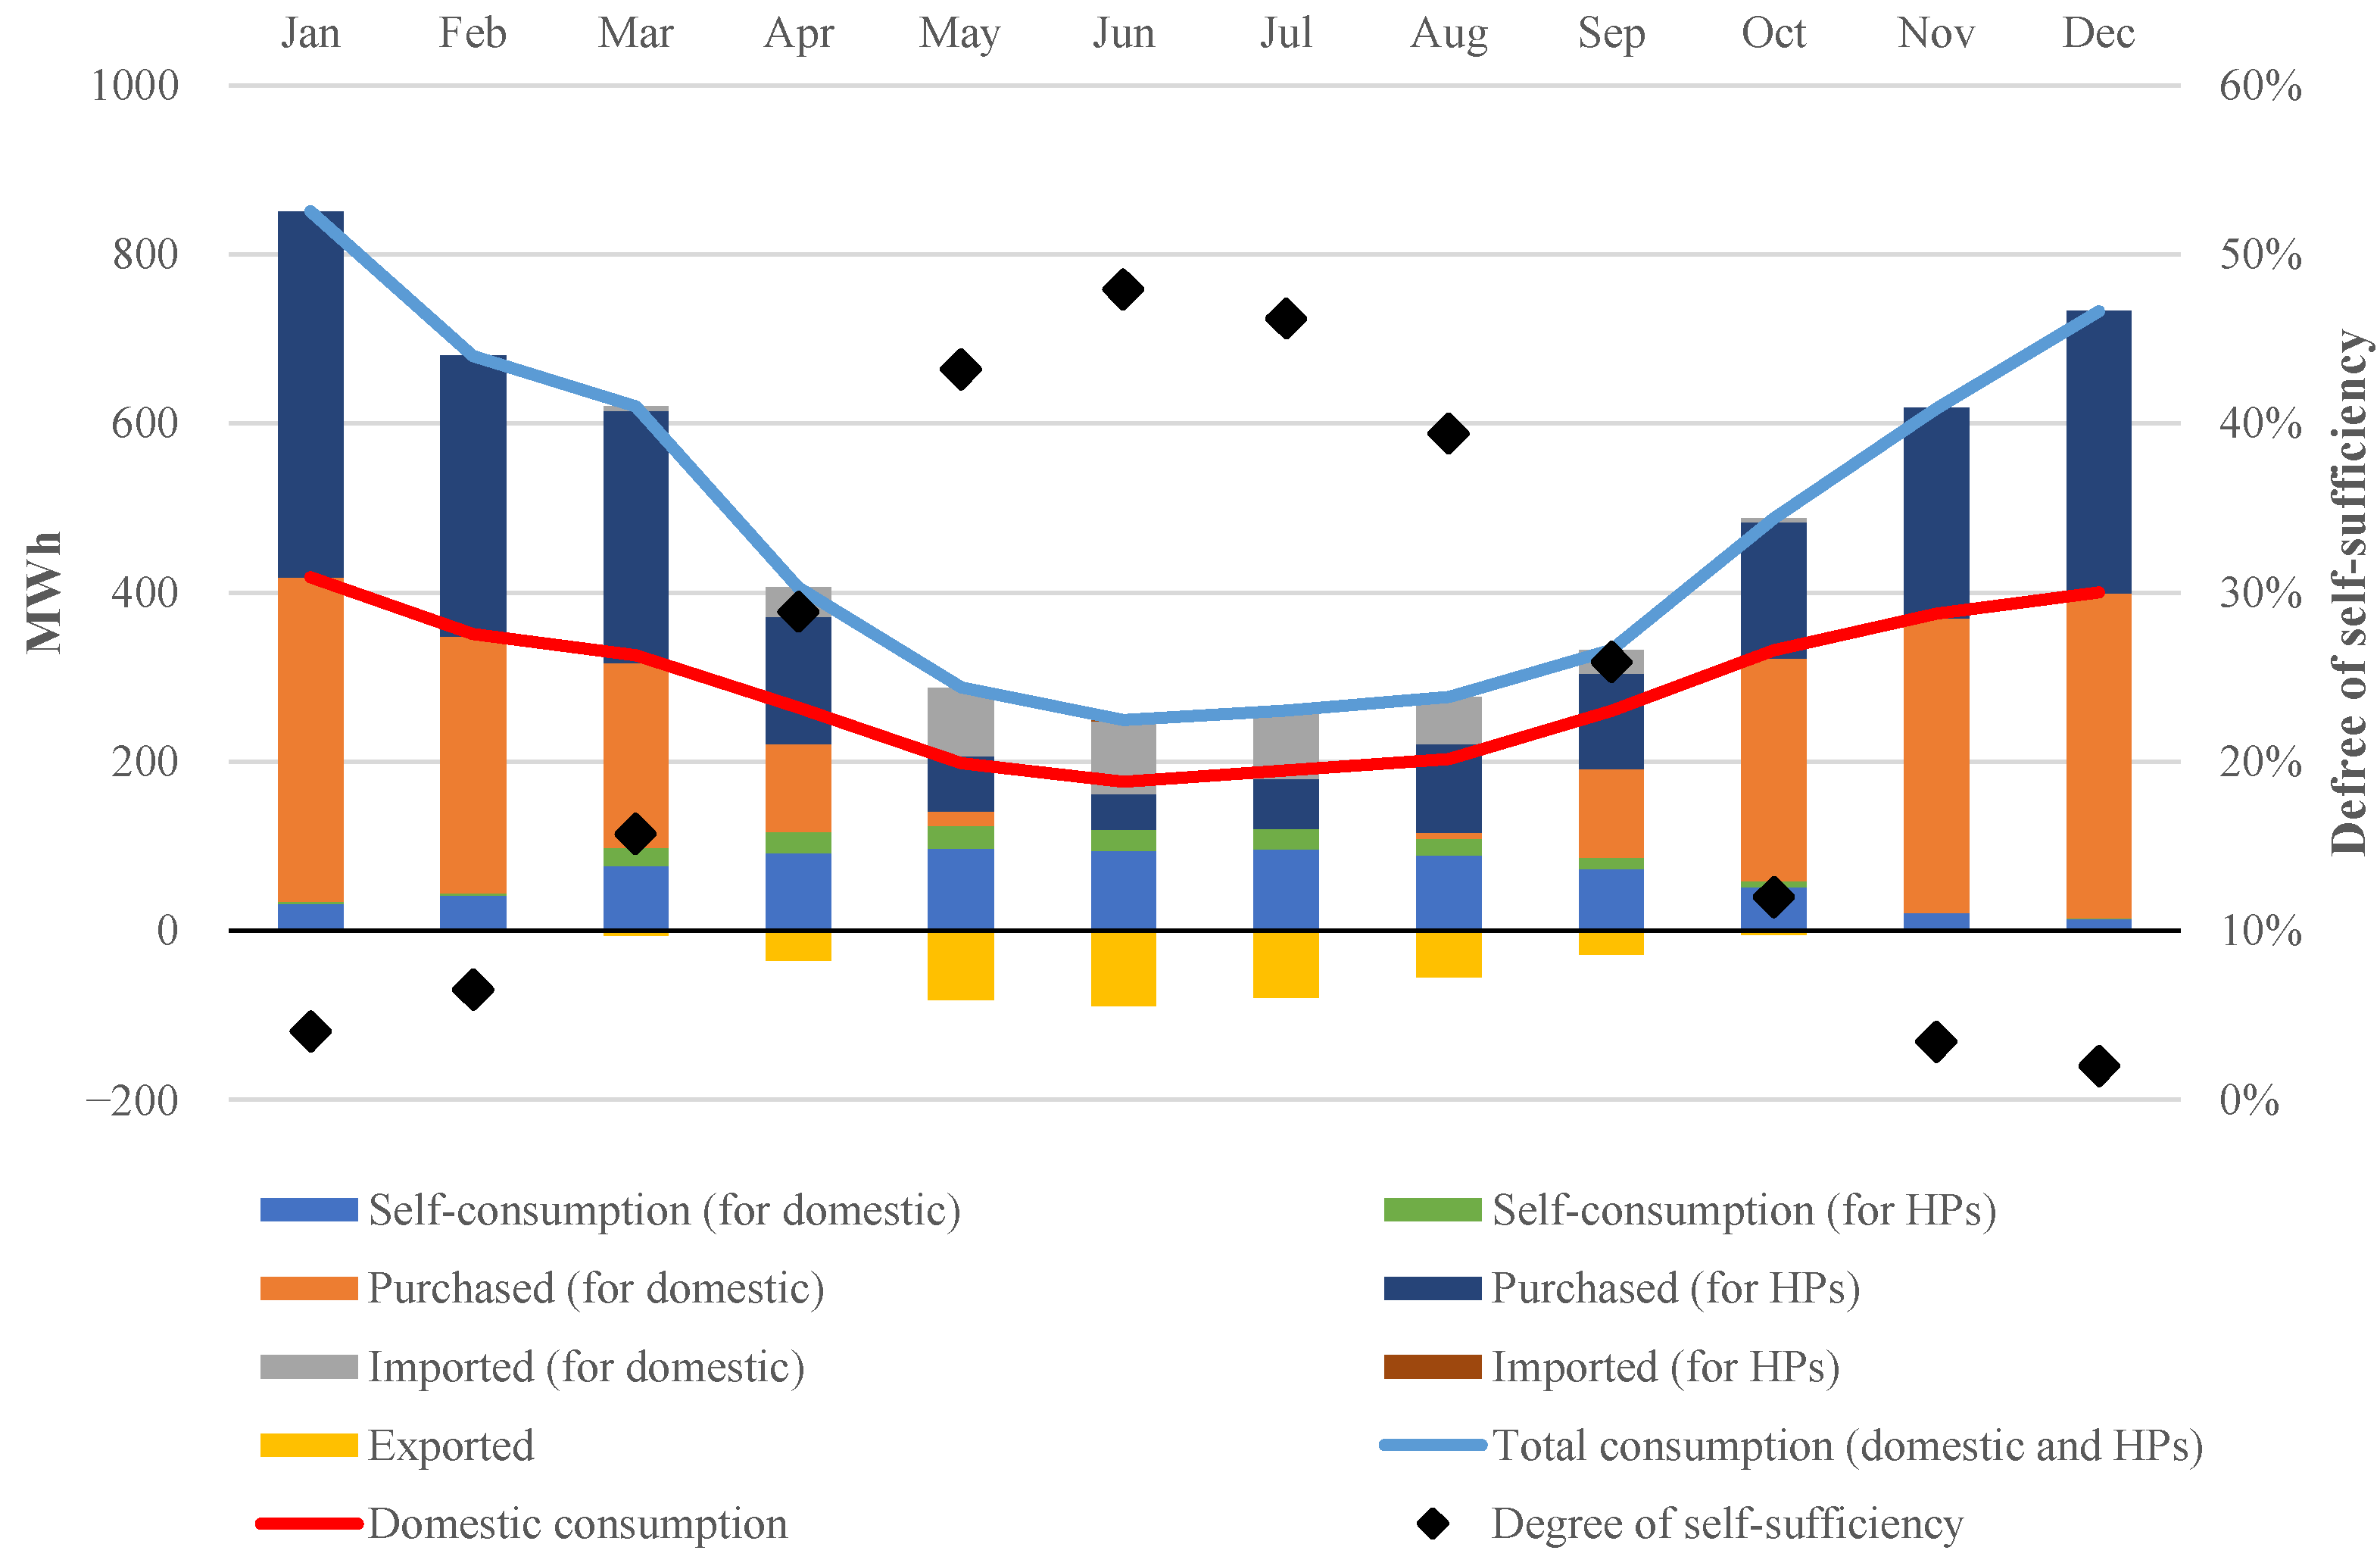
Figure 5 illustrates the performance of the proposed PV system and domestic electricity consumption in the analysed city block. The technical performance of the PV system did not differ between cases A and B.
In
Figure 5, the Self-consumption variable presents the amount of on-site PV-generated electricity that was consumed in the buildings instantaneously as it was being produced. If the electricity consumption was higher than PV production, the remaining electricity was purchased and supplied from the grid (variable Purchased). If the electricity consumption was lower than PV production, the surplus PV-generated electricity was exported to the grid for storage (variable Exported). In this case, the grid served as a “virtual battery”, and the recovery of electricity depended on the net-metering strategy. If there was available electricity in the grid’s “virtual battery”, it could be imported (recovered) and consumed when consumption exceeded PV production (variable Imported). The domestic electricity consumption of the city block buildings was depicted using the variable Domestic consumption.
An important metric for evaluating the performance of a solar PV system is self-sufficiency, which measures the degree to which on-site generation is sufficient to fill the energy needs of a building [
44]. A higher self-sufficiency value can increase the profitability of the PV system and reduce the load on the grid. The results of SC2 indicate that the average degree of self-sufficiency during the months of May to August was 48.22%, ranging from 42.12% in August to 52.47% in June. The annual degree of self-sufficiency for SC2 was 22.36%. Throughout June and July, no electricity needed to be purchased, as the consumption was met by PV generation and electricity that had been previously exported due to the storage of surplus PV generation stored in the grid. The total investments of the PV system were approximately 1.88M EUR, while the levelized cost of electricity (LCOE) was 0.1266 EUR/kWh.
Other financial indicators of the proposed PV system were highly dependent on the price of purchased electricity, resulting in vastly different outcomes for cases A and B. The PB for Case A was 14.69 years, whereas for Case B it was 7.12 years. To achieve a PB of seven years for the PV system in Case A, 51.45% additional incentives would be required, whereas for Case B, only 1.7% would be needed. A significant increase in the electricity prices would shorten the PB of the PV system and improve its overall financial performance. The NPV for Case A was negative (−294k EUR), while for Case B it was positive and substantial (1.36M EUR). The IRR also varied significantly between the two cases: 3.06% for Case A and 12.64% for Case B. A rise in electricity prices would make the PV system more financially attractive in the analysed city block, with shorter PB and higher returns.
4.3. Results of SC3
In this scenario, only the financial results will be presented, as the technical performance of the heating and PV systems did not change when they were combined into a hybrid system without considering their interaction. The technical performance of these systems in this scenario was the same as the results of SC1 and SC2, as shown in
Figure 4 and
Figure 5 and discussed above.
The results of SC3, in which a hybrid system is installed in the city block, revealed that the total investments were approximately 5.42M EUR. In Case A, the PB was not reached within the 20-year modelling period, while in Case B, the PB was 14.95 years. To achieve a PB of seven years, external financial support of 71.54% and 52.80% would be needed in Case A and Case B, respectively. The NPVs for both cases were negative, resulting in −2.71M EUR in Case A and −916k EUR in Case B. The IRR demonstrated a negative value of −2.06% in Case A and a positive value of 2.89% in Case B. However, in both cases, the IRR did not exceed the desired discount rate of 5%.
One way to enhance the economic performance of the hybrid system is to take into account the interaction between the heating and PV systems. This can be achieved by utilizing the excess PV-generated electricity to operate HPs and EHs for DHW production and space heating. The results of these two options are discussed in scenarios SC4 and SC5 below.
4.4. Results of SC4
In this scenario, the domestic electricity consumption is supplemented by the electricity consumption of HPs and EHs for DHW production. Thus,
Figure 6 demonstrates the results distributed across different parameters separately for domestic and HPs. When the installed heating system used electricity produced by the PV modules for DHW production, the self-sufficiency parameter compared to SC2 slightly decreased due to increased total consumption. The annual degree of self-sufficiency in SC4 was 21.16%.
However, self-consumption increased as a larger amount of on-site PV-generated electricity could be used not only to cover domestic electricity consumption but also to power HPs and EHs for DHW production. This reduced the amount of electricity exported to the grid and improved the economic performance of the hybrid system (
Figure 6).
The results of the economic parameters were dependent on the case being analysed. The LCOH was lower than in SC1, at 0.0544 EUR/kWh in Case A and 0.0818 EUR/kWh in Case B. The LCOE remained at a very similar level as in SC2, at 0.1266 EUR/kWh and 0.1265 EUR/kWh in Case A and Case B, respectively.
Only Case B demonstrated a PB of less than 20 years, at 14.14 years. To reach a PB of seven years for this hybrid system, 69.49% and 50.18% of external financial support would be required in Case A and Case B, respectively. In both cases, negative NPVs were observed, resulting in −2.51M EUR in Case A and −678k EUR in Case B. The IRR in Case A was −1.43%, while in Case B it was 3.45%. Similar to SC3, in both cases, the IRR did not exceed the desired discount rate of 5%.
Slightly improved economic parameters were observed in SC4 compared to SC3, as some of the on-site PV-generated electricity could be used not only to cover domestic electricity demand, but also to power HPs and EHs for DHW production. This resulted in less electricity needing to be purchased from the supplier, leading to larger savings. However, this effect was more notable during the warmer months of the year (April–September), when PV modules generate surplus electricity (when consumption is lower than PV generation for a large amount of time).
4.5. Results of SC5
In this scenario, HPs and EHs use electricity generated from PV not only for DHW production, but also for space heating. As a result, the total electricity consumption increased significantly, particularly during the colder months (October–March) when the heating demand was highest (
Figure 7).
The self-consumption parameter increased more than in SC4, as a larger amount of on-site generated PV electricity was used and less was exported to the grid, resulting in higher savings. However, self-sufficiency decreased significantly, particularly during the winter months, as the demand for electricity increased significantly due to the operation of HPs and EHs, which satisfy the heat demand independently of the heat network. The heat from the DH network was not used in this scenario. The annual degree of self-sufficiency in SC5 was 16.29%. During months when heat supply was not needed, the results were the same as in SC4.
The performance of the economic parameters in SC5 was slightly better than in SC4. The LCOH was 0.0539 EUR/kWh in Case A and 0.0809 EUR/kWh in Case B, while the LCOE remained similar to other scenarios at 0.1268 EUR/kWh and 0.1270 EUR/kWh in Case A and Case B, respectively.
The PB in Case B was 13.95 years, while in Case A it was not reached within the 20-year modelling period. Additionally, external financial support of 68.78% in Case A and 49.07% in Case B would be required to achieve a PB of seven years for this hybrid system. The NPV results were negative, similar to SC4, with −2.44M EUR in Case A and −582k EUR in Case B. The IRR also demonstrated similar results, with −1.23% in Case A and 3.68% in Case B, neither of which exceed the desired discount rate of 5%.
The economic attractiveness of the hybrid system in SC5 was the best among the analysed scenarios. However, the main drawback of the analysed system was the significant mismatch between the highest on-site PV generation during summer months and the highest heat demand during winter months, resulting in minimal overlap. This led to a limited amount of PV-generated electricity available to power HPs and EHs for DHW production and space heating. Additionally, surplus PV-generated electricity must be exported and stored in the power grid, incurring additional costs due to the costs associated with storing and recovering electricity from the grid, which depend on the prosumer net-metering scheme.
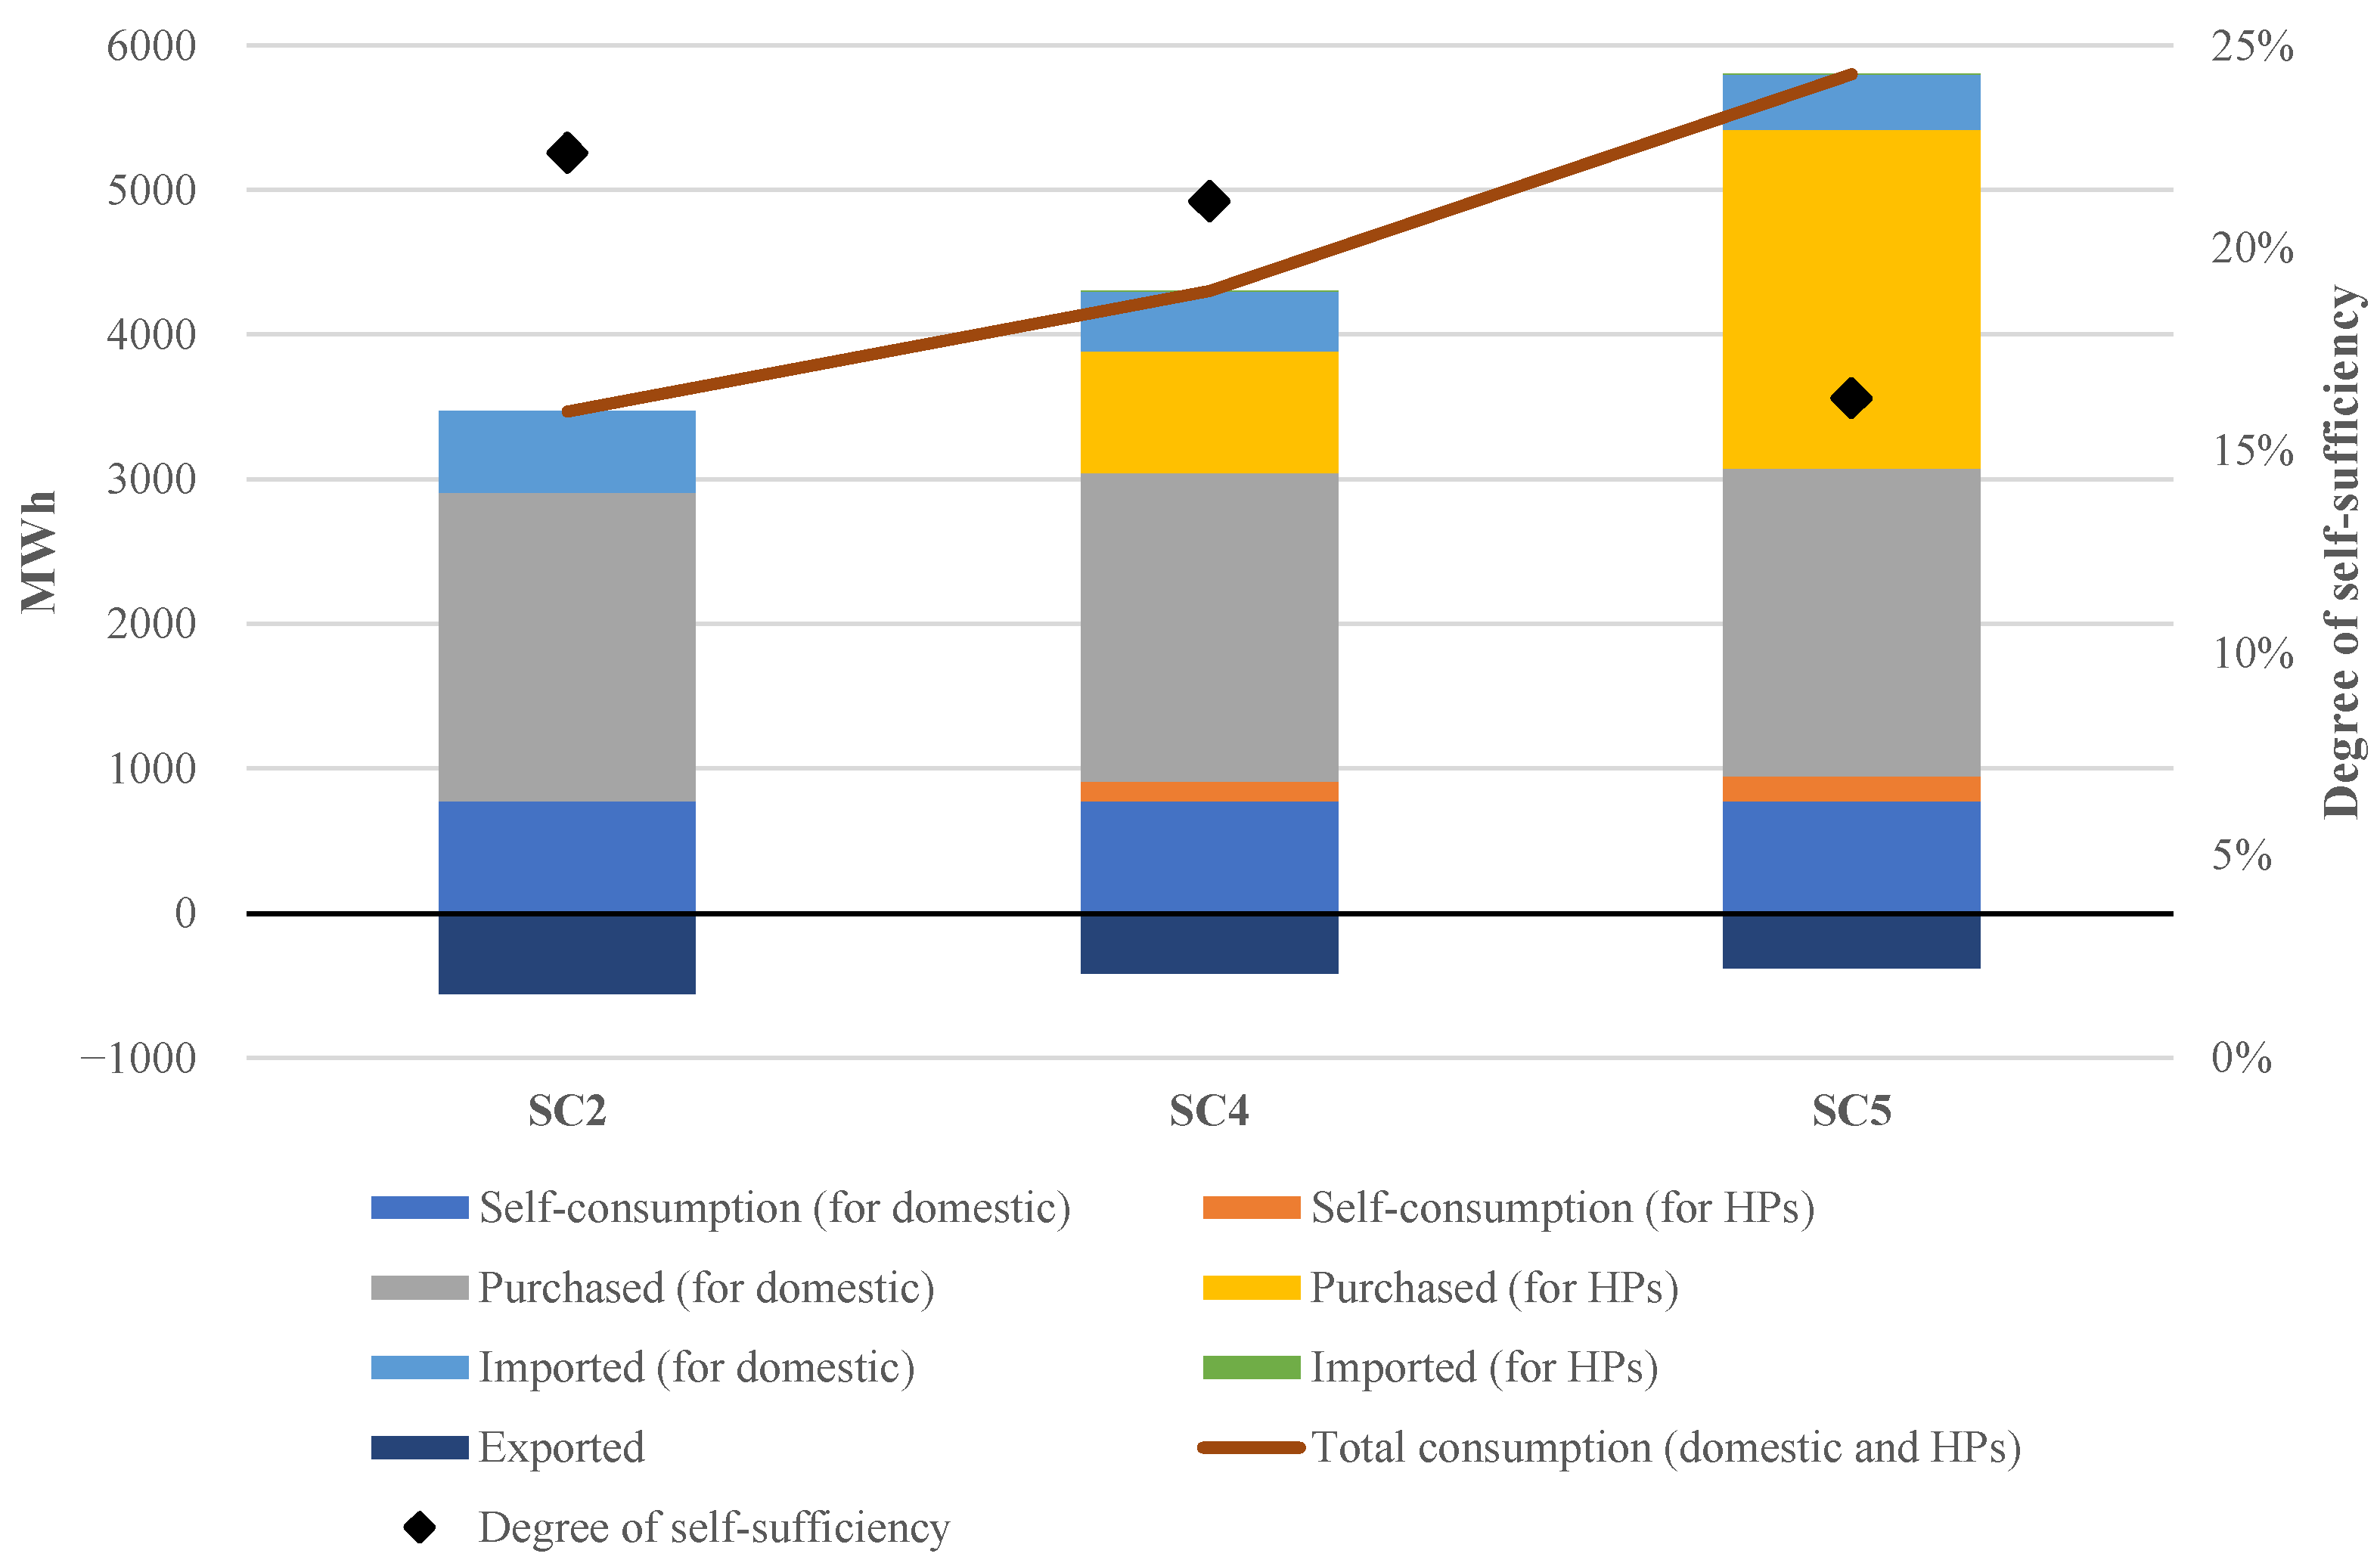
4.6. Summary and Comparison of the Results of the Analysed Scenarios
The results of the simulated scenarios indicated that the technical performance and economic parameters of the analysed system solutions were highly dependent on heat and electricity prices.
Figure 8 compares the scenarios in terms of electricity performance and consumption, with SC3 excluded, as it showed the same results as SC2.
In SC1, the proposed heating system utilizing heat pumps and electric heaters to fully satisfy heat demand in the city block was not economically viable within a 20-year period. The economic performance of this system could be improved if the installation and investments were to decrease and heat prices were to increase significantly.
In SC2, particularly in Case B, the proposed PV system is economically attractive when electricity prices in the market are high. However, the system is limited by the available rooftop space of buildings, which somewhat reduces the self-consumption parameter.
The hybrid system demonstrates the best results in terms of technical performance and economic viability when on-site PV-generated electricity is used not only for domestic electricity consumption, but also to power the heat pumps and electric heaters. However, the main limitation of this system is that the highest PV generation occurs during the summer months when there is no heat demand, resulting in low self-consumption utilization.
Table 6 summarizes the simulation results for all the analysed scenarios.
The economic scenario analysis revealed that parameters such as NPV, IRR, PB, and LCOH are sensitive to electricity and heat purchase prices, particularly when the installation of a PV system is considered. The hybrid system in SC5 demonstrated slightly higher absolute values of these parameters in comparison to SC3 and SC4 in both cases A and B. For example, in SC5_A, the PB was 9.1% and 2.2% shorter than in SC3_A and SC4_A, respectively. The LCOH in SC5_B was also lower by 5.4% compared to SC3_B and 1.1% compared to SC4_B. The difference between the other parameter values in SC5 and other scenarios can be seen in
Table 6.
By introducing the integration of RES with a DT concept for city block renovation, this study provides an approach that combines two important domains in the field. While previous studies have explored RES solutions for buildings or digital twin applications in urban planning, this research offers a novel contribution by integrating these concepts and demonstrating their effectiveness in optimizing building energy systems. This aspect itself represents an advancement in the existing literature.
5. Conclusions
The decarbonization of urban areas is becoming increasingly important as cities strive to reduce their carbon footprint. This paper focused on the decarbonization possibilities of a city block in Kaunas, Lithuania, by considering deep renovations of block buildings and the use of RES, including the installation of PV modules and various types of heat pumps and electric heaters. Several scenarios, including stand-alone and hybrid systems for electricity and heat production, were examined to define the optimal solution to provide energy from RES on-site.
One of the main contributions of this study was the application of a digital twin, which provided a detailed 3D model of the city block. The DT recreated the essential features required to simulate energy consumption and production and present research results. The use of the DT enabled an accurate estimate of the shadows cast by proximities and the available roof areas for PV module installation, allowing for a more precise evaluation of on-site PV electricity production potential.
The main conclusions of this study are outlined as follows:
An analysis of heat consumption data revealed that renovated buildings consume 43% less heat compared to those buildings that have not yet been renovated.
Replacing the heat supply from the DH network with heat pumps and electric heaters is not a financially viable solution when renovating buildings in the city block. It results in a relatively high LCOH compared to the average purchased heat price of the heat supplier, and the payback period is not reached within the lifetime of the installed heat system. To achieve a payback period of seven years, approximately 80% of external financial support would be required.
Almost all heat demand for buildings in the city block was satisfied by heat pumps, while electric heaters were used only 1.3% of the time, satisfying 4.28% of peak heat demand.
Installation of PV modules on building roofs is a viable solution, particularly in scenarios with high electricity prices. In this case, the payback period can be reached in seven years, while in scenarios with low electricity prices, the payback period is approximately 15 years.
It is not possible to fully cover domestic electricity consumption solely from on-site PV generation. It can cover 22% of the domestic electricity needs of the buildings in the city block. The unevenness of PV generation varies greatly during the year, making the system dependent on the electricity “storage” service provided by the national grid.
A combination of heat pumps and a PV system (a hybrid system) in the renovation process may be a viable solution for the city block to achieve full independence from the DH supply network. In this case, heat pumps and electric heaters would need to fully satisfy the demand for space heating and DHW production. However, the on-site PV-generated electricity would not be sufficient to fully meet the electricity needs of the heat pumps. Nevertheless, it would reduce the amount of electricity purchased from the supplier to power the heat pumps. This solution was found to be competitive both during the summer and the heating season by combining the installed heating system with the PV system.
The hybrid system scenario, in which on-site PV-generated electricity is utilized to power heat pumps not only for DHW production but also for space heating, demonstrated the most favourable results. This case led to a payback of 13.95 years in the scenario with high prices, while in the scenario with low prices, it was not reached within the modelling period of 20 years. However, the annual degree of self-sufficiency in this hybrid system scenario decreased from 22.36% to 16.29% when compared to the stand-alone PV system.
In terms of the economic attractiveness of the hybrid system, the best results compared to other scenarios analysed were obtained when the electricity generated from PV modules was utilized not only for domestic electricity consumption, but also to power heat pumps and electric heaters for both DHW production and space heating. This scenario resulted in a 9.1% shorter payback period and a 5.4% lower LCOH compared to the other scenarios.
The application of the digital twin of the city block allowed for a more accurate analysis of solutions to provide electricity and heat to the buildings using RES technologies. The detailed 3D model enabled the estimation of shadows cast by proximities and the accurate calculation of available roof areas for PV module installation, allowing for a more accurate evaluation of on-site PV electricity production potential.
The developed methodology can aid in the deep renovation of city blocks by considering the potential of RES technologies in buildings. The application of this methodology allows for the mitigation of emerging technical and economic risks associated with renovation projects and reduces initial investments.
The findings demonstrate the advantages of district-scale renovations. The most beneficial scenario can be subsequently applied to district-scale renovations in the Baltic states and other Eastern European countries with similar city districts. The city blocks in this region were constructed in a similar manner, with comparable sizes, infrastructure, and construction periods.
The study has some limitations, and future research possibilities can be considered. It would be valuable to expand the scope of the study to include other cities with different climates and economic conditions. This will enable researchers to evaluate how the results and conclusions of the study may differ in various contexts. Additionally, the study may benefit from an increased number of different heat pumps that are integrated into the optimization model, allowing for a more comprehensive analysis of their effectiveness in building renovations. Another potential area for research is the inclusion of batteries as backup systems for PV systems, which could provide additional insights into the potential benefits of this technology in the building renovation process.
Additionally, this study has certain limitations stemming from data availability, assumptions, and analysis techniques. Although the data utilized were generally reliable, as they were based on the actual energy consumption in buildings and an accurate 3D model, there may still be uncertainties in the results due to the assumptions made for the simulations. These assumptions may not fully capture the complexity of real-world scenarios, potentially resulting in discrepancies between the simulated and actual performance. Furthermore, it is important to note that assumptions regarding electricity and heat prices play a crucial role in determining the optimal RES solution and may lead to uncertainties in the results. However, this limitation was addressed in the study by creating two scenarios (Case A and Case B) with different energy prices to show that the prices affected the results significantly.
Overall, further research in this area has the potential to inform the development of more effective and sustainable building renovation strategies that leverage renewable energy sources.


 ,
, 


