Article

Wheat Straw Biochar Produced at a Low Temperature Enhanced Maize Growth and Yield by Influencing Soil Properties of Typic calciargid

1
Department of Soil Science, Faculty of Agricultural Sciences and Technology, Bahauddin Zakariya University, Multan 60800, Pakistan
2
Institute of Soil and Environmental Sciences, University of Agriculture, Faisalabad 38000, Pakistan
3
Department of Agronomy, Engro Fertilizers Ltd., Lahore 54000, Pakistan
4
Department of Plant Breeding and Genetics, University of Agriculture Faisalabad, Sub-Campus Depalpur, Okara 38040, Pakistan
5
Plant Production Department (Horticulture-Pomology), Faculty of Agriculture, Saba Basha, Alexandria University, Alexandria 21531, Egypt
6
The National Institute of Horticultural Research, Konstytucji 3 Maja 1/3, 96-100 Skierniewice, Poland
7
King Saud University, P.O. Box 2455, Riyadh 11451, Saudi Arabia
8
Department of Botany and Microbiology, College of Science, King Saud University, P.O. Box 2455, Riyadh 11451, Saudi Arabia
*
Authors to whom correspondence should be addressed.
Sustainability 2023, 15(12), 9488; https://0-doi-org.brum.beds.ac.uk/10.3390/su15129488
Submission received: 2 April 2023 / Revised: 31 May 2023 / Accepted: 6 June 2023 / Published: 13 June 2023

Abstract

:
Arid and semi-arid soils are low in organic matter and have poor fertility, making them a serious threat to crop production. Most organic amendments, such as crop residues and farmyard manure, are short lived because of rapid decomposition. Incubation and pot studies were conducted to assess the impact of wheat straw biochar (produced at 350 °C) on temporal changes in soil microbial biomass and fertility status and to evaluate the efficacy of biochar for maize production in the top layer of Typic calciargid. The incubation study compared four levels of biochar (control, 0.5, 1.0 and 2.0% on a w/w basis of soil) and two fertilizer rates, i.e., unfertilized (no NPK fertilizer) and fertilized (nitrogen, P2O5 and K2O with rates of 125, 80 and 52.5 mg kg−1 soil, respectively). After incubation, the 2.0% biochar significantly improved the soil cation exchange capacity, organic carbon and microbial biomass carbon by up to 35, 59 and 26%, respectively, while decreasing the soil pH by up to 1.5% compared to that of the control treatment. When fertilized, the 2.0% biochar improved the soil’s available phosphorous, extractable potassium and total nitrogen by up to 59, 39 and 28%, respectively, compared to those of the control. The results from the pot experiment showed that using the 1% biochar with fertilizer significantly increased the maize dry biomass and grain yield by up to 57 and 72%, respectively, compared to those of the control. Additionally, the nitrogen and phosphorus recoveries from the mineral fertilizers improved significantly (up to 26 and 38%, respectively) when using the 1.0% biochar compared to those of the control. Conclusively, the addition of 1.0% biochar significantly improved maize growth and yield by enhancing nutrient recovery from mineral fertilizer and improving soil properties.

1. Introduction

Biochar may persist in soils and sediments for hundreds of years [1,2,3] and has the potential to be used in agronomic crop production [4]. Its high surface area and porosity enable it to retain water and essential nutrients for a longer period and to provide the best habitat for soil microorganisms [5,6]. Soil applications of various organic amendments may have some limitations (i.e., early decomposition). However, a biochar application may be an effective strategy to overcome such limitations.
Recent research has reported the usefulness of soil amendments to improve agronomic and fertilizer use efficiencies. Manure, mulches and cover crops have been proven to be effective in supporting the rapid cycling of plant nutrients in the soil through the microbial population and supplying these essential plant nutrients to different crops [7,8,9]. However, the commonly used organic amendments are usually short lived and mineralized to CO2. Thus, to sustain soil productivity, repeated applications of organic amendments are recommended [10]. Biochar, on the other hand, stays in soils for longer periods. It could help fulfill the growing need to turn marginal and unproductive lands into fertile and productive lands.
In soil environments, biochar interacts with several plant nutrients. The binding ability of plant essential cations is significantly improved by the addition of soil biochar [11,12]. Thus, improved cationic retention (i.e., NH4+ retention) and slower ion release in biochar-amended soil may be because of its high cation exchange capacity (CEC). Biochar has the potential to reduce the losses of mineral nitrogen (N) added as ammoniacal N. The addition of biochar is also a source of labile carbon (C) and as a result, the N immobilization of microbial biomass is another mechanism that contributes to the retention of N in top soil [13,14]. The availability of potassium (K) to plants is mainly affected by the physical properties of the soil, including its hydraulic conductivity, infiltration rate, bulk density and soil aggregation [15]. Biochar applications improve the physical properties of soil by increasing the soil organic matter status, which acts as a soil conditioner [16]. Therefore, biochar can play a significant role in K availability to plants. Biochar may also have a high anion exchange capacity, so it may also enhance phosphorus (P) availability by controlling the activity of the cations that interact with soil P [17]. Biochar applications to alkaline soils may be an effective strategy to reduce soil pH [18]. Phosphorus redistribution, mineralization and immobilization in soils depend on the physicochemical properties of soils [19,20]. Although both the phosphate ions and biochar surface may have negative charges, biochar can still absorb the phosphate ions on it through an interaction that can overcome electrostatic repulsion [21].
Various factors, such as the temperature and type of feedstock used in the pyrolysis process, influence the characteristics of biochar. These factors contribute to a wide range of values for properties such as pH, specific surface area, nutrient content, CEC, ash content and C content [22]. The temperature at which pyrolysis occurs has a significant impact on both the physical and chemical properties of biochar. This is because the structure and chemical bonds undergo stagewise decomposition during the pyrolysis process [23]. The pH of biochar generally falls within a range from acidic to alkaline, with lower-pH biochars often being overlooked. However, as the pyrolysis temperature increases, the pH of biochar tends to rise due to the depletion of acidic functional groups at higher temperatures [24]. Nonetheless, it should be noted that biochars produced at lower temperatures can still exhibit neutral to acidic properties [25,26]. Higher pyrolysis temperatures tend to yield biochar with elevated pH levels but lower CEC values and N content [22,27]. A few works from the literature have suggested that the lower pH resulting from lower temperature pyrolysis can be neutral to acidic, initially increasing the availability of nutrients for plants in arid calcareous soils [24]. Similarly, neutral biochars may exhibit different behaviors compared to commonly available alkaline biochars when introduced into soil during environmental processes.
Alkaline calcareous (Typic calciargid) soils generally have a high pH with a low content of organic matter. This type of soil lacks macronutrients (i.e., N and P) and micronutrients (i.e., zinc, iron and boron), and their deficiency is a common phenomenon in this type of soil. The sustainability of crop yields is a prerequisite to a boom in the economy of a country. In alkaline calcareous soils, the application of biochar may play a crucial role in sustaining soil health, its microbial population and nutrient levels [28]. Studies have revealed the outcomes of biochar application on soils and plant productivity [29,30]. However, very limited information is available about the effect of wheat straw biochar produced at a low temperature on nutrient availability, microbial biomass and other properties of alkaline calcareous soil within the great Typic calciargid group. Therefore, studies are needed to better understand the effects of biochar produced at a low temperature on the chemical, microbial and nutritional properties of Typic calciargid and crop growth. Therefore, a research project was planned: (i) to assess the response of wheat straw biochar produced at a low temperature on the soil properties of Typic calciargid; and (ii) to evaluate wheat straw biochar produced at a low temperature for maize production.

2. Materials and Methods

2.1. Production and Characterization of Wheat Straw Biochar

For the production of wheat straw biochar, wheat straw feedstock was collected from a local farmer, sun-dried in a dust-free environment and then oven-dried at 65 °C in an air-derived oven (Tokyo Rikakikai, Eyela WFO-600ND, Tokyo, Japan) until a constant weight was obtained. The dried material was crushed into small pieces (with a size of 5–10 mm) followed by pyrolysis in a muffle furnace (Gallonhop, London, UK) at 350 °C [31]. The gradual increase in furnace temperature from the starting room temperature was set at 8 to 9 °C per minute. Twenty minutes of residence time was set after achieving 350 °C. After allowing it to cool at room temperature, biochar was collected from the furnace, and it was then finely ground until it had a particle size of ≤2 mm.
Sub-samples of the produced biochar were analyzed in the laboratory for key parameters (Table 1). Moisture contents in the biochar were determined gravimetrically. The pH and electrical conductivity (EC) were measured in a supernatant of a 1:20 mixture of biochar in distilled water. Ammonium acetate compulsory displacement method was followed to determine the CEC of biochar [32]. For the determination of ash contents, biochar samples were heated in a muffle furnace at 750 °C for 5 h [33]. Hydrogen (H), C, N and sulfur (S) contents were measured through Vario-Micro Elemental (CHNS-O) Analyzer (Elementar Analysensysteme-GmbH, Langenselbold, Germany). Biochar was digested in sulfuric acid and hydrogen peroxide [34] followed by the determination of other plant nutrients. The digests were run on a flame photometer (PFP7, Jenway, London, UK) for K and on an atomic absorption spectrophotometer (AAnalyst-100, Perkin-Elmer, Norwalk, CT, USA) for Mg, Ca, Fe, Mn and Zn analyses. Vanadate-molybdate method [35] was followed to measure P concentration using a UV–visible spectrophotometer (UV-1201, Shimadzu, Tokyo, Japan). Oxygen contents in the biochar were calculated by using the following equation:
O   ( % ) = 100   % ( H + N + C + Ash )
Different elemental (C:P, C:S and C:N) and molar (O:C, H:C and (O+N):C) ratios were also calculated to categorize the produced biochar (Table 1).

2.2. Analysis of Soil

A bulk soil sample (from 0 to 15 cm soil depth) was collected from the Research Area of the Institute of Soil and Environmental Sciences, University of Agriculture, Faisalabad, Pakistan (31°26′ N and 73°06′ E latitude, 184.4 m altitude) and classified as Typic calciargid. After air-drying, it was passed through a 2 mm sieve. A sub-sample of sieved soil was used to determine its physicochemical characteristics. For the determination of soil texture, the hydrometer method proposed by [36] was followed. The soil texture class was sandy clay loam with 58.1, 19.4 and 22.5% of sand, silt and clay, respectively. Calomel glass electrode assembly was used for the determination of the pH of saturated soil paste, which was 7.93. An extract of saturated soil paste had an EC of 1.30 dS m−1. Walkley–Black method [37] was used for the determination of soil organic carbon (SOC) content which was 3.98 g kg−1 soil. The CEC of the soil was determined as proposed by [38], which was 16.3 cmolc kg−1. The method in [39] was followed to determine extractable soil K, which was 110 mg kg−1. Available soil P was determined in NaHCO3 extract [40], which was 7.34 mg kg−1.

2.3. Incubation Experiment

Four biochar rates (0.0, 0.5, 1.0 and 2.0% on w/w basis of soil) in combination with control or recommended doses of NPK were thoroughly mixed into soil in plastic pots. Each pot had 400 g of the sieved soil, and the treated pots were arranged according to a 2-factorial completely randomized design (CRD) with twelve replicates. In the respective treatments, basal doses of 250 kg ha−1 N (125 mg kg−1 soil), 160 kg ha−1 P2O5 (80 mg kg−1 soil) and 105 kg ha−1 K2O (52.5 mg kg−1 soil) were added, respectively, as urea, single super phosphate and potassium sulfate.
After the application of treatments, pots were covered with polythene sheets with small holes to allow gases to exchange between soil and atmosphere and to limit moisture loss. The pots were incubated at 25 ± 3 °C, and moisture contents in the soil were maintained at 80% field capacity.
After 25, 50, 75 and 100 days of the application of the treatment, from each treatment, 3 pots were randomly selected for sampling. The collected soil samples were sealed in plastic bags and immediately preserved in an ultra-low-temperature freezer (Robus Technologies, Dublin, Ireland) at −40 °C to avoid chemical, biological and nutritional changes. Soil chemical and nutritional analyses were determined by the following standard procedure explained below.
The chloroform fumigation method [41] was used for the determination of microbial biomass C in soil samples, and then the resulting flush of oxidizable C (analyzed by spectrophotometer) was adjusted by the factor, which was 0.45 [42]. The Ninhydrin method [43] was followed for the determination of microbial biomass N and adjusted by a factor of 6.47 [44]. Computations were performed to determine the C:N ratio using soil organic matter [45].

2.4. Pot Experiment

A pot study was conducted at a glasshouse at the institute. For this, 24 polyethylene-lined plastic pots (with dimensions of 51 × 33 cm) were each filled with 17 kg soil. Treatments comprised possible combinations of four biochar (control, 0.5, 1.0 and 2.0%) and two fertilizer (control and fertilized) rates. In a factorial arrangement, the treatments were arranged according to CRD in triplicates. Control pots received no fertilization, but the remaining pots received N (125 mg kg−1 soil), P2O5 (80 mg kg−1 soil) and K2O (52.5 mg kg−1 soil), respectively, as urea, single super phosphate and potassium sulfate. Nitrogen was added in three equal splits, i.e., before sowing, 15 days after germination and 30 days after germination. After the application of fertilizers and biochar, the soil of each pot was thoroughly mixed followed by equilibration for 7 d. After that, five pre-soaked (for 24 h) healthy seeds of maize (Syngenta-8441, Lahore, Pakistan) were sown per pot. Ten days after the germination, the maize seedlings were thinned to a single plant pot−1. Throughout the experimental period, to maintain moisture content at 90% of field capacity, tap water was used for irrigation in all the pots. For the peak vegetative growth, plant physiological traits (water use efficiency, photosynthetic rate, stomatal conductance and vapour pressure deficit) were recorded using a portable photosynthesis system (CIRAS-3, PP Systems-Hitchin, Hertfordshire, UK) between 09:30 am and 10:30 am. For this purpose, the fully expanded upper leaf (2nd leaf from the top) of each plant was selected.
Maize plants were harvested at maturity (after 115 days of sowing). Root and shoot samples were collected and washed with tap water. After washing, samples were air-dried and then oven-dried at 65 °C in an air-driven oven, till a constant weight was obtained. After recording shoot, cob, grain and root dry matter yields, the plant samples were finely ground in a metal-free grinder. The known weights of the samples were digested in sulfuric acid and hydrogen peroxide [34]. Kjeldhel method was used for the determination of N from plant samples [46]. For P determination, after developing yellow color by the vanadate-molybdate method [35], samples were run on a UV–visible spectrophotometer. For K determination, a flame photometer was used.
Computations of nutrient uptake were based on the data of dry matter yield and nutrient contents in plant tissues. Nutrient recovery was calculated using the following equation [47]:
Nutrient   Recovery   ( % ) = ( Nutrient   Uptake   in   Biochar   Treated   Pots     Nutrient   Uptake   in   Control   Pots ) Nutrient   Added   through   Inorganic   Fertilizer   and   Biochar × 100
Post-harvest soil samples were collected after three days of harvesting. Collected soil samples were sun-dried and crushed to pass through a 2 mm sieve. The soil samples were analyzed for various chemical and nutritional characteristics of the soil. The details of the procedures followed are described below in the soil analysis.

2.5. Statistical Analysis

General data computations were performed in Microsoft Excel 365® (Microsoft Corporation, Redmond, WA, USA). Statistical software Statistix 8.1® was used to check the significance of different treatments by analysis of variance test followed by Tukey’s multiple comparison test (p ≤ 0.05).
Research resources: The funds for the research’s resources were provided by the Higher Education Commission, Islamabad (Pakistan) through the Project No. 20-2431.

3. Results

3.1. Biochar Characterization

The biochar had an ash content of 11.53%, a moisture content of 3.12% and a conversion efficiency of 57.3%. The CEC, EC and pH of the biochar were 56.34 cmolc kg−1, 01.27 dS m−1 and 07.56, respectively. In terms of its nutritional and elemental characteristics, the biochar contained 57.54% C, 4.37% hydrogen (H), 25.27% oxygen (O) and 1.29% N. It also contained 4.05 g kg−1 of sulfur (S), 1.98 g kg−1 of P, 10.17 g kg−1 of potassium (K), 4.74 g kg−1 of magnesium, 3.53 g kg−1 of calcium, 89.60 mg kg−1 of iron, 43.76 mg kg−1 of zinc and 61.50 mg kg−1 of manganese. The elemental ratios revealed that the C:N ratio was 44.6, the C:P ratio was 291 and the C:S ratio was 142. Additionally, for the molar ratios, the H:C ratio was 0.91, the O:C was 0.33 and (O+N):C was 0.35.

3.2. Incubation Experiment

3.2.1. Chemical and Nutritional Properties of Soil

A significant decrease in soil pH was observed with incremental biochar rates (Figure 1a). Overall, the highest pH value (7.92) was observed in the control treatment without fertilizer. The lowest value (7.82) for the soil pH was observed after 100 days of incubation, when a 2% biochar rate was used. Soil chemical properties (CEC and TOC) were also significantly improved with the addition of biochar in the soil (Figure 1b,c). The maximum soil CEC (of 24.5 cmolc kg−1) and TOC (of 9.1 g kg−1) were observed after 100 days of incubation (Figure 1b).
The biochar addition at 2.0% improved the total soil N and available P concentration, significantly increasing over time (Figure 2a). As compared to the first sampling, the highest concentration of available P (36.93 mg kg−1) was also observed after 100 days of incubation in the treatment for which the 2.0% biochar was added.

3.2.2. Biological Properties of Soil

Microbial biomass C was significantly increased with an increase in the incubation duration after the addition of the biochar to the soil (Figure 3a). The maximum concentration of microbial biomass C (451.65 µg g−1) was in the treatment for which the 2.0% biochar was added to the soil and after 50 days of the incubation period. Therefore, an increase of 26% was observed in microbial biomass C as compared with that of the respective control treatment.
After 50 days of incubation, a significant decrease in microbial biomass N was observed; however, after 75 and 100 days, no further statistical changes in microbial biomass N were observed (Figure 3b). Overall, the highest amount of microbial biomass N (30.0 µg g−1) was observed after 25 days of incubation in the amended 2.0% biochar treatment with fertilizer. This was 43% greater than the microbial biomass N measured after 100 days of incubation in the amended 2.0% biochar treatment.
Under unfertilized and fertilized conditions, at various sampling durations, a significant increase in the C:N ratio was observed with the application of different rates of biochar, compared to those of the respective control treatments (Figure 3c). Under the unfertilized condition, the highest C:N ratio (44.8) was observed after 100 days of the treatment’s application. Under the fertilized condition, significant increases in the C:N ratio were observed in the treatments with respective biochar rates compared to the treatments with different biochar rates after 50, 75 and 100 days of the treatment’s application.

3.3. Pot Experiment

3.3.1. Physiological and Agronomic Parameters

The main effects of the biochar and fertilizer were significant for the maize’s physiological traits (Table 2). The stomatal conductance (gs), water use efficiency and photosynthetic rate (A) of the maize plants were improved significantly by increasing the biochar rates and by the addition of NPK, and their maximum values (248.00 mmol m−2 s−1, 6.30 mmol CO2 mol−1 H2O and 27.00 µmol m−2 s−1) were measured at the 1.0% biochar rate added in the soil along with the recommended NPK. The vapour pressure deficit in the maize plants was decreased significantly by the addition of biochar to the soil and by the addition of NPK. A minimum vapour pressure deficit of 2.42 KPa was also found in the treatment in which the 1.0% biochar was added along with NPK, and it was up to 47% less than that of the control treatment.
The maize’s agronomics parameters (dry biomass, root dry weight, grain and straw yield) were significantly improved by the addition of biochar and fertilizer (Table 3). The wheat straw with the addition of 1.0% biochar in combination with the recommended NPK produced the highest yields, and the maximum values for the dry biomass, grain yield, stover yield and root dry weight were 236, 79, 157 and 64 g pot−1, respectively.

3.3.2. Nutrient Concentration and Uptake in Maize Plant

The nitrogen and K contents in the stover and grains of the maize plant were significantly enhanced when biochar was added, and the same trend was observed with NPK (Table 4). A significant interactive effect of the biochar and fertilizer was observed for the P concentration in different parts of the maize plant. The addition of the 1.0% biochar along with the recommended NPK resulted in the maximum concentrations of N, P and K in the stover and grains of the maize plants. The maximum concentrations were 0.43% N, 1.83 g P kg−1 and 6.51% K in the stover, and 1.47% N, 4.83 g P kg−1 and 5.79% K in the grains.
A significant interactive effect of biochar and fertilizer was observed on the nutrient uptake in the maize grains (Table 5). The highest values of 1.17, 0.38 and 0.46 g pot−1 for, respectively, the N, P and K uptake were measured with the additions of the NPK fertilizer and 1.0% biochar. Significant effects of the biochar and fertilizer were also observed on the N, P and K uptake in the maize stover with their values being 0.67, 0.29 and 1.02 g pot−1, respectively, for the 1.0% biochar in combination with the recommended dose of NPK fertilizer.

3.3.3. Nutrient Recovery from Mineral Fertilizers

There was a significant effect of the biochar application on the N and P recovery from the urea and single super phosphate fertilizers, but a non-significant effect was observed for the K recovery from the potassium sulfate (Figure 4). Overall, for all of the biochar rates, a maximum percentage of K recovery (99%) was observed for the 1% biochar application. The maximum N and P recoveries, up to 74 from the urea and 42% from the single superphosphate, were achieved with the 1.0% biochar application. Hence, there was an improved N recovery (26%) and P recovery (38%) from the urea and single superphosphate compared to those of the control treatment without biochar.

3.3.4. Chemical and Nutritional Properties of Post-Harvest Soil

The soil’s chemical properties were significantly affected in response to the addition of biochar (Table 6). The highest statistical CEC, total organic C and EC were 28 cmolc kg−1, 8.9 g kg−1 and 2.05 dS m−1, respectively, while the minimum soil pH (7.81) was measured with the 2.0% biochar.
A significant interactive effect was observed for the biochar × fertilizers on the soil’s total N concentration, while only the main effects of the biochar and fertilizers were found to be significant for the soil’s available P concentration (Table 7). The maximum total N and available P (i.e., 0.074 mg N kg−1 and 9.27 mg P kg−1) were measured with the 2.0% biochar along with the NPK fertilizers. However, only a non-significant effect of the biochar and fertilizers was observed for the soil extractable K concentration.

4. Discussion

Biochar produced at a low pyrolysis temperature yields a greater recovery of nutrients, which are usually lost at higher temperatures [48]. Due to biochar’s addition, a significant improvement in the agronomic and physiological parameters (Table 2 and Table 3) of maize growth may be linked to the high nutrient contents in biochar produced at a low temperature (Table 1). The alkalinity of biochar can be increased by higher pyrolysis temperatures, which lead to the elimination of acidic functional groups, such as hydroxyl, formyl or carboxyl and the enrichment of basic cations [2,44]. Typic calciargid soils are already alkaline in pH [49]. In this type of soil, biochars produced at high pyrolysis temperatures may not be a suitable option, so, to avoid this scenario, in the current study, biochar was produced at a low pyrolysis temperature with aim of obtaining a product with a comparatively neutral pH (Table 1).
The biochar produced at a low temperature may have the advantage of a high CEC [22]. Biochars produced at low temperatures retain acidic functional groups, such as phenol, lactonic and carboxylic acid. These functional groups not only contribute to achieving a pH near to neutral or even acidic for the biochar, but the pore surface negative charge of these functional groups also contributes to a better CEC that helps to retain cations, i.e., ammonium [
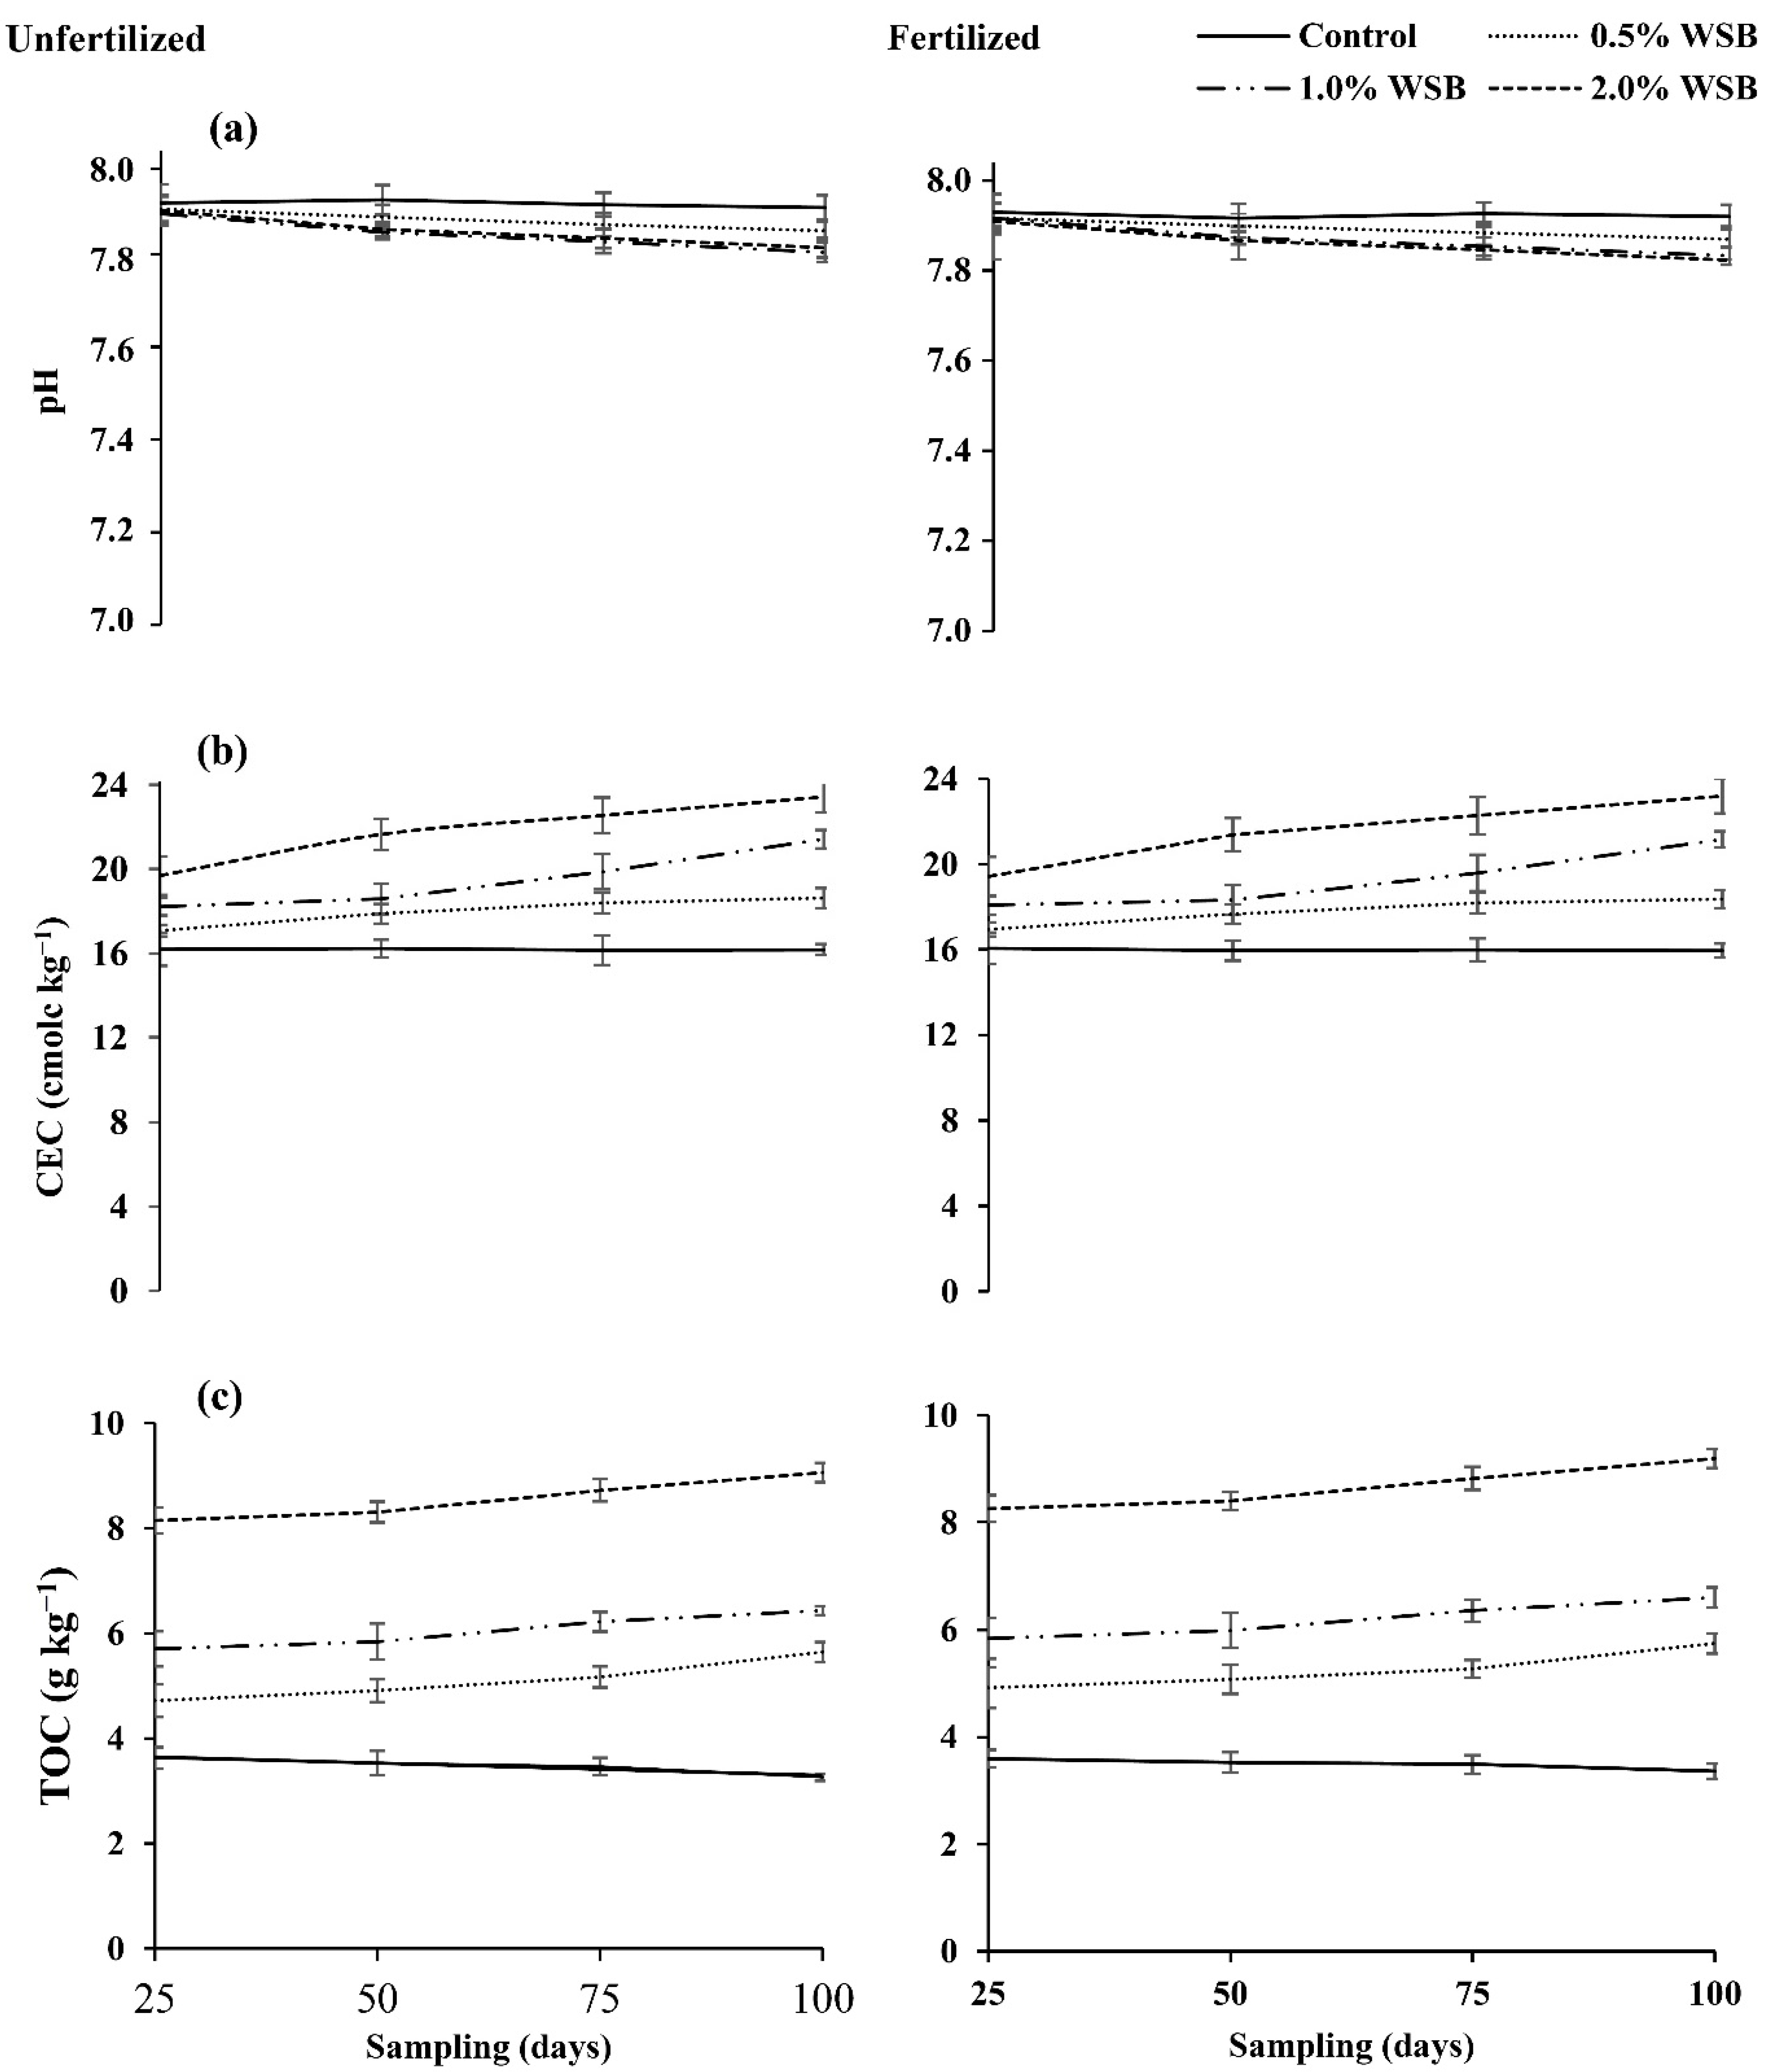
50]. In the current incubation and pot studies, a significant improvement in the soil CEC (Figure 1b, Table 6) was observed, especially when 1 or 2% biochar was added. In the incubation study, a temporal increase in the soil CEC might be the result of the oxidation of the functional groups present on the biochar surfaces [51]. Over a short time period, a minor temporal increase in soil CEC has been reported under acidic soils (oxisols) [52]; however, this phenomenon was more prominent in our case, in which a significant temporal increase in the CEC of Typic calciargid soil was observed over the period of 100 days (Figure 1b). The CEC of biochar plays a crucial role in enhancing soil nutrient retention and minimizing fertilizer losses [
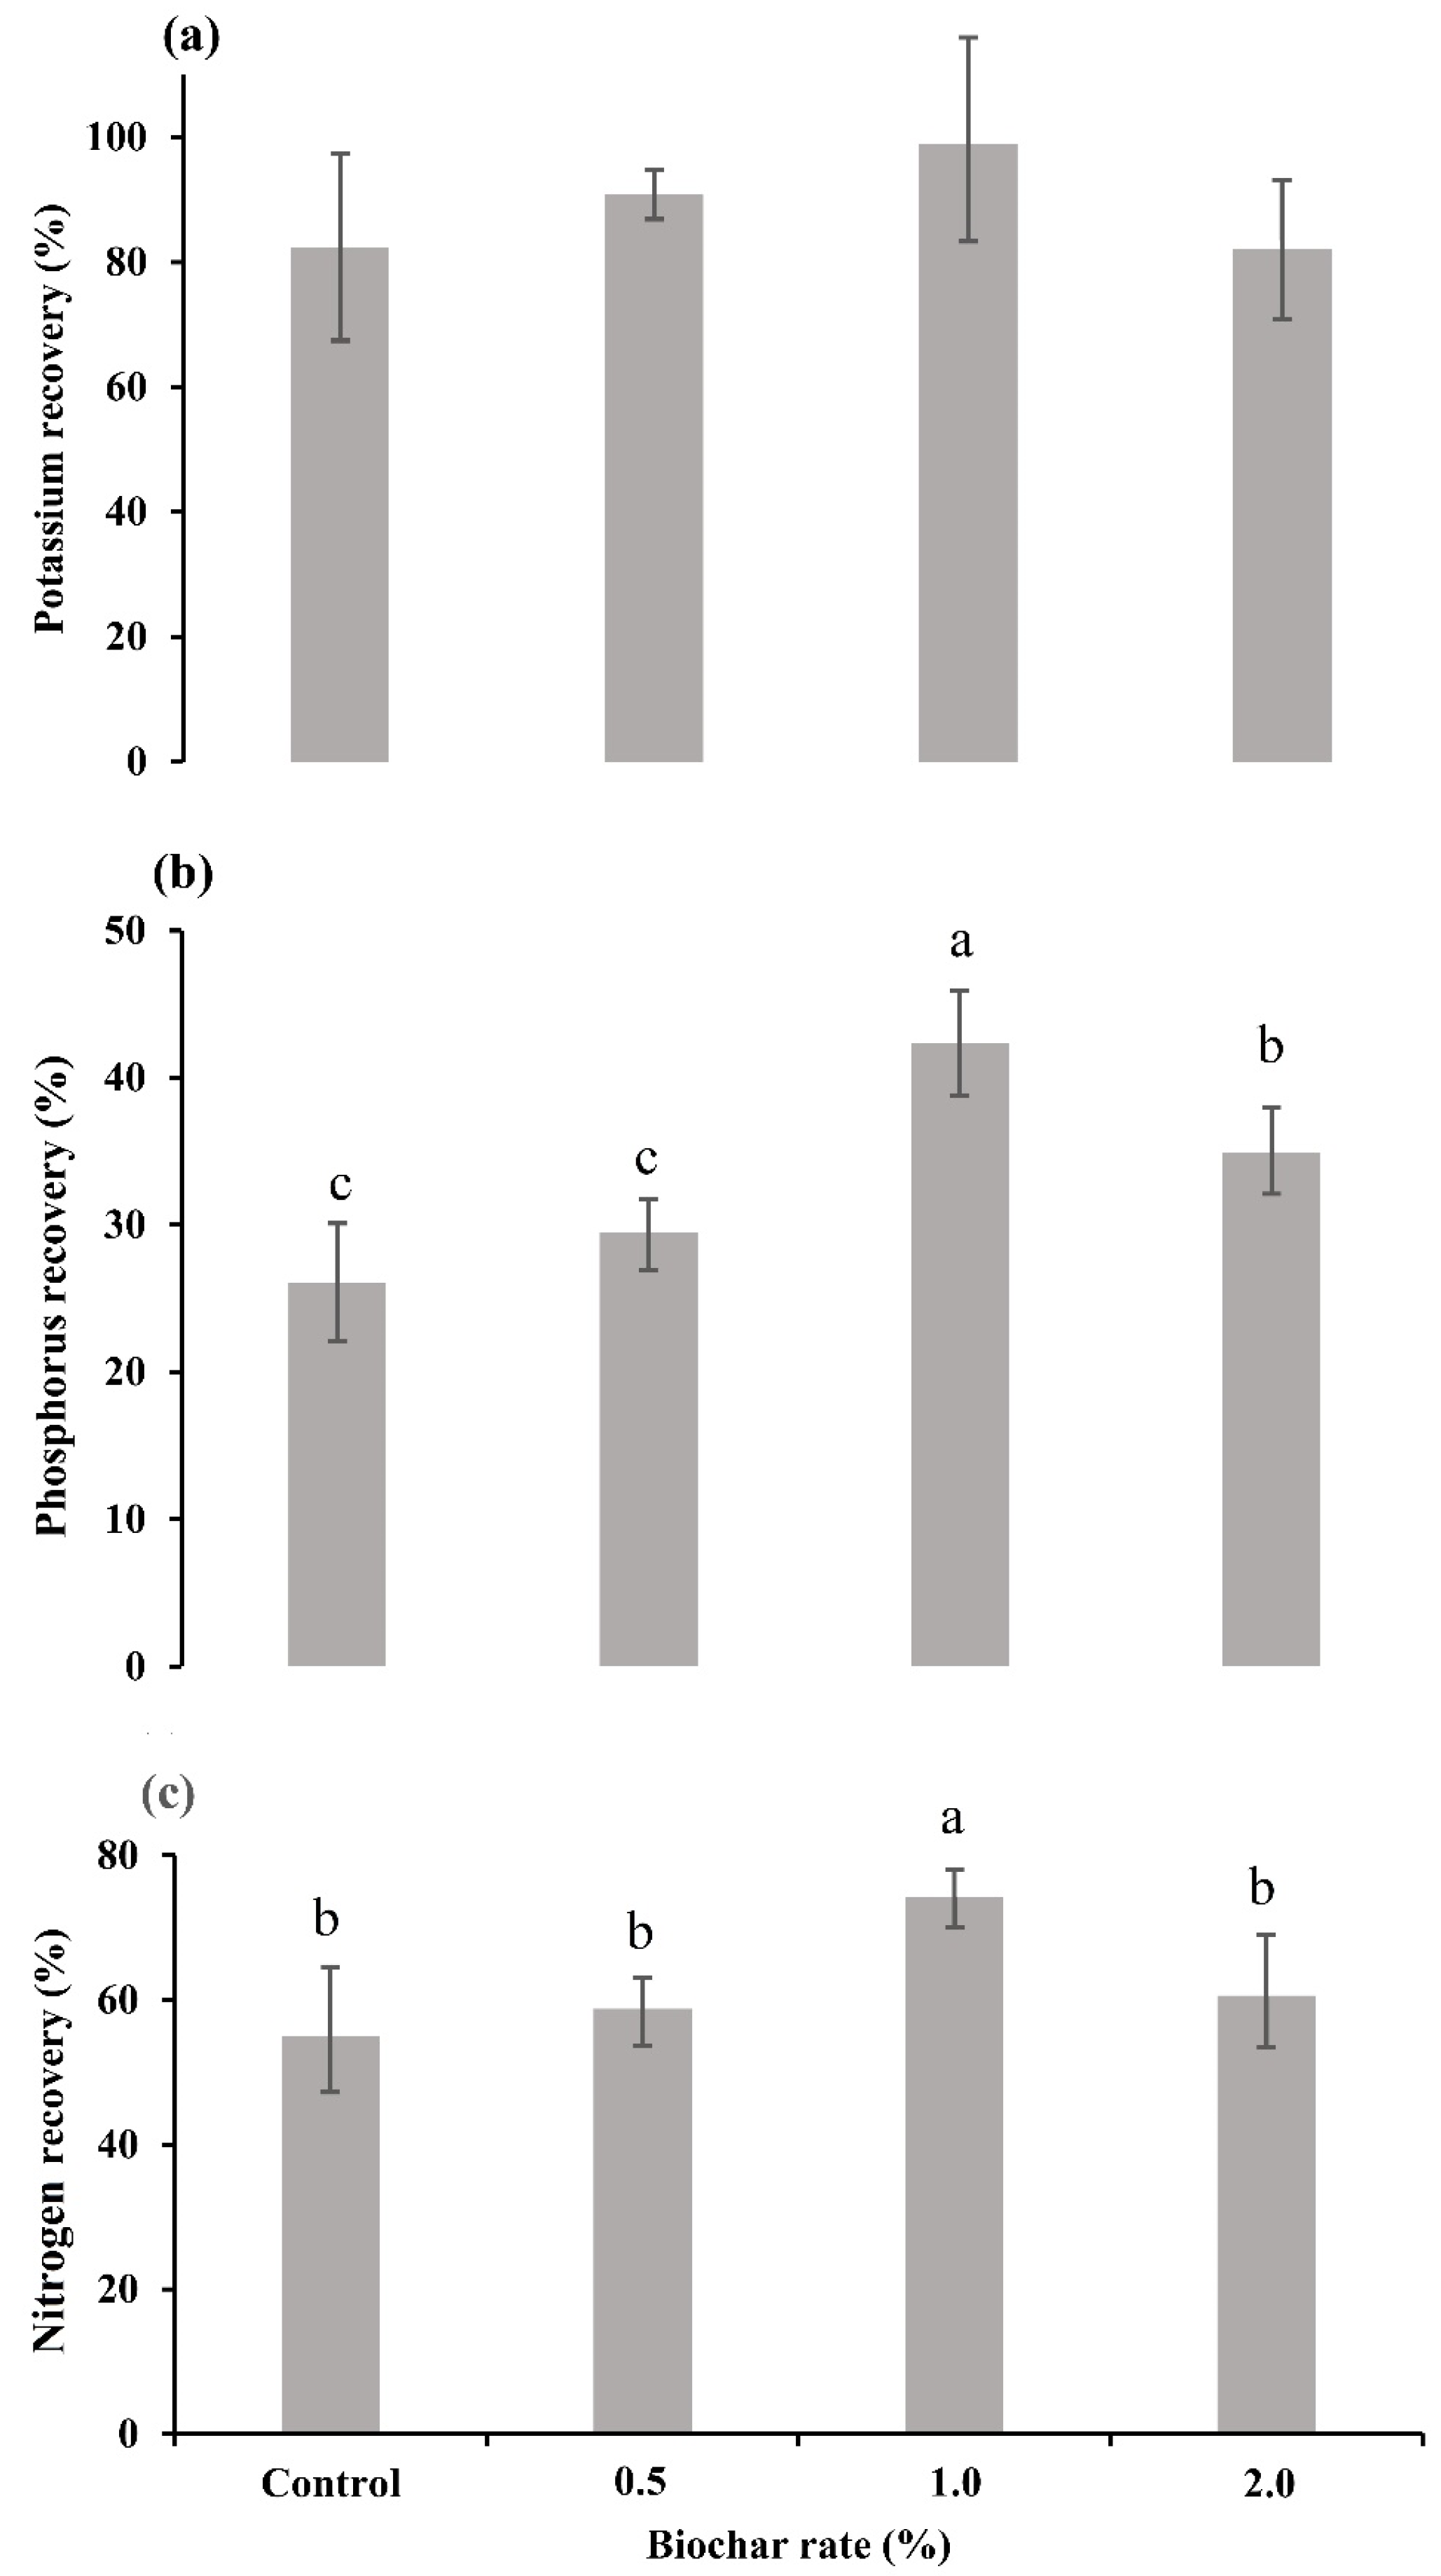
53]. Soil with a greater CEC has a greater available nutrient concentration. In our study, the better availability of essential nutrients from biochar-amended soil resulted in an improved efficiency of nutrient use as compared with that of the control (Figure 4; Table 5). Hence, better nutrient retention in the topsoil because of the addition of biochar resulted in improved nutrient recoveries from the mineral fertilizers. This increase in nutrient availability from the applied mineral fertilizers may also be linked to improved soil chemical properties, i.e., soil CEC and TOC. The addition of biochar increased maize growth and the nutritional parameters of maize, which may also be linked to the increase in the availability of nutrients from the mineral fertilizers (Figure 1 and Figure 2; Table 4). Biochar applications improve various other soil attributes (including its physical properties and fertility status) which may ultimately contribute to the improved productivity of crop plants [43].
The chemical properties of soil, including CEC, SOC, EC and pH, are very important for nutrient bioavailability in plants. The utilization of high pyrolysis temperatures (600–700 °C) in biochar production leads to a reduction in the abundance of acidic functional groups, particularly carboxylic functional groups, while introducing more basic functional groups [54,55]. Biochar produced at elevated temperatures displays a highly aromatic composition with well-structured carbon layers. Nevertheless, in the present investigation, biochar was produced at low pyrolysis temperatures, resulting in a biochar pH (7.56, Table 1) lower than that of the Typic calciargid soil (7.93) used in the current study [22]. The optimum availability of nutrients to plants ranges from a soil pH of 6.5 to 7.5. In current study, a minor decrease in soil pH was observed as a result of the biochar application (Table 6), which may oxidize the other elements present on the soil surface through microbial as well as chemical activity [56]. The oxidization thus produces carboxylic functional groups [11] that can reduce the alkalinity and decrease the soil pH as shown in the incubation experiment (Figure 1). However, this decrease was very low (up to 0.2), but at least the biochar application produced at a low temperature did not show any further increase in the pH of the already alkaline soil (the alkaline behavior of biochar has been observed in the majority of studies conducted all over the world); thus, we can conclude that the biochar produced at a low pyrolysis temperature can be used as to amend the alkaline nature of soils.
The better root growth and its proliferation in the soil might also be because of the greater ethylene concentration produced in the biochar-amended soil as compared with that in the control [57]. As compared to the control, a minor improvement in yield with the addition of charcoal was observed; however, the yield increase was greater with the combined application of charcoal and mineral fertilizers. From the meta-analysis, it was concluded that the application of biochar with inorganic fertilizers may increase plant yield by 25.3% [
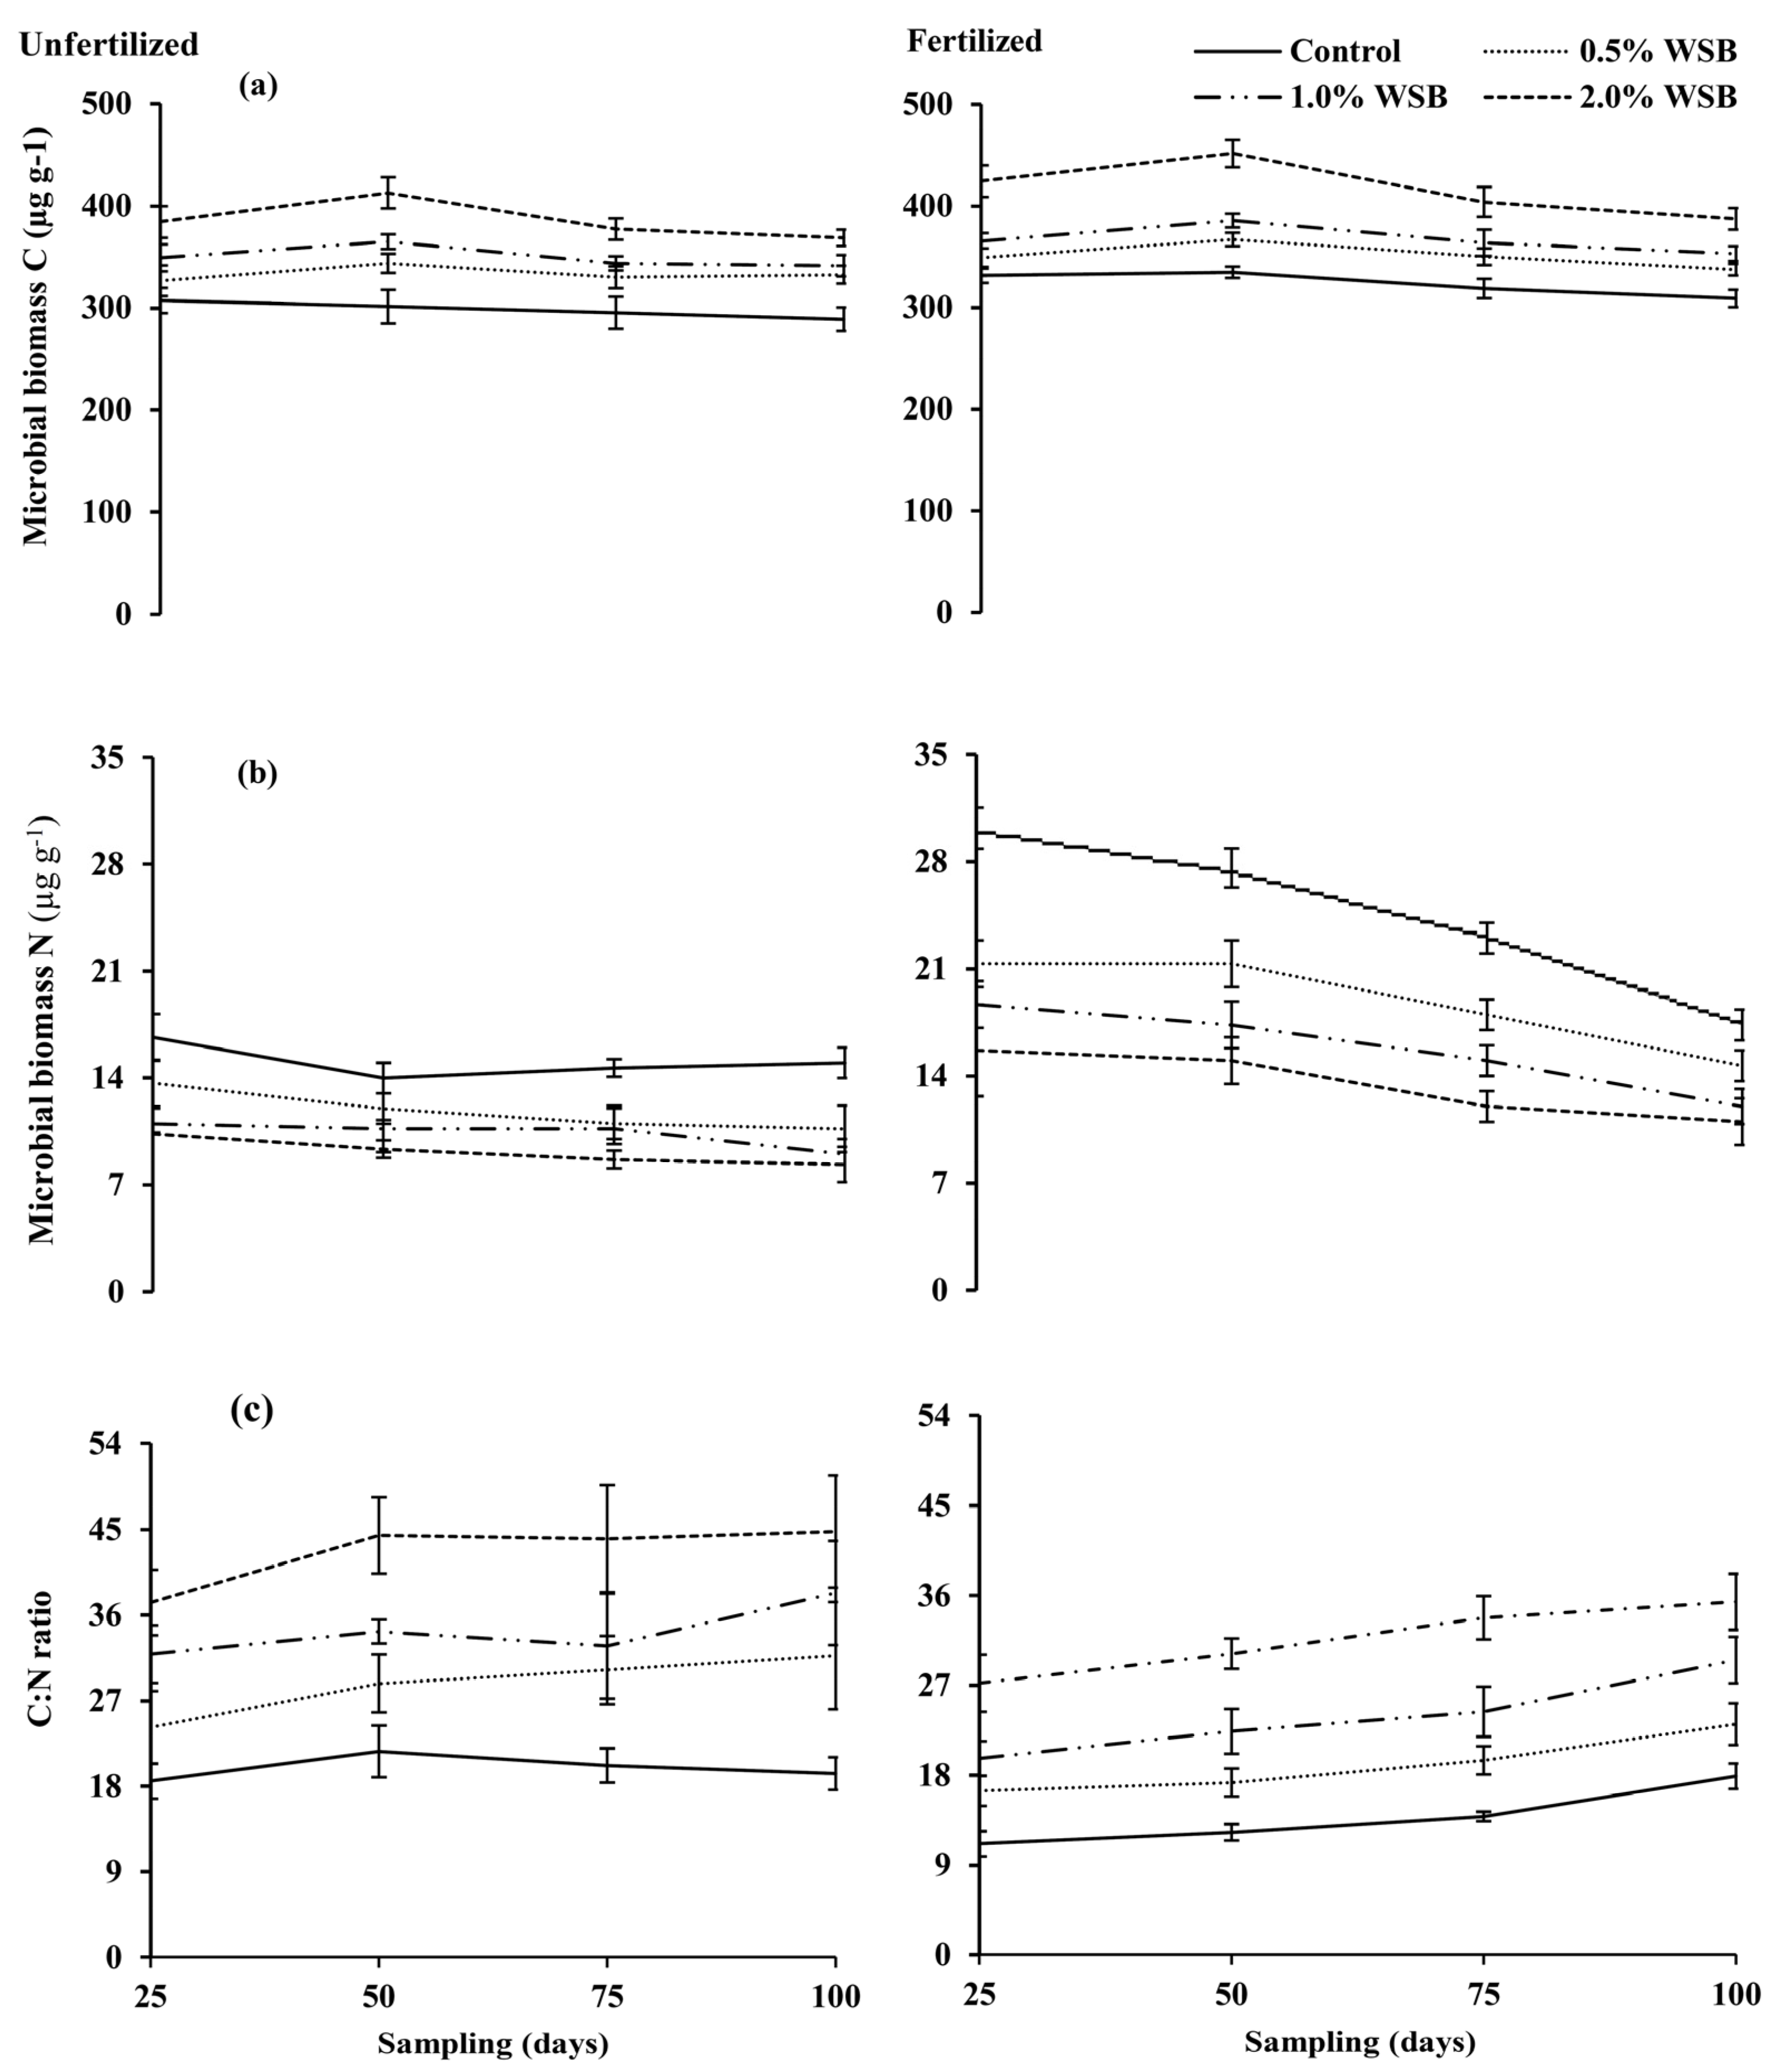
58]. The addition of soil biochar may improve soil microbial biomass and microbial C (Figure 3), which may ultimately improve the organic C status of soils [8]. A significant amount of organic matter is added with biochar, which increases the concentration of organic matter in the soil [59]. A significant improvement in the microbial biomass C in soil was observed with increasing biochar rates up to 50 days during the incubation study; after that, it decreased up to 75 days and then became constant for up to 100 days (Figure 3). The increase in the microbial biomass C was probably due to the labile C fraction present in biochar [60,61,62]. With time, non-significant changes have been reported in microbial biomass C for up to 4 years, which were improved initially with biochar applications. The reason behind this is the recalcitrant nature of biochar, i.e., the resistance of biochar constituents to oxidation [63,64]. The higher organic C status of soils amended with biochar has also been well documented [41,65,66]. This provides a suitable and safe habitat for the growth of soil microorganisms for longer periods [67,68]. In current study, the N and P recovery was improved as a result of the addition of 1% biochar; however, the K recovery was statistically non-significant with the addition of biochar (Figure 4). Biochar increases the availability of essential soil nutrients (such as K, P and dissolved organic matter), adsorbs harmful compounds, improves soil moisture and pH, and ultimately influences soil microbial activity [59,66,69].
After 50 days of the treatments, a significant decrease in the microbial biomass N in the soil was observed with the increasing rates of biochar (Figure 3). Zhang et al. [8] also observed a significant reduction in microbial biomass N and the microbial biomass C:N ratio because of NH4+ adsorption on biochar surfaces. This shows that biochar may initially limit microbial activity in soil at a certain level by slowing down the mineralization of soil organic N [8,70]. Over time, the adsorbed NH4+ is released from the biochar surface and becomes available to plants and microorganisms. This was evident in our incubation study with an increase in soil microbial biomass N after 50 days of incubation (Figure 3). Similar findings have also been reported and link this phenomenon with the nutrient cycling in soil, which results in better crop growth and improved soil fertility status [71].

5. Conclusions

In both the greenhouse experiment and incubation study, the addition of 1.0 and 2.0% biochars produced at a low temperature significantly improved the maize growth and yield by enhancing the nutrient recovery (P and K) from mineral fertilizers in Typic calcargid soil. The biochar increased the soil total N, available P, extractable K, soil organic C and CEC, but a minor decrease was observed in the soil pH. Further, the incubation study confirmed the temporal enhancement in the soil microbial biomass C in biochar-amended Typic calciargid soil. The positive effects of biochar were more prominent with the addition of 1% biochar and were associated with improvements in the soil’s chemical, biological and nutritional properties.

Author Contributions

Conceptualization, M.A., Z.A., M.A.B., S.I., M.K., A.R., L.S.-P. and S.A.M.; Data curation, S.H., M.A.B. and A.A.H.; Formal analysis, M.A., Z.A. and S.M.; Funding acquisition, W.F.A.M. and S.A.M.; Investigation, M.A. and S.M.; Methodology, S.H. and M.S.; Project administration, L.S.-P.; Resources, A.R., W.F.A.M. and A.A.H.; Software, M.A.B. and M.S.; Supervision, M.K.; Validation, S.I.; Visualization, S.H.; Writing—original draft, M.A.; Writing—review and editing, Z.A., S.H., M.A.B., M.S., S.M., S.I., M.K., A.R., W.F.A.M., L.S.-P., S.A.M. and A.A.H. All authors have read and agreed to the published version of the manuscript.

Funding

This work was funded by the Researchers Supporting Project number (RSPD2023R752), King Saud University, Riyadh, Saudi Arabia.

Data Availability Statement

Data will be made available on request to corresponding author.

Acknowledgments

The authors extend their appreciation to the Researchers Supporting Project (RSPD2023R752) King Saud University, Riyadh, Saudi Arabia.

Conflicts of Interest

The authors declare no conflict of interest.

References

  1. Hardy, B.; Sleutel, S.; Dufey, J.E.; Cornelis, J.T. The Long-Term Effect of Biochar on Soil Microbial Abundance, Activity and Community Structure Is Overwritten by Land Management. Front. Environ. Sci. 2019, 7, 110. [Google Scholar] [CrossRef] [Green Version]
  2. Blanco-Canqui, H. Does Biochar Improve All Soil Ecosystem Services? GCB Bioenergy 2021, 13, 291–304. [Google Scholar] [CrossRef]
  3. Kalu, S.; Simojoki, A.; Karhu, K.; Tammeorg, P. Long-Term Effects of Softwood Biochar on Soil Physical Properties, Greenhouse Gas Emissions and Crop Nutrient Uptake in Two Contrasting Boreal Soils. Agric. Ecosyst. Environ. 2021, 316, 107454. [Google Scholar] [CrossRef]
  4. Lévesque, V.; Oelbermann, M.; Ziadi, N. Biochar in Temperate Soils: Opportunities and Challenges. Can. J. Soil Sci. 2020, 102, 1–26. [Google Scholar] [CrossRef]
  5. Liu, L.; Deng, G.; Shi, X. Adsorption Characteristics and Mechanism of P-Nitrophenol by Pine Sawdust Biochar Samples Produced at Different Pyrolysis Temperatures. Sci. Rep. 2020, 10, 5149. [Google Scholar] [CrossRef] [Green Version]
  6. Ajeng, A.A.; Abdullah, R.; Ling, T.C.; Ismail, S.; Lau, B.F.; Ong, H.C.; Chew, K.W.; Show, P.L.; Chang, J.S. Bioformulation of Biochar as a Potential Inoculant Carrier for Sustainable Agriculture. Environ. Technol. Innov. 2020, 20, 101168. [Google Scholar] [CrossRef]
  7. Oloo, K.P.; Asbon, O.P. Depletion of Phosphate Rock Reserves and World Food Crisis: Reality or Hoax? Afr. J. Agric. Res. 2020, 16, 1223–1227. [Google Scholar] [CrossRef]
  8. Zhang, Y.; Wu, L.; Zhang, X.; Deng, A.; Abdulkareem, R.; Wang, D.; Zheng, C.; Zhang, W. Effect of Long-Term Organic Amendment Application on the Vertical Distribution of Nutrients in a Vertisol. Agronomy 2022, 12, 1162. [Google Scholar] [CrossRef]
  9. Saleem, M.; Pervaiz, Z.H.; Contreras, J.; Lindenberger, J.H.; Hupp, B.M.; Chen, D.; Zhang, Q.; Wang, C.; Iqbal, J.; Twigg, P. Cover Crop Diversity Improves Multiple Soil Properties via Altering Root Architectural Traits. Rhizosphere 2020, 16, 100248. [Google Scholar] [CrossRef]
  10. Bonanomi, G.; De Filippis, F.; Zotti, M.; Idbella, M.; Cesarano, G.; Al-Rowaily, S.; Abd-ElGawad, A. Repeated Applications of Organic Amendments Promote Beneficial Microbiota, Improve Soil Fertility and Increase Crop Yield. Appl. Soil Ecol. 2020, 156, 103714. [Google Scholar] [CrossRef]
  11. Huang, H.; Niu, Z.; Shi, R.; Tang, J.; Lv, L.; Wang, J.; Fan, Y. Thermal Oxidation Activation of Hydrochar for Tetracycline Adsorption: The Role of Oxygen Concentration and Temperature. Bioresour. Technol. 2020, 306, 123096. [Google Scholar] [CrossRef] [PubMed]
  12. Ahmed, A.A.; Fawaz, P.Q.; Eupkouk, A.W. Biochar Amended Soils and Crop Productivity Improvement. Environ. Sci. Technol. 2016, 42, 5137–5143. [Google Scholar]
  13. Sohi, S.P.; Krull, E.; Lopez-Capel, E.; Bol, R. A Review of Biochar and Its Use and Function in Soil. Adv. Agron. 2010, 105, 47–82. [Google Scholar] [CrossRef]
  14. Kizito, S.; Luo, H.; Lu, J.; Bah, H.; Dong, R.; Wu, S. Role of Nutrient-Enriched Biochar as a Soil Amendment during Maize Growth: Exploring Practical Alternatives to Recycle Agricultural Residuals and to Reduce Chemical Fertilizer Demand. Sustainability 2019, 11, 3211. [Google Scholar] [CrossRef] [Green Version]
  15. Fanai, L.; David, A.A.; Thomas, T.; Swaroop, N.; Hassan, A.; David, A. Assessment of Potassium and Sulphur on the Soil Properties, Growth and Yield of Onion (Allium cepa L.). Pharma Innov. J. 2021, 10, 2508–2512. [Google Scholar]
  16. Liang, J.; Li, Y.; Si, B.; Wang, Y.; Chen, X.; Wang, X.; Chen, H.; Wang, H.; Zhang, F.; Bai, Y.; et al. Optimizing Biochar Application to Improve Soil Physical and Hydraulic Properties in Saline-Alkali Soils. Sci. Total Environ. 2021, 771, 144802. [Google Scholar] [CrossRef]
  17. DeLuca, T.H.; Gundale, M.J.; MacKenzie, M.D.; Jones, D.L. Biochar Effects on Soil Nutrient Transformations. In Biochar for Environmental Management; Routledge: Oxfordshire, UK, 2015; pp. 453–486. [Google Scholar]
  18. Hailegnaw, N.S.; Mercl, F.; Pračke, K.; Száková, J.; Tlustoš, P. Mutual Relationships of Biochar and Soil PH, CEC, and Exchangeable Base Cations in a Model Laboratory Experiment. J. Soils Sediments 2019, 19, 2405–2416. [Google Scholar] [CrossRef]
  19. Clausing, S.; Polle, A. Mycorrhizal Phosphorus Efficiencies and Microbial Competition Drive Root P Uptake. Front. For. Glob. Chang. 2020, 3, 54. [Google Scholar] [CrossRef]
  20. Rawal, N.; Pande, K.R.; Shrestha, R.; Vista, S.P. Phosphorus and Potassium Mineralization as Affected by Phosphorus Levels and Soil Types under Laboratory Condition. Agrosyst. Geosci. Environ. 2022, 5, e20229. [Google Scholar] [CrossRef]
  21. Hollister, C.C.; Bisogni, J.J.; Lehmann, J. Ammonium, Nitrate, and Phosphate Sorption to and Solute Leaching from Biochars Prepared from Corn Stover (Zea mays L.) and Oak Wood (Quercus spp.). J. Environ. Qual. 2013, 42, 137–144. [Google Scholar] [CrossRef]
  22. Tomczyk, A.; Sokołowska, Z.; Boguta, P. Biochar Physicochemical Properties: Pyrolysis Temperature and Feedstock Kind Effects. Rev. Environ. Sci. Biotechnol. 2020, 19, 191–215. [Google Scholar] [CrossRef] [Green Version]
  23. Huang, H.; Reddy, N.G.; Huang, X.; Chen, P.; Wang, P.; Zhang, Y.; Huang, Y.; Lin, P.; Garg, A. Effects of Pyrolysis Temperature, Feedstock Type and Compaction on Water Retention of Biochar Amended Soil. Sci. Rep. 2021, 11, 7419. [Google Scholar] [CrossRef]
  24. Ippolito, J.A.; Laird, D.A.; Busscher, W.J. Environmental Benefits of Biochar. J. Environ. Qual. 2012, 41, 967–972. [Google Scholar] [CrossRef] [PubMed] [Green Version]
  25. Hagner, M.; Kemppainen, R.; Jauhiainen, L.; Tiilikkala, K.; Setälä, H. The Effects of Birch (Betula spp.) Biochar and Pyrolysis Temperature on Soil Properties and Plant Growth. Soil Tillage Res. 2016, 163, 224–234. [Google Scholar] [CrossRef]
  26. Zhang, X.; Gao, B.; Creamer, A.E.; Cao, C.; Li, Y. Adsorption of VOCs onto Engineered Carbon Materials: A Review. J. Hazard. Mater. 2017, 338, 102–123. [Google Scholar] [CrossRef] [PubMed]
  27. Zhang, H.; Chen, C.; Gray, E.M.; Boyd, S.E. Effect of Feedstock and Pyrolysis Temperature on Properties of Biochar Governing End Use Efficacy. Biomass Bioenergy 2017, 105, 136–146. [Google Scholar] [CrossRef]
  28. Song, D.; Tang, J.; Xi, X.; Zhang, S.; Liang, G.; Zhou, W.; Wang, X. Responses of Soil Nutrients and Microbial Activities to Additions of Maize Straw Biochar and Chemical Fertilization in a Calcareous Soil. Eur. J. Soil Biol. 2018, 84, 1–10. [Google Scholar] [CrossRef]
  29. Kapoor, A.; Sharma, R.; Kumar, A.; Sepehya, S. Biochar as a Means to Improve Soil Fertility and Crop Productivity: A Review. J. Plant Nutr. 2022, 45, 2380–2388. [Google Scholar] [CrossRef]
  30. Khan, Z.; Zhang, K.; Khan, M.N.; Bi, J.; Zhu, K.; Luo, L.; Hu, L. How Biochar Affects Nitrogen Assimilation and Dynamics by Interacting Soil and Plant Enzymatic Activities: Quantitative Assessment of 2 Years Potted Study in a Rapeseed-Soil System. Front. Plant Sci. 2022, 13, 853449. [Google Scholar] [CrossRef]
  31. Sánchez, M.E.; Lindao, E.; Margaleff, D.; Martínez, O.; Morán, A. Pyrolysis of Agricultural Residues from Rape and Sunflowers: Production and Characterization of Bio-Fuels and Biochar Soil Management. J. Anal. Appl. Pyrolysis 2009, 85, 142–144. [Google Scholar] [CrossRef]
  32. Gaskin, J.W.; Steiner, C.; Harris, K.; Das, K.C.; Bibens, B. Effect of Low-Temperature Pyrolysis Conditions on Biochar for Agricultural Use. Trans. ASABE 2008, 51, 2061–2069. [Google Scholar] [CrossRef]
  33. Slattery, W.J.; Ridley, A.M.; Windsor, S.M. Ash Alkalinity of Animal and Plant Products. Aust. J. Exp. Agric. 1991, 31, 321–324. [Google Scholar] [CrossRef]
  34. Wolf, B. A Comprehensive System of Leaf Analyses and Its Use for Diagnosing Crop Nutrient Status. Commun. Soil Sci. Plant Anal. 1982, 13, 1035–1059. [Google Scholar] [CrossRef]
  35. Chapman, H.D.; Pratt, P.F. Methods of Analysis for Soils, Plants and Water; Univ. California: Berkeley, CA, USA, 1961. [Google Scholar]
  36. Gee, G.; Bauder, J. Particle-Size Analysis. In Methods of Soil Analysis, Part 1: Physical and Mineralogical Methods, 2nd ed.; Agronomy Monogram; American Society of Agronomy Madison: Madison, WI, USA, 1986; pp. 383–411. [Google Scholar]
  37. Nelson, D.; Sommers, L.E. Total Carbon, Organic Carbon, and Organic Matter. In Methods of Soil Analysis, Part 2: Chemical and Microbiological Properties; American Society of Agronomy: Madison, WI, USA, 1982; pp. 570–571. [Google Scholar]
  38. Sumner, M.E.; Miller, W.P. Cation Exchange Capacity and Exchange Coefficients. In Methods of Soil Analysis: Part 3 Chemical Methods; American Society of Agronomy: Madison, WI, USA, 2018; pp. 1201–1229. [Google Scholar] [CrossRef] [Green Version]
  39. Richards, L.A. Diagnosis and Improving of Saline and Alkaline Soils. In Agriculture Handbook. 60 US, Salinity Laboratory Staff; US Department of Agriculture: Washington, DC, USA, 1954. [Google Scholar]
  40. Olsen, S.R.; Sommers, L.E. Phosphorus. In Methods of Soil Analysis, Argon No 9, Part 2: Chemical and Microbiological Properties, 2nd ed.; American Society of Agronomy: Madison, WI, USA, 1982; pp. 403–430. [Google Scholar]
  41. Ladd, J.N.; Amato, M. Relationship between Microbial Biomass Carbon in Soils and Absorbance (260 nm) of Extracts of Fumigated Soils. Soil Biol. Biochem. 1989, 21, 457–459. [Google Scholar] [CrossRef]
  42. Wu, J.; Joergensen, R.G.; Pommerening, B.; Chaussod, R.; Brookes, P.C. Measurement of Soil Microbial Biomass C by Fumigation-Extraction-an Automated Procedure. Soil Biol. Biochem. 1990, 22, 1167–1169. [Google Scholar] [CrossRef]
  43. Joergensen, R.G.; Brookes, P.C. Ninhydrin-Reactive Nitrogen Measurements of Microbial Biomass in 0.5 m K2SO4 Soil Extracts. Soil Biol. Biochem. 1990, 22, 1023–1027. [Google Scholar] [CrossRef]
  44. Sparlig, G.P.; Gupta, V.V.S.R.; Zhu, C. Release of Ninhydrin-Reactive Compounds during Fumigation of Soil to Estimate Microbial C and N. Soil Biol. Biochem. 1993, 25, 1803–1805. [Google Scholar] [CrossRef]
  45. Chatterjee, A.; Lal, R.; Wielopolski, L.; Martin, M.Z.; Ebinger, M.H. Evaluation of different soil carbon determination methods. Crit. Rev. Plant Sci. 2009, 28, 164–178. [Google Scholar] [CrossRef]
  46. Jackson, M.L. Soil Chemical Analysis. J. Agric. Food Chem. 1960, 7, 138. [Google Scholar] [CrossRef]
  47. Mengel, K.; Kirkby, E.A. Principles of Plant Nutrition, 5th ed.; Kluwer: Dordrecht, The Netherlands, 2001. [Google Scholar]
  48. Keiluweit, M.; Nico, P.S.; Johnson, M.; Kleber, M. Dynamic Molecular Structure of Plant Biomass-Derived Black Carbon (Biochar). Environ. Sci. Technol. 2010, 44, 1247–1253. [Google Scholar] [CrossRef] [Green Version]
  49. Naeem, M.A.; Khalid, M.; Ahmad, Z.; Naveed, M. Low Pyrolysis Temperature Biochar Improves Growth and Nutrient Availability of Maize on Typic Calciargid. Commun. Soil Sci. Plant Anal. 2016, 47, 41–51. [Google Scholar] [CrossRef]
  50. Shaaban, A.; Se, S.M.; Mitan, N.M.M.; Dimin, M.F. Characterization of Biochar Derived from Rubber Wood Sawdust through Slow Pyrolysis on Surface Porosities and Functional Groups. Proc. Procedia Eng. 2013, 68, 365–371. [Google Scholar] [CrossRef] [Green Version]
  51. Liu, X.H.; Han, F.P.; Zhang, X.C. Effect of Biochar on Soil Aggregates in the Loess Plateau: Results from Incubation Experiments. Int. J. Agric. Biol. 2012, 14, 975–979. [Google Scholar]
  52. Domingues, R.R.; Sánchez-Monedero, M.A.; Spokas, K.A.; Melo, L.C.A.; Trugilho, P.F.; Valenciano, M.N.; Silva, C.A. Enhancing Cation Exchange Capacity Ofweathered Soils Using Biochar: Feedstock, Pyrolysis Conditions and Addition Rate. Agronomy 2020, 10, 824. [Google Scholar] [CrossRef]
  53. Kharel, G.; Sacko, O.; Feng, X.; Morris, J.R.; Phillips, C.L.; Trippe, K.; Kumar, S.; Lee, J.W. Biochar Surface Oxygenation by Ozonization for Super High Cation Exchange Capacity. ACS Sustain. Chem. Eng. 2019, 7, 16410–16418. [Google Scholar] [CrossRef]
  54. Sharma, P.; Abrol, V.; Sharma, V.; Chaddha, S.; Srinivasa Rao, C.; Ganie, A.Q.; Ingo Hefft, D.; El-Sheikh, M.A.; Mansoor, S. Effectiveness of Biochar and Compost on Improving Soil Hydro-Physical Properties, Crop Yield and Monetary Returns in Inceptisol Subtropics. Saudi J. Biol. Sci. 2021, 28, 7539–7549. [Google Scholar] [CrossRef] [PubMed]
  55. Mwadalu, R.; Mochoge, B.; Danga, B. Assessing the Potential of Biochar for Improving Soil Physical Properties and Tree Growth. Int. J. Agron. 2021, 2021, 6000184. [Google Scholar] [CrossRef]
  56. Liu, X.-H.; Zhang, X.-C. Effect of Biochar on PH of Alkaline Soils in the Loess Plateau: Results from Incubation Experiments. Int. J. Agric. Biol. 2012, 14, 65–70. [Google Scholar]
  57. Spokas, K.A. Review of the Stability of Biochar in Soils: Predictability of O:C Molar Ratios. Carbon Manag. 2010, 1, 289–303. [Google Scholar] [CrossRef] [Green Version]
  58. Bai, S.H.; Omidvar, N.; Gallart, M.; Kämper, W.; Tahmasbian, I.; Farrar, M.B.; Singh, K.; Zhou, G.; Muqadass, B.; Xu, C.Y.; et al. Combined Effects of Biochar and Fertilizer Applications on Yield: A Review and Meta-Analysis. Sci. Total Environ. 2022, 808, 152073. [Google Scholar] [CrossRef]
  59. Datta, R.; Sahoo, K.; Rahman, M.M.; Hafeez, A.; Pan, T.; Tian, J.; Cai, K. Modified Biochars and Their Effects on Soil Quality: A Review. Environments 2022, 9, 60. [Google Scholar] [CrossRef]
  60. Ameloot, N.; Graber, E.R.; Verheijen, F.G.A.; De Neve, S. Interactions between Biochar Stability and Soil Organisms: Review and Research Needs. Eur. J. Soil Sci. 2013, 64, 379–390. [Google Scholar] [CrossRef]
  61. Singh, B.P.; Cowie, A.L. Long-Term Influence of Biochar on Native Organic Carbon Mineralisation in a Low-Carbon Clayey Soil. Sci. Rep. 2014, 4, 3687. [Google Scholar] [CrossRef] [PubMed] [Green Version]
  62. Gasim, M.F.; Choong, Z.Y.; Koo, P.L.; Low, S.C.; Abdurahman, M.H.; Ho, Y.C.; Mohamad, M.; Suryawan, I.W.K.; Lim, J.W.; Oh, W. Da Application of Biochar as Functional Material for Remediation of Organic Pollutants in Water: An Overview. Catalysts 2022, 12, 210. [Google Scholar] [CrossRef]
  63. Aon, M.; Khalid, M.; Naeem, M.A.; Zafar-ul-Hye, M.; Hussain, S.; Hussain, M.; Aslam, Z. Peanut-Waste Biochar and Buffalo Manure Decreased Nitrogen and Phosphorus Requirement of Maize Grown in an Alkaline Calcareous Soil. Int. J. Agric. Biol. 2018, 20, 2661–2668. [Google Scholar]
  64. Zafar-Ul-hye, M.; Wasim, M.M.; Munir, T.M.; Aon, M.; Shaaban, M.; Abbas, M.; Hussain, M.; Ahmad, M. Co-Application of Sugarcane Bagasse Biochar, Farmyard Manure and Mineral Nitrogen Improved Growth Indices of Corn Grown in Alkaline Calcareous Soil. J. Plant Nutr. 2020, 43, 1293–1305. [Google Scholar] [CrossRef]
  65. Wang, Y.; Ren, Q.; Li, T.; Zhan, W.; Zheng, K.; Liu, Y.; Chen, R. Influences of Modified Biochar on Metal Bioavailability, Metal Uptake by Wheat Seedlings (Triticum aestivum L.) and the Soil Bacterial Community. Ecotoxicol. Environ. Saf. 2021, 220, 112370. [Google Scholar] [CrossRef]
  66. Lehmann, J.; Rillig, M.C.; Thies, J.; Masiello, C.A.; Hockaday, W.C.; Crowley, D. Biochar Effects on Soil Biota—A Review. Soil Biol. Biochem. 2011, 43, 1812–1836. [Google Scholar] [CrossRef]
  67. Wang, Z.; Guo, H.; Shen, F.; Yang, G.; Zhang, Y.; Zeng, Y.; Wang, L.; Xiao, H.; Deng, S. Biochar Produced from Oak Sawdust by Lanthanum (La)-Involved Pyrolysis for Adsorption of Ammonium (NH4+), Nitrate (NO3), and Phosphate (PO43−). Chemosphere 2015, 119, 646–653. [Google Scholar] [CrossRef]
  68. Kocsis, T.; Ringer, M.; Biró, B. Characteristics and Applications of Biochar in Soil–Plant Systems: A Short Review of Benefits and Potential Drawbacks. Appl. Sci. 2022, 12, 4051. [Google Scholar] [CrossRef]
  69. Adebajo, S.O.; Oluwatobi, F.; Akintokun, P.O.; Ojo, A.E.; Akintokun, A.K.; Gbodope, I.S. Impacts of Rice-Husk Biochar on Soil Microbial Biomass and Agronomic Performances of Tomato (Solanum lycopersicum L.). Sci. Rep. 2022, 12, 1787. [Google Scholar] [CrossRef] [PubMed]
  70. Dempster, D.N.; Gleeson, D.B.; Solaiman, Z.M.; Jones, D.L.; Murphy, D.V. Decreased Soil Microbial Biomass and Nitrogen Mineralisation with Eucalyptus Biochar Addition to a Coarse Textured Soil. Plant Soil 2012, 354, 311–324. [Google Scholar] [CrossRef]
  71. Zhang, Q.Z.; Dijkstra, F.A.; Liu, X.R.; Wang, Y.D.; Huang, J.; Lu, N. Effects of Biochar on Soil Microbial Biomass after Four Years of Consecutive Application in the North China Plain. PLoS ONE 2014, 9, e102062. [Google Scholar] [CrossRef] [PubMed] [Green Version]
Figure 1. Temporal variation in soil pH, CEC and total organic C at different biochar rates under fertilized and unfertilized conditions. Wheat straw biochar (WSB) was added at 0.0 (control), 0.5, 1 and 2% of dry weight of soil on w/w basis. Standard deviations are shown as error bars (n = 3). Whereas, the figures indicates (a); variations in soil pH (b); variations in CEC, and (c) total organic carbon.
Sustainability 15 09488 g001
Figure 2. Temporal variation in nutritional characteristics of soil at different biochar rates under fertilized and unfertilized conditions. Wheat straw biochar (WSB) was added at 0.0 (control), 0.5, 1 and 2% of dry weight of soil on w/w basis. Standard deviations are shown as error bars (n = 3). Whereas, the figures shows (a) total nitrogen; (b) soil available P; and (c) soil extractable K.
Sustainability 15 09488 g002
Figure 3. Temporal variation in biological characteristics of soil at different biochar rates under fertilized and unfertilized conditions. Wheat straw biochar (WSB) was added at 0.0 (control), 0.5, 1 and 2% of dry weight of soil on w/w basis. Standard deviations are shown as error bars (n = 3). Whereas the figures indicates the (a) microbial biomass C; (b) microbial biomass N; and (c) C:N ratio.
Sustainability 15 09488 g003
Figure 4. Response of wheat straw biochar (biochar) on the recovery of nutrients (K, P and N) from mineral fertilizers. According to the Tukey–HSD test, the significance between treatments is represented through different letters. In case of K recovery, treatment differences were found to be non-significant. The figure indicate (a) potassium recovery; (b)phosphorus recovery; and (c) nitrogen recovery.
Sustainability 15 09488 g004
Table 1. Characterization of biochar produced at 350 °C in a muffle furnace.
PropertiesUnitValue
Physical/Chemical Characteristics
Ash Content%11.53
Water content%03.12
Conversion efficiency%57.28
CECcmolc kg−156.34
Electrical Conductivity (1:20)dS m−101.27
pH (1:20)07.56
Nutritional/Elemental characteristic
Carbon (C)%57.54
Hydrogen (H)%04.37
Oxygen (O)%25.27
Nitrogen (N)%01.29
Sulfur (S)g kg−104.05
Phosphorus (P)g kg−101.98
Potassium (K)g kg−110.17
Magnesium (Mg)g kg−104.74
Calcium (Ca)g kg−103.53
Iron (Fe)mg kg−189.60
Zinc (Zn)mg kg−143.76
Manganese (Mn)mg kg−161.50
Elemental ratio characteristic
C:N44.6
C:P291
C:S142
Molar ratios characteristic
H:C0.91
O:C0.33
(O+N):C0.35
Values are means of three replications (n = 3).
Table 2. Effect of wheat straw biochar and NPK fertilizer on physiological characteristics of maize at maximum vegetative growth stage.
Biochar RatesFertilizer Dose
0% RFD *100% RFD0% RFD100% RFD
Photosynthetic Rate (µmol m−2 s−1)Water Use Efficiency (mmol CO2 mol−1 H2O)
Control11.67 ± 1.45 f19.33 ± 0.88 cd3.32 ± 0.13 d5.63 ± 0.10 b
0.5%13.67 ± 0.88 ef22.67 ± 1.45 bc3.70 ± 0.13 c5.70 ± 0.09 b
1.0%14.67 ± 0.88 ef27.00 ± 1.15 a3.95 ± 0.12 c6.30 ± 0.16 a
2.0%15.66 ± 0.88 de25.67 ± 1.45 ab3.99 ± 0.12 c5.90 ± 0.13 b
Stomatal conductance (mmol m−2 s−1)Vapour pressure deficit (KPa)
Control133.67 ± 5.82 e207.33 ± 7.36 c4.59 ± 0.25 a3.06 ± 0.12 c
0.5%143.67 ± 5.21 e228.67 ± 4.92 b4.03 ± 0.11 b2.88 ± 0.06 cd
1.0%163.67 ± 5.05 d248.00 ± 4.59 a3.76 ± 0.19 b2.42 ± 0.11 e
2.0%172.33 ± 6.77 d240.00 ± 3.79 ab3.74 ± 0.12 b2.62 ± 0.07 de
* Recommended fertilizer rate, i.e., 225, 160 and 110 kg ha−1 of N, P and K, respectively. All values are means of the three replications ± standard deviation (n = 3). According to the Tukey–HSD test, the significance between treatments is represented through different letters in each column at p ≤ 0.05.
Table 3. Effect of wheat straw biochar and NPK fertilizer on agronomical traits of maize.
Biochar RatesFertilizer Dose
0% RFD *100% RFD0% RFD100% RFD
Grain Yield in g pot−1Stover Yield in g pot−1
Control22.3 ± 5.67 d078.9 ± 7.13 c078.9 ± 7.13 c152.7 ± 9.33 a
0.5%22.3 ± 3.53 d097.8 ± 5.83 bc097.8 ± 5.83 bc157.4 ± 6.56 a
1.0%31.3 ± 4.33 cd107.4 ± 5.97 b107.4 ± 5.97 b156.6 ± 7.02 a
2.0%35.0 ± 2.31 c114.4 ± 2.95 a114.4 ± 2.95 b159.9 ± 4.58 a
Dry biomass yield in g pot−1Root dry weight in g pot−1
Control101.3 ± 9.47 e205.7 ± 6.88 b15.4 ± 2.63 d50.5 ± 1.69 b
0.5%120.2 ± 3.31 d219.4 ± 6.39 ab20.7 ± 2.82 d53.2 ± 2.36 b
1.0%138.8 ± 6.21 c235.9 ± 4.12 a24.3 ± 3.49 cd63.5 ± 4.12 a
2.0%149.4 ± 5.16 c231.9 ± 4.40 a31.2 ± 1.37 c63.0 ± 6.38 a
* Recommended fertilizer rate, i.e., 225, 160 and 110 kg ha−1 of N, P and K, respectively. All values are means of the three replications ± standard deviation (n = 3). According to the Tukey–HSD test, the significance between treatments is represented through different letters in each column at p ≤ 0.05.
Table 4. Effect of wheat straw biochar and NPK fertilizer on nutrient concentration of maize.
Biochar RatesFertilizer Dose
0% RFD *100% RFD0% RFD100% RFD
Nitrogen Concentration in Grain (%)Nitrogen Concentration in Stover (%)
Control0.55 ± 0.02 d1.25 ± 0.06 b0.13 ± 0.02 d0.36 ± 0.03 a
0.5%0.62 ± 0.06 d1.24 ± 0.02 b0.17 ± 0.02 cd0.38 ± 0.03 a
1.0%0.77 ± 0.03 c1.47 ± 0.02 a0.24 ± 0.03 bc0.43 ± 0.02 a
2.0%0.77 ± 0.02 c1.37 ± 0.04 a0.27 ± 0.02 b0.42 ± 0.03 a
Phosphorus concentration in grain (g kg−1)Phosphorus concentration in stover (g kg−1)
Control1.63 ± 0.06 c3.46 ± 0.05 b0.63 ± 0.06 f1.16 ± 0.05 c
0.5%1.77 ± 0.05 c3.61 ± 0.04 b0.72 ± 0.05 e1.21 ± 0.05 b
1.0%1.85 ± 0.05 c4.83 ± 0.04 a0.78 ± 0.05 e1.43 ± 0.09 a
2.0%1.65 ± 0.27 c4.65 ± 0.04 a0.98 ± 0.07 d1.25 ± 0.11 b
Potassium concentration in grain (%)Potassium concentration in stover (%)
Control3.60 ± 0.06 d4.63 ± 0.05 bc4.28 ± 0.06 e5.46 ± 0.05 c
0.5%3.69 ± 0.05 d5.30 ± 0.04 ab4.83 ± 0.05 d6.05 ± 0.04 b
1.0%4.29 ± 0.05 cd5.79 ± 0.04 a5.17 ± 0.05 cd6.51 ± 0.04 a
2.0%4.33 ± 0.07 cd5.29 ± 0.04 ab4.99 ± 0.07 d6.26 ± 0.04 ab
* Recommended fertilizer rate, i.e., 225, 160 and 110 kg ha−1 for N, P and K, respectively. All values are means of the three replications ± standard deviation (n = 3). According to the Tukey–HSD test, the significance between treatments is represented through different letters in each column at p ≤ 0.05.
Table 5. Effect of wheat straw biochar and NPK fertilizer on nutrient uptake in maize grain and stover.
Biochar RatesFertilizer Dose
0% RFD *100% RFD0% RFD100% RFD
Nitrogen Uptake in Grain (g pot−1)Nitrogen Uptake in Stover (g pot−1)
Control0.13 ± 0.035 e0.66 ± 0.045 c0.11 ± 0.025 c0.560 ± 0.073 a
0.5%0.14 ± 0.029 e0.76 ± 0.034 c0.17 ± 0.026 bc0.599 ± 0.061 a
1.0%0.24 ± 0.042 de1.17 ± 0.047 a0.26 ± 0.019 bc0.673 ± 0.048 a
2.0%0.27 ± 0.013 d0.99 ± 0.063 b0.30 ± 0.010 b0.674 ± 0.070 a
Phosphorus uptake in grain (mg pot−1)Phosphorus uptake in stover (mg pot−1)
Control036.52 ± 09.55 f183.83 ± 11.87 d048.92 ± 00.74 f222.52 ± 06.33 c
0.5%039.27 ± 05.07 f223.92 ± 09.31 c076.25 ± 09.27 e253.79 ± 15.27 b
1.0%058.15 ± 08.62 e383.30 ± 19.47 a090.77 ± 01.15 de286.61 ± 14.13 a
2.0%056.63 ± 06.62 e334.85 ± 12.82 b112.82 ± 11.23 d264.23 ± 08.54 ab
Potassium uptake in grain (g pot−1)Potassium uptake in stover (g pot−1)
Control0.082 ± 0.025 e0.245 ± 0.013 c0.341 ± 0.05 d0.84 ± 0.084 b
0.5%0.083 ± 0.015 e0.328 ± 0.009 b0.471 ± 0.17 cd0.95 ± 0.053 ab
1.0%0.136 ± 0.026 de0.460 ± 0.031 a0.553 ± 0.21 c0.10 ± 0.070 a
2.0%0.153 ± 0.021 d0.380 ± 0.011 b0.570 ± 0.20 c1.00 ± 0.032 a
* Recommended fertilizer rate, i.e., 225, 160 and 110 kg ha−1 for N, P and K, respectively. All values are means of the three replications ± standard deviation (n = 3). According to the Tukey–HSD test, the significance between treatments is represented through different letters in each column at p ≤ 0.05.
Table 6. Effect of wheat straw biochar and fertilizer rates on soil chemical properties after maize harvesting.
Biochar RatesFertilizer Dose
0% RFD *100% RFD0% RFD100% RFD
Soil EC (dS m−1)Soil pH
Control1.24 ± 0.07 f1.38 ± 0.04 e7.92 ± 0.03 a7.91 ± 0.02 ab
0.5%1.55 ± 0.06 d1.66 ± 0.07 cd7.85 ± 0.01 cd7.87 ± 0.01 bc
1.0%1.73 ± 0.04 c1.92 ± 0.03 ab7.81 ± 0.01 d7.81 ± 0.01 cd
2.0%1.88 ± 0.04 b2.05 ± 0.04 a7.80 ± 0.01 d7.81 ± 0.01 cd
Soil CEC (cmolc kg−1)Total soil organic C (g kg−1)
Control16.37 ± 0.62 e15.30 ± 1.03e3.97 ± 0.14 d3.94 ± 0.15 d
0.5%20.57 ± 0.54 d21.60 ± 1.05 cd5.26 ± 0.32 c5.27 ± 0.26 c
1.0%23.40 ± 0.51 c25.50 ± 0.44 b7.17 ± 0.30 b7.23 ± 0.23 b
2.0%26.97 ± 0.75 ab28.40 ± 0.53 a8.80 ± 0.24 a8.91 ± 0.12 a
* Recommended fertilizer rate, i.e., 225, 160 and 110 kg ha−1 of N, P and K, respectively. All values are means of the three replications ± standard deviation (n = 3). According to the Tukey–HSD test, the significance between treatments is represented through different letters in each column at p ≤ 0.05.
Table 7. Effect of different fertilizer rates and wheat straw biochar on soil nutritional properties after maize harvesting.
Biochar Rates0% RFD *100% RFD
Soil N (mg pot−1)
Control0.060 ± 0.0009 d0.060 ± 0.0006 d
0.5%0.061 ± 0.0009 d0.065 ± 0.0006 c
1.0%0.064 ± 0.0006 c0.069 ± 0.0010 b
2.0%0.066 ± 0.0006 c0.074 ± 0.0009 a
Available soil P (mg kg−1)
Control7.55 ± 0.3 f8.15 ± 0.11 e
0.5%8.25 ± 0.1 de8.57 ± 0.10 cd
1.0%8.72 ± 0.1 bc9.03 ± 0.11 ab
2.0%9.02 ± 0.1 ab9.27 ± 0.10 a
Extractable soil K (mg kg−1)
Control111.60 ± 05.06 e109.71 ± 04.03 e
0.5%143.56 ± 04.82 d163.89 ± 06.37 c
1.0%165.62 ± 04.38 c188.60 ± 05.18 b
2.0%174.15 ± 05.97 bc206.97 ± 05.40 a
* Recommended fertilizer rate, i.e., 225, 160 and 110 kg ha−1 of N, P and K, respectively. All values are means of the three replications ± standard deviation (n = 3). According to the Tukey–HSD test, the significance between treatments is represented through different letters in each column at p ≤ 0.05.
Disclaimer/Publisher’s Note: The statements, opinions and data contained in all publications are solely those of the individual author(s) and contributor(s) and not of MDPI and/or the editor(s). MDPI and/or the editor(s) disclaim responsibility for any injury to people or property resulting from any ideas, methods, instructions or products referred to in the content.

