
Analysis of the Coordination Effects and Influencing Factors of Transportation and Tourism Development in Shaanxi Region
College of Design and Art, Shaanxi University of Science and Technology, Xi’an 710021, China
*
Author to whom correspondence should be addressed.
Sustainability 2023, 15(12), 9496; https://0-doi-org.brum.beds.ac.uk/10.3390/su15129496
Submission received: 8 May 2023
/
Revised: 7 June 2023
/
Accepted: 12 June 2023
/
Published: 13 June 2023
(This article belongs to the Special Issue Security, Tourism and Sustainability)
Abstract
:With the accelerated growth of global tourism and the increasing availability of transport, the coordination and interaction between the tourism economy and transport have become a topic of great interest. This study seeks to analyse the coordination effects and influencing factors of Shaanxi’s tourism economy and transportation, thereby contributing to the sustainable development of the region’s tourism economy. To achieve this, we develop a tourism economy–transportation evaluation index system and employ the system coupled with the coordination model and entropy method to conduct a thorough analysis. The research spans over the years 2003–2021. According to the findings of this study, the integration and coordination of tourism economy–transportation and tourism development in Shaanxi are exhibiting an upward development trend. Over the years, the degree of coupling coordination has progressed through the stages of uncoordinated development, transformational development, and coordinated development, with the recent epidemic upheaval resulting in a primary level of coordination. In addition, the transport system has a significant impact on the coupled and coordinated development of the tourism economy–, with the size of the transport base and transport efficiency serving as the driving factors and transport pressure and epidemic shocks serving as significant influencing factors. Due to the fluctuations of the global pandemic, the coordination of the tourism system declines sharply in 2020, but recovers in 2021 as the pandemic progressively stabilises. Through this study, we can gain a better understanding of the relationship between the tourism economy and transport in Shaanxi and devise strategies and policies to support the development of sustainable transport and tourism systems.
1. Introduction
Shaanxi, located in the northwestern region of China (Figure 1), is renowned for its cultural heritage and several tourist attractions. As one of the cradles of ancient Chinese civilization, it has a rich history and culture that attracts tourists from around the globe [1]. Shaanxi’s tourism industry has developed rapidly in recent years, with tourism revenues increasing from less than 200 billion yuan in 2012 to nearly 600 billion yuan in 2018, a 3.5-fold increase in seven years and an average annual compound growth rate of 23.21%, making it a significant economic contributor to the region. Nevertheless, tourism cannot exist in a vacuum, and transport plays a crucial role in supporting and promoting tourism development [2]. The region’s attractions must be readily and efficiently accessible by means of a dependable transport system [3]. Similarly, tourism can fuel the development of transport infrastructure as the transport network expands to accommodate travellers’ requirements [4].
Despite the significance of transport in tourism, there is a dearth of research on the coordinating function and influencing factors between transport and tourism development in Shaanxi. Existing research tends to concentrate on particular aspects of this relationship, such as the impact of transport on tourism demand or the development of transport infrastructure to support tourism [5]. In order to comprehend the interactions and effects of the two sectors, a more thorough examination of the relationship between transport and tourism in Shaanxi is required. This paper seeks to address this deficiency in the literature by providing an exhaustive analysis of the coordination effects and influencing factors between transport and tourism development in Shaanxi. This study will specifically examine how transport and tourism can be effectively integrated to promote sustainable tourism development in Shaanxi.
2. Literature Review
2.1. A Review of Typical Opinion Studies
Coordination of transport and tourist development has garnered increasing attention from scholars and practitioners in recent years. Tourism and transit infrastructure development are seen as significant drivers of economic growth, especially in developing nations. Hence, it is critical to investigate the link between transport and tourist growth, as well as the elements that influence their coordination.
Numerous Chinese and international scholars have made significant contributions to this field. In China, for instance, Professor Cheng Yu from the School of Business Administration of the East China Normal University conducted a comprehensive study on the coordination of transport and tourism development in his article titled “The impact of internet development on the efficiency of tourism economic growth—empirical evidence from China”. He emphasises the need for a systematic approach to planning and administration to ensure effective coordination between the development of transport and tourism [6]. Other notable Chinese scholars in this field include Ma Xuefeng from the School of Public Administration and Human Geography of the Hunan University of Technology and Business and Tan Jiaxin from the School of Tourism of the Hunan Normal University. In their article ‘The impact of transport accessibility on the resilience of tourism environmental systems and spatial spillover effects in the western Hunan region’, they note that improved transport accessibility has a direct impact on the resilience of the spatial spillover effect and that the economic and social environment system’s resilience is positive and contributes to the environment system’s overall resilience [7].
A number of academicians at the international level have also examined the relationship between transport and tourism development. Christopher J. Hayes, for instance, has emphasised the importance of developing sustainable tourism and transport systems that meet the needs of tourists and local communities [8]. Other notable academics in the field include Professor Pavlos Krassakis of the Harokopio University of Athens, who has accentuated the significance of developing effective transport networks to support tourism development [9].
Scholars in the field generally concur, from a fundamental perspective, that the coordination of transport and tourism development is essential for the sustainable development of tourism. They also acknowledge that a number of factors, including government policy, transport infrastructure, tourism demand, and the participation of local communities, influence such coordination. To ensure effective coordination of transport and tourism development, researchers and practitioners have emphasised the need for an all-encompassing planning and management approach.
Nevertheless, the existing research literature has a few flaws. First, empirical research on the coordination of transport and tourism development in specific regions or destinations is lacking. Second, majority of studies have focused on the economic impacts of transport and tourism development, while the social and environmental impacts have received less attention. Lastly, additional research is required to determine the creation of effective policies and strategies that will facilitate the coordination of transport and tourism development.
2.2. Overview of the Interrelationship of Influencing Factors
Examining the coordination of transport and tourism development reveals a strong relationship and interaction between the influencing factors. These factors include government policy, transportation infrastructure, demand for tourism, and the participation of local communities. The degree of coordination between transportation and tourism development is determined by their mutual interaction.
This is evident from Figure 2’s depiction of the impact relationship between transport and tourism coordination.
First, government policy is crucial to the relationship between transport and tourism development. Transport and tourism can be developed simultaneously through the implementation of government policies and plans. For instance, when planning for tourism development, governments can consider constructing and enhancing transport infrastructure to meet tourism demand and enhance accessibility. Similarly, governments develop appropriate transport strategies to guarantee the seamless operation of tourism activities [10] in order to ensure that transport networks are well-developed and functional. Transport and tourism development require sound direction and support from government policies in order to develop in a coordinated manner.
Second, the coordination of transport and tourism development is significantly influenced by the transport infrastructure. Good transport infrastructure can provide convenient access to tourist destinations. For instance, the construction and enhancement of transport modes and facilities, such as highways, railroads, and airlines, can enhance tourism accessibility, attract more tourists, and promote tourism. Simultaneously, the development of transport infrastructure can increase access to local communities and enhance the quality of life for locals [11]. Therefore, one of the most essential factors for attaining coherence between transport and tourism development is the investment and development of infrastructure that is responsive to tourism demand.
Another essential factor influencing the coordination of transport and tourism development is tourism demand. The expansion and alteration of tourism demand impose new demands on the transport system. With the development of tourism, for instance, the increase in tourism demand may cause traffic congestion and capacity constraints. Understanding and addressing the transport requirements of visitors, as well as providing a variety of transport options and services, are crucial to attaining coherence between transport development and tourism [12]. Coordination of transport and tourism development depends on the participation and cooperation of local communities who are a vital component of tourism destinations. Understanding the requirements and concerns of local communities through close cooperation and communication can lead to consensus, reduce conflict, and promote coordinated development in transport and tourism [13].
Government policy, transport infrastructure, tourism demand, and the participation of local communities are significant determinants of the coordination between transport and tourism development. They have an interdependent relationship and mutual influence. Sustainable transport and tourism development can only be reached through the integrated consideration and coordination of these factors, thereby contributing to economic and social development. Future research should therefore investigate these factors’ interrelationships and ties in greater depth and propose policies and strategies to facilitate the coordination of transport and tourism development.
2.3. Review of the Literature Search Studies
This paper examines Shaanxi’s “Tourism Economy-Transport and Tourism Development Coordination Effect and Influencing Factors”. The purpose of this study was to identify the existing literature on this topic and analyse its main findings and themes. CNKI and PubMed were the two primary databases used for the literature search. Figure 3 depicts a comprehensive analysis of the relevant literature.
The literature search was conducted in both the CNKI and PubMed databases with the key phrase “transport and tourism development”. Over 900 CNKI chapters and 170 PubMed chapters were searched.
Themes and results of a search: Through a search of the China Knowledge Network and PubMed databases using “transportation and tourism development” as the query, nearly 900 and 170 articles spanning research on the relationship between the transportation and tourism disciplines were discovered. Among them, the results of a search on China Knowledge Network indicate that the number of studies in the fields of transport and tourism has increased steadily over the past few years, covering topics, such as tourism transport planning, the impact of transport on tourism development, the demand of tourism for transport, the coordinated development of the transport and tourism industries and the environmental effects of travel and transportation.
Review of relevant literature: Transport planning, tourism development, the impact of transport on tourism, tourism’s demand for transport, the coordinated development of transport and the tourism industry, tourism and physical health, and tourism and the environment can be summarised through a review of the relevant literature based on the search results. The impact of transport on tourism and tourism’s demand for transport reflect the interaction between the two fields of transport and tourism. The coordinated development of transport and tourism industry is also concerned with the integrated development of transport and tourism industry, and tourism and physical health are also important aspects in the study of the interrelationship between the two fields of transport and tourism and in understanding the effects of tourism on human health and the environment.
Searching Finale: The search results indicate that there are an increasing number of studies in both the transport and tourism sectors, reflecting society’s interest in the interrelationship between the two fields. Important research directions include transport planning, tourism development, the impact of transport on tourism, tourism’s demand for transport, the coordinated development of transport and the tourism industry, tourism and physical health, and tourism and the environment. In future research, these aspects of the interrelationship between transport and tourism can be investigated in depth, as can the development of integration between the disciplines of transport and tourism.
3. Data and Methodology
3.1. Overview of the Research Methodology
With the research theme ‘Analysis of the coordination effects and influencing factors of transport and tourism development in Shaanxi Province,’ this paper can fill some of the gaps in existing research by conducting an empirical investigation of the relationship between transport and tourism development in the Shaanxi Province. Specifically, it will investigate the factors that influence the coordination of transport and tourism development in the Shaanxi Province and identify strategies and policies that can support the development of a sustainable transport and tourism system in the region.
To achieve the research objectives, a mixed-methods approach will be utilised, incorporating qualitative and quantitative research techniques. The research design will consist of the following elements.
- (1)
- Literature assessment: A comprehensive assessment of the extant literature on transport and tourism development harmonisation. This review will assist in establishing a theoretical framework and in identifying knowledge deficits.
- (2)
- Data collection: Data will be collected from multiple sources to provide a comprehensive comprehension of the Shaanxi Province transport and tourism sectors. Surveys, interviews, and field observations will be conducted by Shaanxi’s statistics and tourism and transportation data management departments to collect primary data.
- (3)
- Quantitative analysis: Quantitative techniques, including statistical analysis and econometric modelling, will be utilised to analyse the collated data. This study will examine the connection between transport infrastructure, tourism demand, and economic indicators. It will also aid in the identification of the key factors influencing the coordinated development of transport and tourism in the Shaanxi Province.
- (4)
- Qualitative analysis: Qualitative methods, such as thematic analysis and case studies, will be employed to gain insight into the subjective experiences and perceptions of key stakeholders (such as government officials, industry professionals, and local communities). This qualitative analysis will provide a nuanced understanding of the social and environmental effects of tourism and transport development.
- (5)
- Policy recommendations: On the basis of the empirical findings, strategic recommendations and policy measures will be proposed to improve the coordinated development of transport and tourism in the Shaanxi Province. The purpose of these recommendations is to promote sustainable development, improve transportation infrastructure, and enhance the overall tourism experience.
This paper provides a comprehensive analysis of the coordinated effects and influencing factors of transport and tourism development in the Shaanxi Province using a mixed-methods approach. The combination of qualitative and quantitative research methodologies will contribute to the development of effective strategies and policies to promote sustainable transport and tourism systems in the region.
3.2. Data Sources and Evaluation Index System Construction
“Tourism development—transportation” is a complex system of mutual influence and interconnection; current academic research on the coupled development of the tourism economy and transportation has not yet established a unified index system construction standard. In the selection of indicators, the article adheres to the principles of periodicity, systematicity, scientificity, rationality, and data availability, taking into account the requirements for high-quality tourism development in the new era and drawing on prior relevant research [14,15,16], and selects nine indicators from five levels of criteria to establish the “tourism development-transportation evaluation index system” (Table 1). Table 1 displays the “transport evaluation index system”.
The tourism economy sub-system selected three evaluation indicators based on the tourism scale and tourism efficiency dimensions: total tourism revenue (T), total number of visitors (R), and total profit of tourism catering enterprises (P). The transportation subsystem selected six evaluation indicators in three dimensions based on the “foundation-flow-support” system: railway mileage (L), road mileage (H), railway passenger volume (W), passenger turnover (N), number of newly registered civil passenger vehicles (E), and road vehicles (V). The fundamental transportation indicators describe the fundamental structure of the transportation system, whereas the flow indicators describe the fundamental situation of passenger flow.
Article data is derived from the Shaanxi Tourism Statistical Yearbook and the Shaanxi Statistical Yearbook 2003–2022 (annual summaries published on the websites of the Shaanxi Provincial Bureau of Statistics and the Department of Culture and Tourism). Table 2 contains information, such as total tourism revenue (T), number of tourists (R), total profit of tourism-type catering enterprises (P), railway operating mileage (L), road operating mileage (H), railway passenger traffic (W), passenger turnover (N), newly registered civilian passenger vehicle holdings (E), and road operating vehicle holdings (V).
3.3. Data Dimensionless Processing Model
To eradicate the dimensionality and physical significance of each indicator, the summation normalisation method is used to process the unprocessed data dimensionlessly.
This is example 1 of an equation:
where, SN_z represents the secondary indicators “total tourism revenue (T), tourist arrivals (R), total profit of tourism catering enterprises (P), railway mileage (L), road mileage (H), railway passenger traffic (W), passenger turnover (N), ownership of newly registered civilian passenger vehicles (E), and ownership of road-operated vehicles (V). The result of the no-volume steel processing and summation normalisation is intended to allow the summation value to be used as the reference standard, with all data divided by the summation value and the resulting data equivalent to the summation percentage; i.e., with the summation value of all data as the unit, and all data removed by the summation value.
3.4. Entropy Value Method for Determining Weights
Entropy is a measure of unpredictability. The more information there is, the less is the uncertainty and the lower the entropy; conversely, the less information there is, the more is the uncertainty and the higher the entropy. Consequently, the information carried by the entropy value is used to calculate the weights, and the tool of information entropy is used to calculate the weights of each indicator, in conjunction with the degree of variation of each indicator, to provide a foundation for the comprehensive evaluation of multiple indicators.
- (1)
- Information entropy value e formula
a. Calculate the weight of the i-th sample value under the jth indicator, as shown in Equation (2):
b. Calculate the information entropy (column) of each indicator as shown in Equation (3):
In this formula, k = 1/ln(n).
- (2)
- Information utility value d formula
The correlation is shown in Equation (4):
- (3)
- Weighting factor w
The correlation is shown in Equation (5):
3.5. System Coupling and Coordination Model
Coupling is a fundamental physical concept utilised to quantify the degree of interaction between two elements. The level of coupling between tourism and urban development is indicative of their level of interaction, however, it does not provide a comprehensive assessment of the synergistic impact of their combined development. The present article presents a scientific model of coupling and coordination, which is quantified through the use of Equation (6).
The expression for C is given by, . The coordination index is represented by the symbol ^(1/3), while c_1, c_2, and c_3 denote the posting progress of the three subsystems, respectively. The equation represents the comprehensive evaluation index, where α, β, and γ denote the weights assigned to each subsystem through the entropy weight method, respectively. The coupling degree, denoted by D, is a parameter that ranges from 0 to 1. A higher value of D indicates a greater degree of coupling among the systems, while a lower value of D indicates a smaller degree of coupling. In cases where the sequential parameters are irrelevant, they need not be developed. The weight coefficients, α and β, satisfy the condition α + β = 1, while θ represents the adjustment coefficient. Finally, M denotes the comprehensive reconciliation index. In this paper, drawing on the existing research results of previous authors [17,18], the article divides the coupling coordination degree into 10 sub-categories (Table 3).
4. Results and Analysis
4.1. Standardisation of Data
The tabular representation (Table 4) reveals that following the process of summation normalisation for dimensionless processing, the data do not exhibit any outliers. Consequently, the subsequent stage of analysis is conducted on the data without any further intervention.
4.2. Entropy Method Data Weighting
The entropy method was employed to derive weights for a set of nine items, which encompasses SN_T (Table 5). The aforementioned table displays the following items: SN_T, SN_R, SN_P, SN_L, SN_H, SN_W, SN_N, SN_E, and SN_V. The assigned weights for the nine items were as follows: 0.281, 0.208, 0.186, 0.017, 0.042, and 0.051. The weights exhibit some variation, with SN_T having the highest weight of 0.281 and SN_L having the lowest weight of 0.017. The determination of weights is accomplished through the utilisation of the entropy method, which subsequently assigns said weights to the data derived from the coupling analysis.
4.3. Coupled Coordination Analysis: Analysis of the Correlation between the Tourism Economy and Transport and the Evolutionary Trajectory of Coordination
The research presented in the graphs below (Table 6 and Figure 4) demonstrates an upward trend in the Shaanxi region’s tourism-related economic development from 2003 to 2021. The tourism economy and transport coordination index grew at an average annual rate of 25.9% from 0.012 in 2003 to 0.504 in 2021. This indicates significant progress in the development of Shaanxi’s tourism industry and an improvement in the overall condition of its transportation infrastructure. However, comparison of the tourism economy and transport coordination indices reveals that the coordination indices of tourism economy and transport (K(x) and U(y)) in the Shaanxi region reach a peak between 2018 and 2020, followed by a downward trend for both indices after 2020.
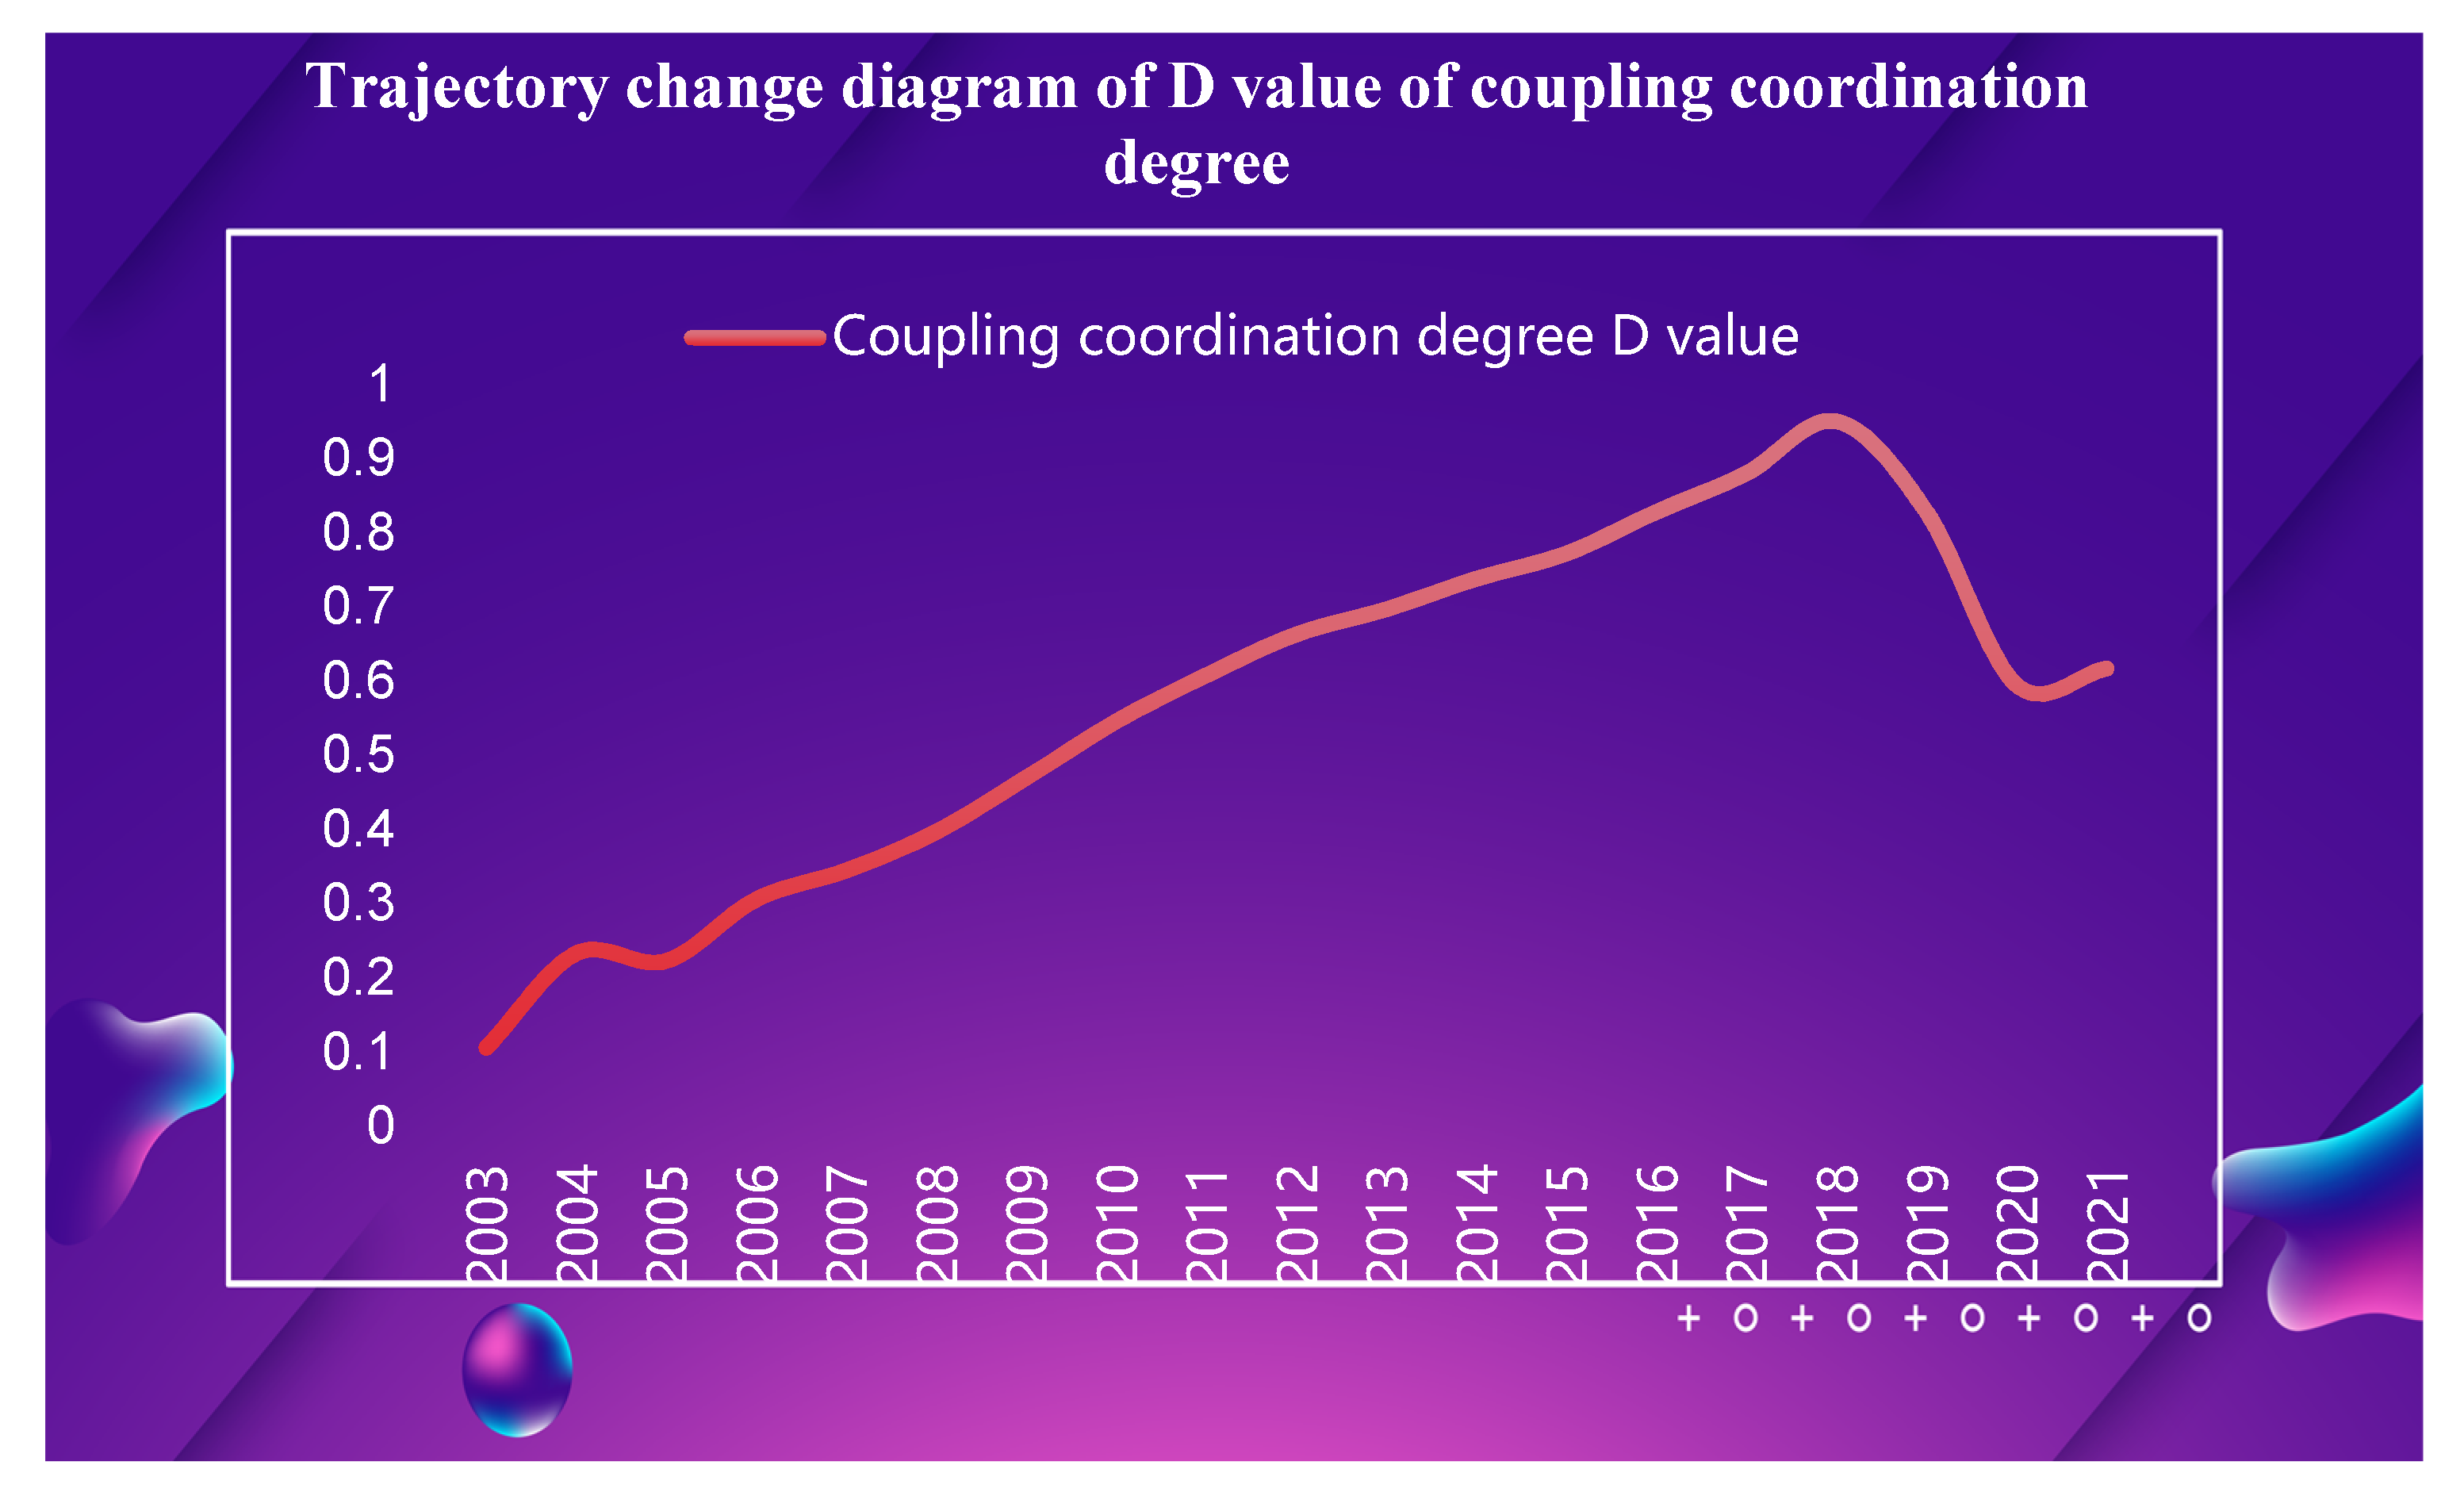
From 2003 to 2021, the trend of development for coupling coordination in Shaanxi has steadily improved. The degree of coupling coordination increased from 0.106 in 2003 to its maximum value of 0.95 in 2018, with the coupling coordination level shifting from severe disorder to high-quality coordination and the coordination effect shifting from feeble to strong. The development of coupling coordination has experienced four distinct phases: uncoordinated growth (2003–2008), transformational growth (2009–2013), coordinated growth (2014–2019), and epidemic shock (2020–2021). Except for the jolt during the epidemic, the other phases demonstrate a steady progression of development. Based on the existing research, coupled coordination is divided into the uncoordinated development phase, the transition development phase, the coordinated development phase, and the epidemic shock phase, and three types of growth are identified: lagging tourism economy, coordinated tourism economy, and lagging external shock.
- (1)
- The phase of uncoordinated development (2003–2008) was characterised by a “lagging tourism economy.” During this period, the coupling coordination index increased at an average annual rate of 4.9%, from 0.106 in 2003 to 0.397 in 2008. However, the coupling coordination index remains below 0.2, indicating that the level of coupling coordination is low and belongs to the stage of uncoordinated development. The tourism economy index is less than the transport index (K(x) U(y)), indicating that the tourism economy system has a larger impact on the level of coordination between the tourism economy and transport.
- (2)
- The transition period (2009–2013) is also classified as a “lagging tourism economy.” In this period of transitional development, the level of coupling coordination increased from feeble to strong, reaching 0.697 in 2013 with an average annual growth rate of 4.5%. The tourism economy index is still less than the transport index (K(x) U(y)), indicating that the coupling coordination type is still tourism economy underperforming. At this juncture, tourism in Shaanxi expands further, transport conditions continue to improve, and the degree of coupling and coordination rises.
- (3)
- Coordinated development era (2014–2019) is when the type of development is “tourism economy coordination.” During this time period, the coupling coordination degree increased from 0.738 in 2014 to 0.95 in 2018, with an overall upward trend. The tourism economy index and the transport economy index reach equilibrium (K(x) = U(y)), and the type of coupling coordination shifts to tourism economy coordination, with an overall positive trajectory and is at the apex of development.
- (4)
- The epidemic shock phase (2020–2021) is a form of development known as a “lagging external shock.” In this period, the degree of coupling coordination decreases by 11.7%, from 0.828 in 2019 to 0.595 in 2020. The tourism economic index is currently out of balance with the transport coordination index (K(x) U(y)) and in the external shock delayed stage. During this phase, the scope of tourism in the Shaanxi region was affected and startled by the epidemic, and coupling coordination was reduced due to unanticipated external disturbances.
5. Discussion
5.1. Analysis of the Factors Influencing Coupling Coordination
This study found that the transportation system has the greatest impact on the coupled and coordinated development of Shaanxi’s tourism economy and transportation. Additionally, transport pressure and epidemic disruptions are the major determinants of coupled and coordinated development [19].
From 2003 to 2021, Shaanxi’s coupling coordination between the tourism economy and transportation demonstrates a positive development trend throughout the various phases of development. During the stage of uncoordinated development and the stage of transitional development, the Shaanxi region promotes rapid growth of tourism revenue by increasing the scale of tourism and utilising the economies of scale effect in tourism. During the stage of coordinated development, the Shaanxi region prioritises tourism benefits and the sustainable growth of the tourism economy. Nevertheless, the global pandemic had a ripple effect on the tourism industry, resulting in a precipitous decline in the overall coordination. In 2021, as the epidemic was progressively brought under control, overall coordination improved.
In the event of an epidemic shock, the coordinated development of the tourism system in 2020 and 2021 was significantly impacted [20]. The global contagion precipitated a precipitous decline in overall coordination in 2020, with a significant impact on the tourism industry and transportation system [21]. As vaccination rates rise, tourism will recover more rapidly, but there is still a need for vigilance regarding the impact of re-emerging and mutating viruses on the tourism industry [22].
Additionally, the pandemic has had a substantial impact on the tourism transportation system. During the outbreak, international and domestic flights were restricted and a significant number of flights were cancelled, disrupting the normal operations of the tourism transportation system [23]. Concurrently, traffic restrictions and regulations were implemented to prevent the spread of the disease, which had an effect on the tourism transportation system [24]. Future tourism development must pay more attention to the healthy development of the tourism transport system and enhance its emergency response capacity in order to assure the tourism industry’s sustainable development [25].
To promote the qualitative development of the tourism industry in Shaanxi, it is necessary to continue focusing on the construction of transport infrastructure and enhance the coordination of transport benefits and constraints. Additionally, attention must be paid to the impact of global epidemics on tourism, and crisis management and emergency response capabilities must be strengthened.
5.2. Coordinated Development of Regional Tourism
Shaanxi’s tourism industry has always been a significant pillar industry. To accomplish the coordinated development of the tourism economy and ecological environment, it is still necessary to pay attention to the coordinated effect of transport and tourism development and its influencing factors [26]. To further promote the coordinated development of the tourism economy and ecological environment, the relevant authorities in Shaanxi should continue to strengthen the construction of transport infrastructure, improve tourism services, and prioritise environmental protection, the protection of natural resources, and the preservation of cultural heritage. In formulating strategic tourism development policies and plans, the natural, cultural, and historical characteristics of the Shaanxi region should be taken into full account, and the central location of the Silk Road should be utilised to create a tourism brand with Shaanxi characteristics in order to increase the region’s overall tourism attractiveness [27]. In addition, rural tourism and ecotourism should be aggressively developed in Shaanxi, and the production of environmentally friendly tourism services should be encouraged. Through the establishment of development models, such as green tourism economy industrial parks, eco-tourism towns, and rural tourism demonstration zones, the traditional tourism industry should be transformed to achieve mutual benefits for the tourism industry and the ecological environment [28]. In order to promote the sustainable development of the tourism economy and the ecological environment [29], it is also necessary to enhance the ecological compensation mechanism of the tourism industry and to accelerate the construction of ecological civilisation. Lastly, in the context of the ‘double carbon’ objective, Shaanxi should raise tourists’ awareness of low-carbon consumption through publicity and education, promote new eco-friendly tourism methods, and cultivate travellers who practise low-carbon concepts in order to realise a new path of coordinated tourism and ecological development.
6. Conclusions
This study examines the coordination effect of tourism economy and transportation in the Shaanxi region from 2003 to 2021, as well as its influencing factors, by constructing an evaluation index system for tourism economy and transportation utilising a comprehensive system coupling coordination model and regression effect model. The results of the research indicate that the degree of coordination between the tourism economy and transport in the Shaanxi region has improved steadily throughout the study period. This degree of coordination has undergone four phases: uncoordinated development, transformational development, coordinated development, and epidemic shock. The coupling coordination level evolved progressively from severe dissonance to quality coordination and then regressed to primary coordination during the epidemic. We observe that tourism economic lag, tourism economic coordination, and external shock lag are three distinct forms of growth. The Shaanxi region’s tourism economy and transport coordination are more significantly influenced by the transport system, according to additional analysis. Transport pressure and epidemic disruptions are significant factors influencing the development of coordination, whereas the scale of the transport infrastructure and the efficacy of transport are significant factors propelling its growth. Specifically, the global epidemic had a significant impact on the tourism industry’s sustainability in 2020 and 2021, when overall coordination was severely impacted and plummeted, and in 2021, when the epidemic stabilised, the overall coordination partially recovered. To achieve sustainable tourism development, emphasis must be placed on developing the transport system, enhancing the scale of the transport infrastructure and transport efficiency, and bolstering the response to the epidemic to ensure the coordinated development of the tourism economy and transport. Other factors that may influence the degree of coordination between the tourism economy and transportation can be investigated in greater depth in future research, and more specific policies and strategies can be devised to promote coordinated development.
Author Contributions
Conceptualization, W.Z. and L.W.; methodology, W.Z.; software, L.W.; validation, W.Z. and L.W.; formal analysis, L.W.; investigation, W.Z.; resources, W.Z.; data curation, L.W.; writing—original draft preparation, W.Z. and L.W.; visualization, L.W.; supervision, W.Z. All authors have read and agreed to the published version of the manuscript.
Funding
Construction Project of Shaanxi (University) Key Research Base for Philosophy and Social Sciences: Research on External Communication of Excellent Culture and Mutual Learning of Civilization in Shaanxi in 5G Era, No. 21JZ018.
Institutional Review Board Statement
Not applicable.
Informed Consent Statement
Not applicable.
Data Availability Statement
The data used to support the findings of this study are included within the article.
Acknowledgments
Thanks for the support of Shaanxi (university) Philosophy and social Science Key Research Base construction project.
Conflicts of Interest
The authors declare that there are no conflict of interest regarding the publication of this paper.
References
- Ji, W. Multimodal Synergistic Reconstruction of Culture Promotion Film in Foreign Language Teaching. Foreign Lang. Teach. 2021, 42, 82–86. [Google Scholar] [CrossRef]
- Jin, X.; Wang, X. Construction of Self-Driving Tourism Ontology from the Perspective of Information Needs: A Case Study of the Yellow River Tourism Belt in Shaanxi. J. Northwest Univ. 2023, 53, 195–208. [Google Scholar] [CrossRef]
- Pang, W.; Wang, S.; Wang, G. Analysis on the evolution and motivation of Shaanxi’s inbound tourism development status from 1978 to 2018. Shaanxi Normal Univ. 2020, 48, 28–35. [Google Scholar] [CrossRef]
- Xia, J.C.; Xiong, Q.Y. Economic Effects and Development Strategies of Integrated Transportation System. Ent. Econ. 2022, 41, 112–121. [Google Scholar] [CrossRef]
- Wang, Z.; Lin, X. How Transportation Infrastructure Promotes Regional Financial Development: Evidence from the Generalized Transport Cost Transmission Mechanism. J. Jiangxi Univ. Financ. Econ. 2021, 1, 43–54. [Google Scholar] [CrossRef]
- Yu, C.; Yong, Y. The Impact of Internet Development on the Efficiency of Tourism Economic Growth: Empirical Evidence from China. J. Huaqiao Univ. 2023, 154, 38–55. [Google Scholar] [CrossRef]
- Ma, X.; Tan, J. The Impact of Transportation Accessibility on the Resilience of the Tourism Environment System in Western Hunan Province and its Spatial Spillover Effects. Geogr. Sci. 2023, 43, 291–300. [Google Scholar] [CrossRef]
- Hayes, C.J. Placemaking in the Periphery: Leveraging Liminoid Spaces for Host Promotions and Experience Creation at the Japan 2019 Rugby World Cup. Tour. Hosp. 2023, 4, 214–232. [Google Scholar] [CrossRef]
- Krassakis, P.; Karavias, A.; Nomikou, P.; Karantzalos, K.; Koukouzas, N.; Athinelis, I.; Kazana, S.; Parcharidis, I. Multi-Hazard Susceptibility Assessment Using the Analytical Hierarchy Process in Coastal Regions of South Aegean Volcanic Arc Islands. GeoHazards 2023, 4, 77–106. [Google Scholar] [CrossRef]
- Zuo, B.; Xie, M. Study on the Impact of Offshore Duty-Free Policy on Hainan Tourism Demand and Consumption: Based on the Joint Purchase Model of Travel and Duty-Free Goods. Tour. Sci. 2021, 35, 1–16. [Google Scholar] [CrossRef]
- Guo, X.; Mu, X.; Ming, Q. Research on the Impact and Spatial Effects of High-Speed Transportation on Tourism Development from the Perspective of “Performance”: A Case Study of the Yangtze River Delta Region. Hum. Geogr. 2022, 37, 172–182. [Google Scholar] [CrossRef]
- Liu, P.; Wang, H.; Chen, W.; Zhang, J.; Liu, Z. Spatial Differentiation of the Impact of the COVID-19 Pandemic on the Demand of Tourist Source Markets in Tourist Attractions: A Case Study of Nanjing Confucius Temple Scenic Area. Geogr. Sci. 2022, 42, 1250–1259. [Google Scholar] [CrossRef]
- Zhang, Y.; Hao, Y.; Dong, X.; Chen, R. Research on the Mechanism of the Influence of Rural Tourism Destination Residents’ Return-to-Home Employment Intention: The Moderating Effect of Government Trust. J. Tour. Res. 2023, 38, 102–114. [Google Scholar] [CrossRef]
- Tian, M.; Zhou, F. Research on Tourism Development and Economic Growth Based on Grey Relational Analysis—Taking Shandong as an Example. J. Chongqing Univ. Technol. 2019, 33, 208–215. [Google Scholar] [CrossRef]
- Wang, X.; Lu, X.; Zhu, W. Analysis and Evaluation of Factors Affecting the Development of Tourism Industry in Major Tourism Cities of China. Econ. Geogr. 2020, 40, 198–209. [Google Scholar] [CrossRef]
- Liu, B.; Zhao, Y.; Li, Q. Analysis of the Spatiotemporal Evolution and Influencing Factors of China’s Tourism Industry Development. Stat. Decis. 2021, 37, 106–110. [Google Scholar] [CrossRef]
- Sun, C.; Zhang, F.; An, Y.; Wu, J.; Yang, Q.; Wei, Z.; Xiao, Y.; Yang, X. Research on the Coupling and Coordinated Dynamic Relationship between Tourism and New Urbanization: A Case Study of Chengdu-Chongqing Economic Circle. Resour. Dev. Mark. 2021, 37, 372–379. [Google Scholar]
- Ran, T.; Yang, D.; Su, W. Analysis of the Coordinated Development of Tourism and New Urbanization in Chongqing from 2007 to 2018. J. Chongqing Norm. Univ. 2020, 37, 54–64. [Google Scholar] [CrossRef]
- Piñones, P.; Derpich, I.; Venegas, R. Circular Economy 4.0 Evaluation Model for Urban Road Infrastructure Projects, CIROAD. Sustainability 2023, 15, 3205. [Google Scholar] [CrossRef]
- Elshaer, I.A.; Algezawy, M.; Ghaleb, M.M.S.; Mohamed, S.A.; Azazz, A.M.S. The Impact of Social Loafing on Turnover Intention for Tourism Employees Post COVID-19: The Mediating Role of Mental Health. Int. J. Environ. Res. Public Health 2023, 20, 5702. [Google Scholar] [CrossRef] [PubMed]
- Jęczmyk, A.; Uglis, J.; Zawadka, J.; Pietrzak-Zawadka, J.; Wojcieszak-Zbierska, M.M.; Kozera-Kowalska, M. Impact of COVID-19 Pandemic on Tourist Travel Risk Perception and Travel Behaviour: A Case Study of Poland. Int. J. Environ. Res. Public Health 2023, 20, 5545. [Google Scholar] [CrossRef]
- Fekete, D.; Barkó, G.Á.; Dömötör, M.; Czakó, K. Changing Tourism Trends of the Benedictine Abbey in Tihany: Best Practices of a Hungarian Monastic Community. Religions 2023, 14, 435. [Google Scholar] [CrossRef]
- Okamuro, H.; Hara, Y.; Iwaki, Y. Impact of Consumer Awareness and Behavior on Business Exits in the Hospitality, Tourism, Entertainment, and Culture Industries under the COVID-19 Pandemic. Adm. Sci. 2022, 12, 169. [Google Scholar] [CrossRef]
- Ramos, C.M.Q.; Cardoso, P.J.S.; Fernandes, H.C.L.; Rodrigues, J.M.F. A Decision-Support System to Analyse Customer Satisfaction Applied to a Tourism Transport Service. Multimodal Technol. Interact. 2023, 7, 5. [Google Scholar] [CrossRef]
- Lousada, S.; Castanho, R.A. The Role of Ports in Tourism: Porto Santo Harbour. Water 2022, 14, 3176. [Google Scholar] [CrossRef]
- Wang, X.; Zhang, M.; Jie, S.; Zhang, M.; Zhang, Z. Exploring the Coordinated Evolution Mechanism of Regional Sustainable Development and Tourism in China’s “Beautiful China” Initiative. Land 2023, 12, 1003. [Google Scholar] [CrossRef]
- Qiu, P.; Zhou, Z.; Kim, D.-J. A New Path of Sustainable Development in Traditional Agricultural Areas from the Perspective of Open Innovation—A Coupling and Coordination Study on the Agricultural Industry and the Tourism Industry. J. Open Innov. Technol. Mark. Complex. 2021, 7, 16. [Google Scholar] [CrossRef]
- Zhou, Z.; Yang, Q.; Kim, D.-J. An Empirical Study on Coupling Coordination between the Cultural Industry and Tourism Industry in Ethnic Minority Areas. J. Open Innov. Technol. Mark. Complex. 2020, 6, 65. [Google Scholar] [CrossRef]
- Shang, H.; Fan, J.; Fan, B.; Su, F. Economic Effects of Ecological Compensation Policy in Shiyang River Basin: Empirical Research Based on DID and RDD Models. Sustainability 2022, 14, 2999. [Google Scholar] [CrossRef]
Figure 1.
Regional map of the Shaanxi Province (geographical information in the map is from the official website of the Shaanxi Provincial Government).
Figure 1.
Regional map of the Shaanxi Province (geographical information in the map is from the official website of the Shaanxi Provincial Government).

Figure 2.
Relationship between factors influencing the coordination of transportation and tourism.

Figure 3.
Literature search analysis diagram.

Figure 4.
Plot of the trajectory variation of the D-value of the coupling coordination.


Table 1.
System of indicators for the evaluation of tourism economy and transport systems.
| Subsystems | Level 1 Indicators | Secondary Indicators | Unit |
|---|---|---|---|
| Tourism Economy System | Tourism scale | Total tourism receipts (T) | 108 Yuan |
| Tourist arrivals (R) | 104 people | ||
| Tourism benefits | Total profit of tourism-based food and beverage enterprises (P) | 108 Yuan | |
| Transport Systems | Transport infrastructure | Railway operating mileage (L) | 104 km |
| Highway operating mileage (H) | 104 km | ||
| Traffic flow | Rail passenger traffic (W) | 104 people | |
| Passenger turnover (N) | 108 people/km | ||
| Transportation | Newly registered civilian passenger vehicle ownership (E) | 104 Vehicle | |
| Road operating vehicle ownership (V) | 104 Vehicle |
Table 2.
Secondary indicator data for tourism economy and transport.
| Year | T | R | P | L | H | W | N | E | V |
|---|---|---|---|---|---|---|---|---|---|
| 2003 | 160 | 3300 | 1.71 | 0.29 | 5 | 2497 | 382.6 | 6.15 | 13.63 |
| 2004 | 301 | 5232 | 10.63 | 0.32 | 5.27 | 3231 | 450.3 | 8.64 | 15.04 |
| 2005 | 353 | 5988 | 10.7 | 0.31 | 5.45 | 3601 | 486.2 | 5.44 | 16.32 |
| 2006 | 418 | 6950 | 13.51 | 0.32 | 11.33 | 4370 | 517.51 | 10.61 | 17.64 |
| 2007 | 504 | 8015 | 19.5 | 0.32 | 12.13 | 4848 | 564.4 | 11.51 | 18.18 |
| 2008 | 607 | 9056 | 26.25 | 0.32 | 13.1 | 5218 | 649.61 | 16.51 | 20.17 |
| 2009 | 767 | 11,410 | 31.45 | 0.33 | 14.41 | 5008 | 680.59 | 28.53 | 25.97 |
| 2010 | 984 | 14,354 | 39.2 | 0.41 | 14.75 | 5411 | 747.06 | 37.97 | 28.73 |
| 2011 | 1324 | 18,135 | 50.16 | 0.41 | 15.2 | 5614 | 868.8 | 42.03 | 33.69 |
| 2012 | 1713 | 22,941 | 57.7 | 0.41 | 16.14 | 5757 | 897.97 | 46.67 | 35.73 |
| 2013 | 2135 | 28,161 | 50.41 | 0.44 | 16.52 | 6123 | 745.22 | 51.9 | 37.98 |
| 2014 | 2521 | 32,953 | 50.48 | 0.45 | 16.71 | 7077 | 804.42 | 57.18 | 41.4 |
| 2015 | 3006 | 38,274 | 50.48 | 0.45 | 17.01 | 7866 | 758.3 | 58.08 | 43 |
| 2016 | 3813 | 44,575 | 56.08 | 0.46 | 17.25 | 8302 | 755.67 | 64.9 | 43.33 |
| 2017 | 4814 | 51,901 | 61.25 | 0.5 | 17.44 | 8908 | 760.86 | 65.72 | 41.02 |
| 2018 | 5995 | 62,588 | 70.5 | 0.5 | 17.71 | 10953 | 797.97 | 67.75 | 43.8 |
| 2019 | 7212 | 70,249 | 10.55 | 0.54 | 18.01 | 11461 | 803.83 | 65.85 | 24.93 |
| 2020 | 2766 | 35,701 | 7.18 | 0.56 | 18.07 | 7044 | 452.58 | 59.48 | 26.24 |
| 2021 | 3434 | 39,058 | 6.24 | 0.56 | 18.34 | 7728 | 435.53 | 63.72 | 28.41 |
Table 3.
Criteria for classification of coupling coordination levels.
| Coupling Coordination D-Value Interval | Coordination Level | Degree of Coupling Coordination |
|---|---|---|
| (0.0~0.1) | 1 | Extreme disorders |
| [0.1~0.2) | 2 | Severe disorders |
| [0.2~0.3) | 3 | Moderate disorder |
| [0.3~0.4) | 4 | Mild disorders |
| [0.4~0.5) | 5 | On the verge of disorder |
| [0.5~0.6) | 6 | Reluctantly coordinated |
| [0.6~0.7) | 7 | Primary coordination |
| [0.7~0.8) | 8 | Intermediate coordination |
| [0.8~0.9) | 9 | Good coordination |
| [0.9~1.0) | 10 | Quality coordination |
Table 4.
Data standardization processing base data.
| Name | Sample Size | Minimum Value | Maximum Value | Average | Standard Deviation | Median |
|---|---|---|---|---|---|---|
| SN_T | 19 | 0.004 | 0.168 | 0.053 | 0.048 | 0.040 |
| SN_R | 19 | 0.006 | 0.138 | 0.053 | 0.040 | 0.045 |
| SN_P | 19 | 0.003 | 0.113 | 0.053 | 0.036 | 0.050 |
| SN_L | 19 | 0.037 | 0.071 | 0.053 | 0.011 | 0.052 |
| SN_H | 19 | 0.019 | 0.068 | 0.053 | 0.017 | 0.060 |
| SN_W | 19 | 0.021 | 0.095 | 0.053 | 0.020 | 0.048 |
| SN_N | 19 | 0.030 | 0.071 | 0.053 | 0.013 | 0.059 |
| SN_E | 19 | 0.007 | 0.088 | 0.053 | 0.031 | 0.061 |
| SN_V | 19 | 0.025 | 0.079 | 0.053 | 0.019 | 0.051 |
Table 5.
Summary of the results of the entropy method for calculating weights.
| Item | Information Entropy Value e | Information Utility Value d | Weighting Factor w |
|---|---|---|---|
| SN_T | 0.8716 | 0.1284 | 28.09% |
| SN_R | 0.9051 | 0.0949 | 20.76% |
| SN_P | 0.9151 | 0.0849 | 18.57% |
| SN_L | 0.9924 | 0.0076 | 1.67% |
| SN_H | 0.9810 | 0.0190 | 4.16% |
| SN_W | 0.9768 | 0.0232 | 5.07% |
| SN_N | 0.9897 | 0.0103 | 2.24% |
| SN_E | 0.9329 | 0.0671 | 14.67% |
| SN_V | 0.9782 | 0.0218 | 4.77% |
Table 6.
Results of coupling coordination calculations.
| Item | Coupling Degree C Value | Type of Coordination | Coordination Index T-Value | Coupling Coordination D-Value | Coordination Level | Degree of Coupling Coordination | Coordination Phase |
|---|---|---|---|---|---|---|---|
| 2003 | 0.967 | Lagging tourism economy | 0.012 | 0.106 | 2 | Severe disorders | Uncoordinated development |
| 2004 | 0.848 | Lagging tourism economy | 0.064 | 0.233 | 3 | Moderate disorder | |
| 2005 | 0.746 | Lagging tourism economy | 0.067 | 0.223 | 3 | Moderate disorder | |
| 2006 | 0.794 | Lagging tourism economy | 0.118 | 0.306 | 4 | Mild disorders | |
| 2007 | 0.791 | Lagging tourism economy | 0.150 | 0.345 | 4 | Mild disorders | |
| 2008 | 0.793 | Lagging tourism economy | 0.199 | 0.397 | 4 | Mild disorders | |
| 2009 | 0.826 | Lagging tourism economy | 0.267 | 0.470 | 5 | On the verge of disorder | Transformational development |
| 2010 | 0.871 | Lagging tourism economy | 0.342 | 0.546 | 6 | Reluctantly coordinated | |
| 2011 | 0.879 | Lagging tourism economy | 0.421 | 0.608 | 7 | Primary coordination | |
| 2012 | 0.897 | Lagging tourism economy | 0.489 | 0.663 | 7 | Primary coordination | |
| 2013 | 0.940 | Lagging tourism economy | 0.516 | 0.697 | 7 | Primary coordination | |
| 2014 | 0.952 | Tourism economic coordination | 0.573 | 0.738 | 8 | Intermediate coordination | Coordinated development |
| 2015 | 0.968 | Tourism economic coordination | 0.616 | 0.772 | 8 | Intermediate coordination | |
| 2016 | 0.979 | Tourism economic coordination | 0.701 | 0.828 | 9 | Good coordination | |
| 2017 | 0.992 | Tourism economic coordination | 0.781 | 0.880 | 9 | Good coordination | |
| 2018 | 0.996 | Tourism economic coordination | 0.907 | 0.950 | 10 | Quality coordination | |
| 2019 | 0.867 | Tourism economic coordination | 0.792 | 0.828 | 9 | Good coordination | |
| 2020 | 0.780 | External shock lag | 0.453 | 0.595 | 6 | Reluctantly coordinated | Epidemic shock |
| 2021 | 0.754 | External shock lag | 0.504 | 0.617 | 7 | Primary coordination |
Disclaimer/Publisher’s Note: The statements, opinions and data contained in all publications are solely those of the individual author(s) and contributor(s) and not of MDPI and/or the editor(s). MDPI and/or the editor(s) disclaim responsibility for any injury to people or property resulting from any ideas, methods, instructions or products referred to in the content. |
© 2023 by the authors. Licensee MDPI, Basel, Switzerland. This article is an open access article distributed under the terms and conditions of the Creative Commons Attribution (CC BY) license (https://creativecommons.org/licenses/by/4.0/).
Share and Cite
MDPI and ACS Style
Zhang, W.; Wen, L. Analysis of the Coordination Effects and Influencing Factors of Transportation and Tourism Development in Shaanxi Region. Sustainability 2023, 15, 9496. https://0-doi-org.brum.beds.ac.uk/10.3390/su15129496
AMA Style
Zhang W, Wen L. Analysis of the Coordination Effects and Influencing Factors of Transportation and Tourism Development in Shaanxi Region. Sustainability. 2023; 15(12):9496. https://0-doi-org.brum.beds.ac.uk/10.3390/su15129496
Chicago/Turabian StyleZhang, Weidi, and Lei Wen. 2023. "Analysis of the Coordination Effects and Influencing Factors of Transportation and Tourism Development in Shaanxi Region" Sustainability 15, no. 12: 9496. https://0-doi-org.brum.beds.ac.uk/10.3390/su15129496
Note that from the first issue of 2016, this journal uses article numbers instead of page numbers. See further details here.