Article

Mechanical Soil Resistance Influenced by Different Tillage Systems and Tractor Tire Pressures

1
Biotechnical Department, University of Slavonski Brod, 35000 Slavonski Brod, Croatia
2
Faculty of Agrobiotechnical Sciences Osijek, Josip Juraj Strossmayer University of Osijek, 31000 Osijek, Croatia
*
Author to whom correspondence should be addressed.
Sustainability 2023, 15(13), 10236; https://0-doi-org.brum.beds.ac.uk/10.3390/su151310236
Submission received: 31 May 2023 / Revised: 21 June 2023 / Accepted: 26 June 2023 / Published: 28 June 2023
(This article belongs to the Special Issue Sustainable Agriculture and Climate Resilience)

Abstract

:
Intensive agricultural practices affect soil compaction, and their indirect and direct effects on crop growth and development are an increasingly important focus of scientific research. The objective of this study was to determine the influence of different tillage systems on soil compaction and to observe the influence of tractor tire pressure on penetrometer resistance during sowing. The three-year study was conducted on the heavy pseudogley soil of Brod-Posavina County in the Republic of Croatia. During the research, crops were observed in the following cropping sequence: soybean (Glycine max L.) in the first year, maize (Zea mays L.) in the second year and winter wheat (Triticum aestivum L.) in the third year. The tillage systems as the main study factor were conventional tillage (CT) plowing to a depth of 35 cm, disc tillage (DH) to a depth of 15 cm, loosening (CH) to a depth of 30 cm, and undermining (SS) to a depth of 50 cm. The following pressures were used as a subfactor of this study, namely the pressure of the front and rear tires of the tractor during sowing: p1 (front 1.0 bar/rear 0.8 bar), p2 (front 2.0 bar/rear 1.6 bar), and p3 (front 3.0 bar/rear 2.4 bar). The tillage systems applied resulted in different soil compaction, thus the deepest tillage SS had the lowest resistance and the DH tillage had the highest resistance in all three experimental years. Penetrometer measurements showed the influence of tire pressure p1 on reducing compaction as early as the first year in 2017, while in the last year of research in 2019, tractor tire pressure p3 during sowing contributed to a significant increase in soil compaction.

1. Introduction

Arable area is a limited natural resource, which, in addition to direct and indirect interaction with climate and sudden climate changes, significantly complicates the sustainability and security of agricultural production. Applied tillage systems can be highlighted as an important way to mitigate the current very unfavorable climatic conditions and ensure regular high yields [1]. Tillage is carried out with the aim of improving the mechanical properties of the soil, increasing the incorporation and mixing of fertilizers and organic residues with the soil, suppressing weeds, plant diseases, and pests, i.e., creating optimal conditions for crop germination, growth, and development [2]. Agricultural machinery is becoming larger, faster, more reliable, more economical, and generally more productive, but this leads to greater compaction and degradation of agricultural soils [3]. A significant increase in soil compaction during soil preparation prior to sowing is influenced by the size, power, and method of locomotion (wheels or tracks) of agricultural tractors [4].
Poor soil structure increases evaporation, reduces infiltration and soil water permeability, has poor aeration, contributes to crust formation, and paves the way for greater erosion [5,6]. Conservation tillage is carried out through a number of different tillage systems and approaches, mainly with the aim of conserving soil moisture and reducing erosion, leaving the surface covered with at least 30% crop residue after tillage and sowing of the next crop [7]. Farmers involved in various aspects of agricultural production are encouraged to use conservation tillage because it can reduce erosion and compaction, nutrient leaching, fuel consumption, and labor hours [8] while increasing microbiological activity and carbon storage [9]. The authors of [10], in their study of different tillage systems and their influence on the physical properties of clayey luvisol soil, found significant differences between tillage systems: density, porosity, water retention capacity, and air capacity of the soil. Conservation tillage systems have the least effect on the tearing off of the surface layer of the soil due to the slip of the tractor wheels, while the reduction in tillage and the reduction in the tillage depth can have significant effects on the fuel consumption of the tractor [8].
The author of [11] investigated the physical changes in clay soils of Slovakia under the influence of two different cultivation systems: a “no-till” cultivation system and a cultivation system with conventional tillage. The analysis of the results showed that in the “no-till” system the density increased and the total porosity decreased. Capillarity increased significantly in the system with conventional tillage, while the maximum water capacity of the soil (=field capacity) showed no significant differences regardless of the tillage system. Different tillage systems (conventional plowing, disk tillage, loosening, and no-till) of chernozem in northern Baranja affect soil resistivity, such that the greatest compaction and soil resistance occurred at a depth of 10–15 cm with disk tillage and at a depth of 25–30 cm with plowing [12]. The same authors note that the perennial use of conventional tillage can have negative effects on soil erosion and the formation of “plow bottoms.” Proper management of soil as a resource can protect soil from excessive water and erosion, prevent crust formation and compaction of layers, and ensure good and easy germination and root development [13]. The specific location, crop, soil type, and climate are important in selecting a tillage system [2]. According to [14], one of the most important objectives of tillage is to create a favorable soil structure so that seed can be placed at an ideal depth, and therefore tillage is essential for seeding, growth, development, and ultimately yield [15]. In practice, tillage affects the physical, chemical, and biological properties of the soil and ultimately directly influences plant growth and yield [16,17,18]. Different tillage systems affect soil compaction, soil temperature, and yield of wheat, corn, and soybean, and reduced tillage has a beneficial effect on soil moisture at the time of sowing [19]. Control of agrotechnical traffic on arable land and conservation tillage were found to be acceptable solutions for surface runoff, soil water movement, and yield components on heavy vertisol in Queensland—Australia [20]. The author of [21], in a multi-year study of three tillage systems, found that tillage methods and crop residue cover had a significant effect on yield, compaction, and soil density. The unfavorable condition of soil moisture and tractor tire pressure affect the low wheel resistance factor of the rolling working machine (f = 0.08–0.12), which affects compaction, soil shear, wheel slip, and energy consumption [3,8]. Tillage with a power harrow may be an alternative to good maintenance of favorable soil moisture and wheat yield with conventional systems [22].
The effects of agricultural machinery traffic can be divided into several categories: direct damage to crop yield, effects on compaction due to processing, and long-term damage that occurs after all operations [23]. Proper distribution of ballast on the axles [24] and selection of the correct size and tire pressure can reduce compaction of previously loosened soil [25]. From the research mentioned so far, it is necessary and important to study the influence of tillage before sowing and other utilization parameters during sowing on different soil types. The aim of this research was to determine the influence of tillage system and tractor tire pressure during sowing on soil compaction in the surface layer.

2. Materials and Methods

Three-year research on crop rotation (2017. soybean (Glycine max L.); 2018. maize (Zea mays L.) and 2018/2019. winter wheat (Triticum aestivum L.)) was conducted in Croatia in Brod-Posavina County with the exact coordinates of the experimental field 45°10′14″ North latitude and 18°6′3″ East longitude. Mechanical soil analysis was performed according to the standard HRN ISO 11464 (2004) [26] and a combination of sieving and sedimentation method according to the standard ISO 11277 (2009) [27]. The agricultural soil in the experimental field has mechanical content as follows: coarse sand 5.36%, fine sand 8.4%, coarse silt 37.77%, silt 44.75%, clay 3.72%. The data on the amount of precipitation and the mean values of air temperature in the month of penetrometry are presented in Figure 1.

2.1. Setting up the Experiment

The experiment was designed as a completely randomized block experiment in four replicates with the main factor “tillage system” and the subfactor “pneumatic pressures at sowing”. The size of the experimental tillage area was 10 m × 90 m (900 m2). The study of the influence of tire pressure at sowing was carried out perpendicular to the tillage direction on areas of 10 m × 30 m. The total size of the area with all replicates was 14,400 m2.
In 2016, 2017 and 2018, the following tillage systems were used as the main factor: Conventional tillage (CT), plowing to a depth of 35 cm and preparing the soil before sowing; Disc tillage (DH), tilling the soil by discs to a depth of 15 cm and preparing for sowing; Loosening (CH), tilling the soil by loosening to a depth of 30 cm and preparing for sowing; Undermining (SS), tilling the soil by undermining to a depth of 50 cm and preparing for sowing.
The subfactor of the experiment “tire pressure at sowing” was as follows: p1 for tractor front tire pressure 1.0 bar and rear tire pressure 0.8 bar; p2 for tractor front tire pressure 2.0 bar and rear tire pressure 1.6 bar; p3 for tractor front tire pressure 3.0 bar and rear tire pressure 2.4 bar.
A Massey Ferguson 8480 Dyna-VT tractor (Figure A1; Table A1), was used to implement the tillage system and during sowing in all three years of the research, equipped with 600/65 R28 (front) and 710/70 R38 (rear) tires. For the implementation of conventional tillage (CT) it was aggregated with a five-furrow plow Regent Titan 15 (Figure A2; Table A2), for the implementation of reduced tillage by disk tillage (DH) it was aggregated with a disk RAU Rondo XL 44 (Figure A3; Table A3), for the implementation of conservation tillage by loosening (CH) and undermining (SS) it was aggregated with an undermining device Pegoraro MEGA DRAG 7 (Figure A4; Table A4), adjusted to different working depths. The working speeds in the application of the various tillage systems were as follows: 6.5 km h−1 for CT, 9 km h−1 for DH, 10 km h−1 for CH and 5,5 km h−1 for SS tillage. For further tillage, the same tractor was aggregated with a Kongskilde HK 31 (Figure A5; Table A5), power harrow. The other agrotechnical measures such as fertilization, protection and harvesting were the same in all three experimental years.
The experiment begins with the implementation of all the tillage systems studied, which were carried out on 25 November 2016. Penetrometry for each tillage system and tractor tire pressure during sowing, with the aim of determining the influence of the applied agricultural technique on compaction, was performed during the cultivation of soybean (Glycine max L.) as follows: on 9 June (1st measurement), 25 July (2nd measurement) and 9 September (3rd measurement) in 2017, during the cultivation of maize (Zea mays L.) as follows: on 25 May (1st measurement), 28 June (2nd measurement) and 28 August (3rd measurement) in 2018, and during the cultivation of winter wheat (Triticum aestivum L.) as follows: on 9 April (1st Measurement) and 12 June (2nd Measurement) in 2019. On the same day of the start of each penetrometry, the current soil moisture was determined by the gravimetric method. Soil samples were taken every ten centimeters of depth, starting from 10 cm to 40 cm depth. In the laboratory, the samples were weighed on an Ohaus Adventurer pro AV4101 balance and placed in a Memmert Model 100–800 dryer. After drying at a temperature of 105 ℃ to a constant mass, the samples were weighed again and the moisture content was calculated according to the Equation (A1) Soil in weight %.
Fertilization was carried out according to the recommendations for cultivated plants and was as follows: with 667 kg ha−1 7:20:30 NPK fertilizer for growing soybeans (Glycine max, L.), 725 kg ha−1 7:20:30 NPK fertilizer and with 92 kg ha−1 UREA N 46 for growing corn (Zea mays L.), and with 508 kg ha−1 7:20:30 NPK fertilizer for growing winter wheat (Triticum aestivum L.). Soil preparation was carried out before sowing with a Kongskilde HK 31 power harrow to a depth of 7 cm. They were the same for all observed tillage systems and tire pressures in all experimental years. Sowing with changes in tire pressure of the tractor with which it was performed was as follows: soybeans (Sinara variety) on 15 April 2017; maize (Kulak variety) on 18 April 2018; winter wheat (Victoria variety) on 5 November 2018.

2.2. Soil Compaction

The state of soil compaction, possibly caused by the applied treatment systems, was determined with a penetrometer “Eijkelkamp Penetrologger SN” with a conical tip with an area of 2 cm2 to a depth of 40 cm in the soil profile. Penetrometry on each cultivation system and on each tire pressure of the tractor during sowing (total of 144 measurements per each term) with the aim of determining the influence of the applied agricultural techniques on compaction. The scheme for measuring the penetrometer resistances can be seen in Figure A6.

2.3. Statistical Analysis

Statistical processing of the data was performed using the statistical package for analysis of variance Statistica version 13.5.0.17 (Statistical Package TIBCO Software Inc., 2018, Palo Alto, CA, USA), where the main factor was “tillage system”, and the subfactor was “different pressures of the front and rear tractor tires at sowing”. In accordance with Fisher’s test for significant differences in analysis of variance, least significant differences (LSD) for statistical significance of p < 0.05 were calculated by comparing the means. To determine exactly which variants had statistically significant differences, Duncan’s test was used. The values of the research results in the tables marked with different capital letters (A, B, C, D …) in the column have mutually statistically significant differences with 95% probability.

3. Results and Discussion

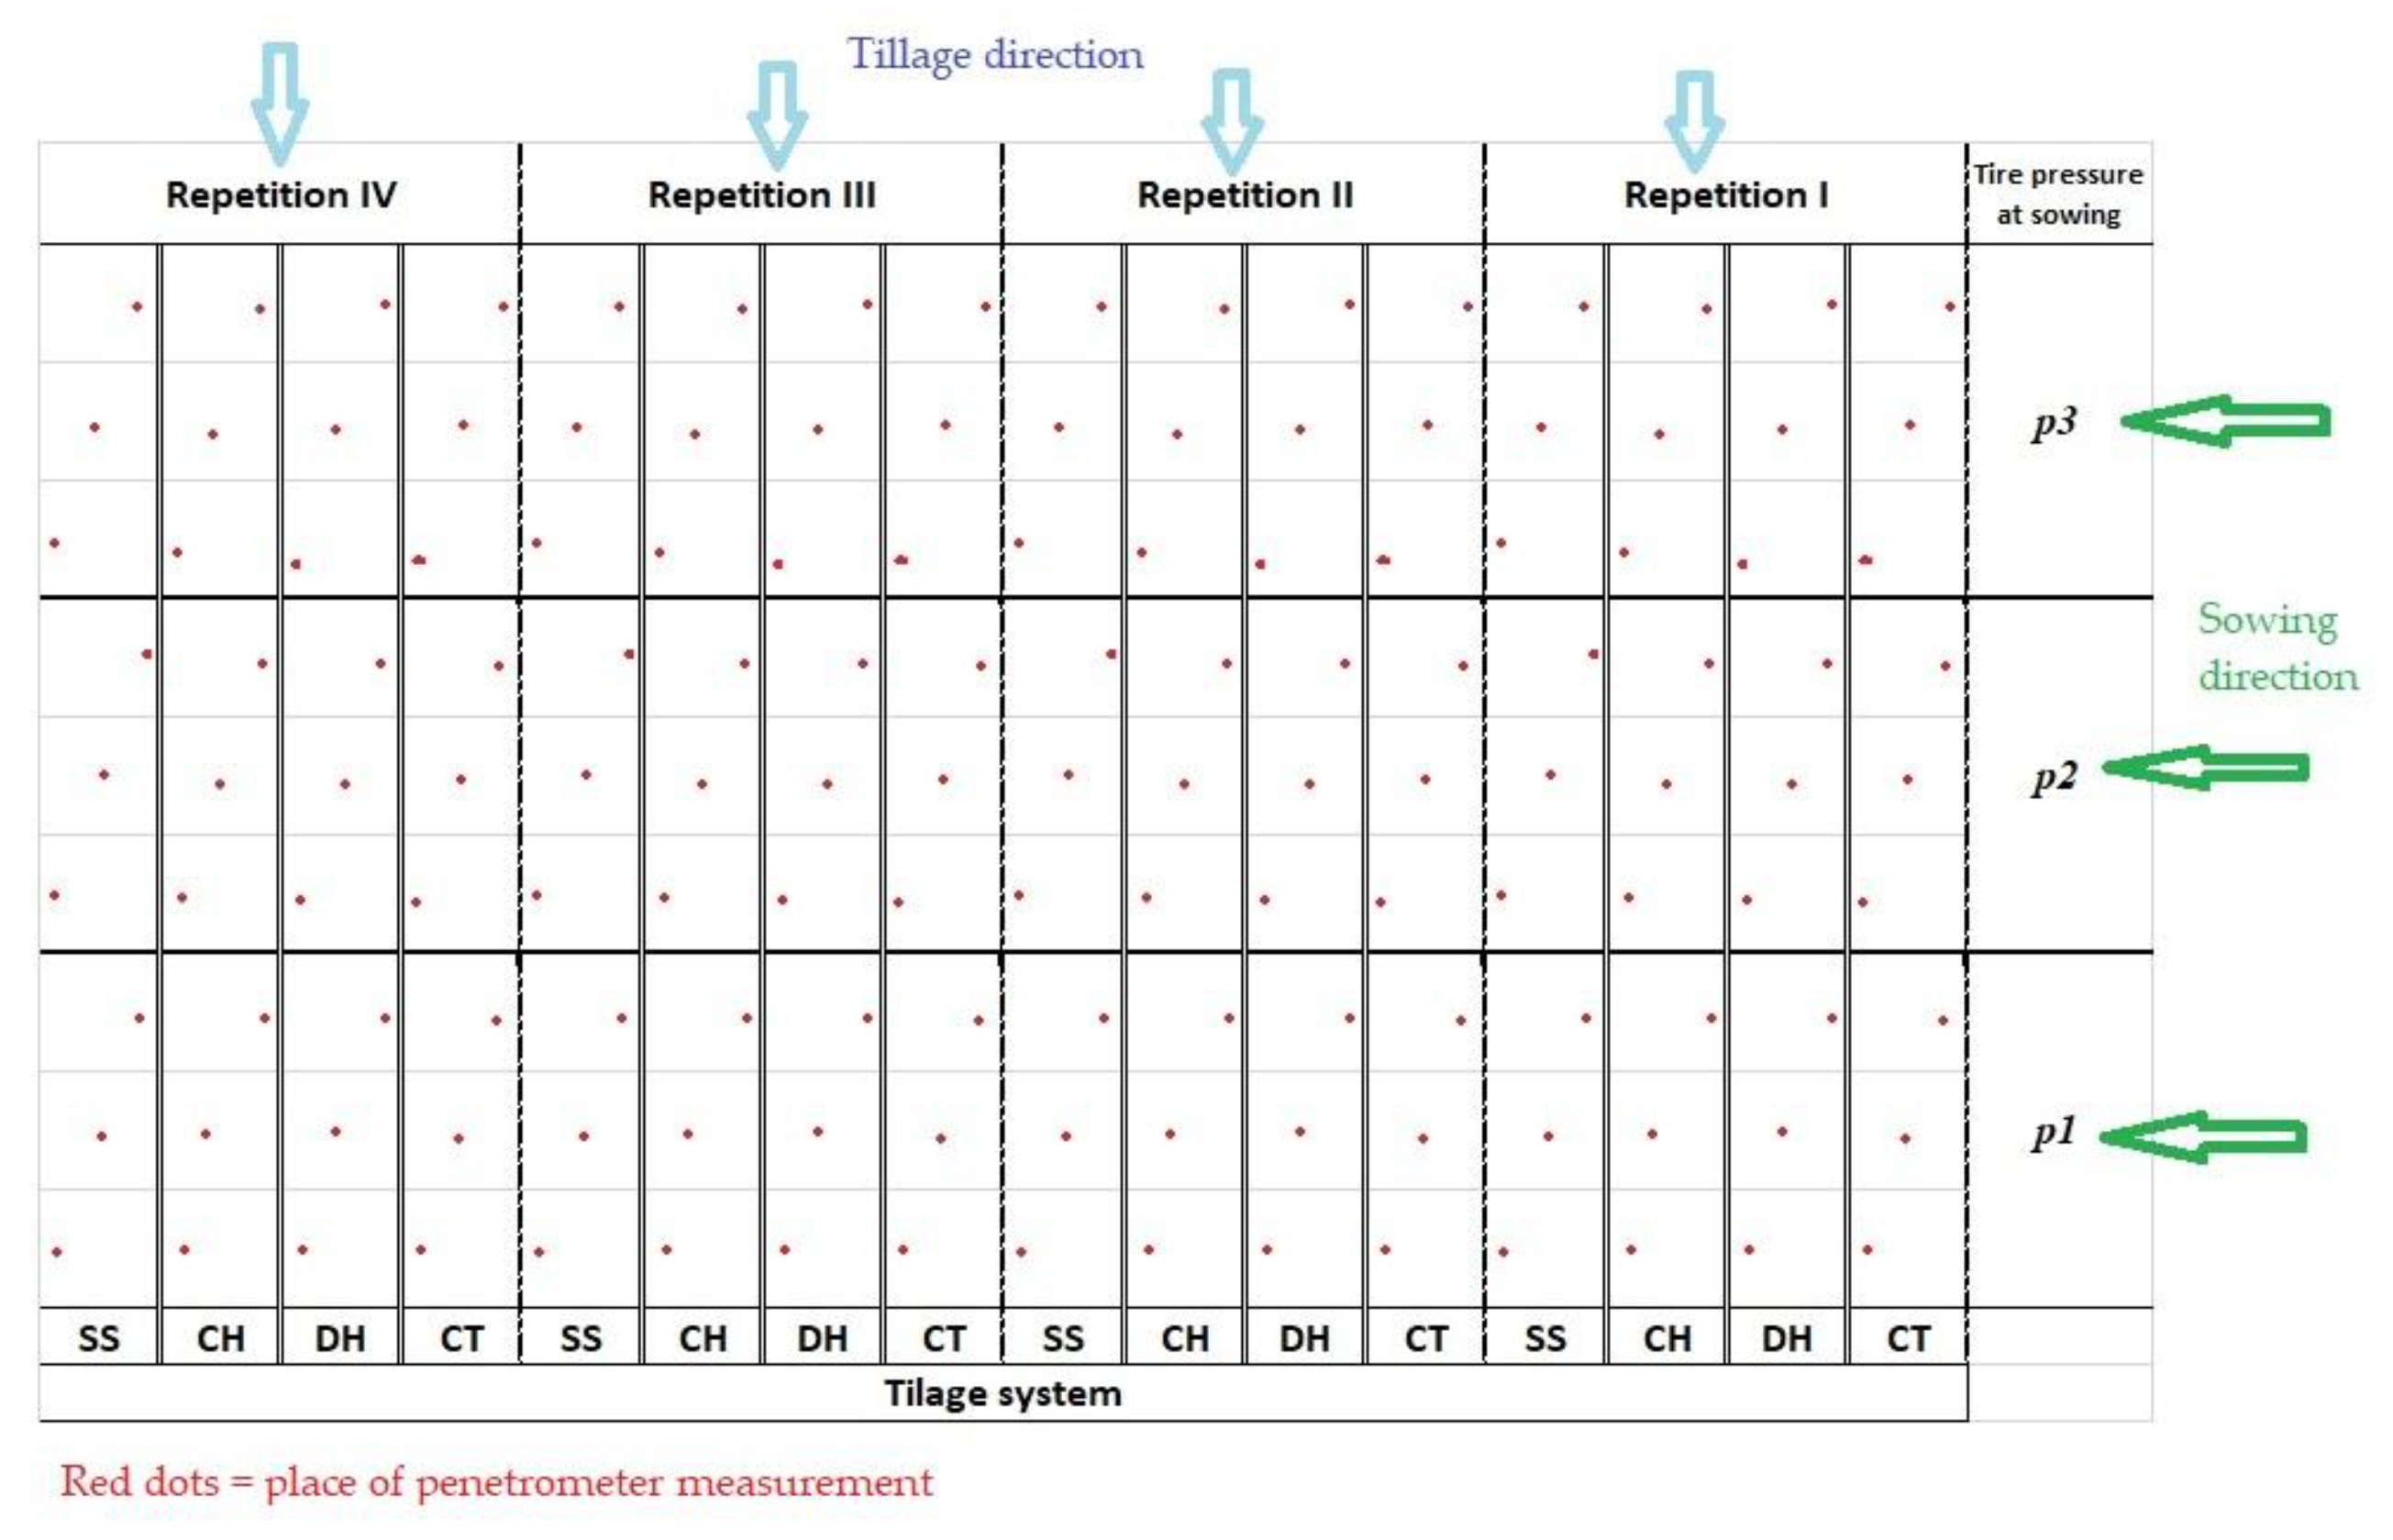
The condition of soil compaction is shown in Table 1, Table 2, Table 3, Table 4, Table 5, Table 6, Table 7, Table 8 and Table 9. The results of the influence of the applied soil treatment method can be seen in Table 1, Table 4 and Table 7. Table 2, Table 5 and Table 8 show how the different tire pressures of the tractors during sowing affected soil compaction. The resistances determined with a conical tip penetrometer every 5 cm from 0 to 40 cm depth of the soil profile are shown in Table 3, Table 6 and Table 9. The average current soil moisture at a depth of 0–40 cm while performing each of the penetrometry in the first year of research was as follows: in the first measurement 17.37%, in the second measurement 17.96%, and in the third measurement 23.26%.
Differently applied tillage systems in the 1st year of observation and at the 1st measurement had no statistically significant effect on soil resistance (F = 2.49).
Soil resistance at the 2nd measurement was statistically significantly affected by soil treatment (F = 27.06). The average resistance value was 3.08 MPa. The highest resistance was measured in the DH treatment and the lowest in SS. The LSD test revealed statistically significant differences in the value of soil resistance between treatments DH and CT (0.70 MPa), DH and CH (0.56 MPa), DH and SS (0.89 MPa), CH and SS (0.33 MPa).
Soil resistance at the 3rd measurement was statistically significantly affected by soil treatment (F = 11.49). The average resistance value was 2.68 MPa. The highest resistance was measured in the DH treatment and the lowest in the SS treatment. Statistically significant differences in soil resistance values were found between all tillage systems except between CT and CH.
The authors of [28,29] found that using a subexcavator with a greater tillage depth reduced soil compaction while improving soil infiltration capacity. Increasing the tillage depth of the same cultivation tool when implementing basic tillage CH and SS resulted in a reduction in soil compaction. Reducing the amount of tillage can affect the reduction in soil degradation and especially the reduction in soil compaction [12].
Table 2. The influence of the tire pressure of a tractor on the mechanical resistance of the soil.
2016./2017. Soybean (Glycine max L.)
Tire Pressure1st Measurement (Average Resistance—MPa)2nd Measurement (Average Resistance—MPa)3rd Measurement (Average Resistance—MPa)
p11.91 B2.78 B2.54 B
p22.09 A3.27 A2.40 B
p31.93 B3.18 A3.09 A
FP* (p < 0.05, F = 9.55)* (p < 0.05, F = 16.72)* (p < 0.05, F = 31.15)
FP—F test tire pressure at sowing; *—statistical significance; n.s.—no statistical significance; values within the same columns, which are marked with different capital letters, differ statistically significantly at the level of p < 0.05.
Soil resistance in the first year of observation was statistically significantly affected by tire pressure in all three measurements (as follows F = 9.55; F = 16.72; F = 31.15). The average value of soil resistance in the 1st measurement was 1.98 MPa. The highest penetrometer resistance of the 1st measurement was measured at tire pressure p2, and the lowest at p1. The differences in resistances between p2 and p1 (0.17 MPa) and p2 and p3 (0.15 MPa) were statistically justified.
The average resistance value of the 2nd measurement was 3.08 MPa. The highest resistance was measured at p2 and the lowest at p1. The LSD test revealed statistically significant differences in soil resistance between variants p1 and p3 (0.4 MPa) and between p1 and p2 (0.49 MPa). The difference in soil resistance between p2 and p3 was not statistically significant.
The average resistance value of the 3rd measurement was 2.68 MPa. The highest resistance was measured at p3 and at p2. The LSD test revealed statistically significant differences in soil resistance between p1 and p3 (0.55 MPa) and between p2 and p3 (0.69 MPa). The difference in soil resistance between p1 and p2 was not statistically significant.
In the third measurement of the influence of pressure, an increasingly pronounced compaction can be seen at the highest tire pressure p3. Similar research results were obtained by [30], and the same authors indicate that by reducing tire pressure from pmax = 160 kPa (1.6 bar) to pmax = 120 kPa (1.2 bar), especially in agricultural practices with multiple passes, soil compaction can be significantly reduced.
Table 3. Influence of the depth measurement on the mechanical resistance of the soil.
2016./2017. Soybean (Glycine max L.)
Depth of Resistance Measurement1st Measurement (Average Resistance—MPa)2nd Measurement (Average Resistance—MPa)3rd Measurement (Average Resistance—MPa)
0–5 cm1.62 D0.72 H0.79 G
5–10 cm2.04 B1.40 G1.21 F
10–15 cm2.21 A2.10 F2.15 E
15–20 cm2.17 AB2.92 E2.23 ED
20–25 cm1.90 CB3.77 D2.52 D
25–30 cm1.85 C4.14 C3.61 C
30–35 cm1.99 BC4.56 B4.09 B
35–40 cm2.04 B5.05 A4.82 A
FD* (p < 0.05, F = 14.58)* (p < 0.05, F = 224.30)* (p < 0.05, F = 173.27)
FD—F test depth of penetrometry; *—statistical significance; n.s.—no statistical significance; values within the same columns, which are marked with different capital letters, differ statistically significantly at the level of p < 0.05.
Soil resistances in the 1st year of observation were statistically significantly affected by depth measurement in all three measurements (as follows F = 14.58; F = 224.3; F = 173.27). The highest penetration resistance was found in the 1st measurement at 10–20 cm and 15–20 cm depths without statistical significance, and in the 2nd and 3rd measurements at 35–40 cm depths.
Table 4. The influence of the tillage system on the mechanical resistance of the soil.
2017./2018. Maize (Zea mays L.)
Tillage System1st Measurement (Average Resistance—MPa)2nd Measurement (Average Resistance—MPa)3rd Measurement (Average Resistance—MPa)
CT1.66 B2.48 B2.59 A
DH1.89 A2.66 AB3.30 B
CH1.82 A2.72 A3.19 B
SS1.47 C1.78 C2.83 A
FO* (p < 0.05, F = 19.96)* (p < 0.05, F = 31.83)* (p < 0.05, F = 12.55)
FO—F test tillage system; *—statistical significance; n.s.—no statistical significance; values within the same columns, which are marked with different capital letters, differ statistically significantly at the level of p < 0.05.
The average current soil moisture at a depth of 0–40 cm during each of the penetrometry measurements in the second year of the research was as follows: in the first measurement 18.53%, in the second measurement 18.27% and in the third measurement 17.29%.
Resistance in the 2nd year of maize cultivation was statistically significantly affected by the tillage system used in all three measurements (as follows F = 19.96; F = 31.83; F = 12.55).
The average resistance value of the 1st measurement was 1.71 MPa. The highest resistances were measured for the DH, and the lowest for the tillage system SS. The LSD test revealed the following statistically significant differences in resistance between: CT and DH (0.23 MPa), CT and CH (0.16 MPa), CT and SS (0.19 MPa), DH and SS (0.41 MPa), and CH and SS (0.35 MPa).
In the 2nd measurement, the average resistance was 2.41 MPa. The highest penetrometer resistance was measured at CH, and the lowest resistance was measured at SS. Statistically significant differences in resistance were found between CT and CH (0.25 MPa), CT and SS (0.70 MPa), DH and SS (0.88 MPa), and CH and SS (0.95 MPa).
The average resistance value of the 3rd measurement was 2.98 MPa. The highest resistances were measured at DH and the lowest at CT processing. The LSD test revealed the following statistically significant differences in resistance between: CT and DH (0.70 MPa), CT and CH (0.60 MPa), DH and SS (0.47 MPa), and CH and SS (0.36 MPa).
In all three study years, the CT processing showed lower compaction compared to the DH and CH processing systems, which is consistent with the results of [31], conducted at similar depths. The deep processing of SS, performed using a submersible with seven working bodies at a working depth of 50 cm, resulted in the lowest penetrometer resistances in all three study years, which is consistent with the results of [28,29].
Table 5. The influence of the tire pressure of a tractor on the mechanical resistance of the soil.
2017./2018. Maize (Zea mays L.)
Tire Pressure1st Measurement (Average Resistance—MPa)2nd Measurement (Average Resistance—MPa)3rd Measurement (Average Resistance—MPa)
p11.62 B2.44 AB2.95
p21.80 A2.53 A3.11
p31.71 AB2.26 B2.87
FP* (p < 0.05, F = 6.67)* (p < 0.05, F = 4.26)n.s. (p < 0.05, F = 2.48)
FP—F test tire pressure at sowing; *—statistical significance; n.s.—no statistical significance; values within the same columns, which are marked with different capital letters, differ statistically significantly at the level of p < 0.05.
Resistance in the 2nd year of maize planting was statistically significantly affected by tractor tire pressure at sowing in the first two measurements (as follows F = 6.67; F = 4.26; F = 2.48 n.s.).
The average resistance value of the 1st measurement was 1.28 MPa. The highest resistances were measured at p2, the lowest at p1, between which the only statistically significant difference was 0.18 MPa.
In the 2nd measurement, the average resistance was 2.41 MPa. The highest resistance of the penetrometer was measured at tire pressure p2 and the lowest resistance at tire pressure p3. The difference in resistances was statistically justified only between p2 and p3 and was 0.27 MPa.
The resistances at the 3rd measurement were not significantly affected by the tire pressure and averaged 2.98 MPa. The compaction at the third measurement in the second year was the same at all pressures. This uniformity of compaction at all applied tire pressures can be attributed to the optimum condition of soil moisture during tillage, sowing and at the time of penetrometer resistance measurement.
Table 6. Influence of the depth measurement on the mechanical resistance of the soil.
2017./2018. Maize (Zea mays L.)
Depth of Resistance Measurement1st Measurement (Average Resistance—MPa)2nd Measurement (Average Resistance—MPa)3rd Measurement (Average Resistance—MPa)
0–5 cm1.53 C1.59 D0.94 G
5–10 cm2.13 A2.13 C1.66 F
10–15 cm1.93 B2.31 BC2.30 E
15–20 cm1.79 B2.42 ABC2.92 D
20–25 cm1.63 BC2.58 AB3.43 C
25–30 cm1.54 C2.66 A3.95 AB
30–35 cm1.54 C2.77 A4.21 A
35–40 cm1.60 C2.80 A4.40 A
FD* (p < 0.05, F = 14.01)* (p < 0.05, F = 13.82)* (p < 0.05, F = 93.75)
FD—F test depth of penetrometry; *—statistical significance; n.s.—no statistical significance; values within the same columns, which are marked with different capital letters, differ statistically significantly at the level of p < 0.05.
Soil resistances in the 2nd year of observation was statistically significantly affected by measurement depth for all three measurements (as follows F = 14.01; F = 13.82.3; F = 93.75). The average resistance value was as follows: 1.71 MPa (1st measurement), 2.41 MPa (2nd measurement), 2.98 MPa (3rd measurement). The highest penetrometer resistance was measured at the 1st measurement at a depth of 5–10 cm, and at the 2nd and 3rd measurements at a depth of 35–40 cm.
Various studies have also found soil compaction in shallower layers under the influence of drought [32], which means that conserving moisture and reducing compaction by implementing conservation treatment systems (CH and SS) gains additional importance as a mitigation measure [7].
The average current soil moisture at a depth of 0–40 cm while performing each of the penetrometry in the third year of research was as follows: in the first measurement 15.08%, in the second measurement 18.81%.
Table 7. The influence of the tillage system on the mechanical resistance of the soil.
2018./2019. Winter Wheat (Triticum aestivum L.)
Tillage System1st Measurement (Average Resistance—MPa)2nd Measurement (Average Resistance—MPa)
CT3.10 C1.7 C
DH3.93 A2.45 A
CH3.49 B1.96 B
SS2.87 C1.38 D
FO* (p < 0.05, F = 29.76)* (p < 0.05, F = 110.21)
FO—F test tillage system; *—statistical significance; n.s.—no statistical significance; values within the same columns, which are marked with different capital letters, differ statistically significantly at the level of p < 0.05.
Resistance in the 3rd year of the experiment was significantly affected by tillage in both measurements (as follows F = 29.76; F = 110.21).
The average resistance value of the 1st measurement was 3.35 MPa. The highest resistances were measured with the DH and the lowest with the tillage system SS. The LSD test showed that the resistance on CT was 0.83 MPa lower than the resistance measured on DH and 0.40 MPa lower than CH. Soil resistance on the DH variant was 0.44 MPa higher than on CH and 1.06 MPa higher than on the tillage variant SS. The difference in soil resistance for the CH and SS variants was 0.62 MPa and was statistically significant.
The resistances of the 2nd measurement averaged 1.87 MPa. The highest resistance was measured for DH, and the lowest for tillage SS. Resistance differences between DH and CT (0.76 MPa), CH and CT (0.27 MPa), CT and SS (0.32 MPa), DH and CH (0.49 MPa), DH and SS (1.08 MPa), and CH and SS (0.59 MPa) were statistically significant. The lower soil resistance values in the second measurement were significantly influenced by the current soil moisture, which was 3.73% higher than in the first measurement.
Table 8. The influence of the tire pressure of a tractor on the mechanical resistance of the soil.
2018./2019. Winter Wheat (Triticum aestivum L.)
Tire Pressure1st Measurement (Average Resistance—MPa)2nd Measurement (Average Resistance—MPa)
p13.14 B1.69 C
p23.35 A1.89 B
p33.55 A2.03 A
FP* (p < 0.05, F = 7.81)* (p < 0.05, F = 20.23)
FP—F test tire pressure at sowing; *—statistical significance; n.s.—no statistical significance; values within the same columns, which are marked with different capital letters, differ statistically significantly at the level of p < 0.05.
Tire pressure had a significant effect on resistance in both measurements of the 3rd year of research (as follows F = 7.81; F = 20.23).
The average resistance value of the 1st measurement was 3.34 MPa. The highest resistances were measured at p3 and the lowest at p1. The LSD test showed that the resistance differences were statistically significant only between p3 and p1 (0.41 MPa) and p2 and p1 (0.21 MPa), while the resistance difference between p2 and p3 was not statistically significant.
The resistance value of the 2nd measurement of pressure influence averaged 1.87 MPa. The highest resistance was measured at p3, and the lowest resistance at p1. The differences in resistance with respect to tire pressure were significant. Soil resistance at p1 was 0.20 MPa lower than at p2 and 0.34 MPa lower than at p3. Soil resistance at variant p2 was 0.14 MPa lower than resistance at variant p3.
In both measurements of the third year of research, compaction under the influence of tire pressure was 13.2% higher than at pressure p1 in the first measurement and 20% higher in the second measurement, which corresponds to the results of the research of Parkhomenko et al. (2019) [29].
Table 9. Influence of the depth measurement on the mechanical resistance of the soil.
2018./2019. Winter Wheat (Triticum aestivum L.)
Depth of Resistance Measurement1st Measurement (Average Resistance—MPa)2nd Measurement (Average Resistance—MPa)
0–5 cm1.22 D1.04 C
5–10 cm2.60 C1.67 B
10–15 cm3.48 B1.94 A
15–20 cm3.93 A2.03 A
20–25 cm4.21 A2.08 A
25–30 cm4.16 A2.06 A
30–35 cm3.78 AB2.08 A
35–40 cm3.40 B2.07 A
FD* (p < 0.05, F = 68.37)* (p < 0.05, F = 35.51)
FD—F test depth of penetrometry; *—statistical significance; n.s.—no statistical significance; values within the same columns, which are marked with different capital letters, differ statistically significantly at the level of p < 0.05.
Soil resistances in the 3rd year of observation were statistically significantly affected by depth measurement in both measurements (as follows F = 68.37; F = 35.51). The average resistance value was as follows: 3.35 MPa (1st measurement) and 1.87 MPa (2nd measurement). The highest penetrometer resistance was measured at a depth of 20–25 cm in the 1st measurement, and at a depth of 20–25 cm and 30–35 cm in the 2nd measurement.
Under the treated layer in the DH treatment system at a depth of more than 15 cm, a sudden increase in resistance was observed in almost all measurements performed. The authors of [33] obtained similar results of penetrometer resistance at a depth of 25–30 cm (3.75 MPa), resulting from several years of tillage at the same depth. The same authors conduct research on the reduction in the depth of the basic tillage and the application of a disc harrow, which leads to an increase in resistance to 4.6 MPa (at a depth of 17.5–27.5 cm) over the multi-year observation period, as a result of the combination of two tillage bases (plowing and disc tillage), which was also the case in this study.

4. Conclusions

The applied tillage systems resulted in different soil compaction. The deepest tillage SS (undermining to a depth of 50 cm) achieved the lowest average resistance or compaction in all three study years. The highest penetrometer resistances were measured for DH tillage in all three years of observation (especially pronounced for the third measurement in the second and third years). The reason for this resistance to DH processing is the formation of a new machining base under the grip of the slab (below 15 cm depth) in combination with the base of conventional processing that was carried out in previous years.
In addition to the tillage system, soil compaction was also affected by differences in tractor tire pressure during sowing. Penetrometer measurements of compaction already in the first year show that the lowest tractor tire pressure p1 significantly affects the reduction in compaction. In the second year, relatively uniform penetrometer resistances were obtained, indicating that the agrotechnical work and measurements were carried out at optimal soil moisture. In the third year of observation, there is a significant increase in resistance at the highest observed tractor tire pressure p3, which also indicates that a decrease in tire pressure can affect the reduction in soil compaction.
In arable crops, a positive response of the soil to the tillage systems applied is expected, which was the case here. The use of an appropriate tillage system with regular monitoring of tire pressure during farm operations can be a more effective soil management practice to achieve optimal yields while preserving the soil as a resource.

Author Contributions

Conceptualization, R.B., K.M. and T.B.-L.; methodology, D.J. and L.Š.; investigation, R.B., T.B.-L. and D.Z.; resources, D.J.; data processing I.J.; writing—original draft preparation, R.B.; writing—review and editing, K.M. All authors have read and agreed to the published version of the manuscript.

Funding

University of Slavonski Brod and Brod-Posavina County (project: The influence of different methods of soil tillage and fertilization on the yield of field crops).

Institutional Review Board Statement

Not applicable.

Informed Consent Statement

Not applicable.

Data Availability Statement

Not applicable.

Acknowledgments

Authors express their sincere gratitude to owner of land and agricultural machinery OPG “Luka Kurkutović” for his generous help with the implementation of the research.

Conflicts of Interest

The authors declare no conflict of interest.

Appendix A

Figure A1. Tractor Massey Ferguson 8480 Dyna-VT (source: own photo).
Sustainability 15 10236 g0a1
Table A1. Basic technical characteristics of the tractor Massey Ferguson 8480 Dyna-VT.
Dimensions (length × width × height)523 cm × 307 cm × 309 cm
Mass9239 kg
Nominal power216.3 kW
Figure A2. Regent Titan 15 five-furrow plow (source: own photo).
Sustainability 15 10236 g0a2
Table A2. Technical characteristics of the plow Regent Titan 150.
Number of plow bodies5
Operation on the plow body29–60 cm
Figure A3. Disc harrow RAU Rondo XL 44 (source: own photo).
Sustainability 15 10236 g0a3
Table A3. Technical characteristics of the disc harrow RAU Rondo XL 44.
Broj sekcija2
The diameter of the disc66 cm
Number of discs44
Operation procedure5 m
Figure A4. Underminer Pegoraro MEGA DRAG 7 (source: own photo).
Sustainability 15 10236 g0a4
Table A4. Technical characteristics of the underminer Pegoraro MEGA DRAG 7.
Number of working bodies7
Working width270–345 cm
Required tractor power103–190 kW
Depth of loosening/undermining30–75 cm
Mass1420 kg
Figure A5. Rotary harrow Kongskilde HK 31 (source: own photo).
Sustainability 15 10236 g0a5
Table A5. Technical characteristics of the rotary harrow Kongskilde HK 31.
Operation procedure300 cm
Mass900 kg
The number of rotations of the rotor blades—adjustable270/360/400 min−1
Number of rotors with blades12
Equation (A1) Current soil moisture
M v = T m v T s T s · 100
Mv—current soil moisture in weight percent, (%);
Tmvwet soil mass, (kg);
Tsmass of completely dry soil, (kg).
Figure A6. Research scheme.
Sustainability 15 10236 g0a6

References

  1. Jug, D.; Blažinkov, M.; Redžepović, S.; Jug, I.; Stipešević, B. Effects of different soil tillage systems on nodulation and yield of soybean. Poljoprivreda 2005, 11, 38–43. [Google Scholar]
  2. Rasmussen, K.J. Impact of ploughless soil tillage on yield and soil quality. Soil Tillage Res. 1999, 53, 3–14. [Google Scholar] [CrossRef]
  3. Šumanovac, L.; Sebastijanović, S.; Kiš, D. Transport in Agriculture, 1st ed.; Faculty of Agriculture: Osijek, Croatia, 2011; pp. 156–178. [Google Scholar]
  4. Normirzayev, A.R.; Nuriddinov, A.D.; Tukhtabayev, M.A. Undercarriages impact on soil of machine-tractor units during tillage and cultivation of agricultural crops. AIP Conf. Proc. 2023, 2612, 030032. [Google Scholar] [CrossRef]
  5. Belić, M.; Nešić, L.; Ćirić, V. Practicum in Pedology; University of Novi Sad, Faculty of Agriculture: Novi Sad, Serbia, 2014. [Google Scholar]
  6. Bluett, C.; Tullberg, J.N.; McPhee, J.E.; Antille, D.L. Soil and Tillage Research: Why still focus on soil compaction? Soil Tillage Res. 2019, 194, 104282. [Google Scholar] [CrossRef]
  7. Jug, D.; Jug, I.; Đurđević, B.; Vukadinović, V.; Stipesević, B.; Brozović, B. Conservation Tillage as a Measure to Mitigate Climate Change, 1st ed.; Croatian Soil and Tillage Research Organization (CROSTRO): Osijek, Croatia, 2017. [Google Scholar]
  8. Benković, R.; Šumanovac, L.; Jug, D.; Jug, I.; Japundžić-Palenkić, B.; Mirosavljević, K.; Popijač, M.; Benković-Lačić, T. Influence of Aggregated Tillage Implements on Fuel Consumption and Wheel Slippage. Teh. Vjesn.—Tech. Gaz. 2021, 28, 956–962. [Google Scholar] [CrossRef]
  9. Peigné, J.; Ball, B.C.; Roger-Estrade, J.; David, C. Is conservation tillage suitable for organic farming? A review. Soil Use Manag. 2007, 23, 129–144. [Google Scholar] [CrossRef]
  10. Husnjak, S.; Filipović, D.; Košutić, S. Influence of different tillage systems on soil physical properties and crop yield. Plant Soil Environ. 2002, 48, 249–254. [Google Scholar] [CrossRef] [Green Version]
  11. Kotorová, D. The changes of clay-loamy soil properties at its different tillage. Agriculture 2007, 53, 183–190. [Google Scholar]
  12. Jug, D.; Jug, I.; Stipešević, B.; Stošić, M.; Brozović, B.; Đurđević, B. Influence of different soil tillage treatments on soil compaction and nodulation of soybean root. In Proceedings of the 1st International Scientific Conference-CROSTRO, Soil tillage, Osijek, Croatia, 9–11 September 2010; pp. 188–195, ISBN 978-953-6331-83-3. [Google Scholar]
  13. Wright, D.; Small, I.; Mackowiak, C.; Grabau, Z.; Devkota, P.; Paula-Moraes, S. Field Corn Production Guide. UF/IFAS Extension, SS-AGR-85. EDIS 2022, 2022, 1–13. [Google Scholar] [CrossRef]
  14. Srivastava, A.K.; Goering, C.E.; Rohrbach, R.P.; Buckmaster, D.R. Engineering Principles of Agricultural Machines, 2nd ed.; American Society of Agricultural Biological Engineers: St. Joseph, MI, USA, 2006; pp. 169–184. [Google Scholar]
  15. Atkinson, H.S.; Sparkes, D.L.; Mooney, S.J. Using selected soil physical properties of seedbeds to predict crop establishment. Soil Tillage Res. 2007, 97, 218–228. [Google Scholar] [CrossRef]
  16. Çarman, K. Effect of different tillage systems on soil properties and wheat yield in Middle Anatolia. Soil Tillage Res. 1997, 40, 201–207. [Google Scholar] [CrossRef]
  17. Ozpinar, S.; Cay, A. Effect of different tillage systems on the quality and crop productivity of a clay-loam soil in semi-arid north-western Turkey. Soil Tillage Res. 2006, 88, 95–106. [Google Scholar] [CrossRef]
  18. Rashidi, M.; Keshavarzpour, F. Effect of Different Tillage Methods on Grain Yield and Yield Components of Maize (Zea mays L.). Int. J. Agric. Biol. 2009, 9, 274–277. [Google Scholar]
  19. Moraru, P.I.; Rusu, T.; Bogdan, I.; Pop, A.I.; Sopterean, M.L. Effect of diferent tillage systems on soil properties and production on wheat, maize and soybean crop. Lucr. Stiintifice Ser. Agron. 2011, 54, 258–262. [Google Scholar]
  20. Li, Y.; Tullberg, J.; Freebairn, D. Wheel traffic and tillage effects on runoff and crop yield. Soil Tillage Res. 2007, 97, 282–292. [Google Scholar] [CrossRef]
  21. Dam, R.; Mehdi, B.; Burgess, M.; Madramootoo, C.; Mehuys, G.; Callum, I. Soil bulk density and crop yield under eleven consecutive years of corn with different tillage and residue practices in a sandy loam soil in central Canada. Soil Tillage Res. 2005, 84, 41–53. [Google Scholar] [CrossRef]
  22. Zheng, C.-Y.; Yu, Z.-W.; Shi, Y.; Cui, S.-M.; Wang, D.; Zhang, Y.-L.; Zhao, J.-Y. Effects of Tillage Practices on Water Consumption, Water Use Efficiency and Grain Yield in Wheat Field. J. Integr. Agric. 2014, 13, 2378–2388. [Google Scholar] [CrossRef] [Green Version]
  23. Håkansson, I.; Voorhees, W.B.; Riley, H. Vehicle and wheel factors influencing soil compaction and crop response in different traffic regimes. Soil Tillage Res. 1988, 11, 239–282. [Google Scholar] [CrossRef]
  24. Keller, T.; Arvidsson, J. Technical solutions to reduce the risk of subsoil compaction: Effects of dual wheels, tandem wheels and tyre inflation pressure on stress propagation in soil. Soil Tillage Res. 2004, 79, 191–205. [Google Scholar] [CrossRef]
  25. Botta, G.; Jorajuria, D.; Draghi, L. Influence of the axle load, tyre size and configuration on the compaction of a freshly tilled clayey soil. J. Terramechanics 2002, 39, 47–54. [Google Scholar] [CrossRef]
  26. HRN ISO 11464; Soil Qality, Pretreatment of Samples for Physico-Chemical Analyses. Croatian Standards Institute Zagreb: Zagreb, Croatia, 2004.
  27. ISO 11277; Soil Quality, Determination of Particle Size Distribution in Mineral Soil Material—Method by Sieving and Sedimentation. Polish Committee for Standardization: Warszawa, Poland, 2009.
  28. Negev, I.; Shechter, T.; Shtrasler, L.; Rozenbach, H.; Livne, A. The Effect of Soil Tillage Equipment on the Recharge Capacity of Infiltration Ponds. Water 2020, 12, 541. [Google Scholar] [CrossRef] [Green Version]
  29. Parkhomenko, G.G.; Voinash, S.A.; Sokolova, V.A.; Krivonogova, A.S.; Rzhavtsev, A.A. Reducing the negative impact ofundercarriage systems and agricultural machinery partson soils. IOP Conf. Ser. Earth Environ. Sci. 2019, 316, 012049. [Google Scholar] [CrossRef]
  30. Jakobsen, B.; Dexter, A. Prediction of soil compaction under pneumatic tyres. J. Terramechanics 1989, 26, 107–119. [Google Scholar] [CrossRef]
  31. Stošić, M.; Brozović, B.; Vinković, T.; Tkalec, K.M.; Šumanovac, L.; Tadić, V. Long-term tillage and nitrogen fertilization for soybean on gley soil. Rom. Agric. Res. 2020, 37, 151–160. [Google Scholar]
  32. Birkás, M.; Kisić, I.; Bottlik, L.; Jolánkai, M.; Mesić, M.; Kalmár, T. Subsoil Compaction as a Climate Damage Indicator. Agric. Conspec. Sci. 2009, 74, 91–97. [Google Scholar]
  33. Birkás, M.; Jolánkai, M.; Gyuricza, C.; Percze, A. Tillage effects on compaction, earthworms and other soil quality indicators in Hungary. Soil Tillage Res. 2004, 78, 185–196. [Google Scholar] [CrossRef]
Figure 1. Average precipitation and air temperature by dates of penetrometer measurement period.
Sustainability 15 10236 g001
Table 1. The influence of the tillage system on the mechanical resistance of the soil.
2016./2017. Soybean (Glycine max L.)
Tillage System1st Measurement (Average Resistance—MPa)2nd Measurement (Average Resistance—MPa)3rd Measurement (Average Resistance—MPa)
CT2.012.92 BC2.65 B
DH2.043.62 A2.97 A
CH1.933.06 B2.75 B
SS1.932.73 C2.35 C
FOn.s. (p < 0.05, F = 2.49)* (p < 0.05, F = 27.06)* (p < 0.05, F = 11.49)
FO—F test tillage system; *—statistical significance; n.s.—no statistical significance; values within the same columns, which are marked with different capital letters, differ statistically significantly at the level of p < 0.05.
Disclaimer/Publisher’s Note: The statements, opinions and data contained in all publications are solely those of the individual author(s) and contributor(s) and not of MDPI and/or the editor(s). MDPI and/or the editor(s) disclaim responsibility for any injury to people or property resulting from any ideas, methods, instructions or products referred to in the content.

