Article

Perceived Opportunities and Challenges of Autonomous Demand-Responsive Transit Use: What Are the Socio-Demographic Predictors?

1
School of Civil and Environmental Engineering, Queensland University of Technology, 2 George Street, Brisbane, QLD 4000, Australia
2
School of Architecture and Built Environment, Queensland University of Technology, 2 George Street, Brisbane, QLD 4000, Australia
*
Author to whom correspondence should be addressed.
Sustainability 2023, 15(15), 11839; https://0-doi-org.brum.beds.ac.uk/10.3390/su151511839
Submission received: 14 June 2023 / Revised: 17 July 2023 / Accepted: 19 July 2023 / Published: 1 August 2023
(This article belongs to the Special Issue Smart Technologies for Sustainable Urban and Regional Development)

Abstract

:
The adoption of autonomous demand-responsive transit (ADRT) to support regular public transport has the potential to enhance sustainable mobility. There is a dearth of research on the socio-demographic characteristics associated with perceived opportunities and challenges regarding ADRT adoption in Australia. In this research, we fill this knowledge gap by determining socio-demographic predictors of perceptions and attitudes towards ADRT, specifically autonomous shuttle buses (ASBs), among adult residents of South East Queensland. This study incorporates a review of prior global studies, a stated preference survey distributed across the case study region, and descriptive and logistic regression analysis. We found that the main perceived opportunity of ASBs is reduced congestion/emissions, while the primary anticipated challenge relates to unreliable technology. Fully employed respondents are likely to be more familiar with autonomous vehicles. Females and those from lower-income households are less likely to have ridden in an autonomous vehicle. Males, those who are younger, have high employment, hail from higher-income households, and with no driver’s licence are all more favourable towards ASBs. Males, those with high employment, and without driver’s licence are likely to be more concerned about traffic accidents when using ASBs. Less-educated respondents and those living in peri-urban areas are likely to be more concerned about fares. Insights are drawn from the current study to inform policymakers to consider key challenges (e.g., trust issues) and target groups (particularly females) in planning public communication strategies to enhance receptiveness to ADRT.

1. Introduction

Autonomous vehicles (AVs) have the potential to become a commonplace transport platform globally. However, the excessive or disorganised use of private AVs might increase traffic congestion and greenhouse gas emissions via several factors [1]. First, increased vehicle ownership and usage can result in the presence of more cars on the road, leading to overall higher vehicle miles travelled (VMT) and increased congestion. This increased traffic can lead to idling and stop-and-go driving, both of which contribute to higher emissions [2]. Second, autonomous vehicles may encourage longer trips and more single-occupancy journeys, as people may be more willing to tolerate longer commutes if they can work or relax while the vehicle drives itself. Additionally, the convenience and comfort offered by autonomous vehicles might reduce the appeal of public transportation, leading to a shift from shared mobility options to private vehicles [3]. Finally, while autonomous vehicles have the potential to improve fuel efficiency through better traffic flow and optimized driving patterns, the manufacturing and operational energy requirements, as well as the battery production and charging infrastructure, contribute to the life cycle emissions of these vehicles [4,5,6].
The multilevel aspect of electric vehicles (EVs) regarding sustainability and their life cycle encompass various stages from production to end-of-life management. While EVs contribute to reduced greenhouse gas emissions during operation, concerns arise from their assembly and disposal processes. At the production level, the extraction of raw materials such as lithium, cobalt, and rare-earth metals for battery production has environmental and social implications. Additionally, the energy-intensive manufacturing process and associated emissions involved during vehicle assembly need to be considered. Furthermore, the end-of-life management of EV batteries poses challenges due to their recycling, reusability, and potential environmental impacts if not properly handled. These multilevel aspects highlight the need for holistic approaches, including the sustainable sourcing of materials, efficient manufacturing processes, and effective recycling and disposal systems, to maximize the sustainability benefits of EVs while minimizing their environmental footprint [7,8].
The excessive or disorganised use of private AVs additionally has the potential to stimulate urban sprawl [9,10,11,12] by eliminating the stress of driving and enabling people to reside farther from their workplace, resulting in longer commuting distances and energy expenditure [13]. Thus, without careful planning and regulation, the unchecked proliferation and haphazard use of private autonomous vehicles can exacerbate greenhouse gas emissions. To minimise the detrimental effects, the widespread adoption of ridesharing using AVs should be publicly promoted to reduce traffic congestion by optimizing routes and minimizing empty trips towards creating a safer, more efficient, and sustainable transportation systems for the future [14,15].
Autonomous demand-responsive transit (ADRT) is a recently introduced public transit mode and is predominantly available using autonomous shuttle buses (ASBs) [14,15,16,17,18,19,20]. The implementation of ADRT has been stated as an applicable response to the climate change challenge [5]. ADRT has the potential to enhance mobility services and, as a result, enhance transit efficiency and reduce dependency on private vehicles [21,22]. As a feeder mode of regular public transit, ADRT could provide first-/last-mile services, supporting a transition to more sustainable mobility [11]. The use of ASBs with transport capacities of up to 15 persons enables reasonably cost-effective, flexible on-demand 24/7 operation [23]. The use of ADRT in a more dynamic, mixed-traffic environment is evolving quickly [24,25,26].
Attitude may be explained as “a mental state of readiness, positively or negatively associated with a particular object. It is acquired through experience and is a precursor of behaviour related to the object” ([27], p. 251). Individuals’ attitudes towards ADRT are crucial as they influence “the demand for the technology, governing policies and future investments in infrastructure” ([28], p. 38). Nevertheless, if ADRT is to be deployed widely and embraced as an everyday travel mode, positive public attitudes are necessary.
In the past, many researchers have investigated public perceptions towards opportunities and challenges for AVs [20,29,30,31,32,33,34,35], but few have focused on the Australian context [36,37,38,39,40,41,42,43]. There is a lack of research about how Australians’ socio-demographics affect their attitudes towards AVs, particularly ADRT. This study fills this research gap by fully classifying socio-demographic predictors of the publics’ attitudes towards ADRT in the specific context of the South East Queensland (SEQ) region of Australia. The research method is founded on an online stated preference survey distributed across more than 250 postcodes across the region, complemented by a wide-ranging review of prior global studies, and descriptive and ordinal/binary logistic regression analysis using SPSS v.27. This study tries to address the following research question.
-
How are individuals’ perceptions and attitudes towards ADRT influenced by gender, age, education, employment, income, household size, residential location, and having a driver’s license?
As a result, we shed more light on the social dynamics behind how potential adopters perceive different aspects of this innovative transit mode. The insights drawn from the current study may help alleviate concerns and encourage the future adoption of ASBs in this and other regions. Following this introduction, Section 2 provides an overview of relevant global studies. Section 3 explains the research method involving the questionnaire design, case study area, and the data collection process. Section 4 presents the descriptive statistics of the socio-demographic and attitudinal characteristics. Section 5 then describes the analysis method along with the detailed results. Section 6 discusses the findings and implications for the transition to ADRT. Section 7 provides concluding remarks, study limitations and suggestions for further research.

2. Literature Background

In this section, the study provides a concise review of the current literature on the association between attitudes towards ADRT, in particular ASBs, and the socio-demographic characteristics comprising gender, age, education, employment, income, household size, and residential location, adapting the reviews that were recently published in the AV context [14,27,44].
The literature on the subject of gender and attitude towards ADRT is mixed. According to Dong et al. [45] and Winter et al. [46], males have been demonstrated to be more open to using ASBs than females are, especially highly automated ASBs [47]. Other research reported that males are generally more willing to use autonomous transport services [48], preferring ASBs over traditional vehicles [49,50,51,52], and trust ASBs more than females do [53]. Similarly, males are found to be more confident to share a ride with strangers on ASBs than females are, but in terms of traffic safety or dealing with an emergency, there has been no major difference [19]. Females are less prone to believe that autonomous transit services are useful, and have more concerns about them [48]. Furthermore, females may prefer to use ASBs themselves rather than allow their partners or children to [46,54]. Nevertheless, Madigan et al. [55] and Nordhoff et al. [17,56] found no significant difference between males’ and females’ intention to use ASBs, and neither did Pakusch & Bossauer [57] in the autonomous transit context. No impact of gender was seen even when ASB service offerings were provided between transit hubs and parking lots or between the home and workplace [47].
Research findings on how age affects attitude and adoption are inconsistent. Some studies discovered no correlation between a person’s age and willingness to use ASBs [55,58,59,60] or other autonomous transit services [57], or even with the likelihood of preferring ASBs over other transport modes [50,51]. Similarly, Salonen [19] reported an insignificant effect of age on concerns about safety on-board, in traffic or an emergency, as did Dekker [53] regarding trust in ASBs. Even when ASBs offered mobility services between transit hubs and parking lots, or between the home and workplace, age was shown to not influence the willingness to use transit [27]. ASBs seemed to be more popular among young individuals [47]. According to Acheampong & Cugurullo [48], there is a negative relationship between age and favourable attitudes towards technology, the perceived benefits of or intent to use autonomous transit services. Those of ages between 18–35 were more likely to use ASBs than those over 45 years old [45]. Portouli et al. [61] found that frequent customers of ASBs were younger than non-users, contrary to Nordhoff et al. [17] who reported a higher acceptance of ASBs among older participants than among younger ones, though the former considered ASBs less efficient than their present transport mode.
Level of education was discovered to affect the intention to use ASBs [47], perceived usefulness, perceived ease of use, and willingness to use autonomous transit services [48]. ASBs were preferred by those with a higher education level over their traditional counterparts in some regions where ASBs were implemented in city centres [49,50,62]. In contrast, neither concerns about safety on-board, in traffic, nor an emergency seemed to be influenced by education levels [19], nor did trust in ASBs [53]. The impact of education level between frequent users of ASBs and those who had never used such modes was insignificant [61].
Employment was found not to affect preference for ASBs over their traditional counterparts [50], or concerns regarding safety on-board, in traffic or in an emergency [19]. Nevertheless, Portouli et al. [61] reported that students use ASBs more frequently than employees, unemployed persons, or retirees do. This might be attributed to the impact of ageing.
Household income was found not to affect preference for ASBs over their traditional counterparts [50], or willingness of using ASBs [60]. Similarly, Salonen [19] reported an insignificant effect of income on concerns about safety on-board, in traffic or in an emergency, as did Dekker [53] regarding trust in ASBs. Dong et al. [45] argued that a person’s greater income increases their intention to use ASBs, but only in the case of not considering the effect of AV knowledge.
Regarding residential location, some research stated that residents of densely populated regions have greater intentions to use ASBs at higher levels [47]. Rural and urban populations in Germany had equal intentions to use ASBs [60]. In contrast, US respondents were found to be more inclined to use ASBs than those in any of the other countries that were surveyed by Winter et al. [46]. Residents of areas with ASB services were shown to have more trust and intention to use ASBs than were residents of areas without ASB services in operation [53]. In a survey conducted on a German campus by Nordhoff et al. [17], campus workers regarded ASBs as being less efficient than their existing transit mode compared to non-campus workers. Contrary to parents in the US, parents in India were more open to the idea of their children riding in ASBs. However, residents and tourists in La Rochelle (France) and Lausanne (Switzerland) were equally open to the idea of using ASBs [58].
As noted, research findings differ concerning the influence of gender, age, education, employment, income and residential location on attitudes towards ADRT, and in particular ASBs. Such discrepancies might be due to variations in research “methodology (qualitative interview or an online survey; involving a shuttle trial or not), nature and size of study samples, usage contexts (campus, city centre or rural environment) or vehicle considered (shuttle, buses)” ([27], p. 268). Even though there are extensive detailed studies in this field, they have mostly focused on the US and European populations. The applicability of those findings to the Australian context, thus, is questionable. Empirical research is lacking for measuring public perceptions and attitudes towards ADRT in Australia, especially in the ASB context. Only a small number of individual characteristics have been explored, which restricts both the depth and breadth of our knowledge of the association between Australians’ socio-demographics and their perceptions and attitudes towards ADRT. Cross-national differences may obscure individual differences in attitudes towards and adoption of ASBs according to Kyriakidis et al. (2015). Further, prior findings indicate that the public’s perception towards AVs more generally varies between nations, namely between Australians [29] and others, highlighting the need for further study in the regional context.
The current research builds upon prior studies, not only by measuring perceptions and attitudes towards ADRT among adult residents of SEQ but also by carrying out an in-depth exploration of how those perceptions and attitudes are associated with particular socio-demographic characteristics.

3. Research Method

A stated preference survey was designed and implemented to investigate challenges and opportunities in the adoption of ADRT services by adult residents of the case study region. SEQ is a metropolitan region centred on Brisbane that has a land area of 35,248 km2 and a population of 3,817,573 million (2021). The per capita gross state product of Queensland is AUD 71,037 (USD 53,280) [63]. It has 12 adjoining local government areas (LGAs), where a LGA is a municipality administered by the third and lowest tier of government.
The survey respondent recruitment methodology involved only individuals living within the urban and peri-urban areas of SEQ (see Figure 1, highlighted in red and purple, respectively) including a total of 250 postcodes. Rural areas were excluded from the study because the implementation of this survey was not cost-efficient due to low density.
The questionnaire items were adapted and developed following a systematic literature review [14] to verify the content’s validity. Preliminary testing was conducted by surveying a group of higher-degree research students and the staff of the university because these people usually have broader knowledge regarding the application of surveys for reliable results. Preliminary and main survey participation was entirely voluntary. The final questionnaire was revised following the feedback provided by an expert supervisory panel review representing views of key informants in the field, specifically civil engineering and built environment academics specialising in transport systems and autonomous vehicles. The questionnaire consisted of three sections: (1) questions about the respondent’s socio-demographic characteristics, (2) questions relating to the respondent’s existing travel habits—such factors being worth mentioning in understanding the attitudes towards ASBs, and (3) attitudinal indicators contained to assess perceptions that might affect the adoption of ASBs. The related indicators were measured by applying a 5-point Likert scale owing to its widespread usage in the literature and its ease of use in analysis. For a clearer interpretation of the typical usage of ASBs to deliver ADRT, an introductory paragraph was included stating that “Autonomous shuttle buses are fully automated electrically powered vehicles which are being trialled in Australia including SEQ as a new travel mode. They can serve potentially similar markets to conventional shuttles and have similar passenger-carrying capacities. However, they are not driven by a person, instead, they are controlled by smart technology that safely optimises travel times, vehicle kilometres travelled, and energy consumption. They are expected to be in public use with a surveillance system on board in place of a human driver.” Two photos of ASB were also depicted at the beginning of the questionnaire (Figure 2).
The University Human Research Ethics Committee (UHREC RN: 2000000747) approved the final questionnaire, which was made available online for self-completion. To accommodate the limitations and risks posed by the COVID-19 pandemic, the researchers enlisted the services of Qualtrics, a professional web-based survey platform provider, to employ a convenient random sampling method in reaching the target respondents and gathering data for the study. Each potential respondent received an email containing the survey link to ensure broad public access during May 2021. The e-mail explicitly displayed a brief description of the academic purpose of the project and voluntary participation. The screening question ensured that only participants who were over 18 years old and residing in SEQ were asked to respond to the survey. Overall, 357 respondents finished the survey. Ultimately, after screening and cleaning the data, 300 responses with no missing values, invalid observations or outliers were deemed to be valid for further analysis. Based upon Krejcie and Morgan [65], a minimum sample size for a population above 1,000,000 (confidence = 95% and Margin of Error = 6%) is 300.

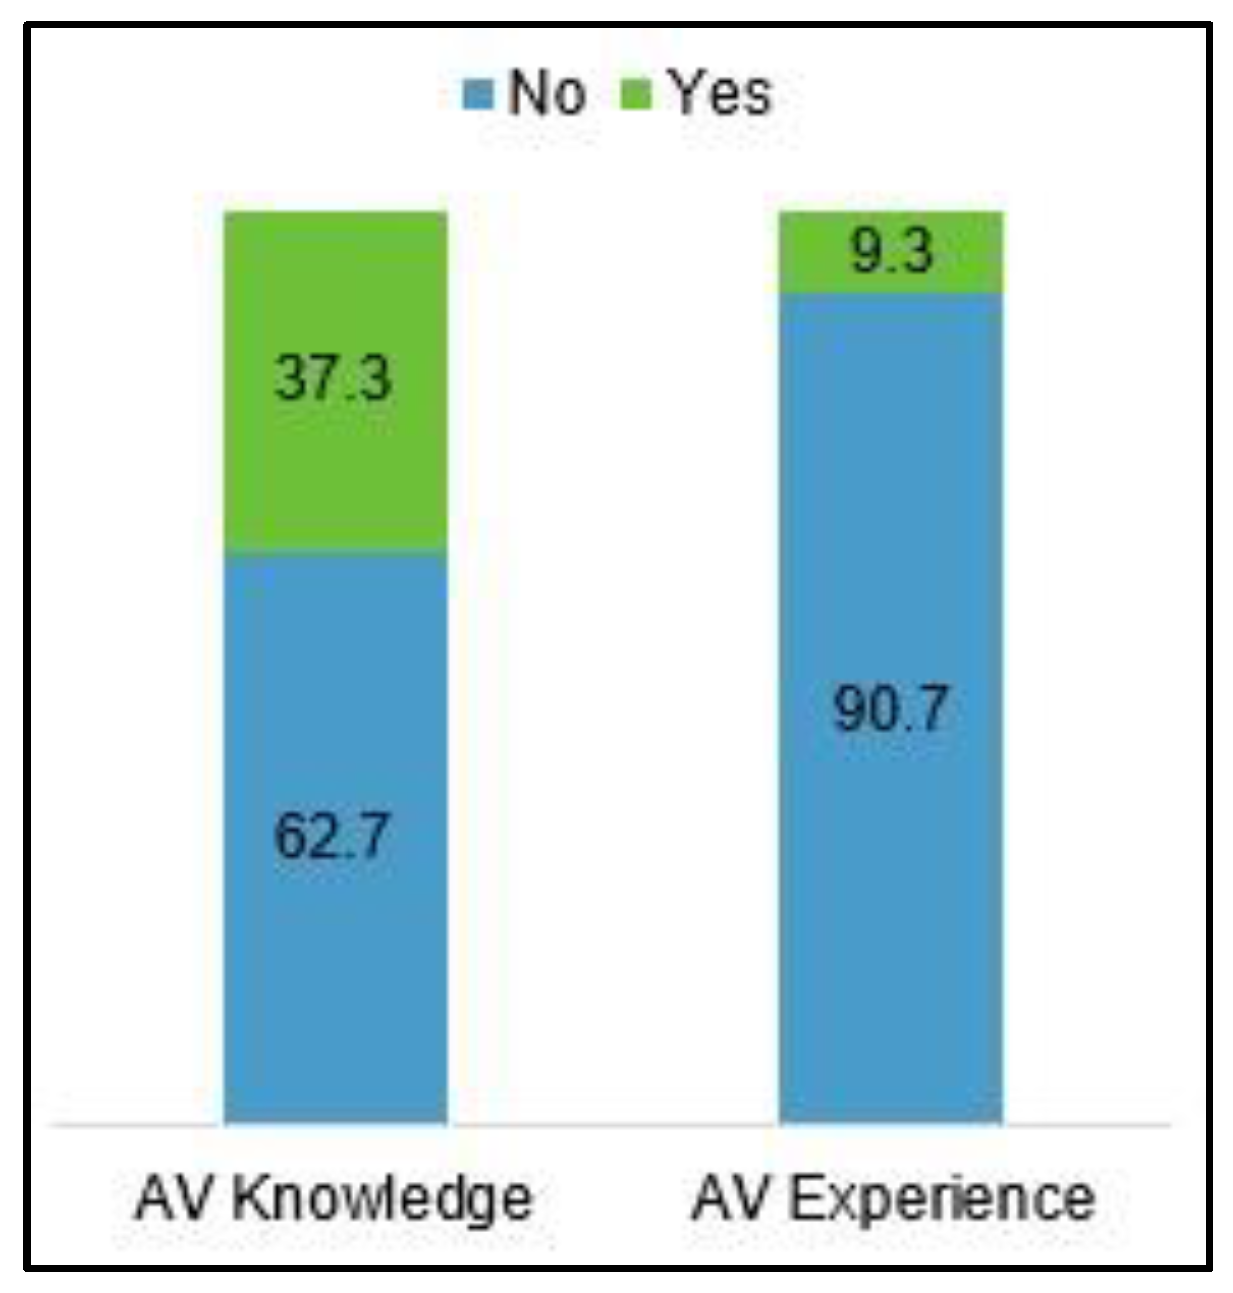
4. Descriptive Statistics

It is necessary to explore how the SEQ population is represented in our sample to fully understand both the background that yields the subsequent findings and the associated implications for the uptake of ADRT among Australians more broadly. The descriptive analysis was carried out using SPSS v.27 [66].

4.1. Socio-Demographic Characteristics

The analysis results identified a total of seven socio-demographic predictor variables associated with personal characteristics including gender, age, education, employment, household income, residential location, and household size. Figure 3 illustrates the distribution of each personal characteristic. The multicollinearity assessment results indicated that predictor variable inflation factors (VIFs) were all acceptable at a level of <2.50 [67].
Out of the 300 survey participants, the age group between 18 and 35 years old constituted the largest proportion at 36%. Respondents aged 36 to 50 years old accounted for 17.7% of the participants, while those aged 51 to 65 and over 66 years old represented 19.3% and 27%, respectively. The number of female respondents was nearly twice that of males (65% compared to 35%). Regarding education, 27.4% of participants held tertiary degrees and almost the same portion of them completed high school (36.3%) or a vocational certificate (36.3%). The retired, homemaker or not employed group accounted for 46% of respondents while part-time or casual employees accounted for 24% and full-time or self-employed (30%) individuals accounted for the remainder. The median and mode annual income bracket was AUD 52,000– AUD 77,999. The survey also showed that two-thirds of respondents (67%) were living in peri-urban areas, and most of them were from 2-person households (39.7%).
The distributions of existing travel characteristic response variables including (a) travel mode/frequency, (b) travel purpose/frequency, (c) driver’s license, (d) daily travel time, and (e) travel mode satisfaction are outlined in Figure 4. It can be seen that the most frequently used modes are walk, car, while the least frequently used modes are mobility scooter, motorcycle/moped, e-bike/e-scooter. The most popular transit modes are bus, train/tram, taxi, then ferry and conventional shuttle bus. Commercial vehicle and bicycle usages are similar. The majority of the survey participants hold a valid driver’s license. Almost the same portion of them had less than 30 min or 30 min–1 h of travel time. Only a small portion of them was neutral towards or dissatisfied with their current travel mode, while the rest were satisfied or very satisfied with it.
The summary of responses regarding exposure to AVs comprising AV knowledge and experience variables is shown in Figure 5. The AV knowledge variable was ordered in the following categorical range on the survey: not familiar, somewhat familiar, and very familiar. Only 8 responses were recorded in the last category, so it was determined that the re-coding of categories was appropriate. As can be seen, a percentage of the survey respondents were aware of AVs but very few of them had already used them.

4.2. Attitudinal Characteristics

Public attitude towards ASBs is a key factor that will shape the demand and market for them [61]. Since perception and attitudes “represent an individual’s latent beliefs and values and unlike observable variables cannot be directly measured. These latent constructs, however, influence an individual’s decision-making process” ([68,69], p. 242). Psychometric indicators could be used to identify latent constructs [69]. Response variables in our study, which require respondents to rate certain statements on a scale, are psychometric indicators. In the literature response, variables are self-developed or modified effective statements. For each factor, the frequencies in each category were inspected and all were maintained for ordinal logistic regression. Reliability was checked by determining Cronbach’s alpha (α) to assess the items’ internal consistency. Each scale’s Cronbach’s α value should be greater than 0.7 [70]. The overall Cronbach’s alpha was determined to equal 0.924 for perceived opportunities and 0.786 for perceived challenges, indicating strong consistency amongst all the response variables listed. The value of Cronbach’s alpha for each item if deleted implies that the omission of none of the items could have substantively increased the reliability of this part of the survey [71]; however, ‘Higher fare’ is less consistent than the others.
Public perception and attitudes towards ASBs were tested regarding the perceived opportunities and challenges of using ASBs compared to those of using conventional shuttles. The survey participants were presented with a list of opportunities to be expected by using ASBs. Their opinions on the agreement with the listed opportunities on the 5-point Likert scale ranging from ‘strongly disagree’ to ‘strongly agree’ are shown in Figure 6. The majority of the survey respondents gave responses ranging from neutral to agree, with each of the eight perceived opportunities listed. Of the opportunities that were agreed upon, the most appealing ones were ‘Less congestion/emissions’ (41%), and this was followed by ‘Easy to learn how to interact/travel’ (39%), and ‘Reduced fleet need’ (38%). The least appealing ones were ‘Safer’ (18%) and ‘More attractive’ (23%).
The survey participants were presented with a list of challenges relating to the use of ASBs. Their opinions regarding the concerns about the listed challenges on the 5-point Likert scale ranging from ‘very concerned’ to ‘not concerned’ at all are shown in Figure 7. The majority of the survey respondents were concerned to very concerned with all listed challenges. Of the challenges, the most concerning was ‘Unreliable technology’ (51.3% were concerned and 24.7% were very concerned), followed by ‘Malfunction’ (43% were very concerned and 40% were concerned), ‘Traffic accidents’ (38% were very concerned and 39% were concerned), and ‘Higher fare’ (44% were concerned and 18.7% were very concerned).
The survey participants’ intention to use ASBs if they become available is shown in Figure 8. More than two-thirds (38%) of the respondents stated that they would be happy to ride in ASBs that operate for special purposes, and about one-fifth (19%) did not consider using ASBs at all. Of the rest of the potential users of ASBs, 25% preferred to ride in ASBs that operate on all roads/streets, 10% preferred to ride on private streets, and 8% preferred to ride on local streets.

5. Findings and Implications for Transition to ADRT

Following the descriptive analysis of the survey, an ordinal logistic regression was employed using SPSS v.27 to develop a model to understand associations of the socio-demographic predictor variables for each response variable within each tabulated grouping of existing travel characteristics and attitudinal variables. The link function that was used was Logit. For this exploratory study of each response variable, a backward elimination method was used to obtain the parsimonious model using only the predictor variables that pass the threshold significance of 0.05 [72].
The next section presents the results of this modelling. For ordinal logistic regression and binary logistic regression, the omnibus test, like the likelihood-ratio chi-square test, is used to test whether or not the current model outperforms the null model as evidenced by p ≤ 0.05. For the ordinal logistic regression, the parallel lines test is used to test the null hypothesis that the slope coefficients in the model are the same across response categories, and therefore that the one-equation model is valid, as evidenced by p > 0.05, suggesting the model fits well [73,74,75].
In our evaluation, we characterise relatively the predictor variables’ odds ratios for decreasing odds: extremely strong > 0.2, 0.2 ≥ very strong > 0.4, 0.4 ≥ strong > 0.6, 0.6 ≥ moderate > 0.8, and 0.8 ≥ mild > 1.0. We use the inverses of these values for increasing odds [76,77,78]. Here, we present findings from our ordinal/binary logistic regression analysis.

5.1. Associations between AV Exposure and Socio-Demographic Predictor Variables

The results of the goodness of fit tests and statistics of the binary logistic regression models for these response variables are listed in Table 1.
Omnibus significance indicates that the AV knowledge model has a better fit than the intercept-only model. According to the odds ratio, evidence suggests that an increasing employment status across the scale from the retired, homemaker or not employed level to the full-time or self-employed level is strongly associated with an increase in the likelihood of having knowledge about AV.
The AV experience model has a superior fit to the intercept-only model. Evidence suggests the following effects in the likelihood of having experienced AVs of any kind. Being male is very strongly associated with an increase. Increasing household income across the scale from the Nil to the AUD 15,599 level to the AUD 104,000 or more level is extremely strongly associated with an increase.

5.2. Associations between Attitudinal Characteristics and Socio-Demographic Predictor Variables

The results of the goodness of fit tests and statistics of the ordinal logistic regression model for each remaining response variable are listed in Table 2. All the response variable models have a superior fit to the threshold-only models, while the proportional odds assumption appears to have held.
Regarding perceived opportunities and challenges, evidence suggests the following, discussed according to the response variable.
Overall, the information highlights the advantages of ASBs over conventional shuttles, including their efficiency, reduced traffic congestion and emissions, the presence of fewer driver errors, ease of learning, safety, attractiveness, and positive attitudes towards ASBs. For each of the following response variables, no model was found to be significant via regression using the socio-demographic predictor variables from Figure 6 of ‘Reduced fleet Need’, ‘Unreliable technology’, and ‘Malfunction’.
Individuals with lower employment levels tend to have less familiarity with autonomous vehicles (AVs). Therefore, it would be beneficial to explore ways to enhance their knowledge about AVs, especially if such an improvement can positively influence their willingness to adopt AVs when and where they are available. Additionally, females and individuals from lower-income households are less likely to have experienced riding in any type of AV. For these socio-demographic groups, it may be worthwhile to investigate methods of increasing exposure to autonomous shuttle buses (ASBs), such as through demonstrations, as increased exposure could potentially enhance their acceptance and the adoption of ASBs when and where they are deployed.
Male respondents exhibit a more favourable attitude towards ASBs, as do those who do not possess a driver’s license. Furthermore, younger respondents also demonstrate a more positive attitude towards ASBs. They perceive ASBs as more appealing, efficient, safe, and less congesting, with fewer emissions and driver errors compared to conventional shuttles. Younger respondents also believe that learning how to travel in an ASB is relatively easy. On the other hand, respondents with higher employment levels perceive ASBs as more attractive than conventional shuttles. Similarly, individuals from higher-income households hold a more positive attitude towards ASBs, perceiving them as more efficient and easier to learn how to use. These socio-demographic groups should be targeted to encourage the adoption of ASBs when and where they become available. For the socio-demographic groups that exhibit the opposite characteristics, it may be worthwhile to explore approaches to improve agreement regarding the benefits and opportunities associated with ASBs, as such improvements could enhance their willingness to adopt the use of these.
Respondents residing in peri-urban areas tend to be more concerned about fares when using ASBs compared to conventional shuttles. This concern is also observed among respondents with lower education levels. For both socio-demographic groups, it would be valuable to investigate whether or not fare structures based on spatial zones, time periods, and concession categories contribute to their concerns. Addressing these concerns related to fare structures, specifically in the context of ASB deployment, could help alleviate the worries and increase acceptance among these groups. Additionally, male respondents, those without a driver’s license, and individuals with higher employment levels are more concerned about traffic accidents when using ASBs compared to conventional shuttles. It is important to further explore how the automation of the driving task contributes to these perceived challenges and identify steps that can be taken to address these concerns specifically in the context of ASB deployment for these socio-demographic groups.
Addressing trust difficulties and worries about faulty technology can be carried out in several ways [79]:
  • Education and Awareness: Policymakers should implement education campaigns that explain how ADRT works, its benefits, and the safety measures put in place. Transparency about technology can help alleviate fears.
  • Regulation and Standards: Policymakers should establish stringent standards and regulations for ADRT systems. This would not only ensure safety but also promote public confidence in the technology.
  • Demonstrations and Trials: Public demonstrations or pilot programs can also help to increase public trust in ADRT. By seeing the technology in action and understanding its benefits first-hand, people might be more likely to trust and adopt it.
  • Addressing Equity Concerns: A significant subset of the population that might be sceptical about ADRT could be those who worry about access and equity, particularly if they live in underserved areas or have limited mobility. Policymakers need to assure these communities that ADRT will be accessible and affordable to all, not just a privileged few.
  • Stakeholder Involvement: Involving different stakeholders in the policymaking process can also build trust. This could include public forums or consultations where citizens can express their views and contribute to decision-making about ADRT.
  • Data Privacy and Security Measures: Given the digital nature of ADRT, data privacy and cybersecurity are crucial. Policymakers should define clear guidelines to protect user data and ensure that robust cybersecurity measures are in place.
The ultimate goal for policymakers should be to foster a favourable public opinion towards ADRT while ensuring safety, accessibility, and trust in the technology. They should continuously gauge public sentiment and address concerns proactively to promote widespread acceptance and adoption.

6. Conclusions

The implementation of autonomous demand-responsive transit (ADRT) as a feeder to regular public transit holds the potential to enhance the effectiveness of public transportation. While autonomous trains and trams are already widely integrated into public transit systems worldwide [57,80], the acceptability of pioneering ADRT services, such as autonomous shuttle buses (ASBs), raises questions and concerns. To address these issues, our study focused on understanding the social dynamics behind how different groups perceive ADRT mobility, specifically ASBs, in the SEQ region, Australia. By exploring the perceptions and attitudes of individuals based on factors such as gender, age, education, employment, income, household size, residential location, and the possession of a driver’s license, we gained insights into the opportunities and challenges associated with these innovative transportation services in urban areas.
The findings from the present study provide valuable insights for alleviating concerns and increasing the adoption of automated driving and ride-sharing technologies (ADRT) in the Southeast Queensland (SEQ) region. These insights can serve as a useful guide for planners, suppliers, and policymakers, helping them cater to the demands and preferences of current and potential users, considering the variations in socio-demographic characteristics.
Our findings revealed the following key points: (i) the primary perceived opportunity of ASBs was the potential to reduce congestion and emissions, while the main anticipated challenge was related to concerns about the reliability of the technology; (ii) fully employed respondents showed greater familiarity with autonomous vehicles (AVs), while females and individuals from lower-income households had less experience riding in any form of AV; (iii) male respondents, younger individuals, those with higher employment and incomes, and individuals without a driver’s license held a more favourable opinion of ASBs. Additionally, male respondents, those with higher employment and incomes, and those without a driver’s license expressed greater concern about traffic accidents when using ASBs. Less-educated respondents and individuals living in peri-urban areas were more concerned about fares.
We employed a methodological approach utilizing binary and ordinal logistic regression modelling to understand the significance of socio-demographic variables in predicting changes in travel characteristics. This approach, supported by odds ratios, allowed us to analyse how variations in socio-demographic factors affected the likelihood of changes in travel characteristics. By identifying significant predictor variables and their odds ratios for each travel characteristic, our methodology provided valuable insights to inform policies and practices in order to address key issues (e.g., safety concerns) and target specific groups (particularly females) when planning public communication strategies to enhance receptiveness to ADRT.
To promote the adoption and future uptake of ADRT, policymakers should focus on fostering favourable attitudes (e.g., highlighting perceived opportunities) and addressing existing unfavourable attitudes (e.g., addressing perceived challenges). Our findings emphasize the importance of avoiding pilot operations that lead to negative experiences and fail to meet mobility demands. Providing reliable, effective, and convenient ADRT services is crucial for alleviating prospective users’ concerns. Measures such as information screens and easy, obstacle-free access to vehicles can compensate for the absence of a driver, as suggested by Pigeon et al. [27]. In terms of deployment locations for ADRT, normal urban traffic conditions are currently perceived as less acceptable. Instead, deployment in secure contexts, such as dedicated routes, campuses, or areas with no existing public transport links such as peri-urban regions, is generally seen as desirable.

7. Limitations and Future Research

While conducting this research, certain simplifications were made, which may have resulted in limitations to the present study. Most survey respondents had no experience riding in an ASB, and thus some of our conclusions are based on prospective users’ perceptions (stated preference) rather than actual users’ opinions (revealed preference), which may limit their generalizability. Future research could include individuals who have used these services once they become available, as demonstrated by Dennis et al. [81] in their study on autonomous shuttles. Longitudinal studies exploring adoption attitudes over different time intervals could also provide valuable insights by recognizing patterns over time and identifying significant outcomes [28].
It is worth noting that our study, like most previous quantitative surveys, primed respondents by listing specific potential opportunities and challenges associated with ASBs before assessing their opinions. This approach may lead individuals to perceive these issues as potential problems, even if they have minimal influence on their decision to use ASBs. An alternative approach to enhance ASB adoption could prioritize communication on aspects of deployment that users consider more important, to alleviate existing concerns, rather than addressing perceived problems of low importance. To facilitate this, data collection procedures should allow respondents to proactively raise issues, rather than directing their attention to aspects of ASB deployment they may not have considered otherwise [38,39].
While the target respondents of our study were the public, it is important to acknowledge that the benefits of ADRT might be particularly significant for the transport-disadvantaged population. Further studies can focus on specific socio-demographic groups in more detail, such as elderly individuals and people with disabilities, to better understand their demands and challenges [27,44].
In future research, the methodology employed in this study can be replicated for the SEQ region. By comparing results between panel data, reasons for similarities and differences in travel characteristics over time can be investigated, particularly in response to geographical and socio-demographic shifts, as well as changes in policy and practice related to personal transport. This methodology is directly transferable to different regions, allowing for comparisons to identify similarities and differences in travel characteristics between different areas.
Further research will employ structural equation modelling with this dataset to gain deeper insights. Cross-referencing the results of this study will help determine the implications for each methodology and enable a comprehensive interpretation of findings. An extensive hypothesis testing approach is likely to benefit the analysis [82,83,84].

Author Contributions

Conceptualization, F.G., T.Y. and J.B.; methodology, F.G., T.Y. and J.B.; software, F.G.; validation, F.G. and J.B.; formal analysis, F.G.; data curation, F.G. and J.B.; writing—original draft preparation, F.G.; writing—review and editing, F.G., T.Y., A.P. and J.B.; supervision, F.G., T.Y., A.P. and J.B. All authors have read and agreed to the published version of the manuscript.

Funding

This research received no external funding.

Institutional Review Board Statement

The study was conducted in accordance with the Declaration of Helsinki, and approved by the QUT Human Research Ethics Committee (approval number 2000000747, Date 19 November 2020).

Informed Consent Statement

Informed consent was obtained from all subjects involved in the study.

Conflicts of Interest

The authors declare no conflict of interest.

References

  1. Golbabaei, F.; Yigitcanlar, T.; Bunker, J. The role of shared autonomous vehicle systems in delivering smart urban mobility: A systematic review of the literature. Int. J. Sustain. Transp. 2021, 15, 731–748. [Google Scholar] [CrossRef]
  2. Wadud, Z.; MacKenzie, D.; Leiby, P. Help or hindrance? The travel, energy and carbon impacts of highly automated vehicles. Transp. Res. Part A Policy Pract. 2016, 86, 1–18. [Google Scholar] [CrossRef] [Green Version]
  3. Harb, M.; Xiao, Y.; Circella, G.; Mokhtarian, P.L.; Walker, J.L. Projecting travelers into a world of self-driving vehicles: Estimating travel behavior implications via a naturalistic experiment. Transportation 2018, 45, 1671–1685. [Google Scholar] [CrossRef]
  4. Taiebat, M.; Brown, A.L.; Safford, H.R.; Qu, S.; Xu, M. A review on energy, environmental, and sustainability implications of connected and automated vehicles. Environ. Sci. Technol. 2018, 52, 11449–11465. [Google Scholar] [CrossRef] [PubMed]
  5. Nunes, A.; Woodley, L.; Rossetti, P. Re-thinking procurement incentives for electric vehicles to achieve net-zero emissions. Nat. Sustain. 2022, 5, 527–532. [Google Scholar] [CrossRef]
  6. Silva, Ó.; Cordera, R.; González-González, E.; Nogués, S. Environmental impacts of autonomous vehicles: A review of the scientific literature. Sci. Total Environ. 2022, 830, 154615. [Google Scholar] [CrossRef] [PubMed]
  7. Wu, Y.; Zhang, L. Can the development of electric vehicles reduce the emission of air pollutants and greenhouse gases in developing countries? Transp. Res. Part D Transp. Environ. 2017, 51, 129–145. [Google Scholar] [CrossRef]
  8. Vidhi, R.; Shrivastava, P. A review of electric vehicle lifecycle emissions and policy recommendations to increase EV penetration in India. Energies 2018, 11, 483. [Google Scholar]
  9. Fagnant, D.J.; Kockelman, K. Preparing a nation for autonomous vehicles: Opportunities, barriers and policy recommendations. Transp. Res. Part A Policy Pract. 2015, 77, 167–181. [Google Scholar] [CrossRef]
  10. Milakis, D.; van Arem, B.; van Wee, B. Policy and society related implications of automated driving: A review of literature and directions for future research. J. Intell. Transp. Syst. 2017, 21, 324–348. [Google Scholar] [CrossRef]
  11. Soteropoulos, A.; Berger, M.; Ciari, F. Impacts of automated vehicles on travel behaviour and land use: An international review of modelling studies. Transp. Rev. 2019, 39, 29–49. [Google Scholar] [CrossRef]
  12. Narayanan, S.; Chaniotakis, E.; Antoniou, C. Shared autonomous vehicle services: A comprehensive review. Transp. Res. Part C Emerg. Technol. 2020, 111, 255–293. [Google Scholar] [CrossRef]
  13. Spurlock, C.A.; Sears, J.; Wong-Parodi, G.; Walker, V.; Jin, L.; Taylor, M.; Todd, A. Describing the users: Understanding adoption of and interest in shared, electrified, and automated transportation in the San Francisco Bay Area. Transp. Res. Part D Transp. Environ. 2019, 71, 283–301. [Google Scholar] [CrossRef] [Green Version]
  14. Golbabaei, F.; Yigitcanlar, T.; Paz, A.; Bunker, J. Individual predictors of autonomous vehicle public acceptance and intention to use: A systematic review of the literature. J. Open Innov. 2020, 6, 106. [Google Scholar] [CrossRef]
  15. Paddeu, D.; Parkhurst, G.; Shergold, I. Passenger comfort and trust on first-time use of a shared autonomous shuttle vehicle. Transp. Res. Part C Emerg. Technol. 2020, 115, 102604. [Google Scholar] [CrossRef]
  16. Ainsalu, J.; Arffman, V.; Bellone, M.; Ellner, M.; Haapamäki, T.; Haavisto, N.; Åman, M. State of the Art of Automated Buses. Sustainability 2018, 10, 3118. [Google Scholar] [CrossRef]
  17. Nordhoff, S.; de Winter, J.; Madigan, R.; Merat, N.; van Arem, B.; Happee, R. User acceptance of automated shuttles in Berlin-Schöneberg: A questionnaire study. Transp. Res. Part F Traffic Psychol. Behav. 2018, 58, 843–854. [Google Scholar] [CrossRef] [Green Version]
  18. Rehrl, K.; Zankl, C. Digibus©: Results from the first self-driving shuttle trial on a public road in Austria. Eur. Transp. Res. Rev. 2018, 10, 51. [Google Scholar] [CrossRef]
  19. Salonen, A.O. Passenger’s subjective traffic safety, in-vehicle security and emergency management in the driverless shuttle bus in Finland. Transp. Policy 2018, 61, 106–110. [Google Scholar] [CrossRef]
  20. Mouratidis, K.; Cobeña Serrano, V. Autonomous buses: Intentions to use, passenger experiences, and suggestions for improvement. Transp. Res. Part F Traffic Psychol. Behav. 2021, 76, 321–335. [Google Scholar] [CrossRef]
  21. Millonig, A.; Fröhlich, P. Where Autonomous Buses Might and Might Not Bridge the Gaps in the 4 A’s of Public Transport Passenger Needs: A Review. In Proceedings of the International Conference on Automotive User Interfaces and Interactive Vehicular Applications, Toronto, ON, Canada, 23–25 September 2018. [Google Scholar]
  22. Nenseth, V.; Ciccone, A.; Kristensen, N.B. Societal Consequences of Automated Vehicles–Norwegian Scenarios; TØI Report (1700/2019); Institute of Transport Economics: Oslo, Norway, 2019. [Google Scholar]
  23. Nordhoff, S.; Stapel, J.; van Arem, B.; Happee, R. Passenger opinions of the perceived safety and interaction with automated shuttles: A test ride study with ‘hidden’ safety steward. Transp. Res. Part A Policy Pract. 2020, 138, 508–524. [Google Scholar] [CrossRef]
  24. Beiker, S.A. Deployment of automated driving as an example for the San Francisco Bay area. In Road Vehicle Automation 5; Springer: Cham, Switzerland, 2019; pp. 117–129. [Google Scholar]
  25. Stocker, A.; Shaheen, S. Shared automated vehicle (SAV) pilots and automated vehicle policy in the US: Current and future developments. In Road Vehicle Automation 5; Springer: Cham, Switzerland, 2019; pp. 131–147. [Google Scholar]
  26. Iclodean, C.; Cordos, N.; Varga, B.O. Autonomous shuttle bus for public transportation: A review. Energies 2020, 13, 2917. [Google Scholar] [CrossRef]
  27. Pigeon, C.; Alauzet, A.; Paire-Ficout, L. Factors of acceptability, acceptance and usage for non-rail autonomous public transport vehicles: A systematic literature review. Transp. Res. Part F Traffic Psychol. Behav. 2021, 81, 251–270. [Google Scholar] [CrossRef]
  28. Haboucha, C.J.; Ishaq, R.; Shiftan, Y. User preferences regarding autonomous vehicles. Transp. Res. Part C Emerg. Technol. 2017, 78, 37–49. [Google Scholar] [CrossRef]
  29. Schoettle, B.; Sivak, M. A Survey of Public Opinion about Autonomous and Self-Driving Vehicles in the US, the UK, and Australia; University of Michigan, Transportation Research Institute: Ann Arbor, MI, USA, 2014. [Google Scholar]
  30. Kyriakidis, M.; Happee, R.; de Winter, J.C.F. Public opinion on automated driving: Results of an international questionnaire among 5000 respondents. Transp. Res. Part F Traffic Psychol. Behav. 2015, 32, 127–140. [Google Scholar] [CrossRef]
  31. Bansal, P.; Kockelman, K.M.; Singh, A. Assessing public opinions of and interest in new vehicle technologies: An Austin perspective. Transp. Res. Part C Emerg. Technol. 2016, 67, 1–14. [Google Scholar] [CrossRef]
  32. König, M.; Neumayr, L. Users’ resistance towards radical innovations: The case of the self-driving car. Transp. Res. Part F Traffic Psychol. Behav. 2017, 44, 42–52. [Google Scholar] [CrossRef]
  33. Shabanpour, R.; Golshani, N.; Shamshiripour, A.; Mohammadian, A.K. Eliciting preferences for adoption of fully automated vehicles using best-worst analysis. Transp. Res. Part C Emerg. Technol. 2018, 93, 463–478. [Google Scholar] [CrossRef]
  34. Gkartzonikas, C.; Gkritza, K. What have we learned? A review of stated preference and choice studies on autonomous vehicles. Transp. Res. Part C Emerg. Technol. 2019, 98, 323–337. [Google Scholar] [CrossRef]
  35. Nastjuk, I.; Herrenkind, B.; Marrone, M.; Brendel, A.B.; Kolbe, L.M. What drives the acceptance of autonomous driving? An investigation of acceptance factors from an end-user’s perspective. Technol. Forecast. Soc. Chang. 2020, 161, 120319. [Google Scholar] [CrossRef]
  36. Regan, M.; Cunningham, M.; Dixit, V.; Horberry, T.; Bender, A.; Weeratunga, K.; Hassan, A. Preliminary Findings from the First Australian National Survey of Public Opinion about Automated and Driverless Vehicles. Transportation 2017. [Google Scholar] [CrossRef]
  37. Pettigrew, S.; Talati, Z.; Norman, R. The health benefits of autonomous vehicles: Public awareness and receptivity in Australia. Aust. N. Z. J. Public Health 2018, 42, 480–483. [Google Scholar] [CrossRef] [Green Version]
  38. Pettigrew, S.; Dana, L.M.; Norman, R. Clusters of potential autonomous vehicles users according to propensity to use individual versus shared vehicles. Transp. Policy 2019, 76, 13–20. [Google Scholar] [CrossRef]
  39. Pettigrew, S.; Worrall, C.; Talati, Z.; Fritschi, L.; Norman, R. Dimensions of attitudes to autonomous vehicles. Urban Plan. Transp. Res. 2019, 7, 19–33. [Google Scholar] [CrossRef] [Green Version]
  40. Ledger, S.A.; Cunningham, M.L.; Regan, M.A. Public Opinion about Automated and Connected Vehicles in Australia and New Zealand: Results from the 2nd ADVI Public Opinion Survey. In ADVI Australia and New Zealand Driverless Vehicle Initiative Project; 2018. 28th ARRB International Conference—Next Generation Connectivity. Available online: https://trid.trb.org/view/1987511 (accessed on 18 November 2022).
  41. Kaur, K.; Rampersad, G. Trust in driverless cars: Investigating key factors influencing the adoption of driverless cars. J. Eng. Technol. Manag. 2018, 48, 87–96. [Google Scholar] [CrossRef]
  42. Cunningham, M.L.; Regan, M.A.; Horberry, T.; Weeratunga, K.; Dixit, V. Public opinion about automated vehicles in Australia: Results from a large-scale national survey. Transp. Res. Part A Policy Pract. 2019, 129, 1–18. [Google Scholar] [CrossRef]
  43. Butler, L.; Yigitcanlar, T.; Paz, A. Factors influencing public awareness of autonomous vehicles: Empirical evidence from Brisbane. Transp. Res. Part F Traffic Psychol. Behav. 2021, 82, 256–267. [Google Scholar] [CrossRef]
  44. Nordhoff, S.; Kyriakidis, M.; van Arem, B.; Happee, R. A multi-level model on automated vehicle acceptance (MAVA): A review-based study. Theor. Issues Ergon. Sci. 2019, 20, 682–710. [Google Scholar] [CrossRef] [Green Version]
  45. Dong, X.; DiScenna, M.; Guerra, E. Transit user perceptions of driverless buses. Transportation 2017, 46, 35–50. [Google Scholar] [CrossRef]
  46. Winter, K.; Cats, O.; Correia, G.; van Arem, B. Performance analysis and fleet requirements of automated demand-responsive transport systems as an urban public transport service. Int. J. Transp. Sci. Technol. 2018, 7, 151–167. [Google Scholar] [CrossRef]
  47. Roche-Cerasi, I. Public acceptance of driverless shuttles in Norway. Transp. Res. Part F Traffic Psychol. Behav. 2019, 66, 162–183. [Google Scholar] [CrossRef]
  48. Acheampong, R.A.; Cugurullo, F. Capturing the behavioural determinants behind the adoption of autonomous vehicles: Conceptual frameworks and measurement models to predict public transport, sharing and ownership trends of self-driving cars. Transp. Res. Part F Traffic Psychol. Behav. 2019, 62, 349–375. [Google Scholar] [CrossRef] [Green Version]
  49. Alessandrini, A.; Alfonsi, R.; Site, P.D.; Stam, D. Users’ Preferences towards Automated Road Public Transport: Results from European Surveys. Transp. Res. Procedia 2014, 3, 139–144. [Google Scholar] [CrossRef] [Green Version]
  50. Alessandrini, A.; Delle Site, P.; Zhang, Q.; Marcucci, E.; Gatta, V. Investigating users’ attitudes towards conventional and automated buses in twelve European cities. Investig. Users’ Attitudes Towards Conv. Autom. Buses Twelve Eur. Cities 2016, 43, 413–436. [Google Scholar]
  51. Wien, J. An Assessment of the Willingness to Choose a Self-Driving Bus for an Urban Trip: A Public Transport User’s Perspective. Master’s Thesis, Delft University of Technology, Delft, The Netherlands, 2019. [Google Scholar]
  52. Winter, K.; Wien, J.; Molin, E.; Cats, O.; Morsink, P.; van Arem, B. Taking The Self-Driving Bus: A Passenger Choice Experiment. In Proceedings of the 2019 6th International Conference on Models and Technologies for Intelligent Transportation Systems (MT-ITS), Cracow, Poland, 5–7 June 2019. [Google Scholar]
  53. Dekker, M. Riding a Self-Driving Bus to Work: Investigating How Travellers Perceive ADS-DVs on the Last Mile. Master’s Thesis, Delft University of Technology, Delft, The Netherlands, 2017. [Google Scholar]
  54. Anania, E.; Rice, S.; Walters, N.; Pierce, M.; Winter, S.; Milner, M. The effects of positive and negative information on consumers’ willingness to ride in a driverless vehicle. Transp. Policy 2018, 72, 218–224. [Google Scholar] [CrossRef]
  55. Madigan, R.; Louw, T.; Wilbrink, M.; Schieben, A.; Merat, N. What influences the decision to use automated public transport? Using UTAUT to understand public acceptance of automated road transport systems. Transp. Res. Part F Traffic Psychol. Behav. 2017, 50, 55–64. [Google Scholar] [CrossRef]
  56. Nordhoff, S.; Van Arem, B.; Merat, N.; Madigan, R.; Ruhrort, L.; Knie, A.; Happee, R. User acceptance of driverless shuttles running in an open and mixed traffic environment. In Proceedings of the 12th ITS European Congress, Strasbourg, France, 19–22 June 2017. [Google Scholar]
  57. Pakusch, C.; Bossauer, P. User Acceptance of Fully Autonomous Public Transport. In Proceedings of the 14th International Joint Conference on e-Business and Telecommunications (ICETE 2017), Madrid, Spain, 24–26 July 2017. [Google Scholar]
  58. Madigan, R.; Louw, T.; Dziennus, M.; Graindorge, T.; Ortega, E.; Graindorge, M.; Merat, N. Acceptance of Automated Road Transport Systems (ARTS): An Adaptation of the UTAUT Model. Transp. Res. Procedia 2016, 14, 2217–2226. [Google Scholar] [CrossRef] [Green Version]
  59. Moták, L.; Neuville, E.; Chambres, P.; Marmoiton, F.; Monéger, F.; Coutarel, F.; Izaute, M. Antecedent variables of intentions to use an autonomous shuttle: Moving beyond TAM and TPB? Eur. Rev. Appl. Psychol. 2017, 67, 269–278. [Google Scholar] [CrossRef]
  60. Kostorz, N.; Hilgert, T.; Kagerbauer, M.; Vortisch, P. What do people think about autonomous minibuses in Germany. In Proceedings of the Symposium der European Association for Research in Transportation (hEART), Budapest, Hungary, 4–6 September 2019. [Google Scholar]
  61. Portouli, E.; Karaseitanidis, G.; Lytrivis, P.; Amditis, A.; Raptis, O.; Karaberi, C. Public attitudes towards autonomous mini buses operating in real conditions in a Hellenic city. In Proceedings of the 2017 IEEE Intelligent Vehicles Symposium (IV), Los Angeles, CA, USA, 11–14 June 2017; pp. 571–576. [Google Scholar]
  62. Alessandrini, A.; Delle Site, P.; Stam, D.; Gatta, V.; Marcucci, E.; Zhang, Q. Using Repeated-Measurement Stated Preference Data to Investigate Users’ Attitudes Towards Automated Buses Within Major Facilities. In Advances in Systems Science, Proceedings of the International Conference on Systems Science 2016 (ICSS 2016), Wroclaw, Poland, 7–9 September 2016; Springer International Publishing: Berlin/Heidelberg, Germany, 2016; pp. 189–199. [Google Scholar]
  63. Available online: https://www.abs.gov.au/statistics/economy/national-accounts/australian-national-accounts-state-accounts/latest-release (accessed on 18 November 2022).
  64. Mortoja, M.G.; Yigitcanlar, T. Public perceptions of peri-urbanism triggered climate change: Survey evidence from South East Queensland, Australia. Sustain. Cities Soc. 2021, 75, 103407. [Google Scholar] [CrossRef]
  65. Krejcie, R.V.; Morgan, D.W. Determining sample size for research activities. Educ. Psychol. Meas. 1970, 30, 607–610. [Google Scholar] [CrossRef]
  66. George, D.; Mallery, P. IBM SPSS Statistics 27 Step by Step: A Simple Guide and Reference, 17th ed.; Routledge: New York, NY, USA, 2021. [Google Scholar]
  67. Daoud, J.I. Multicollinearity and Regression Analysis. J. Phys. Conf. Ser. 2017, 949, 012009. [Google Scholar] [CrossRef]
  68. Ben-Akiva, M.; McFadden, D.; Gärling, T.; Gopinath, D.; Walker, J.; Bolduc, D.; Rao, V. Extended Framework for Modeling Choice Behavior. Mark. Lett. 1999, 10, 187–203. [Google Scholar] [CrossRef]
  69. Thapa, D.; Gabrhel, V.; Mishra, S. What are the factors determining user intentions to use AV while impaired? Transp. Res. Part F Traffic Psychol. Behav. 2021, 82, 238–255. [Google Scholar] [CrossRef]
  70. Pallant, J. SPSS Survival Manual: A Step by Step Guide to Data Analysis Using IBM SPSS; Routledge: New York, NY, USA, 2020. [Google Scholar]
  71. Briggs, S.R.; Cheek, J.M. The role of factor analysis in the development and evaluation of personality scales. J. Personal. 1986, 54, 106–148. [Google Scholar] [CrossRef]
  72. Bursac, Z.; Gauss, C.H.; Williams, D.K.; Hosmer, D.W. Purposeful selection of variables in logistic regression. Source Code Biol. Med. 2008, 3, 17. [Google Scholar] [CrossRef] [Green Version]
  73. Allison, P.D. Logistic Regression Using SAS: Theory and Application; SAS Institute: Singapore, 2012. [Google Scholar]
  74. Brant, R. Assessing proportionality in the proportional odds model for ordinal logistic regression. Biometrics 1990, 46, 1171–1178. [Google Scholar] [CrossRef]
  75. Liu, X. Applied Ordinal Logistic Regression Using Stata: From Single-Level to Multilevel Modelling; Sage Publications: Newbury Park, CA, USA, 2015. [Google Scholar]
  76. McHugh, M.L. The odds ratio: Calculation, usage, and interpretation. Biochem. Medica 2009, 19, 120–126. [Google Scholar] [CrossRef]
  77. Szumilas, M. Explaining odds ratios. J. Can. Acad. Child Adolesc. Psychiatry = J. L’academie Can. Psychiatr. L’enfant L’adolescent 2010, 19, 227–229. [Google Scholar]
  78. Norton, E.C.; Dowd, B.E.; Maciejewski, M.L. Odds ratios—Current best practice and use. JAMA 2018, 320, 84–85. [Google Scholar] [CrossRef]
  79. Golbabaei, F.; Yigitcanlar, T.; Paz, A.; Bunker, J. Navigating Autonomous Demand Responsive Transport: Stakeholder Perspectives on Deployment and Adoption Challenges. Int. J. Digit. Earth, 2023, in press.
  80. Fraszczyk, A.; Mulley, C. Public Perception of and Attitude to Driverless Train: A Case Study of Sydney, Australia. Urban Rail Transit 2017, 3, 100–111. [Google Scholar] [CrossRef] [Green Version]
  81. Dennis, S.; Paz, A.; Yigitcanlar, T. Perceptions and attitudes towards the deployment of autonomous and connected vehicles: Insights from Las Vegas, Nevada. J. Urban Technol. 2021, 28, 75–95. [Google Scholar] [CrossRef]
  82. Paz, A.; Arteaga, C.; Cobos, C. Specification of mixed logit models assisted by an optimization framework. J. Choice Model. 2019, 30, 50–60. [Google Scholar] [CrossRef]
  83. Golbabaei, F.; Yigitcanlar, T.; Paz, A.; Bunker, J. Understanding Autonomous Shuttle Adoption Intention: Predictive Power of Pre-Trial Perceptions and Attitudes. Sensors 2022, 22, 9193. [Google Scholar] [CrossRef] [PubMed]
  84. Beeramoole, P.; Arteaga, C.; Haque, M.; Pinz, A.; Paz, A. Extensive hypothesis testing for estimation of mixed-Logit models. J. Choice Model. 2023, 47, 100409. [Google Scholar] [CrossRef]
Figure 1. The map of the study area [64].
Sustainability 15 11839 g001
Figure 2. Introductory photos of ASBs presented to the survey participants regarding ADRT.
Sustainability 15 11839 g002aSustainability 15 11839 g002b
Figure 3. Demographic characteristics of SEQ respondents.
Sustainability 15 11839 g003
Figure 4. Summary of responses for travel characteristic variables.
Sustainability 15 11839 g004
Figure 5. Summarized AV knowledge and experience response variables.
Sustainability 15 11839 g005
Figure 6. Perceived opportunities of autonomous shuttle buses (ASBs) compared to conventional shuttles (%).
Sustainability 15 11839 g006
Figure 7. Perceived concerns of autonomous shuttle buses (ASBs) (%).
Sustainability 15 11839 g007
Figure 8. Autonomous shuttle bus (ASB) adoption choice.
Sustainability 15 11839 g008
Table 1. Significant binary logistic models of AV exposure to socio-demographic predictor variables.
Response Variable ModelOmnibus Sig.Predictor VariableStd. ErrorWald Sig.OROR 95% Wald C.I.
LowerUpper
AV Knowledge0.038Employment0.1400.0381.3351.0151.755
AV Experience0.002Gender (male)0.4080.0182.6351.1845.860
Household Inc.0.1420.0151.4111.0691.861
Table 2. Significant OLM of attitudinal characteristics to socio-demographic predictor variables.
Response Variable ModelOmnibus Sig.Parallel Lines Sig.Predictor VariableStd. ErrorWald Sig.OROR 95% Wald C.I.
LowerUpper
Perceived opportunities of ASBs
More efficient0.0000.541Age0.0870.0010.7420.6260.881
Household Inc.0.0660.0321.1531.0111.315
Household Inc.0.0680.0011.2631.1061.442
Less congestion and emissions0.0010.493Age0.0880.0010.7570.6370.899
Fewer driver errors0.0030.153Age0.0870.0040.7800.6580.924
Easy to learn how to interact/travel0.0000.783Age0.0880.0030.7700.6470.915
Household Inc.0.0680.0011.2631.1061.442
Safer0.0070.052Age0.0860.0080.7960.6740.939
More attractive0.0000.131Age0.0980.0000.7090.5840.861
Employment0.1380.0361.3371.0141.762
Drivers Lic (yes)0.3310.0090.4230.2210.809
Age0.0980.0000.6900.5700.834
Household Inc.0.0680.0241.1651.0201.331
More positive attitude0.0000.124Gender (male)0.2470.0401.6601.0182.708
Drivers Lic (yes)0.3310.0090.4230.2210.809
Age0.0980.0000.6900.5700.834
Household Inc.0.0680.0241.1651.0201.331
Perceived challenges of ASBs
Higher fare0.0080.529Res Location (peri-urban)0.2280.0441.5841.0122.479
Education0.1360.0310.7460.5710.973
Traffic accidents0.0030.472Gender (male)0.2270.0281.6471.0552.570
Drivers Lic (yes)0.3270.0370.5060.2670.959
OLM: ordinal logistic models; ASBs: autonomous shuttle buses; OR: odds ratio; C.I.: confidence interval.
Disclaimer/Publisher’s Note: The statements, opinions and data contained in all publications are solely those of the individual author(s) and contributor(s) and not of MDPI and/or the editor(s). MDPI and/or the editor(s) disclaim responsibility for any injury to people or property resulting from any ideas, methods, instructions or products referred to in the content.

