Article

Spatial and Temporal Evolutionary Characteristics of Vegetation in Different Geomorphic Zones of Loess Plateau and Its Driving Factor Analysis

1
State Key Lab of Ecological Water Resources in Northwest Arid Zone, Xi’an University of Technology, Xi’an 710048, China
2
Key Laboratory of National Forestry Administration on Ecological Hydrology and Disaster Prevention in Arid Regions, Xi’an University of Technology, Xi’an 710048, China
3
Intelligent Environmental Protection Integrated Command Center, Xi’an Bureau of Ecology and Environment, Xi’an 710024, China
4
Ningxia Soil and Conservancy Water Surveillance Station, Yinchuan 750000, China
5
China Institute of Water Resources and Hydropower Research, Beijing 100000, China
*
Author to whom correspondence should be addressed.
Sustainability 2023, 15(16), 12200; https://0-doi-org.brum.beds.ac.uk/10.3390/su151612200
Submission received: 9 July 2023 / Revised: 4 August 2023 / Accepted: 5 August 2023 / Published: 9 August 2023
(This article belongs to the Special Issue Soil Erosion and Water and Soil Conservation)

Abstract

:
Based on MODIS NDVI and a meteorological dataset, this study analyzed the spatial and temporal variation characteristics of vegetation cover in different geomorphic zones of Loess Plateau (LP) from 2000 to 2020 with trend analysis, partial correlation, residual analysis and the CA–Markov method and discussed the driving factors. The research results show that: (1) There are spatial differences in vegetation coverage in different geomorphic regions. The Loess Hills and Forests zone (LF) exhibits the highest coverage, with a multi-year average of 86.64%, and the Arid Grassland (AG) has the poorest vegetation with only 8.53%. Overall, there has been significant improvement in vegetation coverage over the past two decades, although certain geomorphic zones, particularly the Highland Steppe zone (HS) and Alluvial Plains zone (AP), show signs of degradation. (2) Relative humidity has the greatest impact on vegetation among the three climate factors, i.e., relative humidity, precipitation and temperature. Relative humidity predominantly promotes vegetation in all geomorphic zones. Temperature generally inhibits vegetation growth, except in the Wind Sandy zone (WA) and AG. The impact of precipitation on vegetation depends on the region. A lag effect is observed, with temperature and humidity showing a one-month lag and precipitation showing a two-month lag on vegetation response. (3) Human activities play a crucial role in promoting vegetation, particularly in the WA zone, in which the percentage of area where human activities contribute to vegetation has changed from 13.80% to 86.85%, an increase of 73.05%, while the HS experiences an inhibitory effect due to overgrazing and water resource overutilization. Similarly, the AP zone’s vegetation growth is hindered by urban development and land use changes. (4) Land use change significantly impacts vegetation dynamics on the LP. Over the past two decades, the area of forest lawn increased by 122,800 km2, which is 1.5 times more than the area of reduction. However, conversion to building land has hindered vegetation growth in certain regions. A comprehensive strategy is required to conserve land resources and promote healthy vegetation growth on the LP.

1. Introduction

Vegetation that links elements like soil, atmosphere and water is a significant part of the Earth’s ecosystem, playing an essential function in climate control and maintenance of biodiversity [1]. Currently, global warming is accelerating, regional climates are changing and human activities are intensifying [2,3], thus vegetation has changed significantly in recent decades. Monitoring vegetation dynamics and exploring vegetation growth have become hot issues of continuous concern in global change research [4,5,6]. Vegetation plays a vital role in soil erosion control and ecosystem restoration in fragile semi-arid and arid regions, but it is susceptible to climate change and human activities [7,8]. Thus, quantifying changes in vegetation across vulnerable areas in both space and time is crucial. By assessing the future evolution of vegetation, potential impacts and implementation of appropriate measures for sustainable management and conservation can be explored.
LP is the world’s most concerning soil erosion area, and the ecological environment is quite fragile [9]. With the implementation of ecological construction measures like returning farmland to forest and grass, vegetation in the area has been obviously enhanced. Numerous scholars have conducted a lot of research on the spatial and temporal changes in vegetation on the LP and its influencing factors [10,11]. He et al. [12] analyzed the characteristics of the spatial and temporal vegetation evolvement and its drivers in the LP over the last 20 years and found that the main factor of vegetation growth in the LP was human exposure; Jia et al. [13] quantitatively assessed the topographic as well as climatic effects on vegetation of arsenic sandstone areas on the LP based on NDVI time series and found that spatial and temporal variation in precipitation was the main cause of vegetation variation in arsenic sandstone areas, with the most favorable vegetation at elevations of 1050–1500 m and slopes of 0–21°. Fan et al. [14] fused GIMMS NDVI with MODIS NDVI to build an NDVI with high space resolution and found that human activities make a greater contribution to the NDVI of the Loess Plateau than the climatic factors. Most current studies on vegetation variations of the LP have focused on spatiotemporal changes in vegetation across the region or in a single geomorphic area, neglecting the differences in vegetation variation among different geomorphic types. The influencing climatic factors are often limited to temperature and precipitation, moreover, the time lag effects of these climatic factors are not adequately considered. Furthermore, most of the present research on the vegetation of the LP focuses on past and present changes, while the future evolution of forest and grass vegetation on the LP is less considered.
The objectives of this study are as follows: (1) To clarify the spatiotemporal variation trends of vegetation in different geomorphic zones on the LP. (2) To evaluate the impacts of climate change and human activities on vegetation growth in the region. (3) To discuss the future evolution scenarios of vegetation on the LP. This study is based on the normalized difference vegetation index (NDVI) data of the LP from the growing seasons of 2000 to 2020, and NDVI is currently recognized as the best indicator for large-scale monitoring of terrestrial vegetation change [15,16]. It employs methods such as Mann–Kendall trend analysis, Sen’s slope estimator, Hurst index, partial correlation and residual analysis to analyze the spatiotemporal evolution characteristics of vegetation in different geomorphic zones of the LP and their response to climate change and human activities. The CA–Markov model is further utilized to discuss the future evolution scenarios of vegetation on the LP. By addressing these challenges, the study aims to promote a comprehensive understanding of the dynamic changes in vegetation on the LP and provide insights for sustainable management and conservation strategies.

2. Study Area and Data Sources

2.1. Study Area

The LP is geographically situated in the northwestern part of China, exhibiting a pronounced topographic heterogeneity with high elevations in the northwest and low elevations in the southeast. The region is characterized by diverse and intricate landforms, encompassing ravines and fragmented terrains. Climatically, the LP is classified as a continental monsoon climate, with an average temperature spanning from 9 to 12 °C. The average precipitation displays a distinct northwest-to-southeast gradient, ranging from 100 to 800 mm. Most precipitation occurs from June to September, coinciding with the summer monsoon season [17]. LP landforms are complex and diverse, including Loess Hills and Gullies (LH), Loess Plateau and Gullies (LG), Tu Shi Shan (TS), Loess Hills and Forests (LF), Highland Steppe (HS), Arid Grassland (AG), Wind Sandy Area (WA), Alluvial Plains (AP) and Loess Terraces (LT), a total of nine types of area (Figure 1) [18].

2.2. Data

NDVI data were selected from MOD13Q1 products for the 2000–2020 growing seasons (April–October), sourced from NASA (https://ladsweb.modaps.eosdis.nasa.gov/, accessed on 1 May 2023), temporal resolution 16d, spatial resolution 250 m. In this study, we performed batch band extraction, format conversion and maximum synthesis to obtain monthly and annual scale maximum NDVI datasets and resampled the datasets to a 1 km resolution. Data for precipitation, temperature and relative humidity were sourced from the National Center for Earth System Science Data (http://www.geodata.cn, accessed on 2 May 2023) at a spatial resolution of 1 km. The dataset underwent rigorous validation through comparison with data collected from 496 independent meteorological observation points nationwide, ensuring its reliability. Land use data were collected from the Institute of Geographic Sciences and Natural Resources, Chinese Academy of Sciences (https://www.resdc.cn/, accessed on 2 May 2023) at a resolution of 1 km.

3. Research Methods

3.1. Savitzky–Golay Filter

The S-G filter [19] was first introduced by Savitzky and Golay and then widely used as an algorithm for smoothing time series data. S-G filtering is a polynomial fitting method based on least squares, where a polynomial weighted fit is made to the data to be processed through a window of a certain length, followed by a minimum root mean square error, with the following equation:
N D V I i * = j = m j = m C j N D V I j + 1 N
N is the window size, satisfying N = 2m + 1; Cj denotes the coefficient of the S-G polynomial fit; m is the half-window size and d is the number of polynomial terms fitted.
The remote sensing data time series will have some noise due to the influence of clouds, fog and atmospheric conditions. To reduce the noise impact, this study adopts S-G filtering to filter and denoise the NDVI products of MODIS 2000–2020 of the LP. The best fitting effect was achieved after 9 iterations in the filtering process, and the polynomial order of the filtering parameters was set to 3.

3.2. Forest and Grass Vegetation Coverage

In this study, the vegetation cover is estimated using a like-element dichotomous model, calculated as follows [20]:
F V C = N D V I N D V I 0 N D V I V N D V I 0
FVC indicates the vegetation coverage, and this study takes 5% and 95% of NDVI values as NDVI0 and NDVIv. The vegetation coverage of image elements with NDVINDVI0 is 0, and the vegetation coverage of image elements with NDVINDVIv is 1. To mitigate the impact of water bodies and clouds on the values of NDVI0 and NDVIv, among others, this study incorporates de-clouding and de-watering techniques during the calculations.

3.3. Trend Analysis

The Theil–Sen median method is a robust trend calculation method with nonparametric statistics [21]. The method is computationally efficient and suitable for trend analysis of long time series data [22]. Its calculation formula is:
β = M e d i a n X j X i j i j > i
where: Median() represents taking the median value, if β > 0, it indicates that FVC has a growing trend and vice versa is a decreasing trend.
The Mann–Kendall (MK) test is a nonparametric time series trend test for long-term series data with a significant trend. The test statistic S is calculated as:
S = i = 1 n 1 j = i + 1 n sgn X j X i
where: sgn() is the symbolic function with the following formula:
sgn X j X i = 1       X j X i     > 0         0       X j X i = 0         1 X j X i < 0
The trend test is performed using the test statistic Z. The formula for the value of Z is as follows:
Z = S V a r S                                             S > 0 0                                                       S = 0                           S + 1 V a r S                                             S < 0
where the equation for Var is:
V a r S = n n 1 2 n + 5 18
where: n is the number of data in the sequence;
A bilateral trend test was used, and given a significance level α = 0.05 in this manuscript, the critical value Z1-α/2 = ±1.96. When the absolute value of Z is greater than 1.96, it means that the trend passed the significance test with a confidence level of 95%. The method of determining the significance of the trend is shown in Table 1. In this manuscript, the change trends are classified into four types of changes: Slight degradation, severe degradation, slight improvement and significant improvement [23].
The Hurst index [24] (H) is widely used to quantitatively describe the time series change persistence, and the index reflects the interrelationship between the vegetation before and after changes, in which the past vegetation state will affect the present and the present vegetation state will affect the future [25]. The main formula is as follows:
R τ S τ = a τ H
H < 0.5 indicates that the FVC has the opposite trend from the current one. H = 0.5 indicates that the FVC series is an unsustainable random series. H > 0.5 indicates that the future trend of the FVC series is the same as the current one [26].

3.4. Partial Correlation Analysis

Since there are many factors affecting vegetation, biased correlation analysis was employed to more accurately measure the association among several factors; the partial correlation coefficient R can be calculated by the simple correlation coefficient [27]:
R x y = i = 1 n x i x ¯ y i y ¯ i = 1 n x i x ¯ 2 i = 1 n y i y ¯ 2
Rxy denotes the single correlation coefficient; xi in this study denotes the FVC value in the growing season; yi denotes the cumulative precipitation or average annual temperature or relative humidity in the corresponding time period; x denotes the average FVC value from 2000 to 2020; y indicates the accumulated precipitation, the average temperature or relative humidity for the respective time period.
R x y , z = R x y R x z R y z 1 R x z 2 1 R y z 2
R x y , z w = R x y , z R x w , z R y w , z 1 R x w , z 2 1 R y w , z 2
Rxy,zw are the coefficients of partial correlation R required in this study.

3.5. Residual Analysis

The effect of human intervention on vegetation change was assessed using the residual method in this study [28,29]. The observed values were first calculated using the relationship between FVC and climate, the actual values were subtracted from the observed values and the result was the effect of human activities on FVC [30]. Given the delayed effect of vegetation response to climate, correlation analysis was used to derive the correlation coefficients among FVC and climate factors of the same period and the previous 1–3 months, and the climate factor of the period with the strongest correlation with FVC was selected to participate in the calculation.
F V C c c = a + b * P + c * T + d * R H + e
F V C H A = F V C o b s F V C c c
a, b, c, d and e are parameters; P is accumulated precipitation (mm); T is average temperature (°C); RH is relative humidity (%).

3.6. CA–Markov Model

The CA model [31] is a grid statistical dynamical model based on transformation rules to simulate the spatiotemporal evolution process of compound phenomena, which has strong spatial calculation ability but is only able to deal with the interaction between metacells; the Markov model [32] can predict quantitative changes in land use types over a period of time but is unable to handle changes in spatial patterns. The CA–Markov method incorporates the characteristics of both models, combining CA’s ability to deal with complex systems varying in space and Markov’s characteristics in predicting land quantity, to achieve the prediction of the future dynamic evolution of each category on the LP in both space and time [33].

4. Results

4.1. Analysis of Vegetation Stage Changes

Research shows that FVC will stabilize for regional runoff and erosion when greater than 60%, while erosion will increase sharply when FVC is less than 30% [34]. In this study, FVC is classified into three levels: Low vegetation cover (FVC < 30%), medium vegetation cover (30% ≤ FVC < 60%) and high vegetation cover (FVC ≥ 60%).
The spatial distribution of the LP multi-year average FVC is significantly different, with an overall increasing process from north to south. The area of low FVC area is 254,600 km2, accounts for 41.73% of the total area of LP. The medium vegetation cover area is 195,100 km2, accounting for 31.98%, mainly distributed in the south of the LP and gullies and the west of HS. The area covered by high vegetation is 160,400 km2 or 26.29%, mainly in the southern part of LF, part of LG and the northwestern part of HS (Figure 2).
The overall vegetation in the LP exhibited an upward trend from 2000 to 2020, the average FVC of the LP increased from 36.27% to 45.17% from 2016–2020 compared with 2000–2005 (Figure 3). The area with medium to high vegetation cover witnessed a notable increase from 49.49% to 66.90%, due to a range of ecological restoration programs implemented by the Chinese government since 1999 (Figure 3). FVC varies greatly in different geomorphic subdivisions, with the largest FVC in the LF, with a multi-year average of 86.64%, and the AG has the poorest vegetation with only 8.53%. Despite overall improvement in vegetation across the LP, there are specific areas that have experienced vegetation degradation. For instance, the average FVC in the HS decreased from 65.94% in the 2000–2005 period to 64.43% from 2016–2020. Similarly, the AP witnessed a decline in average FVC from 31.96% to 30.77% (Figure 4).

4.2. Changes in Vegetation Trends and Zoning Differences

Vegetation enhancement on the LP from 2000 to 2020 is 406,300 km2, accounting for 62.40%, among which the significant improvement area is 273,800 km2, accounting for 42.05%. Vegetation trends vary across geomorphic subdivisions, among which most of the geomorphic subdivisions are dominated by vegetation improvement but some subdivisions are dominated by degradation trends. The most significant vegetation improvement was observed in LH, LG and WA, with three geomorphic divisions showing more than 60% significant improvement in vegetation. HS shows degradation trends accounting for 61.21% of the total area of the subdivision, and 11.49% of the area shows serious degradation trends. The AG vegetation degradation area accounts for 60.06% of the total area of the subdivision. LF vegetation cover is high, but 54.01% of the area showed a degradation trend (Figure 5, Table 2). The Hurst index for FVC in the LP between 2000 and 2020 varies between 0.08 and 0.94, with a value of 0.44 on average, with surfaces with a Hurst value less than 0.5 accounting for 73.50%, which indicated that the vegetation of the LP might show the opposite situation of the current change trend in the future (Figure 6).

4.3. Analysis of Vegetation Response to Climatic Factors

From 2000 to 2020, precipitation, temperature and relative humidity on the LP have increasing trends, with the average change rates of 2.960 mm/a, 0.012 °C/a and 0.262%/a (Figure 7). On the LP, the average cumulative precipitation during the growing season is 421.10 mm, with an average temperature of 15.58 °C and relative humidity of 53.33%. These climatic conditions play a crucial role in shaping the growing environment and influencing vegetation dynamics in the region. The spatial distribution of all three climate factors is “low in the north and high in the south” (Figure 8). The variability of climatic factors in different geomorphic divisions is large, with the lowest average multi-year precipitation of 266.91 mm in the AG and the most precipitation in LT with an average multi-year precipitation of 554.51 mm; the lowest average growing season temperature is 5.72 °C in the HS, and the highest temperature is 20.13 °C in the LT. The division with the highest relative humidity is the LF with 67.82%, and the AG has the lowest relative humidity, with a multi-year average of only 37.56%. Among the geomorphic subdivisions, the average FVC is greater than 60% and high vegetation cover is achieved in the LF and HS, respectively, which have a precipitation of 521.40 mm and 551.16 mm, a temperature of 16.03 °C and 5.72 °C and a relative humidity of 67.82% and 65.89%, respectively, for the same period. An FVC less than 30% and low vegetation cover are found in AG, WA and AP and, compared with the high vegetation cover zone, the climate factors of these three zones show less precipitation, higher temperature, lower relative humidity and a larger difference (Table 3).
The partial correlation coefficients (R) between vegetation and contemporaneous precipitation, temperature and relative humidity in the growing season of the LP were calculated to quantify interrelationships among vegetation cover dynamics and climatological factors. On the LP, the regions that showed significant correlation between relative humidity and vegetation accounted for 54.65% of the total area. Among these significantly correlated areas, approximately 79.69% of the area shows a significant promotion effect of relative humidity on vegetation. This indicates the important role played by relative humidity in promoting vegetation growth on the Loess Plateau (Figure 9C). The portion of the LP where vegetation exhibits a significant correlation with precipitation covers only 8.41% of the total area, and the areas showing significant positive and negative correlation accounted for 4.20% and 4.21% of the significantly correlated area, respectively. The promotion and suppression effects of precipitation on vegetation were basically equal. The portion of the total area showing a significant correlation between vegetation and temperature amounted to 8.27%. Among these significantly correlated areas, 3.01% exhibited a positive significant correlation between temperature and vegetation, while 5.26% exhibited a negative significant correlation between the two variables (Figure 9B).
To further identify the impact of climatic factors on vegetation in various geomorphic zones of the LP, the relative rates of promotion and inhibition of the climate factors in each geomorphic zone are calculated. Zonal statistics show that precipitation dominates the promotion of vegetation growth in the LF, the HS, the AG and the WA, among which precipitation has the most significant effect on the promotion of vegetation in AG and WA and the percentage of the area of promotion is over 90% (Table 4).
The correlations among growing season vegetation cover (FVC) and climate factors in the same period (April–October) and the previous 1–3 months (i.e., March–September, February–August, January–July) were analyzed and their significance was taken into account to obtain the maximum correlation coefficients among vegetation and climate factors in the Loess Plateau. The maximum response of FVC with temperature and relative humidity for 2000–2020 on the Loess Plateau was a 1-month lag with Rfvc-Tem1 = 0.52 and Rfvc-RH1 = 0.93, and the maximum response with precipitation was a 2-month lag with Rfvc-Pre2 = 0.63 (Table 5).

4.4. Analysis of Vegetation Response to Human Activities

The changes in vegetation of the LP resulted from the interaction of climate change and human activities. The regions that have significant importance regarding FVC are key areas for initiatives such as returning farmland to forest and grass, as well as sand control. To strip the influence of climatological factors on vegetation, a residual analysis of FVC and the most relevant time-lagged climatic factors was performed in this study. The aim of approach is to identify and quantify the specific effects of human activities on vegetation.
FVC residuals showed an upward tendency in most areas of the LP, and the upward tendency is more obvious in the LG, LT, WA and TS, with a maximum rate of change in regional residuals of 0.054/a−1, and a decreasing trend in the residual values of some geomorphic zones, where the weakening is more obvious in the AP in the north and the HS in the southwest, with a minimum rate of change of −0.096/a−1 (Figure 10a), Since 1999, the LP has implemented a range of ecological restoration measures such as returning farmland to forest and grass, and a large amount of arable land and other land types have been rapidly converted to forest and grass, which has had a great impact on the FVC of the LP. Between 2000 and 2010, human activities played a significant role in contributing to vegetation cover on the LP, resulting in an area of 257,700 km2 being positively influenced. This area represents approximately 40.27% of the total land area (Figure 10b). Furthermore, from 2011 to 2020, the impact of human activities on vegetation expanded, covering an area of 358,900 km2, which accounted for approximately 58.73% of the total area of the LP. These findings underscore the substantial influence of human actions on vegetation dynamics in the region over the specified time periods (Figure 10c).
The comparison between the two time periods reveals that human activities have a dual impact on vegetation growth on the LP. Notably, promotion of vegetation by human activities has significantly increased in recent years. This observation suggests that human interventions, such as afforestation and ecological restoration efforts, have yielded positive results in enhancing vegetation cover and promoting ecological recovery on the LP. In the time period of 2000–2011, the vegetation of most subdivisions of the LP was mainly suppressed by human activities, except for the HS, and the percentage of areas where human activities suppressed the vegetation of other subdivisions was greater than 50%. In the 2011–2020 time period, the impact of human activities on the vegetation of the LP has undergone a great transformation. As of 2020, except for the HS, the area where human activities promote the vegetation of all geomorphic divisions of the LP has shown an increasing trend, and the area where human activities inhibit the vegetation has been decreasing accordingly. The area where human activities promote vegetation in the LG, LT and WA increased by more than 30%, especially in WA, in which the area where human activities promote vegetation changed from 13.80% to 86.85%, an increase of 73.05% (Table 6). This suggests that the rapid growth of FVC on the LP in the last 20 years is due to a series of human activities such as large-scale implementation of ecological restoration measures.

5. Discussion

5.1. Analysis of Vegetation Degradation Control Factors

In the past, the LP suffered from severe soil erosion due to factors such as undulating terrain, loose soil texture and human activities. However, large-scale projects such as returning farmland to forests and grasslands, as well as soil and water conservation initiatives, contributed to increased vegetation coverage, improved soil structure and reduced risks of soil and water loss in recent years [35]. This positive change reflects the success of these ecological restoration efforts in enhancing vegetation on the LP. The above research indicates that the overall FVC of the LP showed an increasing trend from 2000 to 2020, which is consistent with the research conclusions of Sun Rui [36], but the vegetation in HS and AP is declining, their area being 166,200 km2, accounting for 25.52% of the total area of the Loess Plateau. The vegetation changes in these two geomorphic zones directly affect the vegetation development of Loess Plateau, and it is necessary to discuss the degradation of vegetation in these two subregions in depth. This section will discuss the causes of vegetation degradation in HS and AP from the aspects of climate change and human activities, respectively.
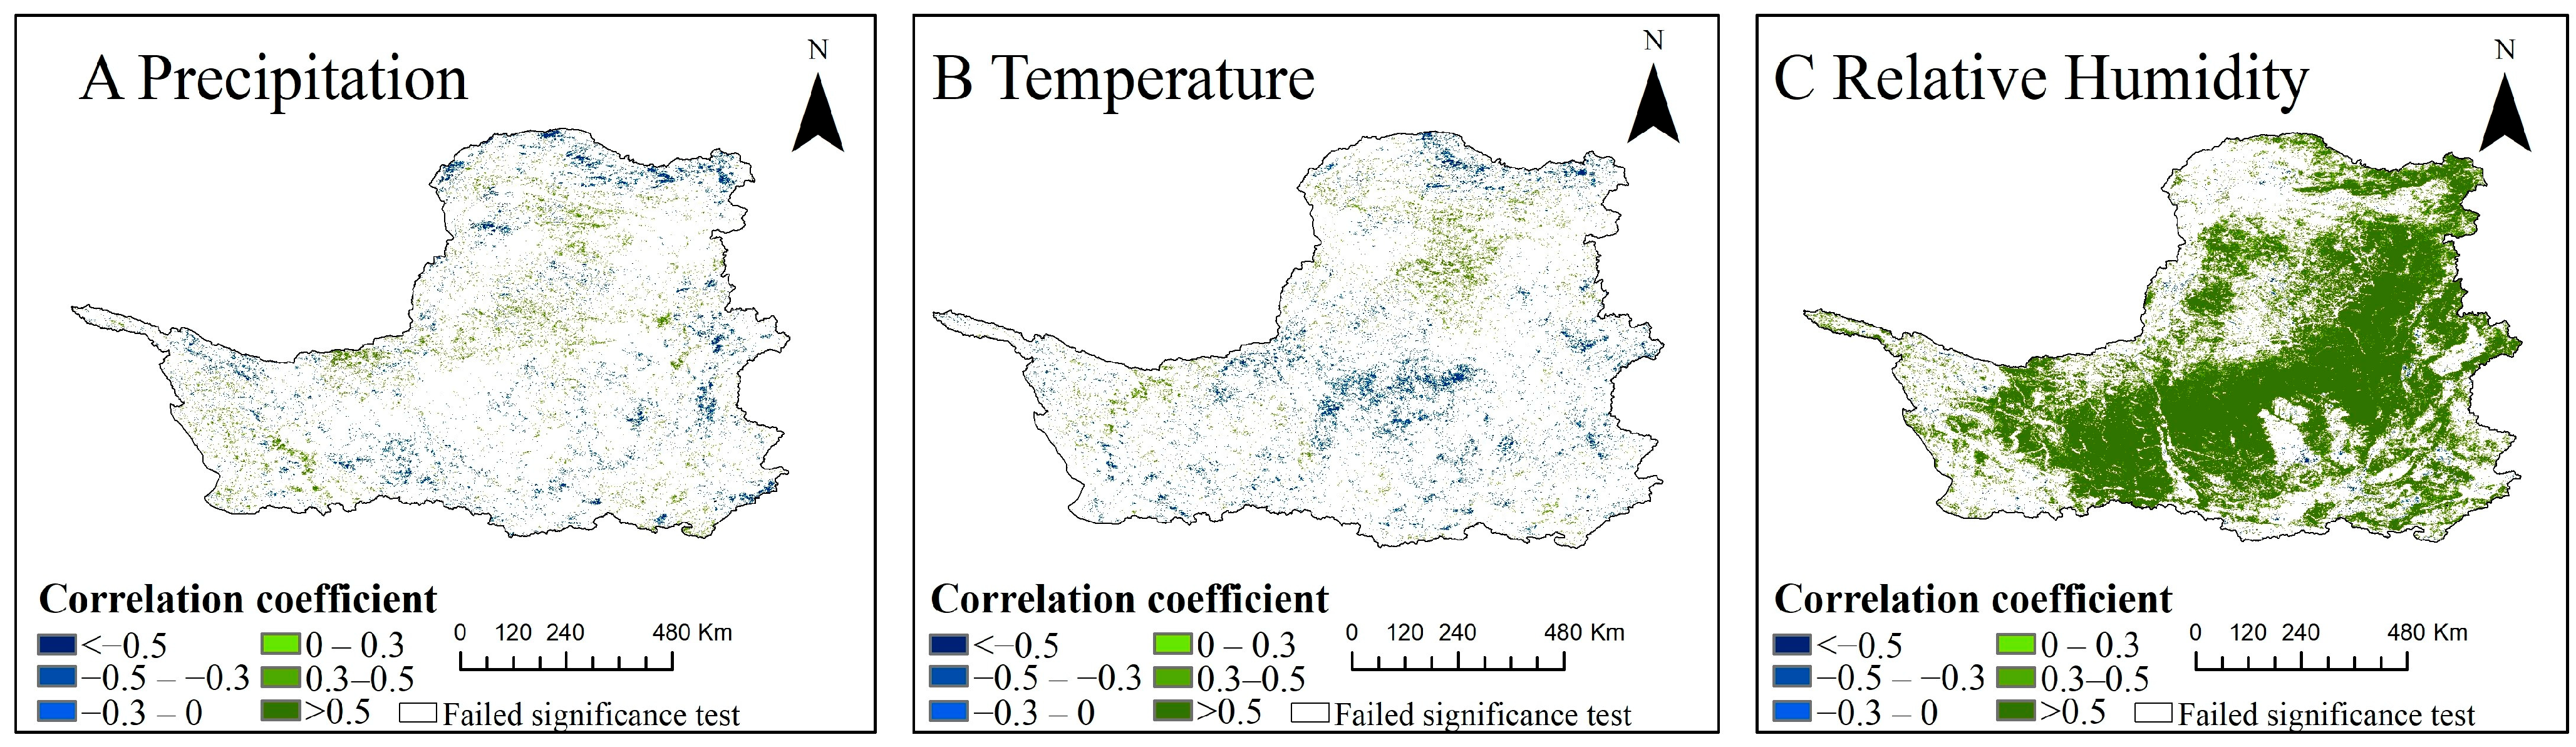
The research findings presented in Section 4.3 highlight the influential role of precipitation and relative humidity in promoting vegetation growth within the HS, while temperature emerges as the primary climate factor impeding vegetation development. The average temperature of the growing season in HS is only 5.72 °C, which is the coldest terrain area on the LP. While climate warming has extended the vegetation’s growth period in recent years [37,38], it has also triggered the degradation of permafrost, leading to detrimental consequences such as freeze–thaw erosion and hydraulic erosion, further exacerbating soil erosion and ultimately diminishing the quality of the grassland [39,40]. Additionally, the degradation of permafrost caused by climate change has contributed to reduced water volume in the upper reaches of the Yellow River, resulting in water scarcity and subsequent degradation of regional vegetation [41].
The HS is situated within the headwater region of the Yellow River basin, characterized by a relatively uncomplicated land composition. The overall land division reveals that the grassland possesses a clear absolute advantage, with unused land and forest land constituting the primary land types, along with a smaller proportion of farmland [42]. The highland grassland area boasts abundant resources, particularly in terms of grasslands, which offer optimal conditions for grazing activities. These favorable conditions contribute to the sustainability of livestock production and facilitate ecological balance within the area. However, due to population growth and economic development pressures in the past decade, the region has faced issues of overgrazing, leading to excessive utilization of grasslands. Livestock farming has also increased the demand for water resources, putting pressure on sustainable water resource management [
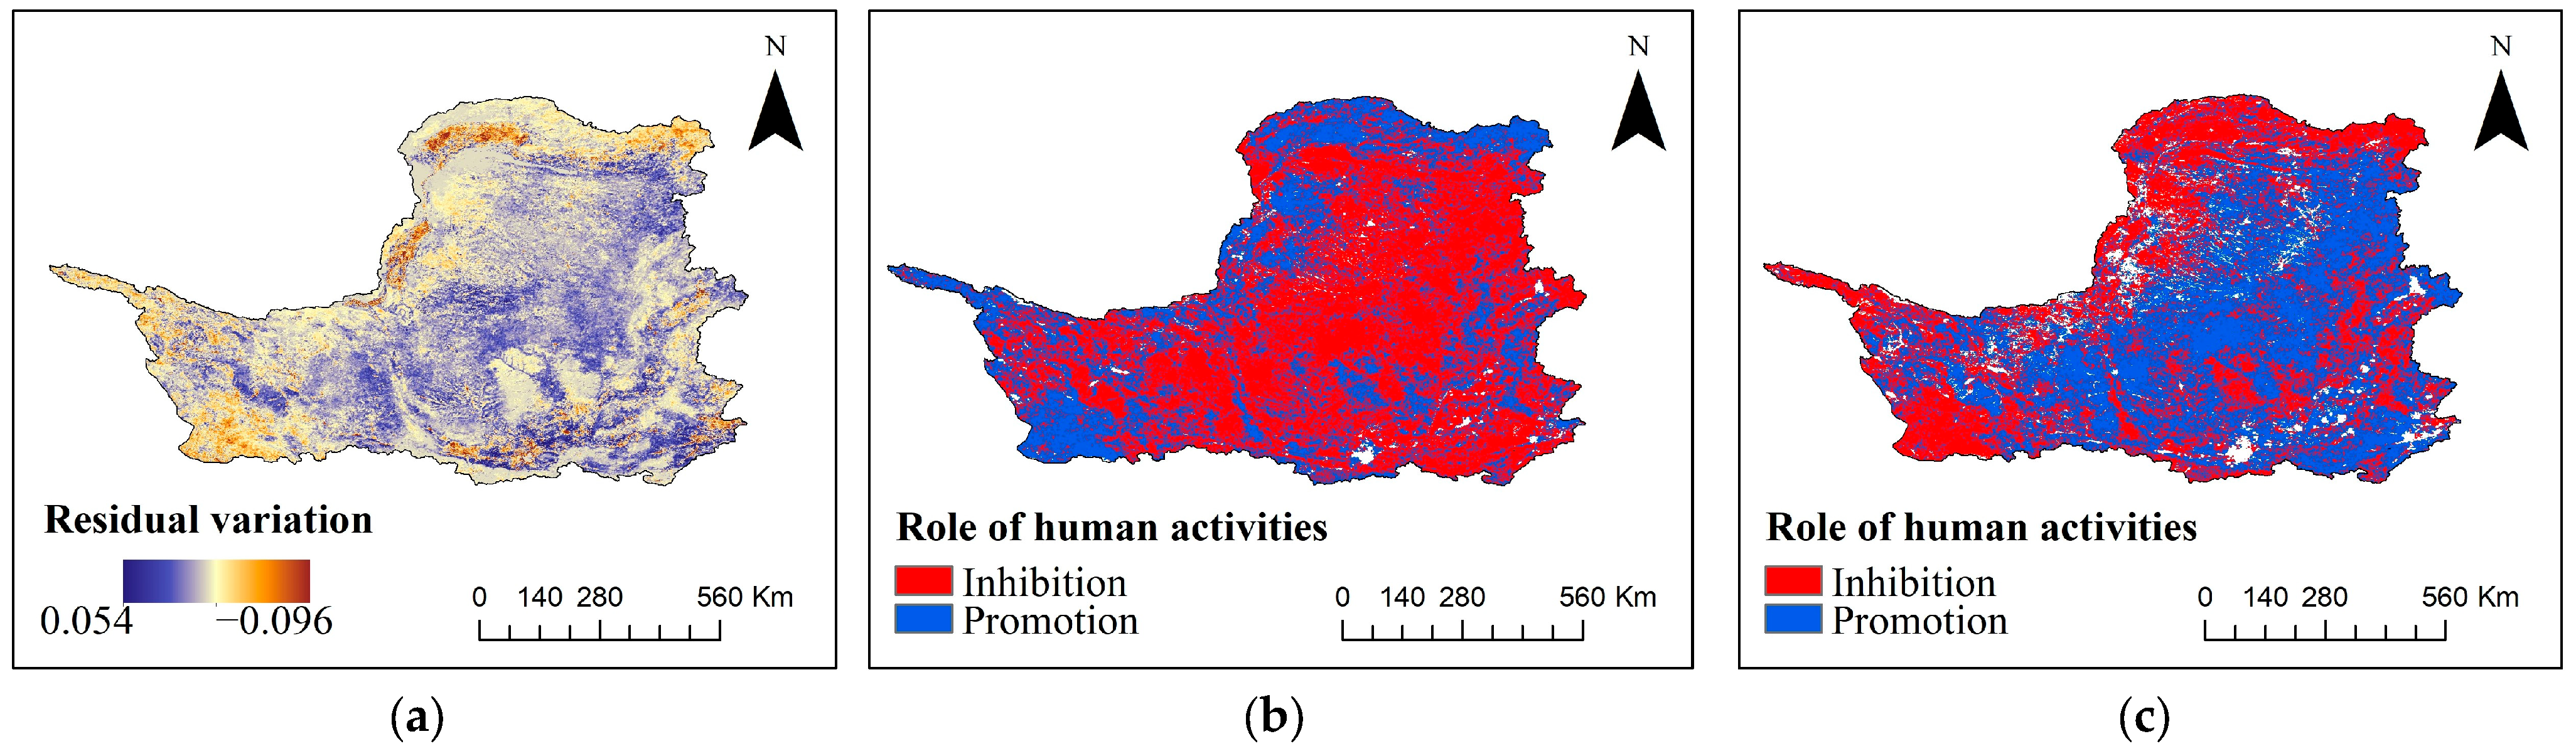
43]. Unreasonable use of water resources has also resulted in grassland degradation. These factors have contributed to the suppressing effect of human activities on vegetation in HS in the past decade.
In terms of climate factors, the AP experiences a growing season with precipitation, temperature and relative humidity of 350.07 mm, 18.75 °C and 51.71% respectively. Both precipitation and relative humidity are lower than the average levels on the Loess Plateau, indicating relatively arid climate conditions with insufficient and unevenly distributed precipitation. Climate change has resulted in changes in precipitation patterns, such as a decrease in precipitation amount and an increase in precipitation intensity, making it challenging for vegetation to adapt to drought and extreme weather conditions, leading to a reduction in vegetation. These factors have caused vegetation degradation in both the HS and AP of the LP. In addition, compared to other regions, human activities have only shown a weak promoting effect on overall vegetation in AP, and in some areas of the AP, they have even had a suppressing effect. This is due to the AP being densely populated and experiencing concentrated agricultural development [44]. Over the long term, it has faced significant pressures from large-scale urban development and land use, particularly in the past decade with the rapid development of cities such as Yinchuan and Xi’an in AP. Excessive development and other human activities have led to slow or even declining vegetation growth in these areas [14].

5.2. Relationship between Land Use and FVC

It is evident that human activities have exerted extensive and profound impacts on vegetation dynamics in the LP [45]. A comprehensive examination of the influence of human activities on vegetation is a crucial aspect when investigating the dynamic changes in vegetation. Numerous studies have consistently demonstrated that human activities alter the trajectory of vegetation development by modifying land use patterns, establishing an inseparable relationship between land use types and vegetation coverage. For instance, Senay et al. [46] observed that alterations in land use structure and function in Oklahoma resulted in shifts in vegetation cover types and their spatial patterns. Similarly, Li Zhengguo et al. [47] found that land use patterns determine the characteristics of vegetation cover changes in LP, operating within specific natural ecological contexts. Hence, an in-depth analysis and discussion of land use transformation represent an effective approach to explore the impact of human activities on vegetation change.
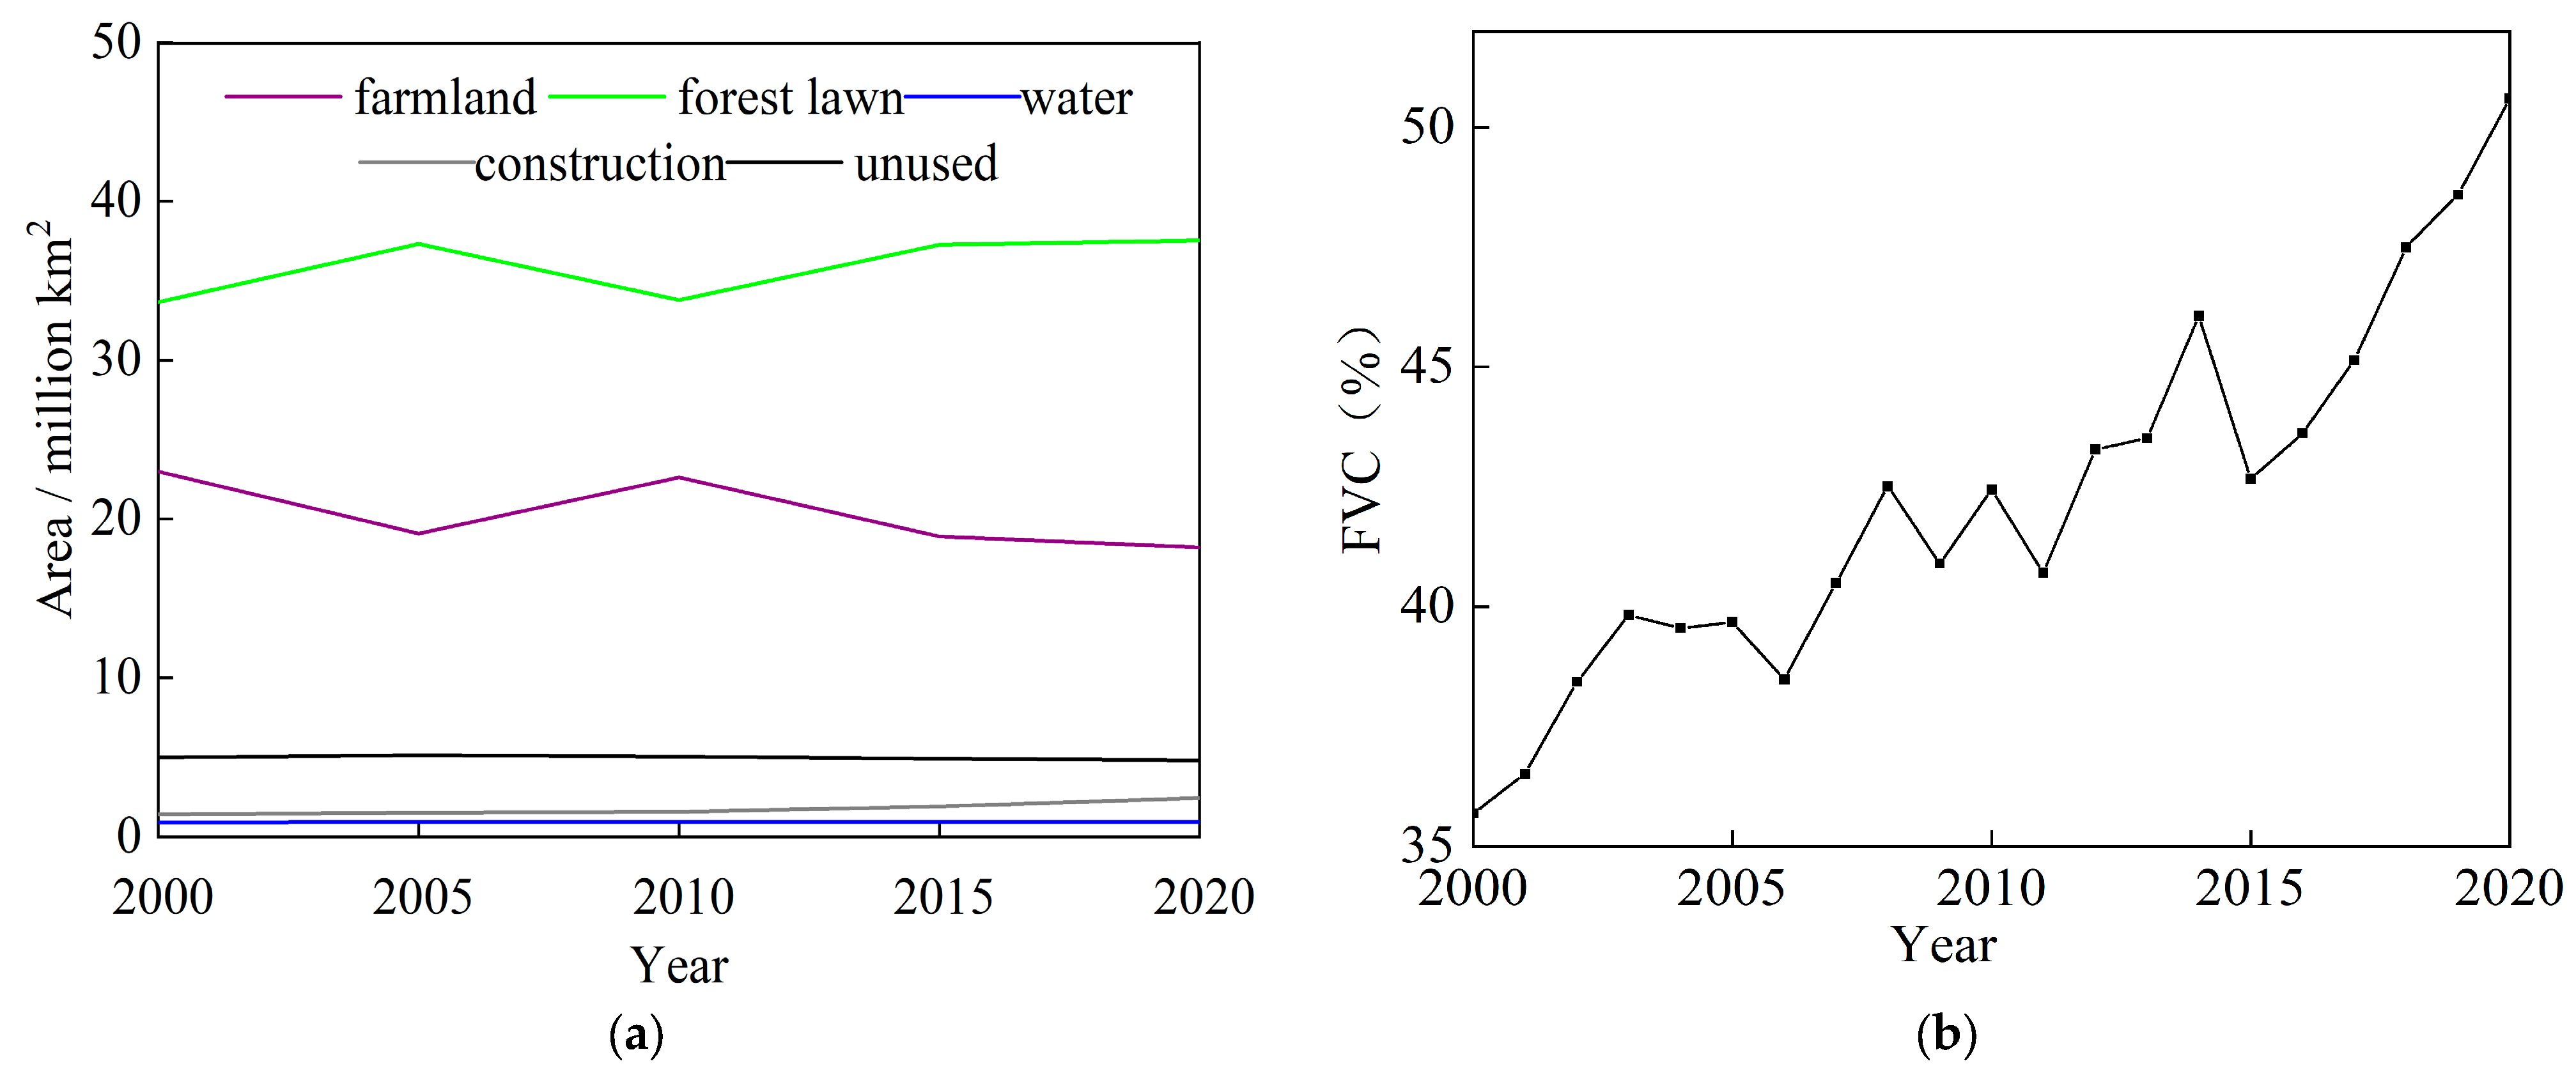
Forest lawn dominates the LP, with forest lawn and cultivated land exhibiting completely opposite trends. The increase in forest lawn area often coincides with a decrease in cultivated land area. The area of forest lawn on the LP shows a fluctuating upward trend, while the construction land on the LP has been continuously expanding over the past 20 years, driven by the expansion of central cities such as Xi’an, Yinchuan and Lanzhou. Consequently, the amount of unused land has been decreasing steadily (Figure 11a). The FVC of the LP also shows a fluctuating upward trend in the past 20 years (Figure 11b). By comparison, it can be seen that the FVC of the LP and the area of forest lawn have the same change trend, which indicates that the development of vegetation of the LP mainly depends on the change in the area of forest lawn; the most direct reflection of the increasing area of forest lawn is the increase in FVC [48]. In the past 20 years, a series of ecological restoration projects, such as Grain for Green and grassland, have profoundly changed the composition of land use types on the LP [49]. From 2000 to 2020, the area of farmland on the LP transformed into other land types was 119,600 km2, of which 84.82% was transformed into forest lawn, and the area of forest lawn reduced and transformed into other land types was 84,000 km2, while the area converted from other land types to forest lawn is 122,800 km2, which is 1.5 times the increased area compared to the area of reduction (Table 7). The continuous increase in forest lawn area in the region reflects human activities to improve vegetation by changing land use types, thereby achieving the effect of improving the regional ecological environment [48].
In order to gain further insights into the future vegetation changes on the LP, this study utilizes the CA–Markov model and considers land use driving factors such as elevation and slope. The land use of LP in 2030 is predicted with the year 2020 as the base period.
This study predicted land use scenarios for 2020 by utilizing land use data and impact factor data from 2000 and 2010. The simulation outcomes were evaluated for accuracy by comparing them to actual land use data in 2020. The results demonstrated that the kappa value exceeded 0.75, indicating a satisfactory simulation effect. Building upon these findings, the study proceeded to predict the land use changes on the LP for 2030. Additionally, the change situation of forest and grass vegetation at the regional level was calculated as part of the analysis.
The LP holds significant importance as a key area for soil and water conservation in China. Looking ahead, activities in the next ten years will continue to prioritize ecological treatment and restoration efforts, rather than large-scale development, in the region. This forecast takes the ecological protection red line of the LP as the main reference basis, strictly protects forest lawn and water areas and restricts their area and rate of conversion to other land types for ecological restoration purposes. According to the forecast results (Table 8), the LP in 2030 does not undergo a major transformation in land use, farmland and forest lawn show slight changes compared with 2020, the area of unused land decreases by 7.07% compared with 2020, the land for construction in 2030 is 27,700 km2, an increase of 12.38% compared with 2020, and the increase in land for construction mainly comes from unused land and a small portion of forest lawn, mainly concentrated in urban areas such as Xi’an, Lanzhou and Yinchuan. It is found that land use is more stable in the LP in the future, and the probability of land use shift is low, which is consistent with the results of Gao et al. [50].
During the past 20 years, vegetation development of the LP has mainly been concentrated on the expansion of forest lawn areas. With the gradual stabilization of a range of ecological construction projects, the area of forest lawn on the LP will remain stable in the future. Therefore, in the future, while protecting the area of forest and grassland from invasion, we should be more committed to the improvement of vegetation cover of forest lawn and farmland. In order to effectively enhance the texture of vegetation and ensure an adequate quantity of plant life, it is essential to implement zoning treatments based on diverse landforms and tailored to local conditions. Additionally, a strategic focus on promoting advantageous species is crucial. By undertaking these actions, we can make valuable contributions to both environmental preservation and enhancement, while simultaneously promoting the sustainable development of an ecological economy.

6. Conclusions

(1) The vegetation coverage on the LP is predominantly at a medium to low level, with significant differences in vegetation coverage among different geomorphic zones. The LF exhibits the highest coverage, with a multi-year average of 86.64%, and the AG has the poorest vegetation with only 8.53%. Overall, the vegetation coverage on the LP has improved significantly over the past twenty years, with a considerable proportion of the total area experiencing improvement. However, there are noticeable signs of vegetation degradation in certain geomorphic zones, particularly in the HS and AG. This indicates that the vegetation condition on the LP is influenced by both landform characteristics and human activities, necessitating further ecological conservation and restoration measures.
(2) The vegetation on the LP exhibits significant spatial heterogeneity under the influence of climatic factors, with varying degrees of impact in different geomorphic zones. Relative humidity has the greatest impact on vegetation among the three climate factors, i.e., relative humidity, precipitation and temperature. Relative humidity predominantly promotes vegetation growth in all geomorphic zones, with promotion areas exceeding 90% in coverage. The effects of precipitation on vegetation vary in different geomorphic zones. Precipitation has a significant promoting effect on the vegetation in the AG and WA. Overall, the promotion and inhibition effects of precipitation on vegetation are roughly equal. Temperature has an inhibitory effect on vegetation growth in most geomorphic zones, except for the WA and AG. Particularly, the LF experiences the largest inhibitory effect from temperature. Furthermore, there is a lag effect between vegetation and climatic factors, with a one-month lag in response to temperature and relative humidity and a two-month lag in response to precipitation.
(3) Human activities have shown an increasing trend in promoting vegetation across most of the geomorphic zones, particularly in WA, where the promoting effect has increased by 73.05%. However, in the HS, human activities exhibit an inhibitory effect on vegetation. This region is mainly composed of herbaceous plants, and overgrazing has led to overutilization of grasslands and increased demand for water resources. Unreasonable water resource utilization has also contributed to vegetation degradation. Furthermore, in AP, excessive urban development and land use have resulted in slow or even declining vegetation growth. This has weakened the overall promoting effect of human activities on vegetation in AP and even demonstrated inhibitory effects in certain areas.
(4) Land use change has a significant impact on vegetation dynamics in the LP. From 2000 to 2020, the area of forests and grasslands in the LP increased by 122,800 km2, which is 1.5 times the area that was lost. Among these changes, the conversion of forest lawn to construction land has been relatively frequent, and the rapid development of cities has inhibited vegetation growth in certain areas. In the future, land use in the LP is expected to stabilize, with fewer large-scale conversions between different land types. To protect the area of forest lawn from erosion, efforts should be made to enhance vegetation coverage in these areas, as well as in croplands, in order to promote ecological restoration and sustainable development. This requires a comprehensive approach that considers land use planning, ecological conservation and agricultural management, ensuring the healthy growth of vegetation and the sustainable utilization of land resources.

Author Contributions

Conceptualization, K.Y. and X.L.; methodology, X.L.; software, X.Z. (Xiang Zhang); validation, G.Z., X.L. and K.Y.; formal analysis, X.L.; investigation, Z.L.; resources, P.L.; data curation, X.Z. (Xiaoming Zhang); writing—original draft preparation, Y.Z.; writing—review and editing, W.M.; visualization, X.L.; supervision, X.L.; project administration, K.Y.; funding acquisition, K.Y. All authors have read and agreed to the published version of the manuscript.

Funding

This research is supported by the National Natural Science Foundations of China (Grant Nos. 52079104, 51979290, U2040208), the Key Research and Development Program of Shaanxi Province (2023-ZDLSF-60) and the Ningxia Water Conservancy Science and Technology Project (SBZZ-J-2021-12, SBZZ-J-2021-13), which are gratefully acknowledged.

Institutional Review Board Statement

Not applicable.

Informed Consent Statement

Not applicable.

Data Availability Statement

Not applicable.

Conflicts of Interest

The authors declare no conflict of interest.

References

  1. Hou, X.; Wu, T.; Yu, L.; Qian, S. Characteristics of multi-temporal scale variation of vegetation coverage in the Circum Bohai Bay Region, 1999–2009. Acta Ecol. Sin. 2012, 32, 297–304. [Google Scholar] [CrossRef]
  2. Huang, W.; Duan, W.; Chen, Y. Rapidly declining surface and terrestrial water resources in Central Asia driven by socio-economic and climatic changes. Sci. Total Environ. 2021, 784, 147193. [Google Scholar] [CrossRef]
  3. Piao, S.; Zhang, X.; Chen, A.; Liu, Q.; Lian, X.; Wang, X.; Peng, S.; Wu, X. The impacts of climate extremes on the terrestrial carbon cycle: A review. Sci. China Earth Sci. 2019, 62, 1551–1563. [Google Scholar] [CrossRef]
  4. Chu, H.; Venevsky, S.; Wu, C.; Wang, M. NDVI-based vegetation dynamics and its response to climate changes at Amur-Heilongjiang River Basin from 1982 to 2015. Sci. Total Environ. 2019, 650, 2051–2062. [Google Scholar] [CrossRef]
  5. Jiang, P.; Ding, W.; Yuan, Y.; Ye, W.; Mu, Y. Interannual variability of vegetation sensitivity to climate in China. J. Environ. Manag. 2022, 301, 113768. [Google Scholar] [CrossRef]
  6. Liu, X.; Zhang, Y.; Zhang, L.; Fang, X.; Deng, W.; Liu, Y. Aggregate-associated soil organic carbon fractions in subtropical soil undergoing vegetative restoration. Land Degrad. Dev. 2022. [Google Scholar] [CrossRef]
  7. Wu, G.L.; Liu, Y.F.; Cui, Z.; Liu, Y.; Shi, Z.H.; Yin, R.; Kardol, P. Trade-off between vegetation type, soil erosion control and surface water in global semi-arid regions: A meta-analysis. J. Appl. Ecol. 2020, 57, 875–885. [Google Scholar] [CrossRef]
  8. Yin, Z.; Feng, Q.; Wang, L.; Chen, Z.; Chang, Y.; Zhu, R. Vegetation coverage change and its influencing factors across the northwest region of China during 2000–2019. J. Desert Res. 2022, 42, 11. [Google Scholar]
  9. Wang, F.; Mu, X.; Li, R.; Fleskens, L.; Stringer, L.C.; Ritsema, C.J. Co-evolution of soil and water conservation policy and human–environment linkages in the Yellow River Basin since 1949. Sci. Total Environ. 2015, 508, 166–177. [Google Scholar] [CrossRef] [Green Version]
  10. Pang, G.; Wang, X.; Yang, M. Using the NDVI to identify variations in, and responses of, vegetation to climate change on the Tibetan Plateau from 1982 to 2012. Quat. Int. 2017, 444, 87. [Google Scholar] [CrossRef]
  11. Zhang, C.S.; Hu, Y.; Shi, X.L. Analysis if Spatial-Temporal Evolution of Vegetation Cover in Loess Plateau in Recent 33 Years Based on AVHRR NDVI and MODIS NDVI. J. Appl. Sci. Electron. Inf. Eng. 2016, 34, 702–712. [Google Scholar]
  12. He, J.; He, L.; He, L.D.; Cheng, Z.; Xue, F.; Liu, B.Y.; Zhang, X.P. Spatiotemporal variation and the Driving Mechanism of Photosynthetic Vegetation in the Loess Plateau from 2001 to 2020. Chin. J. Plant Ecol. 2023, 47, 306. [Google Scholar] [CrossRef]
  13. Jia, L.; Yu, K.; Li, Z.; Ren, Z.; Li, H.; Li, P. Identification of Vegetation Coverage Variation and Quantitative the Impact of Environmental Factors on Its Spatial Distribution in the Pisha Sandstone Area. Sustainability 2023, 15, 6054. [Google Scholar] [CrossRef]
  14. Fan, X.; Gao, P.; Tian, B.; Wu, C.; Mu, X. Spatio-Temporal Patterns of NDVI and Its Influencing Factors Based on the ESTARFM in the Loess Plateau of China. Remote Sens. 2023, 15, 2553. [Google Scholar] [CrossRef]
  15. Liu, Y.; Li, Y.; Li, S.C.; Motesharrei, S.C. Spatial and temporal patterns of global NDVI trends: Correlations with climate and human factors. Remote Sens. 2015, 7, 13233–13250. [Google Scholar] [CrossRef] [Green Version]
  16. Sun, W.; Song, X.; Mu, X.; Gao, P.; Wang, F.; Zhao, G. Spatiotemporal vegetation cover variations associated with climate change and ecological restoration in the Loess Plateau. Agric. For. Meteorol. 2015, 209, 87–99. [Google Scholar] [CrossRef]
  17. Gao, H.D.; Pang, G.W.; Li, Z.B.; Cheng, S. Evaluating the potential of vegetation restoration in the Loess Plateau. Acta Geogr. Sin. 2017, 72, 863–874. [Google Scholar]
  18. Liu, X.Y.; Dang, S.Z.; Gao, Y.F.; Yang, S.T. The rule and threshold of the effect of vegetation change on sediment yield in the loess hilly region. China. J. Hydraul. Eng. 2020, 51, 505–518. [Google Scholar]
  19. Chen, J.; Jönsson, P.; Tamura, M.; Gu, Z.; Matsushita, B.; Eklundh, L. A simple method for reconstructing a high-quality NDVI time-series data set based on the Savitzky–Golay filter. Remote Sens. Environ. 2004, 91, 332–344. [Google Scholar] [CrossRef]
  20. Li, M.M.; Wu, B.F.; Yan, C.Z.; Zhou, W.F. Estimation of vegetation fraction in the upper basin of Miyun reservoir by remote sensing. Resour. Sci. 2004, 26, 153–159. [Google Scholar]
  21. Tucker, C.J.; Newcomb, W.W.; Los, S.O.; Prince, S.D. Mean and inter-year variation of growing-season normalized difference vegetation index for the Sahel 1981–1989. Int. J. Remote Sens. 1991, 12, 1133–1135. [Google Scholar] [CrossRef]
  22. Yu, Y.S.; Chen, X.W. Study on the percentage of trend component in a hydrological time series based on Mann-Kendall method. J. Nat. Resour. 2011, 26, 1585–1591. [Google Scholar]
  23. Xu, Y.; Huang, W.-T.; Dou, S.-Q.; Guo, Z.-D.; Li, X.-Y.; Zheng, Z.-W.; Jing, J.-L. Responding Mechanism of Vegetation Cover to Climate Change and Human Activities in Southwest China from 2000 to 2020. Huan Jing Ke Xue Huanjing Kexue 2022, 43, 3230–3240. [Google Scholar]
  24. Hurst, H.E. Long term storage capacity of reservoirs. Trans. Am. Soc. Civ. Eng. 1951, 116, 770–799. [Google Scholar] [CrossRef]
  25. Jiang, L.; Bao, A.; Jiapaer, G.; Liu, R.; Yuan, Y.; Yu, T. Monitoring land degradation and assessing its drivers to support sustainable development goal 15.3 in Central Asia. Sci. Total Environ. 2022, 807, 150868. [Google Scholar] [CrossRef]
  26. Xu, G.; Zhang, J.; Li, P.; Li, Z.; Lu, K.; Wang, X.; Wang, F.; Cheng, Y.; Wang, B. Vegetation restoration projects and their influence on runoff and sediment in China. Ecol. Indic. 2018, 95, 233–241. [Google Scholar] [CrossRef]
  27. Zhang, L.; Ding, M.J.; Zhang, H.M.; Wen, C. Spatiotemporal variation of the vegetation coverage in Yangtze River Basin during 1982–2015. J. Nat. Res. 2018, 33, 2084–2097. [Google Scholar]
  28. Evans, J.; Geerken, R. Discrimination between climate and human-induced dryland degradation. J. Arid Environ. 2004, 57, 535–554. [Google Scholar] [CrossRef]
  29. Wessels, K.J.; Prince, S.D.; Malherbe, J.; Small, J.; Frost, P.E.; VanZyl, D. Can human-induced land degradation be distinguished from the effects of precipitation variability? A case study in South Africa. J. Arid Environ. 2007, 68, 271–297. [Google Scholar] [CrossRef]
  30. Jin, K.; Wang, F.; Han, J.; Shi, S.; Ding, W. Contribution of climatic change and human activities to vegetation NDVI change over China during 1982–2015. Acta Geogr. Sin. 2020, 75, 961–974. [Google Scholar]
  31. Guo, H.; Li, B.; Hou, Y.; Sun, T. Cellular automata model and multi-agent model for the simulation of land use change: A review. Prog. Geogr. 2011, 30, 1336–1344. [Google Scholar]
  32. Babbar, D.; Areendran, G.; Sahana, M.; Sarma, K.; Raj, K.; Sivadas, A. Assessment and prediction of carbon sequestration using Markov chain and InVEST model in Sariska Tiger Reserve, India. J. Clean. Prod. 2021, 278, 123333. [Google Scholar] [CrossRef]
  33. Zhou, J.; Zhang, X.R.; Mu, F.Y. Spatial pattern reconstruction of soil organic carbon storage based on CA-Markov: A case study of Pan-Yangtze River Delta region. Resour. Environ. Yangtze Basin 2018, 27, 1565–1575. [Google Scholar]
  34. Liu, X.Y.; Gao, Y.F.; Yang, S.T.; Luo, Y. The Causes of the Sharp Decrease in Water and Sand in the Yellow River in Recent Years; Science Press: Beijing, China, 2016. [Google Scholar]
  35. Zhang, B.; Tian, L.; He, C.; He, X. Response of Erosive Precipitation to Vegetation Restoration and Its Effect on Soil and Water Conservation Over China’s Loess Plateau. Water Resour. Res. 2023, 59, e2022WR033382. [Google Scholar] [CrossRef]
  36. Sun, R.; Chen, S.; Su, H. Spatiotemporal variation of NDVI in different ecotypes on the Loess Plateau and its response to climate change. Geogr. Res. 2020, 39, 1200–1214. [Google Scholar]
  37. Yu, H.; Luedeling, E.; Xu, J. Winter and spring warming result in delayed spring phenology on the Tibetan Plateau. Proc. Natl. Acad. Sci. USA 2010, 107, 22151–22156. [Google Scholar] [CrossRef]
  38. Cheng, Q.; Zhou, Q.; Zhang, H.F.; Liu, F.G. Spatial disparity of NDVI response in vegetation growing season to climate change in the Three-River Headwaters Region. Ecol. Environ. Sci. 2010, 19, 1284–1289. [Google Scholar]
  39. Wang, G.; Liu, G.; Li, C. Effects of changes in alpine grassland vegetation cover on hillslope hydrological processes in a permafrost watershed. J. Hydrol. 2012, 444, 22–33. [Google Scholar]
  40. Liu, J.Y.; Bing, L.F.; Shao, Q.Q. Characteristic of land cover changes in the Yellow River Headwaters Region over the past 30 years. J. Geo-Inf. Sci. 2011, 13, 289–296. [Google Scholar]
  41. Zhao, L.; Hu, G.; Zou, D.; Wu, X.; Ma, L.; Sun, Z.; Yuan, L.; Zhou, H.; Liu, S. Permafrost changes and its effects on hydrological processes on Qinghai-Tibet Plateau. Bull. Chin. Acad. Sci. (Chin. Vers.) 2019, 34, 1233–1246. [Google Scholar]
  42. Chen, Q.; Zhang, Y.L.; Liu, F.G.; Zhou, Q.; Wang, S.Z.; Cheng, Y.; Guo, R.; Zhi, Z.M.; Xu, H.G. A review of land use change and its influence in the source region of the Yellow River. Resour. Sci. 2020, 42, 446–459. [Google Scholar] [CrossRef]
  43. Liu, L.L.; Cao, W.; Shao, Q.Q. Different Characteristics of Land Cover Changes in Source Regions of the Yangtze River and the Yellow River in the Past 30 Year. Sci. Geogr. Sin. 2017, 37, 311–320. [Google Scholar]
  44. Lv, M.; Chen, Z.; Yao, L.; Dang, X.; Li, P.; Cao, X. Potential Zoning of Construction Land Consolidation in the Loess Plateau Based on the Evolution of Human–Land Relationship. Int. J. Environ. Res. Public Health 2022, 19, 14927. [Google Scholar] [CrossRef]
  45. Kou, P.; Xu, Q.; Jin, Z.; Yunus, A.P.; Luo, X.; Liu, M. Complex anthropogenic interaction on vegetation greening in the Chinese Loess Plateau. Sci. Total Environ. 2021, 778, 146065. [Google Scholar] [CrossRef] [PubMed]
  46. Senay, G.; Elliott, R. Combining AVHRR-NDVI and landuse data to describe temporal and spatial dynamics of vegetation. For. Ecol. Manag. 2000, 128, 83–91. [Google Scholar] [CrossRef]
  47. Li, Z.; Wang, Y.; Wu, J.; Zhang, X. Impact on vegetation coverage seasonal change of different landuse types in Loess Plateau: A case of Yanhe basin. Quat. Sci. 2005, 25, 762–769. [Google Scholar]
  48. Wang, Y.; Hao, L.N.; Xu, Q.; Li, J.Q.; Chang, H. Spatio-temporal variations of vegetation coverage and its geographical factors analysis on the Loess Plateau from 2001 to 2019. Acta Ecol. Sin. 2023, 43, 2397–2407. [Google Scholar]
  49. Li, J.; Peng, S.; Li, Z. Detecting and attributing vegetation changes on China’s Loess Plateau. Agric. For. Meteorol. 2017, 247, 260–270. [Google Scholar] [CrossRef]
  50. Gao, H.; Wu, Z. Vegetation restoration and its effect on runoff and sediment processes in the Toudaoguai-Tongguan section of the Yellow River. Acta Geogr. Sin. 2021, 76, 1206–1217. [Google Scholar]
Figure 1. Location and geomorphology zone of the study area.
Sustainability 15 12200 g001
Figure 2. Spatial distribution of FVC in LP.
Sustainability 15 12200 g002
Figure 3. Changes in FVC during different periods on the LP.
Sustainability 15 12200 g003
Figure 4. Vegetation changes in different stages of the LP in various geomorphic divisions.
Sustainability 15 12200 g004
Figure 5. Vegetation change trend.
Sustainability 15 12200 g005
Figure 6. Vegetation Hurst index.
Sustainability 15 12200 g006
Figure 7. Temporal variation of climate factors in the LP from 2000 to 2020 ((a) for precipitation, (b) for temperature, (c) for relative humidity).
Sustainability 15 12200 g007
Figure 8. Spatial variation of climate factors in the LP.
Sustainability 15 12200 g008
Figure 9. Spatial patterns of NDVI and climate correlation coefficients in LP.
Sustainability 15 12200 g009
Figure 10. Impact of human activities on FVC of LP ((a) multi-year residual change, (b) human activity impact from 2000–2010, (c) human activity impact from 2011–2020).
Sustainability 15 12200 g010
Figure 11. Land use and FVC changes in LP ((a) shows the area changes in each category in four periods in LP; (b) shows the interannual changes in FVC in LP).
Sustainability 15 12200 g011
Table 1. Trend test categories.
βZTrend Characteristics
β > 01.96 < ZSignificant improvement
1.96 > ZSlight improvement
β < 01.96 > ZSlight degradation
1.96 < ZSevere degradation
Table 2. Vegetation change trend statistics of different geomorphic subdivisions from 2000 to 2020/%.
RegionChange Type
Severe DegenerationSlight DegradationSlight ImprovementSignificant Improvement
LH1.3114.7919.9863.91
LG2.1210.2316.6371.01
TS4.2135.0516.8243.92
LF2.9051.1114.8531.14
HS11.4949.7232.356.44
AG0.9259.1419.7620.18
WA0.7017.6921.5560.06
AP9.4145.0324.4821.09
LT5.4523.0631.5739.92
Table 3. Multi-year average values of climatic factors for each geomorphological division of the LP.
RegionClimate Factors
Pre/mmTemp/°CRH/%
LH444.2715.0554.42
LG532.7217.7159.52
TS444.0114.8156.66
LF521.4016.0367.82
HS551.165.7265.89
AG266.9116.7337.56
WA374.4017.3641.81
AP350.0718.7551.71
LT554.5120.1359.75
Table 4. Vegetation reaction to climatological factors in different landform zones /%.
RegionPrecipitationTemperatureRelative Humidity
PromotionInhibitionPromotionInhibitionPromotionInhibition
LH40.4159.5924.9775.0399.760.24
LG24.1575.8511.8888.1299.310.69
TS37.7062.3030.7669.2498.671.33
LF62.0737.931.1798.8395.414.59
HS65.6134.3921.0079.0094.006.00
AG78.7821.2267.3032.7098.921.08
WA79.8820.1284.1015.9099.030.97
AP45.1254.841.0358.9793.696.31
LT33.7566.2512.0587.9599.010.99
Note: The values are all percentages of regions that passed the significance test.
Table 5. Time-lag association among vegetation cover and climatic factors in LP from 2000 to 2020.
PrecipitationTemperatureRelative Humidity
Pre00.54 *Tem0--RH00.86 ***
Pre10.57 **Tem10.52 *RH10.93 ***
Pre20.63 **Tem2--RH20.91 ***
Pre30.52 *Tem3--RH30.88 ***
In the table, 0, 1, 2 and 3 represent the same period, the previous month, two months and three months, respectively; “*”, “**” and “***” represent passing the 95%, 99% and 99.9% significance test, “--” means not passing the significance test. Pre, Tem and RH stand for precipitation, temperature and relative humidity, respectively.
Table 6. Response of vegetation to human activities in different geomorphic subdivisions/%.
Region2000–20102011–2020
PromotionInhibitionPromotionInhibition
LH28.9271.0871.7928.21
LG35.9864.0264.5435.46
TS44.8855.1253.7446.26
LF46.0653.9453.2946.08
HS70.8829.1229.2970.71
AG40.4259.5854.1145.89
WA13.8086.2086.8513.15
AP47.9552.0551.3348.67
LT33.6466.3667.5332.47
Table 7. Land Transfer Matrix for LP, 2000–2020 (km2).
Land TypeFarmlandForest LawnWaterConstructionUnusedTotal Area in 2000
Farmland110,209101,474274013,1232303229,849
Forest lawn60,137252,5272782602915,074336,549
Water2295263030245037669218
Construction71192715262396024314,299
Unused247315,961795101329,80350,045
Total area in 2020182,233375,307960324,62848,189639,960
Table 8. Land use change and area proportion of LP from 2020 to 2030.
Land Use Type20302020–2030 Changes
Area/Million km2Proportion/%Area/Million km2Proportion/%
Farmland18.6828.480.462.51
Forest lawn37.1158.65−0.42−1.12
Water0.961.5000
Construction2.773.850.3012.38
Unused4.487.53−0.34−7.07
Disclaimer/Publisher’s Note: The statements, opinions and data contained in all publications are solely those of the individual author(s) and contributor(s) and not of MDPI and/or the editor(s). MDPI and/or the editor(s) disclaim responsibility for any injury to people or property resulting from any ideas, methods, instructions or products referred to in the content.

