Article

Experimental Research and Transfer Matrix Method for Analysis of Transmission Loss in Multilayer Constructions with Devulcanized Waste Rubber

by
Tomas Vilniškis
* and
Tomas Januševičius
Department of Environmental Protection and Water Engineering, Vilnius Gediminas Technical University, 10223 Vilnius, Lithuania
*
Author to whom correspondence should be addressed.
Sustainability 2023, 15(17), 12774; https://0-doi-org.brum.beds.ac.uk/10.3390/su151712774
Submission received: 15 May 2023 / Revised: 9 August 2023 / Accepted: 11 August 2023 / Published: 23 August 2023

Abstract

:
According to circular economy principles, the recycling and reuse of tyre rubber waste are among the most advanced and ecological waste disposal technologies. Each year, about 19 million tons of tyres are produced, and this number increases every year. One of the most innovative ways to recycle rubber waste is devulcanization. There are many methods of rubber devulcanization, but the most popular is chemical devulcanization. Also, pre-process treatment is important before devulcanization. In this article, devulcanized rubber granules were used for the preparation of rubber samples. Two of the samples were obtained via the grinding method and one via chemical devulcanization. In total, 15 different rubber samples were produced for experimental measurements. Multilayer constructions, with two solid layers of plasterboard on both sides (GKB (a standard gypsum board) and GKFI (an enhanced-strength and surface-hardness gypsum board)) and the porous acoustic material of the rubber sample inside, were produced. Measurements were made in an impedance tube and compared with the results of a transfer matrix method (TMM) analysis. The same trends of resonant frequencies were determined. According to the results, the resonant frequencies depended on the thickness of the material, since transmission loss (TL) values depended on the mass of the construction. According to the test results of transmission loss, constructions with 50 mm thick rubber samples had results that were, on average, 3 dB better than those of structures with 25 mm thick samples and 5 dB better than those of structures with 12 mm thick rubber samples. In addition, it was found that higher-density plasterboards (GKFI) increased the overall transmission loss value of the structure by 5 dB. The same trends were determined using the TMM method. The test results showed that multilayered constructions with devulcanized waste rubber had high transmission loss results and could be used for sound-insulating structures.

1. Introduction

Each year, about 19 million tons of tyres are produced, and it is expected that, in 2024, this figure could reach up to 23 million tons [1]. At the end of a tyre’s service limit, it becomes substantial rubber waste. Rubber waste causes many problems because it is non-biodegradable [2]. These days, several methods are used for recycling tyres. The most common methods are reuse in civil engineering, for creating eco-friendly concrete or asphalt composites and safety barriers. Other methods of tyre recycling include energy recovery, especially in cement production; pyrolysis; and material recycling, consisting of mechanical disintegration, which is used for producing ground tyre rubber, and could be indicated as devulcanization [3].
According to the European Tyre and Rubber Manufacturers Association (ETRMA), which collected end-of-life tyre (ELT) management data from 32 European countries, 95% of ELTs were treated for material recycling and energy recovery, and only 5% of used tyres were not identified [4].
In the last few years, the industry has been taking on the challenge of applying the principles of circular economy by finding environmentally friendly materials, as well as using waste to create new products. One way to reuse tyres would be to embed them in concrete to replace some natural materials, such as sand. This method is environmentally friendly, as the waste no longer pollutes the environment, and also allows for reducing carbon dioxide emissions. It is even economically efficient, since the natural raw materials used in the production of concrete are quite expensive, and replacing them with rubber will save a large portion of natural resources [5,6,7]. In addition, tyre waste can be recycled by separating the rubber from the carcass. Shredded tyre waste is used in engineering due to its size, shape, high elasticity, good vibration, and noise reduction. The properties of rubber components directly depend on their microstructure, which is formed by elastomeric chains (rubber, polymers, and resins) and filler, which forms a permanent and homogeneous polymer composite [8]. Rubber waste is also attractive because it can be used to create lighter structures. Mineral materials, such as sand or gravel, have a density of 1600 to 2080 kg/m3, while rubber granules have a density of 640 to 720 kg/m3 [9]. Therefore, when creating new structures, researchers pay great attention to their strength, flexibility, elasticity, and acoustic properties.
One of the most innovative ways to recycle rubber waste is devulcanization. When recycling or reusing vulcanized rubber, it is especially important to find suitable and safe ways to devulcanize it, so that the poly-, di-, and monosulphide bonds formed during vulcanization are completely or partially broken. Devulcanization defines the process through which vulcanized waste rubber is transformed into a state where it can be re-vulcanized after further processing. The use of devulcanized rubber can reduce the cost of new products. Devulcanized rubber can be used on its own to make new products, and it can also be mixed with raw rubber or other polymers. Different rubber devulcanization methods are described in the literature [10]. During the devulcanization process, the cross-links between sulphur–sulphur (S-S) and carbon–sulphur (C-S) are broken in order to prevent damage to the main carbon–carbon (C-C) chain. Therefore, the energy required to break the crosslinks must be controlled during all devulcanization processes. It is theoretically possible to break the cross-links without damaging the main polymer chain, because slightly less energy is required to break the cross-links. The amount of energy required to break the cross-links for C-C is 348 kJ/mol; C-S, 273 kJ/mol; and S-S, <227 kJ/mol [3]. Devulcanization consists of two stages: pre-process treatment and devulcanization. The main method of pre-process treatment is grinding. There are several grinding methods: ambient, cryogenic, wet grinding, and ozonation [11,12,13]. Devulcanization methods include chemical [14,15,16], ultrasound [17,18], microwave [19], biological [20], thermomechanical [12], and devulcanization in supercritical carbon dioxide (CO2) [21,22].
Materials with high sound insulation and absorption properties can be made from recycled rubber waste. Rubber particle size has an effect on sound absorption behaviour [23]. Due to its inherent good damping properties, rubber is superior to many other materials available in acoustic applications.
The used tyre waste could be used in the fibre form to make sound absorbers [24]. Fibres or particles from waste tyres or other products could be mixed with other substances, such as plant flour or fibres, polypropylene, or polyethylene, where rubber acts as an acoustic reinforcing unit. In this case, rubber–fibre–rubber layered construction panels could be used as sound absorbers [25]. Additionally, rubber waste can be combined with different backing plates, such as plasterboards and oriented strand boards, by creating multilayer acoustic systems [26].
Multilayer constructions could be used as effective sound reducing materials in applications such as building acoustics and automotive engineering. Many theories have been developed for designing and optimising the acoustic properties of multilayer materials. Prediction methods are often needed, instead of direct measurements, to know the acoustical properties of the constructions [27]. One of the methods through which the acoustic properties of multilayer constructions can be predicted is the transfer matrix method (TMM). This method allows for the investigation of wave propagation and sound transmission through different media. TMM has the possibility to analyse the sound absorption and transmission properties of acoustical systems, evaluate performance based on periodicity [28], and analyse the derivation of the effective property expression of a porous layer [29]. In this method, every layer of the construction could be described as a different transfer matrix. All transfer matrices of the different layers could be multiplied, and the transmission coefficient of the multilayer construction could be calculated.
In this article, the TMM was used for the prediction of transmission loss in multilayer constructions, and the results were compared with the experimental data.

2. Materials and Methods

This section presents material preparation and measurement methods used for this article.

2.1. Sample Preparation Methodology

Rubber samples were made from rubber granules obtained using ozonation to separate the rubber from the tyre structure. Three different types of rubber granules were used for the production of rubber samples:
  • Small fraction (obtained with the grinding method) (size, 0.1–2 mm);
  • Large fraction (obtained with the grinding method) (size, 5–12 mm);
  • Chemically devulcanized fraction (size, 1–5 mm) (Figure 1).
After chemical processing, rubber granules with higher porosity and a partially fibrous structure were obtained. Granules with higher porosity were found to have better sound absorption. A total of 15 different rubber granule samples were produced, the composition of which is shown in Table 1.
Rubber samples were prepared in a specimen preparation room. The rubber granules were firstly divided according to the proportions and poured into separate containers. Each preparation was poured into a mixing tank and thoroughly mixed to ensure an even distribution of the granules. An appropriate amount of polyurethane waste resin was poured into the mixed sample, and the sample was thoroughly mixed again. After mixing the rubber granules with the polyurethane resin, a hardener was added, and everything was mixed again. The amount of hardener and polyurethane resin in each sample was the same but is not disclosed due to confidentiality. The rubber mixture was placed in a 40 cm × 40 cm frame and was left to harden (Figure 2).
After the mass of rubber granules solidified, samples of a 30 mm diameter were cut with a special tool and tested in an impedance tube. In total, 3 samples of the same rubber composition were made, which were used for the measurements.
During the experimental studies, multilayer constructions were made. Rubber samples of different thicknesses (12 mm, 25 mm, and 50 mm) were placed between two plasterboard panels GKB (density, 680 kg/m3) and GKFI (density, 1030 kg/m3). The samples were tested in an impedance tube by measuring transmission loss values.

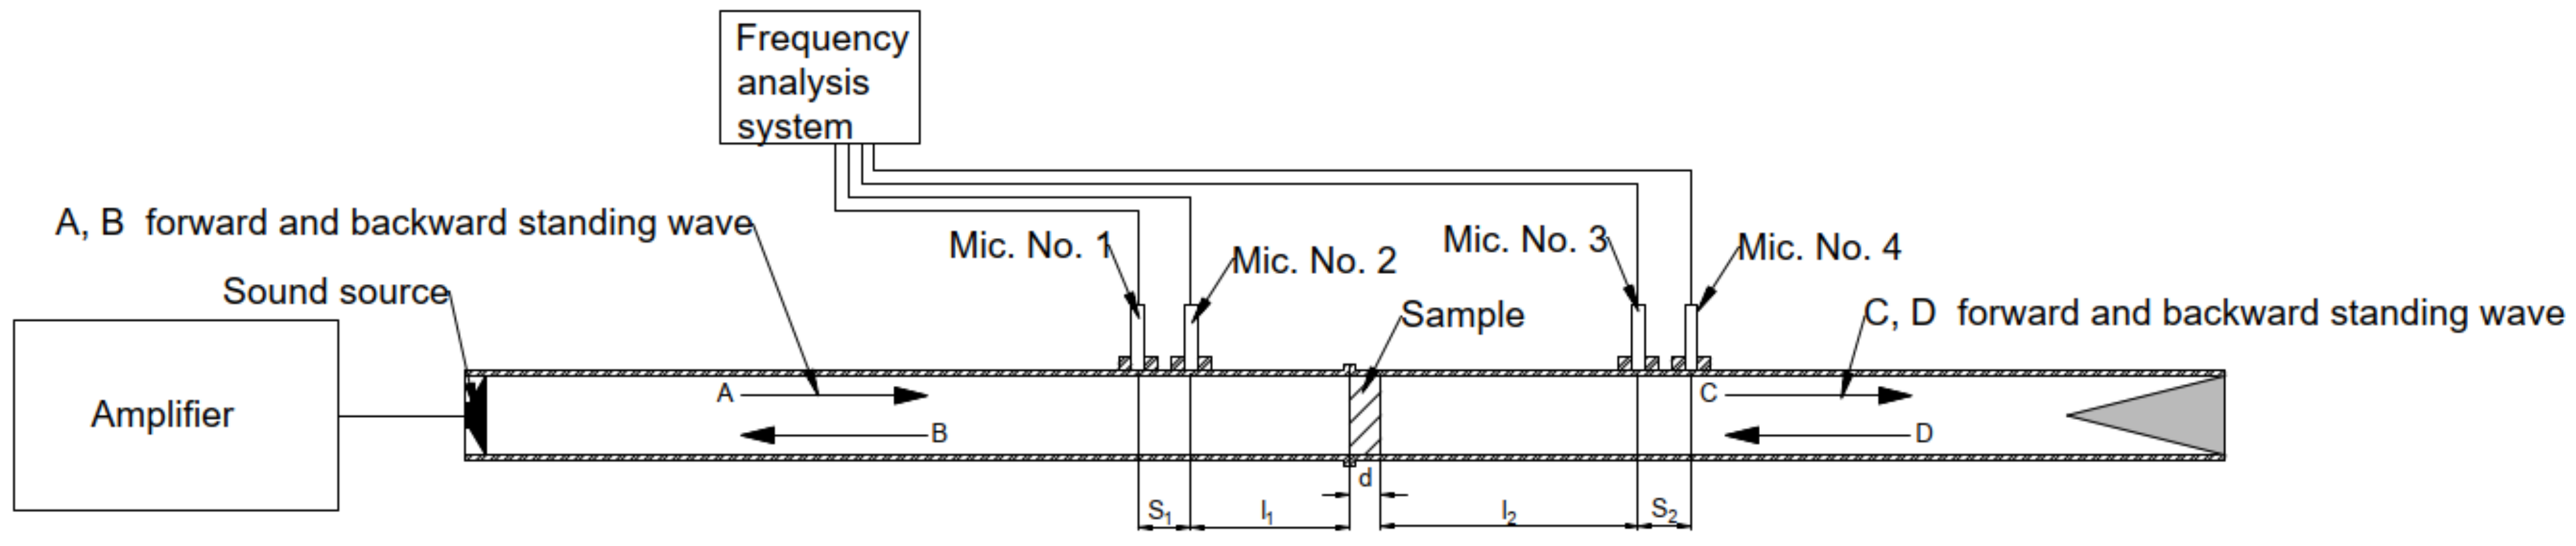
2.2. Methodology of the Experimental Research of Transmission Loss in an Impedance Tube

Several methods have been published to measure the transmission loss of a plane wave of a normal incidence angle through acoustic materials. Two different methods can be found in the literature for studying the transmission loss with an impedance tube. The first method is the transfer function method, and the second is based on wave decomposition theory [30,31]. The transfer function method was used in this research. The most commonly cited TMMs are the two-load method described by Lung and Doige [32] and the two-source method proposed by Munjal and Doige [33]. These methods are commonly referred to as the four-microphone method, where two microphones are mounted in front of the test object and the other two microphones are placed behind the test object. Using the two-load method, one end of the tube has a speaker that emits sound, while microphones measure the sound level simultaneously. Meanwhile, with the two-source method, sound pressure measurements are taken with the loudspeaker mounted at one end of the tube, and the measurements are repeated with the loudspeaker mounted at the other end of the tube. It has been established that, theoretically, both methods provide the same results and accurate results of the transmission loss of the acoustic element are obtained [30]. In this article, a four-microphone system was used to study the transmission loss (Figure 3). The methodology was prepared based on the ASTM E2611-17 [34] standard.
At the beginning of the study, the speed of sound and the density of the air must be determined. The speed of sound was calculated according to Equation (1):
c = 20.047 273.15 + t
where t—temperature, °C.
Air density was calculated according to Equation (2):
ρ = 1.290 P 101.325 273.15 273.15 + t
where t—temperature, °C; P—air pressure, Pa.
Forward and backward traveling waves were calculated according to Equations (3)–(6):
A = j H 11 e j k l 1 H 21 e j k l 1 + s 1 2 sin k s 1
B = j H 21 e + j k ( l 1 + s 1 ) H 11 e + j k l 1 2 sin k s 1
C = j H 31 e + j k ( l 2 + s 2 ) H 41 e + j k l 2 2 sin k s 2
D = j H 41 e j k l 2 H 31 e j k l 2 + s 2 2 sin k s 2
where H11, H12, etc.—transfer function between two microphones; s1 and s2—distance between microphones, m; k—wave number 2πf/c; f—frequency, Hz.
Acoustic pressure and particle velocity on both sides of the sample were calculated according to Equations (7)–(10) (x = 0 and x = d).
p 0 = A + B
u 0 = A + B / ρ c
p d = C e j k d + D e + j k d
u d = C e j k d D e + j k d / ρ c
The transfer matrix was calculated from the pressure and particle velocity values (Equation (11)).
T = p d u d + p 0 u 0 p 0 u d + p d u 0 p 0 2 p d 2 p 0 u d + p d u 0 u 0 2 u d 2 p 0 u d + p d u 0 p d u d + p 0 u 0 p 0 u d + p d u 0
The transmission coefficient was calculated according to Equation (12):
t = 2 e j k d T 11 + T 12 ρ c + ρ c T 21 + T 22
Transmission loss was calculated according to Equation (13):
T L = 20 log 1 t
The transmission loss adequately characterises the ability of material to isolate sound, and specifies the characteristics of the material in terms of its porosity and ability to reflect and absorb sound.

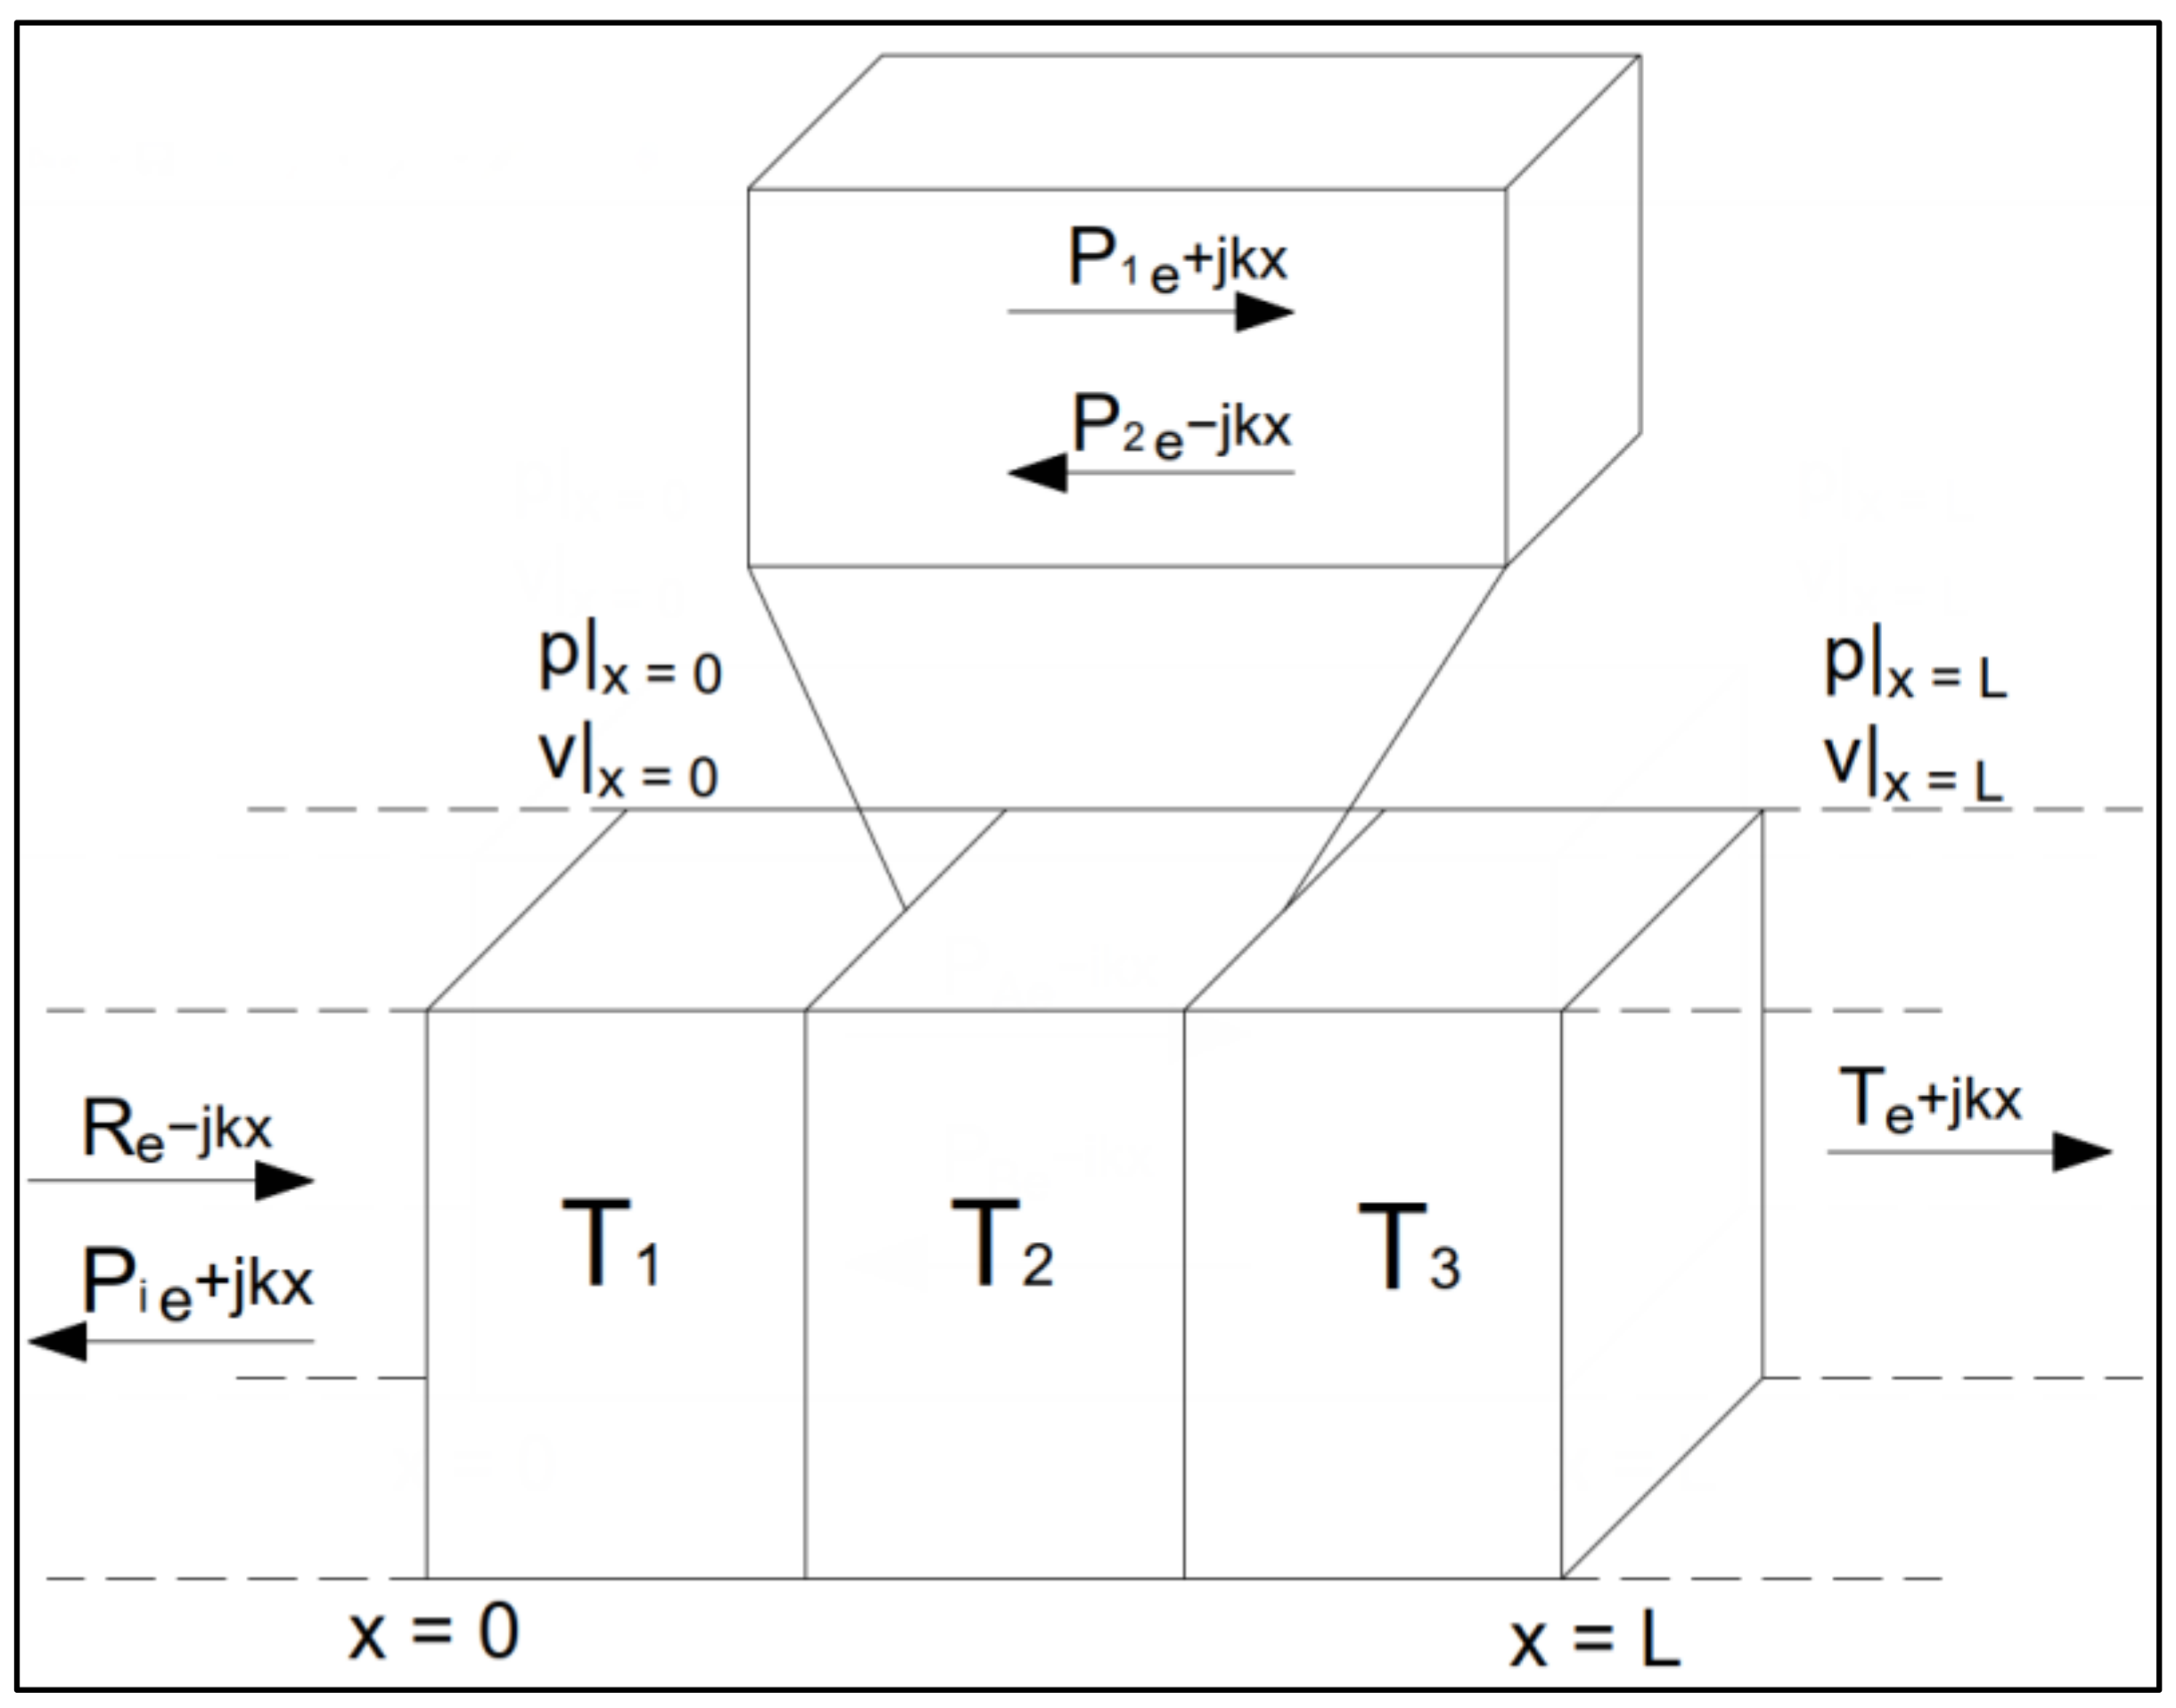
2.3. Methodology of Predicting Transmission Loss According to Transfer Matrix Method (TMM)

To determine a transfer function for the element, it is important to set the conditions before the element (x = 0) and behind it (x = L). The main parameters that represent the conditions were the pressure p and particle velocity v. The pressure of the forward and backward waves was described with Equations (11)–(15):
Forward wave:
p x = P A e i k x
Backward wave:
p x = P B e i k x
Total pressure was described with Equation (16):
p x = P A e i k x + P B e i k x
Total particle velocity inside the element was described with Equation (17):
v x x = P A Z e i k x P B Z e i k x
where Z—acoustic impedance, Z = ρc; k—wave number, k = ω/c.
The pressure and particle velocity at boundaries (Figure 4) was described with Equations (18)–(21):
At x = 0,
p x | x = 0 = P A + P B  
Z v x x | x = 0 = P A P B
At x = L,
p x | x = L = ( P A + P B ) cos k L i ( P A P B ) sin k L  
v x | x = L = ( P A P B ) Z cos k L i ( P A P B ) Z sin k L  
where L—length of the element, m.
The following expression is given by combining both formulas (Equations (22) and (23)):
p x | x = L = cos k L p x | x = 0 i Z sin k L v x x | x = 0
v x x | x = L = cos k L v x x | x = 0 i 1 Z sin k L p x | x = 0
The following expressions can be written as a matrix (Equation (24)):
p v x x = 0 = cos k L i Z s i n k L i 1 Z sin k L cos k L p v x x = L
The total matrix could be represented as follows (Equation (25)):
p v x x = 0 = T p v x x = L
According to the scheme in Figure 5, a matrix can be calculated for each element layer (Equations (26) and (27)):
T 1 = cos k 1 L 1 i Z 1 sin k 1 L 1 i s i n k 1 L 1 Z 1 cos k 1 L 1  
T n = cos k n L n i Z n s i n k n L n i s i n k n L n / Z n c o s k n L n  
The total matrix of an element could be described as the multiplication of all component matrices of an element (Equations (28) and (29)):
T = n = 1 N T n
T = T 11 T 12 T 21 T 22 = cos k e f f L i Z e f f k e f f L i 1 Z e f f s i n ( k e f f L ) cos k e f f L
The transmission coefficient was calculated according to Equation (30):
T = 2 e i k L T 11 + T 12 Z 0 + T 21 Z 0 + T 22
Transmission loss was calculated according to Equation (31):
T L = 10 l o g 10 T 2
The transmission loss for a structure consisting of a two-plasterboard—between which was a porous medium—rubber sample was solved in the theoretical study. The main characteristics that describe the porous medium were the acoustic impedance and the wave number. The acoustic impedance and wave number were measured in the impedance tube.
To solve the task of the theoretical model, a transfer matrix was constructed, which is represented in Equation (32):
T = T w T f T w T = T w T f T w
where Tw—transfer matrix of elastic wall; Tf—transfer matrix of porous cavity.
The expanded transfer matrix is represented in Equation (33):
T = 1 Z 1 0 1 cos k 0 , z L i Z f k 0 k 0 , z sin k 0 , z L i Z f k 0 , z k 0 sin ( k 0 , z L ) cos k 0 , z L 1 Z 2 0 1
where k0,z—wave number, m−1; Zf—characteristic acoustic impedance of porous cavity, Pa·s/m; Z1 or Z2—acoustic impedance of elastic wall ( Z 1 i ω m 1 ;   Z 2 i ω m 2 ); m1 and m2—mass of the elastic wall, kg/m2.
The transmission coefficient was calculated according to Equation (34):
T = 1 1 + Z 1 + Z 2 2 Z f cos k 0 L + i 1 + Z 1 + Z 2 2 Z f + Z 1 Z 2 2 Z f 2 sin k 0 L
The transmission loss value was calculated according to Equation (35):
T L = 10 l o g 10 T 2

3. Results

This paragraph presents the transmission loss results of the TMM analysis and experimental research in an impedance tube.

3.1. Transmission Loss Results of TMM Analysis

The characteristic acoustic impedance and wave number of each rubber sample (samples no. 1–15) were measured in the impedance tube. These values were used to calculate the transfer matrix.
Figure 6 represents the results of the theoretical calculation of transmission loss using 15, 25, and 50 mm thick rubber granule samples that were mounted between two plasterboards. The air cavity was filled with insulating material that dampened the wave motion parallel to the walls. The porous space acted like a spring where mass–air–mass resonance occurs at a given frequency. According to this theory, the mass–air–mass resonance was equal to Equation (36):
f 0 = 1 2 π 3.6 ρ 0 c 0 2 m d
where m = 2 m 1 m 2 m 1 + m 2 is the effective mass per unit area of the construction, kg/m2; d—panel spacing, m; ρ—density, kg/m3; c—speed of sound, m/s.
According to the theory, below the mass–air–mass resonance, two panels acted as one mass and the transmission loss agreed with the mass law of all of the structure. Above the mass–air–mass resonance, the effect of the porous cavity increased the transmission loss. The ideal transmission loss should increase by 6(2N − 1) for N panels per octave. For that reason, at high frequencies, multiple-panel designs with intermediate air spaces can achieve a significant increase in transmission loss compared to a single panel.
Analysing the simulation results with 12 mm thick rubber samples, at low frequencies from 250 Hz to 1250 Hz, the transmission loss values calculated with the theoretical model increased according to the mass law below mass–air–mass resonance. A layer of 12 mm porous media was sufficiently thin, since the mass–air–mass resonance was determined at 4000 Hz. As the layer of porous medium was increased to 25 mm, the resonant frequency shifted to lower frequencies. In constructions with 25 mm thick rubber granule samples, the resonant frequency was determined at 2500–3000 Hz. As described in theory, transmission loss values increase significantly by about 12–15 dB per octave from the resonance frequency. After doubling the thickness of the porous medium to 50 mm, the resonant frequency appeared at 2000 Hz. However, due to resonant modes, an additional resonance occurs between the two plates, which caused a series of closed-medium resonances, which were calculated with Equation (37):
f n = c 0 2 π d
In this case, the first cavity resonance occurs at 3500–4000 Hz. Sound insulation values up to the mass–air–mass resonance increased by an average of 6 dB per octave, while above the mass–air–mass resonance, the values increased by about 12 dB per octave (consistent with theory), while with each subsequent resonance, the value increased by an additional 6 dB per octave.
Figure 7 shows the difference in the transmission loss results using plasterboards of GKB and GKFI of different densities. The results of the theoretical study showed that when the density of the structure increased by 30%, the transmission loss results increased by 4–5 dB over the entire frequency band. According to the theory, the density of the outside materials determines the sound insulation of the structure, as described to the mass law. Therefore, in this case, by increasing the mass of the structure, the sound insulation also increased.

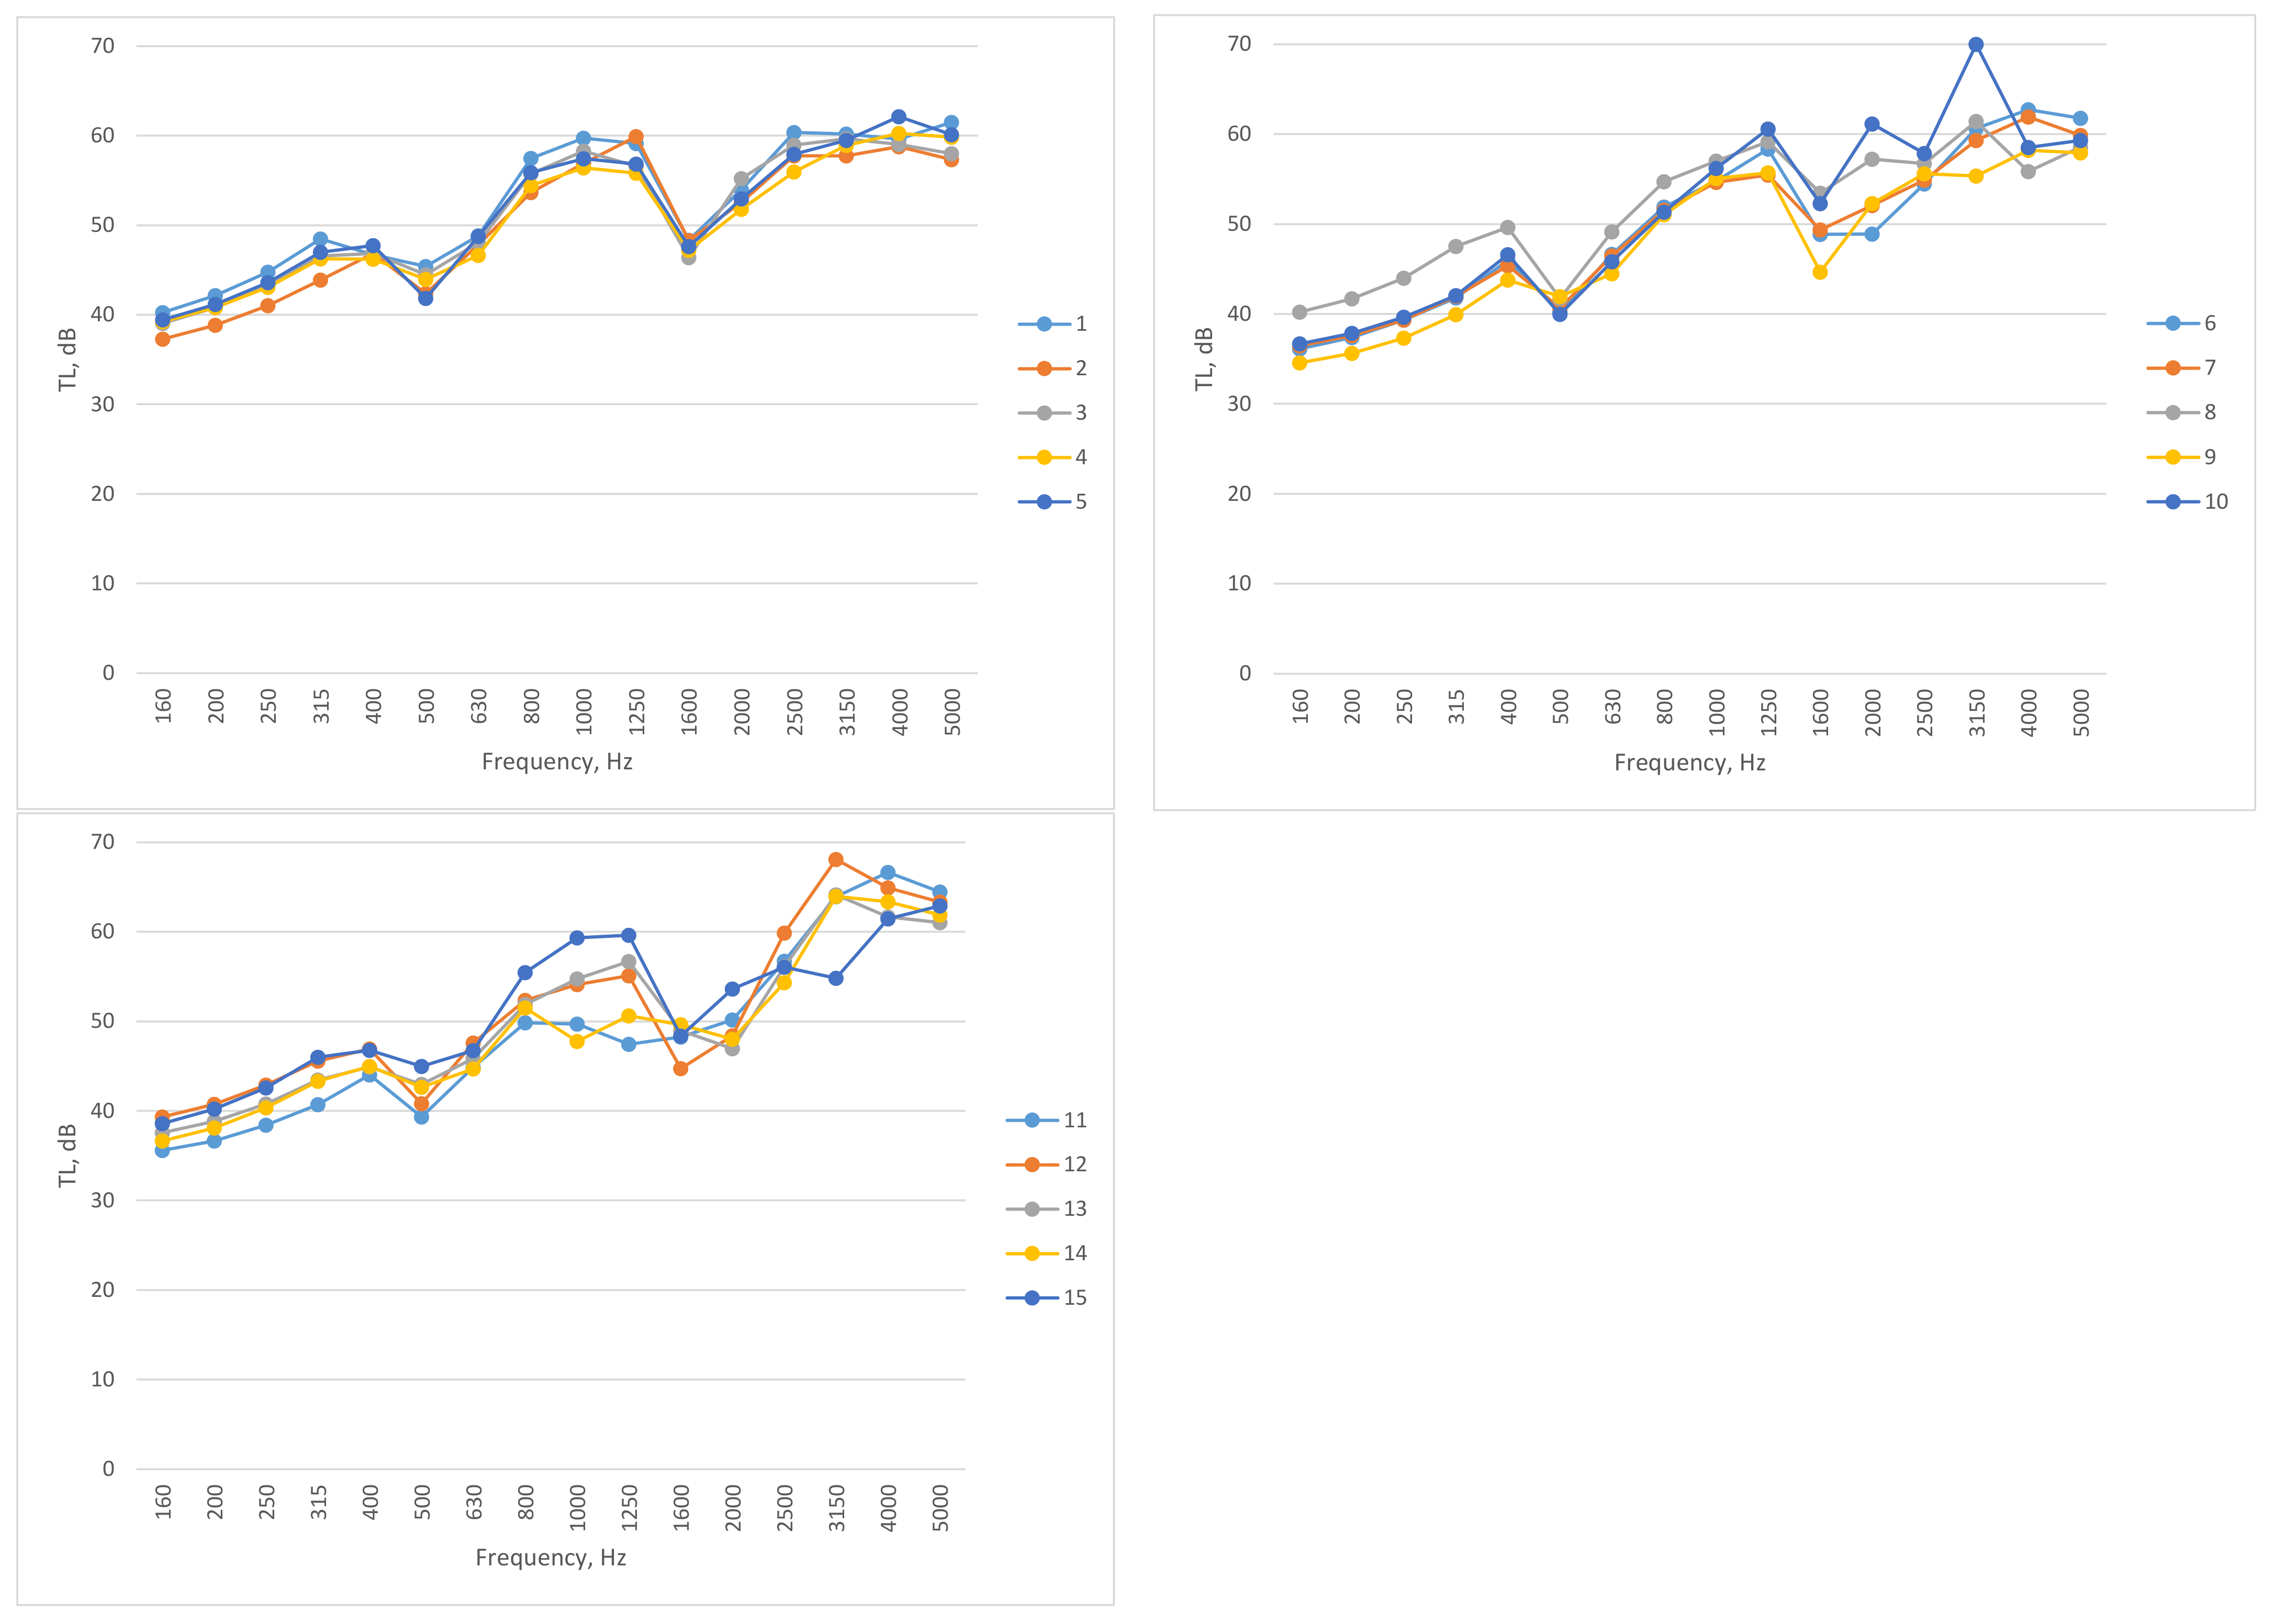
3.2. Experimental Results of Transmission Loss in an Impedance Tube

The transmission loss measurements of multilayered elements consisting of two plasterboard panels and a sample of rubber granules (thickness: 12 ± 2 mm, 25 ± 2 mm, and 50 ± 2 mm) were carried out in the impedance tube according to the methodology described in Section 2.2. Two different plasterboard panels were used for the experiments, a low-density gypsum board, GKB (680 kg/m3), and a high-density gypsum board, GKFI (1030 kg/m3). This type of plasterboard panels was selected considering the fact that they are the most commonly used panels in the construction industry to improve the sound insulation of walls. The name of the constructions in the graphs depends on the rubber sample number given in Table 1.
Figure 8 shows the transmission loss results of 12 ± 2 mm thick rubber granule samples with a gypsum board (GKB). Such constructions acted as a double construction consisting of a dense, solid material on both sides, in this case, a gypsum board (GKB) (thickness: 12.5 mm), which were separated by a porous medium—a rubber granule board. The total thickness of the construction was 37 ± 2 mm. An analysis of the results showed that in all cases, the values of the sound transmission loss of structures at low frequencies gradually increased according to the mass law. At low frequencies, the better sound insulation was characterised by constructions with a denser sample of rubber, in this case, constructions No. 1, 4, 5, and 15. The resonance frequency of such thin structures started from 4000–5000 Hz; the same trends were also determined with the TMM analysis. The resonant frequency depends on the gap between the plates of the structure, which was filled with rubber. The resonant frequency of structures depends not only on the weight of the structure but also on its thickness. Since the thickness of the rubber samples varied in the range of ±2 mm, the resonant frequency shifted to different frequencies, which showed that increasing the thickness of the structure made the resonant frequency shift to lower frequencies. When evaluating the transmission loss values of all structures in general, there was a clear trend that structures with a denser rubber granule board had better sound reduction results since the sound insulation of the structure was largely determined with its mass. However, it is necessary to consider the fact that the sound insulation performance of the structure was mostly dependent on the characteristics of the porous medium. Whilst evaluating the results, it could be seen that the transmission loss values of constructions 6–10 were lower compared to others. These rubber granule mixtures consisted of three different fractions of rubber granules mixed in a certain ratio, while all other rubber samples consisted of two or one fraction. According to the results of the research, it could be stated that it was more efficient to use rubber granule panels 1, 5, and 15 composed of one fraction in this case. There was also a tendency that structures whose rubber granule plate consisted of small and large fractions of rubber granules, obtained with the grinding method, had worse transmission loss values.
Figure 9 presents the results of the transmission loss of 12 ± 2 mm thick samples of rubber granules with 15 mm thick plasterboard (GKFI) on both sides. The total thickness of the construction was 42 ± 2 mm. Gypsum boards GKB and GKFI differed in their density. The GKFI board was about 30% heavier than the GKB board. Based on the fact that sound insulation depends on the mass, it can be said that when using a denser plate, the values of sound transmission reduction must be higher. Based on the research results and comparing them with the results presented in Figure 8, it was determined that the transmission loss values were higher by 3–5 dB throughout the frequency band. The trends of the transmission loss remained the same as in the studies with GKB panels, and the transmission loss values increased from 250 Hz to the mid-frequencies at 1250–1600 Hz, where the values decreased, in some cases by up to 10 dB due to resonances. Based on the results of the TMM analysis, the mass–air–mass resonance was determined from 5000 Hz. Compared with the data presented in Figure 8, the resonant frequency shifted to lower frequencies as the thickness of the structure increased. The highest values of transmission loss were determined before mass–air–mass resonance and reached up to 65 dB. According to experimental results of transmission loss, the same tendency remained that constructions consisting of higher-density rubber granule panels 1, 4, 5, and 15 provided better results. Also, the same trend remained that structures with rubber granule panels consisting of two or one fraction of rubber granules performed better. The results showed that panels 1, 5, and 15, which consist of only one fraction of rubber granules, had the highest results, while panels 6–10, which consist of a total of three fractions of rubber granules mixed in different proportions, showed worse sound reduction values.
Figure 10 presents the results of the transmission loss of the structure with 25 ± 2 mm thick rubber granules and 12.5 mm thick plasterboard (GKB) on both sides. The total thickness of the construction was 50 ± 2 mm. When comparing the constructions with 12 mm rubber samples, it was clearly noticeable that the resonant frequency in this case was more clearly expressed and was reached at 500 Hz. From the resonance frequency values increased from according to the mass law to the mass–air–mass resonance, which was determined at 2000–2500 Hz. Compared to the TMM results, the resonant frequency was at lower frequencies. From mass-air-mass resonance transmission loss values continued to increase and reached up to 56–69 dB. When evaluating the transmission loss results of different structures, it was found that structures with higher-density rubber granule samples (1, 3, 6, and 15) isolated sound better at low frequencies, but these samples also had more clearly expressed resonant frequencies. It was also found that when the mass of the entire structure increased, the transmission loss values increased over the entire frequency band, while when the gap between the plates increased, the resonant frequency shifted towards lower frequencies. When comparing structures with 12 and 25 mm thick samples, the sound transmission reduction values with 25 mm samples were, on average, 4 dB higher than with 12 mm samples.
Figure 11 represents the experimental results of transmission loss of a structure, which consisted of the 25 ± 2 mm thick rubber sample and 15 mm thick plasterboard (GKFI) on both sides. The total thickness of the construction was 55 ± 2 mm. According to the test results, it was found that at low frequencies, the values increased according to the mass law up to the resonant frequency. Comparing results with the structures with 12 mm rubber samples, the resonant frequency was more clearly expressed and was measured at 500 Hz. From the value of the resonant frequency, there was a rise of 8 dB per octave to mass–air–mass resonance. The mass–air–mass resonant frequency was determined at 1600–2000 Hz. From the mass–air–mass resonance, the values increased by 12 dB per octave and reached transmission loss values of 57–69 dB. It was found that constructions with higher-density rubber granule samples (10, 11, and 12) isolated sound better at low frequencies, but these samples also had more clearly expressed resonant frequencies than constructions with 12 mm rubber samples. Based on the results, it was seen that when the mass of the whole structure increased, the values of the sound transmission loss increased over the entire frequency band, while when the gap between the plates increased, the resonant frequency shifted towards lower frequencies. When comparing structures with 12 and 25 mm thick rubber samples, the sound transmission reduction values with 25 mm samples were, on average, 2 dB better than with 12 mm samples.
Figure 12 presents the experimental results of sound transmission loss in an impedance tube, investigating 50 ± 2 mm rubber granule samples with 12.5 mm thick plasterboard (GKB) on both sides. The total thickness of the construction was 75 ± 2 mm. According to the test results in an impedance tube with 50 ± 2 mm rubber samples, the values increased according to the mass law at low frequencies up to the resonant frequency as in all other experimentally tested structures. When comparing the constructions with 12 and 25 mm rubber samples, it was noticed that the resonant frequency in this case was clearly expressed and was determined at 500 Hz. From the resonant frequency, values increased by 8 dB per octave up to 1600–2000 Hz, where mass–air–mass resonance occurs between the two boards. By increasing the gap between the plates by using a thicker rubber sample, mass–air–mass resonance shifts towards lower frequencies. At 4000 Hz, a first cavity resonance occurred and where values decreased, but from that frequency transmission loss again increased 12–15 dB per octave. The best values were in high frequencies and reached 57–64 dB. In this case, structures with 10, 12, and 13 rubber samples, which had a higher density, isolated the sound better. Transmission loss values and trends matched the TMM prediction. When comparing structures with samples of a 12 mm, 25 mm, and 50 mm thickness, the sound transmission loss values with samples of 50 mm were, on average, 1.5 dB better than structures with 25 mm samples and 5.5 dB better than structures of 12 mm rubber samples.
Figure 13 presents the results of the transmission loss of 50 ± 2 mm thick rubber samples with 15 mm thick plasterboard (GKFI) on both sides. The total thickness of the construction was 80 ± 2 mm. Test results showed that with 50 ± 2 mm rubber samples, the values of the transmission loss increased according to the mass law up to the resonant frequency at 500 Hz. The decrease in transmission loss values was 4–6 dB at the resonant frequency. From the resonant frequency, the transmission loss values increased by 8 dB per octave up to 1250–1600 Hz, where mass–air–mass resonance occurred. At 4000 Hz, the first cavity resonance appeared, and the values decreased again by 2–4 dB. The best transmission loss values were reached at high frequencies (3150 Hz) and reached 62–69 dB. The structures with rubber samples 10, 11, and 12, which had a higher density in this case, had the highest results. The transmission loss results and overall trends were similar to the results of the TMM analysis. Comparing structures with 12 mm, 25 mm, and 50 mm thick samples, the sound transmission reduction values with 50 mm samples were, on average, 3 dB better than structures with 25 mm samples and 5 dB better than structures with 12 mm rubber pellet samples.
In general, when evaluating the transmission loss values of all tested constructions, it was found that when using higher-density plasterboard panels, the sound transmission reduction values increased depending on the change in the mass of the structure, but no clear difference was found between the use of different samples of rubber granules. Studies revealed some trends between the densities of the rubber samples, but the differences were not clearly noticeable. When increasing the thickness of the rubber sample, it was found that doubling the thickness of the sample increased the average value of sound transmission by approximately 3 dB (Table 2).
When the results of the TMM analysis were compared with the measured values, similar trends were found. The resonant frequencies of the structures were set at similar frequencies. When the thickness of the rubber sample was increased, the resonant frequencies shifted toward the lower frequency range. Up to the mass–air–mass resonance, transmission loss values increased according to the mass law in both experimental measurements and the TMM analysis. From the mass–air–mass resonance, the transmission loss values increased 6 dB more in each octave, comparing with the values before mass–air–mass resonance. When the thickness of the rubber sample was increased to 50 mm, an additional air cavity resonance occurred. The same resonance would be found in thinner samples, but they are above the measured frequency range. In the overall analysis of the results, the results and trends of the TMM analysis agreed with the results of the experimental test, so it can be applied to the analysis of multilayer constructions with rubber samples.

4. Discussion

This article presented a TMM analysis and experimental results of multilayer constructions with devulcanized waste rubber. Three different rubber fractions were used in this research, two of which were obtained with the grinding method, and one was chemically devulcanized. Creating such multilayer constructions, which can be used as acoustic barriers to reduce noise from devices, ensures the principle of a circular economy, when waste is reused in other areas. The aim of the study was to experimentally determine transmission loss values of multilayer constructions and to additionally evaluate the efficiency of such constructions in a TMM analysis. When evaluating the results of the study, the main emphasis was placed on the modelling of resonant frequencies and the comparison with experimental studies. During the research, it was found that the results obtained in the TMM analysis coincide with the results of experimental studies. Comparing the results obtained in this article with the results obtained by other authors, the same trends were found. Lee with co-authors determined the transmission loss of multilayered constructions in their article and compared it with TMM results [27]. Based on the results of these scientists, it was determined that the sound insulation values of multilayered structures depended on the mass of the structure, while the resonances depended on the thickness of the porous medium and their characteristics. The structures were made of two solid layers with a porous cavity between them, and transmission loss values increased over the entire frequency band and reached the best values at high frequencies (40–50 dB), while resonances were determined at medium frequencies at 500–2000 Hz, which coincides with the results that are represented in this article. Kim with co-authors studied multilayered micro perforated plates and found that cavity resonance was determined for double structures at high frequencies [35]; this, in our case, was also determined with 50 mm thick rubber pellet samples at 4000 Hz. Long presented the theory of multilayered construction calculations in his research paper [36]. Compared with the results of this researcher and the presented formulas, the experimental and simulation results presented in this article also followed these trends, as the resonant frequencies shifted towards the low-frequency zone as the thickness increased, and the overall transmission loss of the structure depended on the overall mass of the structure. In conclusion, after evaluating the results and comparing them with the results obtained by other authors, it can be stated that the TMM analysis results described in the article matched general trends, and a TMM analysis can be applied to the modelling of multilayered constructions with devulcanized rubber granule samples.

5. Conclusions

  • After the TMM analysis, it was found that by increasing the thickness of the rubber sample, it was possible to control the mass–air–mass resonance of the structure. In prediction with 12 mm samples, the mass–air–mass resonance was determined at 4000 Hz and with 25 mm, at 2500–3000 Hz, while with 50 mm thick samples, the mass–air–mass resonance was at 2000 Hz, but additional air cavity resonance also occurred, which was determined at 3500–4000 Hz. When comparing the TMM results with the experimental results, it could be stated that in the experimental studies, the resonant frequencies were set at slightly lower frequencies, but the trends remained the same.
  • According to experimental results of transmission loss, constructions with 50 mm thick samples had, on average, 3 dB better results than the structures with 25 mm samples and 5 dB better results than the structures with 12 mm thick rubber samples.
  • According to experimental studies, it was found that higher-density plasterboards (GKFI) increased the overall transmission loss value of the structure by 5 dB. The same trends were determined with the TMM method.
  • Constructions with denser rubber samples (10 and 11) generally showed better results, but very clear trends were not expressed. In this case, it depended more on the dynamic properties of the rubber sample, which were not determined in the scope of this study.

Author Contributions

Conceptualization, T.V. and T.J.; methodology, T.V.; software, T.V.; validation, T.V. and T.J.; formal analysis, T.V.; investigation, T.V.; resources, T.V. and T.J.; data curation, T.J.; writing—original draft preparation, T.V.; writing—review and editing, T.J.; visualization, T.V.; supervision, T.J.; project administration, T.J.; funding acquisition, T.J. All authors have read and agreed to the published version of the manuscript.

Funding

This research received no external funding.

Institutional Review Board Statement

Not applicable.

Informed Consent Statement

Not applicable.

Data Availability Statement

Research details can be provided upon request to the corresponding author.

Acknowledgments

We would like to thank the VILNIUS TECH Institute of Environmental Protection for access to the impedance tube.

Conflicts of Interest

The authors declare no conflict of interest.

References

  1. Khan, S.U.; Ahmed, A.; Ali, S.; Ayub, A.; Shuja, A.; Shahid, M.A. Use of scrapped rubber tires for sustainable construction of manhole covers. J. Renew. Mater. 2021, 9, 1013–1029. [Google Scholar] [CrossRef]
  2. Chen, Z.; Liang, Y.; Lin, Y.; Cai, J. Recycling of waste tire rubber as aggregate in impact-resistant engineered cementitious composites. Constr. Build. Mater. 2022, 359, 129477. [Google Scholar] [CrossRef]
  3. Wiśniewska, P.; Wang, S.; Formela, K. Waste tire rubber devulcanization technologies: State-of-the-art, limitations and future perspectives. Waste Manag. 2022, 150, 174–184. [Google Scholar] [CrossRef] [PubMed]
  4. Formela, K. Waste tire rubber-based materials: Processing, performance properties and development strategies. Adv. Ind. Eng. Polym. Res. 2022, 5, 234–247. [Google Scholar] [CrossRef]
  5. Najim, K.B.; Hall, M.R. Mechanical and dynamic properties of self-compacting crumb rubber modified concrete. Constr. Build. Mater. 2012, 27, 521–530. [Google Scholar] [CrossRef]
  6. Kovler, K.; Roussel, N. Properties of fresh and hardened concrete. Cem. Concr. Res. 2011, 41, 775–792. [Google Scholar] [CrossRef]
  7. Uyguno, T.; Topçu, I.B. The role of scrap rubber particles on the drying shrinkage and mechanical properties of self-consolidating mortars. Constr. Build. Mater. 2010, 24, 1141–1150. [Google Scholar] [CrossRef]
  8. Medina, N.F.; Garcia, R.; Hajirasouliha, I.; Pilakoutas, K.; Guadagnini, M.; Raffoul, S. Composites with recycled rubber aggregates: Properties and opportunities in construction. Constr. Build. Mater. 2018, 188, 884–897. [Google Scholar] [CrossRef]
  9. Gerges, N.N.; Issa, C.A.; Fawaz, S.A. Rubber concrete: Mechanical and dynamical properties. Case Stud. Constr. Mater. 2018, 9, e00184. [Google Scholar] [CrossRef]
  10. Asaro, L.; Gratton, M.; Seghar, S.; Hocine, N.A. Recycling of rubber wastes by devulcanization. Resour. Conserv. Recycl. 2018, 133, 250–262. [Google Scholar] [CrossRef]
  11. Karger-Kocsis, J.; Mészáros, L.; Bárány, T. Ground tyre rubber (GTR) in thermoplastics, thermosets, and rubbers. J. Mater. Sci. 2013, 48, 1–38. [Google Scholar] [CrossRef]
  12. Costamagna, M.; Brunella, V.; Luda, M.P.; Romagnolli, U.; Muscato, B.; Girotto, M.; Baricco, M.; Rizzi, P. Environmental assessment of rubber recycling through an innovative thermo-mechanical devulcanization process using a co-rotating twin-screw extruder. J. Clean. Prod. 2022, 348, 131352. [Google Scholar] [CrossRef]
  13. Meysami, M. A Study of Scrap Rubber Devulcanization and Incorporation of Devulcanized Rubber into Virgin Rubber Compounds. 2012, p. 216. Available online: https://uwspace.uwaterloo.ca/handle/10012/6609 (accessed on 14 May 2023).
  14. Wang, W.; Hao, K.; Guo, X.; Liu, F.; Xu, Y.; Guo, S.; Bai, L.; Liu, G.; Qu, L.; Liu, M.; et al. Mechano-chemical rubber reclamation using aminolysis products of waste flexible polyurethane foams as the devulcanizing agent. J. Clean. Prod. 2023, 384, 135421. [Google Scholar] [CrossRef]
  15. Wang, Z.; Pan, C.; Hu, Y.; Zeng, D.; Huang, M.; Jiang, Y. High-quality ground tire rubber production from scrap tires by using supercritical carbon dioxide jet pulverization assisted with diphenyl disulfide. Powder Technol. 2022, 398, 117061. [Google Scholar] [CrossRef]
  16. Saputra, R.; Walvekar, R.; Khalid, M.; Mubarak, N.M.; Sillanpää, M. Current progress in waste tire rubber devulcanization. Chemosphere 2021, 265, 129033. [Google Scholar] [CrossRef] [PubMed]
  17. Isayev, A.I.; Liang, T.; Lewis, T.M. Effect of particle size on ultrasonic devulcanization of tire rubber in twin-screw extruder. Rubber Chem. Technol. 2014, 87, 86–102. [Google Scholar] [CrossRef]
  18. Mangili, I.; Lasagni, M.; Huang, K.; Isayev, A.I. Modeling and optimization of ultrasonic devulcanization using the response surface methodology based on central composite face-centered design. Chemom. Intell. Lab. Syst. 2015, 144, 1–10. [Google Scholar] [CrossRef]
  19. Vahdatbin, M.; Jamshidi, M. Using chemical agent in microwave assisted devulcanization of NR/SBR blends: An effective recycling method. Resour. Conserv. Recycl. 2022, 179, 106045. [Google Scholar] [CrossRef]
  20. Tatangelo, V.; Mangili, I.; Caracino, P.; Anzano, M.; Najmi, Z.; Bestetti, G.; Collina, E.; Franzetti, A.; Lasagni, M. Biological devulcanization of ground natural rubber by Gordonia desulfuricans DSM 44462T strain. Appl. Microbiol. Biotechnol. 2016, 100, 8931–8942. [Google Scholar] [CrossRef]
  21. Gumede, J.I.; Hlangothi, B.G.; Woolard, C.D.; Hlangothi, S.P. Organic chemical devulcanization of rubber vulcanizates in supercritical carbon dioxide and associated less eco-unfriendly approaches: A review. Waste Manag. Res. 2022, 40, 490–503. [Google Scholar] [CrossRef]
  22. Wang, Z.; Zeng, D. Preparation of devulcanized ground tire rubber with supercritical carbon dioxide jet pulverization. Mater. Lett. 2021, 282, 128878. [Google Scholar] [CrossRef]
  23. Xu, X.; Wang, H.; Sun, Y.; Han, J.; Huang, R. Sound absorbing properties of perforated composite panels of recycled rubber, fiberboard sawdust, and high density polyethylene. J. Clean. Prod. 2018, 187, 215–221. [Google Scholar] [CrossRef]
  24. Maderuelo-Sanz, R.; Nadal-Gisbert, A.V.; Crespo-Amorós, J.E.; Parres-García, F. A novel sound absorber with recycled fibers coming from end of life tires (ELTs). Appl. Acoust. 2012, 73, 402–408. [Google Scholar] [CrossRef]
  25. Juliá, E.; Segura, J.; Nadal, A.; Gadea, J.M.; Crespo, J.E. Study of Sound Absorption Properties of Multilayer Panels Made From Ground Tyre Rubbers. Ann. ORADEA Univ. Fascicle Manag. Technol. Eng. 2013, 1, 147–150. [Google Scholar] [CrossRef]
  26. Bujoreanu, C.; Nedeff, F.; Benchea, M.; Agop, M. Experimental and theoretical considerations on sound absorption performance of waste materials including the effect of backing plates. Appl. Acoust. 2017, 119, 88–93. [Google Scholar] [CrossRef]
  27. Lee, C.M.; Xu, Y. A modified transfer matrix method for prediction of transmission loss of multilayer acoustic materials. J. Sound Vib. 2009, 326, 290–301. [Google Scholar] [CrossRef]
  28. Theocharis, G.; Richoux, O.; García, V.R.; Merkel, A.; Tournat, V. Limits of slow sound propagation and transparency in lossy, locally resonant periodic structures. New J. Phys. 2014, 16, 093017. [Google Scholar] [CrossRef]
  29. Dell, A.; Krynkin, A.; Horoshenkov, K.V. The use of the transfer matrix method to predict the effective fluid properties of acoustical systems. Appl. Acoust. 2021, 182, 108259. [Google Scholar] [CrossRef]
  30. Salissou, Y.; Panneton, R. A general wave decomposition formula for the measurement of normal incidence sound transmission loss in impedance tube. J. Acoust. Soc. Am. 2009, 125, 2083–2090. [Google Scholar] [CrossRef]
  31. Tao, Z.; Seybert, A.F. A Review of Current Techniques for Measuring Muffler Transmission Loss. SAE Trans. 2003, 112, 2096–2100. [Google Scholar] [CrossRef]
  32. Lung, T.Y.; Doige, A.G. A time-averaging transient testing method for acoustic properties of piping systems and mufflers with flow. J. Acoust. Soc. Am. 1983, 73, 867–876. [Google Scholar] [CrossRef]
  33. Munjal, M.L.; Doige, A.G. Theory of a two source-location method for direct experimental evaluation of the four-pole parameters of an aeroacoustic element. J. Sound Vib. 1990, 141, 323–333. [Google Scholar] [CrossRef]
  34. ASTM E2611-17; Standard Test Method for Normal Incidence Determination of Porous Material Acoustical Properties Based on the Transfer Matrix Method. ANSI: Washington, DC, USA, 2019.
  35. Kim, H.S.; Ma, P.S.; Kim, B.K.; Lee, S.H.; Seo, Y.H. Sound transmission loss of multi-layered elastic micro-perforated plates in an impedance tube. Appl. Acoust. 2020, 166, 107348. [Google Scholar] [CrossRef]
  36. Long, M. Sound Transmission Loss. Archit. Acoust. 2014, 345–382. [Google Scholar] [CrossRef]
Figure 1. Rubber granules. (A)—small fraction; (B)—large fraction; (C)—chemically devulcanized fraction.
Sustainability 15 12774 g001
Figure 2. Prepared rubber sample.
Sustainability 15 12774 g002
Figure 3. Scheme of the four-microphone impedance tube. In the scheme, the letters A, B, C, and D indicate the forward and backward components of the standing wave field; 1, 2, 3, and 4 mark the measurement positions where the microphones were installed.
Sustainability 15 12774 g003
Figure 4. The pressure and particle velocity at boundaries.
Sustainability 15 12774 g004
Figure 5. Scheme of theoretical model.
Sustainability 15 12774 g005
Figure 6. Results of predicted transmission loss according to TMM.
Sustainability 15 12774 g006aSustainability 15 12774 g006b
Figure 7. Comparison of the predicted transmission loss results of multilayer construction with GKB and GKFI.
Sustainability 15 12774 g007
Figure 8. Experimental results of transmission loss measurements of 12 ± 2 mm thickness rubber sample with plasterboards (GKB) on both sides.
Sustainability 15 12774 g008
Figure 9. Experimental results of transmission loss measurements of 12 ± 2 mm thickness rubber sample with plasterboards (GKFI) on both sides.
Sustainability 15 12774 g009
Figure 10. Experimental results of transmission loss measurements of 25 ± 2 mm thickness rubber sample with plasterboards (GKB) on both sides.
Sustainability 15 12774 g010
Figure 11. Experimental results of transmission loss measurements of 25 ± 2 mm thickness rubber sample with plasterboards (GKFI) on both sides.
Sustainability 15 12774 g011
Figure 12. Experimental results of transmission loss measurements of 50 ± 2 mm thickness rubber sample with plasterboards (GKB) on both sides.
Sustainability 15 12774 g012
Figure 13. Experimental results of transmission loss measurements of 50 ± 2 mm thickness rubber sample with plasterboards (GKB) on both sides.
Sustainability 15 12774 g013
Table 1. Composition of rubber samples.
Sample No.123456789101112131415
Large fraction, %00000252525255050507575100
Small fraction, %02550751002550750255002500
Devulcanized fraction, %10075502505025075250500250
Density, kg/m3697.4661.7706.8728.9697.6721.9797.7762.1737.4776.8776.1691.8783.6675.9731.4
Table 2. Results of equivalent transmission loss.
Sample No.Construction
12 mm25 mm50 mm GKB12 mm25 mm50 mm
GKBGKBGKFIGKFIGKFI
Equivalent Value of Transmission Loss, dB
164.164.364.567.668.769.2
261.261.965.668.566.669.6
362.267.067.166.567.271.5
464.569.166.869.766.769.6
564.966.565.169.567.969.8
665.166.568.066.968.068.0
760.263.766.164.066.967.9
860.369.163.064.067.568.8
958.362.966.666.664.968.2
1062.371.270.567.971.976.5
1160.264.268.763.770.475.5
1263.169.572.567.271.477.8
1360.065.969.166.168.471.7
1458.766.869.063.468.571.4
1562.864.468.065.868.372.4
Arithmetical average of transmission loss, dB61.966.267.466.568.271.2
Disclaimer/Publisher’s Note: The statements, opinions and data contained in all publications are solely those of the individual author(s) and contributor(s) and not of MDPI and/or the editor(s). MDPI and/or the editor(s) disclaim responsibility for any injury to people or property resulting from any ideas, methods, instructions or products referred to in the content.

