Article

A Novel Decision-Making Framework to Evaluate Rail Transport Development Projects Considering Sustainability under Uncertainty

1
Department of Civil Engineering, Science and Research Branch, Islamic Azad University, Tehran 14778-93855, Iran
2
School of Railway Engineering, Iran University of Science and Technology, Tehran 16846-13114, Iran
3
Department of Roads and Transportation, Payam Noor University, Tehran 19556-43183, Iran
*
Author to whom correspondence should be addressed.
Sustainability 2023, 15(17), 13086; https://0-doi-org.brum.beds.ac.uk/10.3390/su151713086
Submission received: 15 June 2023 / Revised: 26 July 2023 / Accepted: 21 August 2023 / Published: 30 August 2023
(This article belongs to the Special Issue Multi-criteria Decision Making and Sustainable Transport)

Abstract

:
One of the constant concerns in public and private organizations is choosing a project from among the multitude of potential projects to be implemented. Due to the limited resources in different sectors, projects should be prioritized in order to obtain the maximum benefit. In national and government projects, it is not necessarily important to pay attention to financial components, and more dimensions should be considered. Sustainability is a component that considers various economic, environmental, and social aspects in the evaluation of projects. In this regard, in this study, the main goal is to evaluate and select rail transportation projects according to sustainability criteria. In general, 15 indicators were identified in three economic, environmental, and social sectors, which were weighted using the best–worst fuzzy method (FBWM). The most important indicators in the evaluation of projects are the investment cost, the rate of internal return from a national perspective, and the lesser impact of the plan on environmental destruction. According to the weighted indicators, the stochastic VIKOR approach is developed for the first time in this article, which was evaluated according to two scenarios of demand changes and cost changes of candidate projects. In the stochastic VIKOR approach, to deal with uncertainty, different scenarios are defined, through which it is possible to respond to different conditions and evaluate projects more realistically. Validation of this method is compared to other multi-criteria decision-making methods. The main contribution of this study is presenting the stochastic VIKOR approach for the first time and considering the uncertainty in project evaluation. The findings show that the projects that have the most economic gains from the national and environmental aspects are selected as the best projects.

1. Introduction

In recent decades, the transportation industry has attracted a lot of attention as one of the basic foundations of economic and social development at the global level [1]. Due to the increasing population and the growing needs of cities, the development of transportation infrastructure in countries has been considered as a critical issue [2,3]. The railway network design problem is one of the critical issues in the transportation sector due to its significance and variety of necessary applications [4]. Many extensive projects are often potentially defined by the limitations of various financial, human, and resource constraints, which do not allow all projects to be implemented at the same time. In this regard, one of the concerns in organizations is the evaluation and selection of worthy projects among a large number of projects [5,6].
Projects should be evaluated according to various criteria, and paying attention to specific financial, time, human, and other aspects increases the error of choosing the optimal project [7]. In different studies, various criteria are considered in the evaluation of projects, but in today’s world, the concept of sustainability is considered as a vital and key factor in many fields and industries [4,8]. Sustainability means the ability to maintain balance and continuity in the face of environmental, economic and social challenges, needs, and limitations [9,10]. In the transportation industry as well, the importance of sustainability has been given much attention [11,12].
One of the main reasons why sustainability is important in evaluating projects is that transportation plays an important role in all aspects of our lives. From public transportation to the transportation of personal belongings, any deficiency and inefficiency in the transportation system can have a direct impact on our daily life as well as on the economy, environment, and social issues [13,14]. As a result, choosing transportation projects with an emphasis on sustainability can improve the performance of the transportation system and improve the quality of life of the community. In addition, it is important to pay attention to sustainability in the evaluation of projects from an economic point of view since sustainable transportation projects can lead to reduced costs and improved productivity [15,16]. For example, the use of sustainable public transportation systems can reduce traffic and air pollution and, thus, reduce traffic-related costs [17,18]. Also, the use of sustainable technologies in vehicles can lead to fuel and energy savings and prevent the loss of natural resources [11]. Therefore, in the assessment of transportation projects, the importance of sustainability is very important because of the wide-ranging effects on various aspects of our lives and society. The use of sustainability criteria in the selection process of transportation projects can lead to better and more optimal decisions in the structure and development of the transportation system and ultimately lead to improvements in the quality of life of society and the preservation of natural resources.
Numerous studies evaluated different projects in various industries, most of which were based on multi-criteria decision-making methods and expert opinions [19]. One of the important issues in project evaluation is uncertainty; uncertainty shows itself in various financial, time, and operational aspects and project results. In the field of transportation, factors, such as changes in cost, time, and demand, can have a significant impact on the performance of projects, which should be included in the selection of projects. Price changes in raw materials, market fluctuations, and structural changes can increase costs and delay implementation. These issues can have a serious negative impact on the financial constraints of the projects and, as a result, lead to the failure of the successful completion of the projects or a reduction in their quality and performance [20]. Also, the uncertainty in the demand for projects can have a significant effect on the evaluation of transportation projects and cause fundamental changes in the amount of revenue generation of projects [9,21]. For this reason, by involving uncertainty in the evaluation of projects, a more accurate choice can be made. In this regard, according to the notes mentioned before, the present study motivations are as follows:
  • Designing a new stochastic multi-criteria decision-making approach to include uncertainty in the evaluation of projects; such an approach has not been observed in other studies. By presenting this method, it is possible to define any number of scenarios for the evaluation of projects without limitation, which can include uncertainty in the evaluation of projects by considering different scenarios.
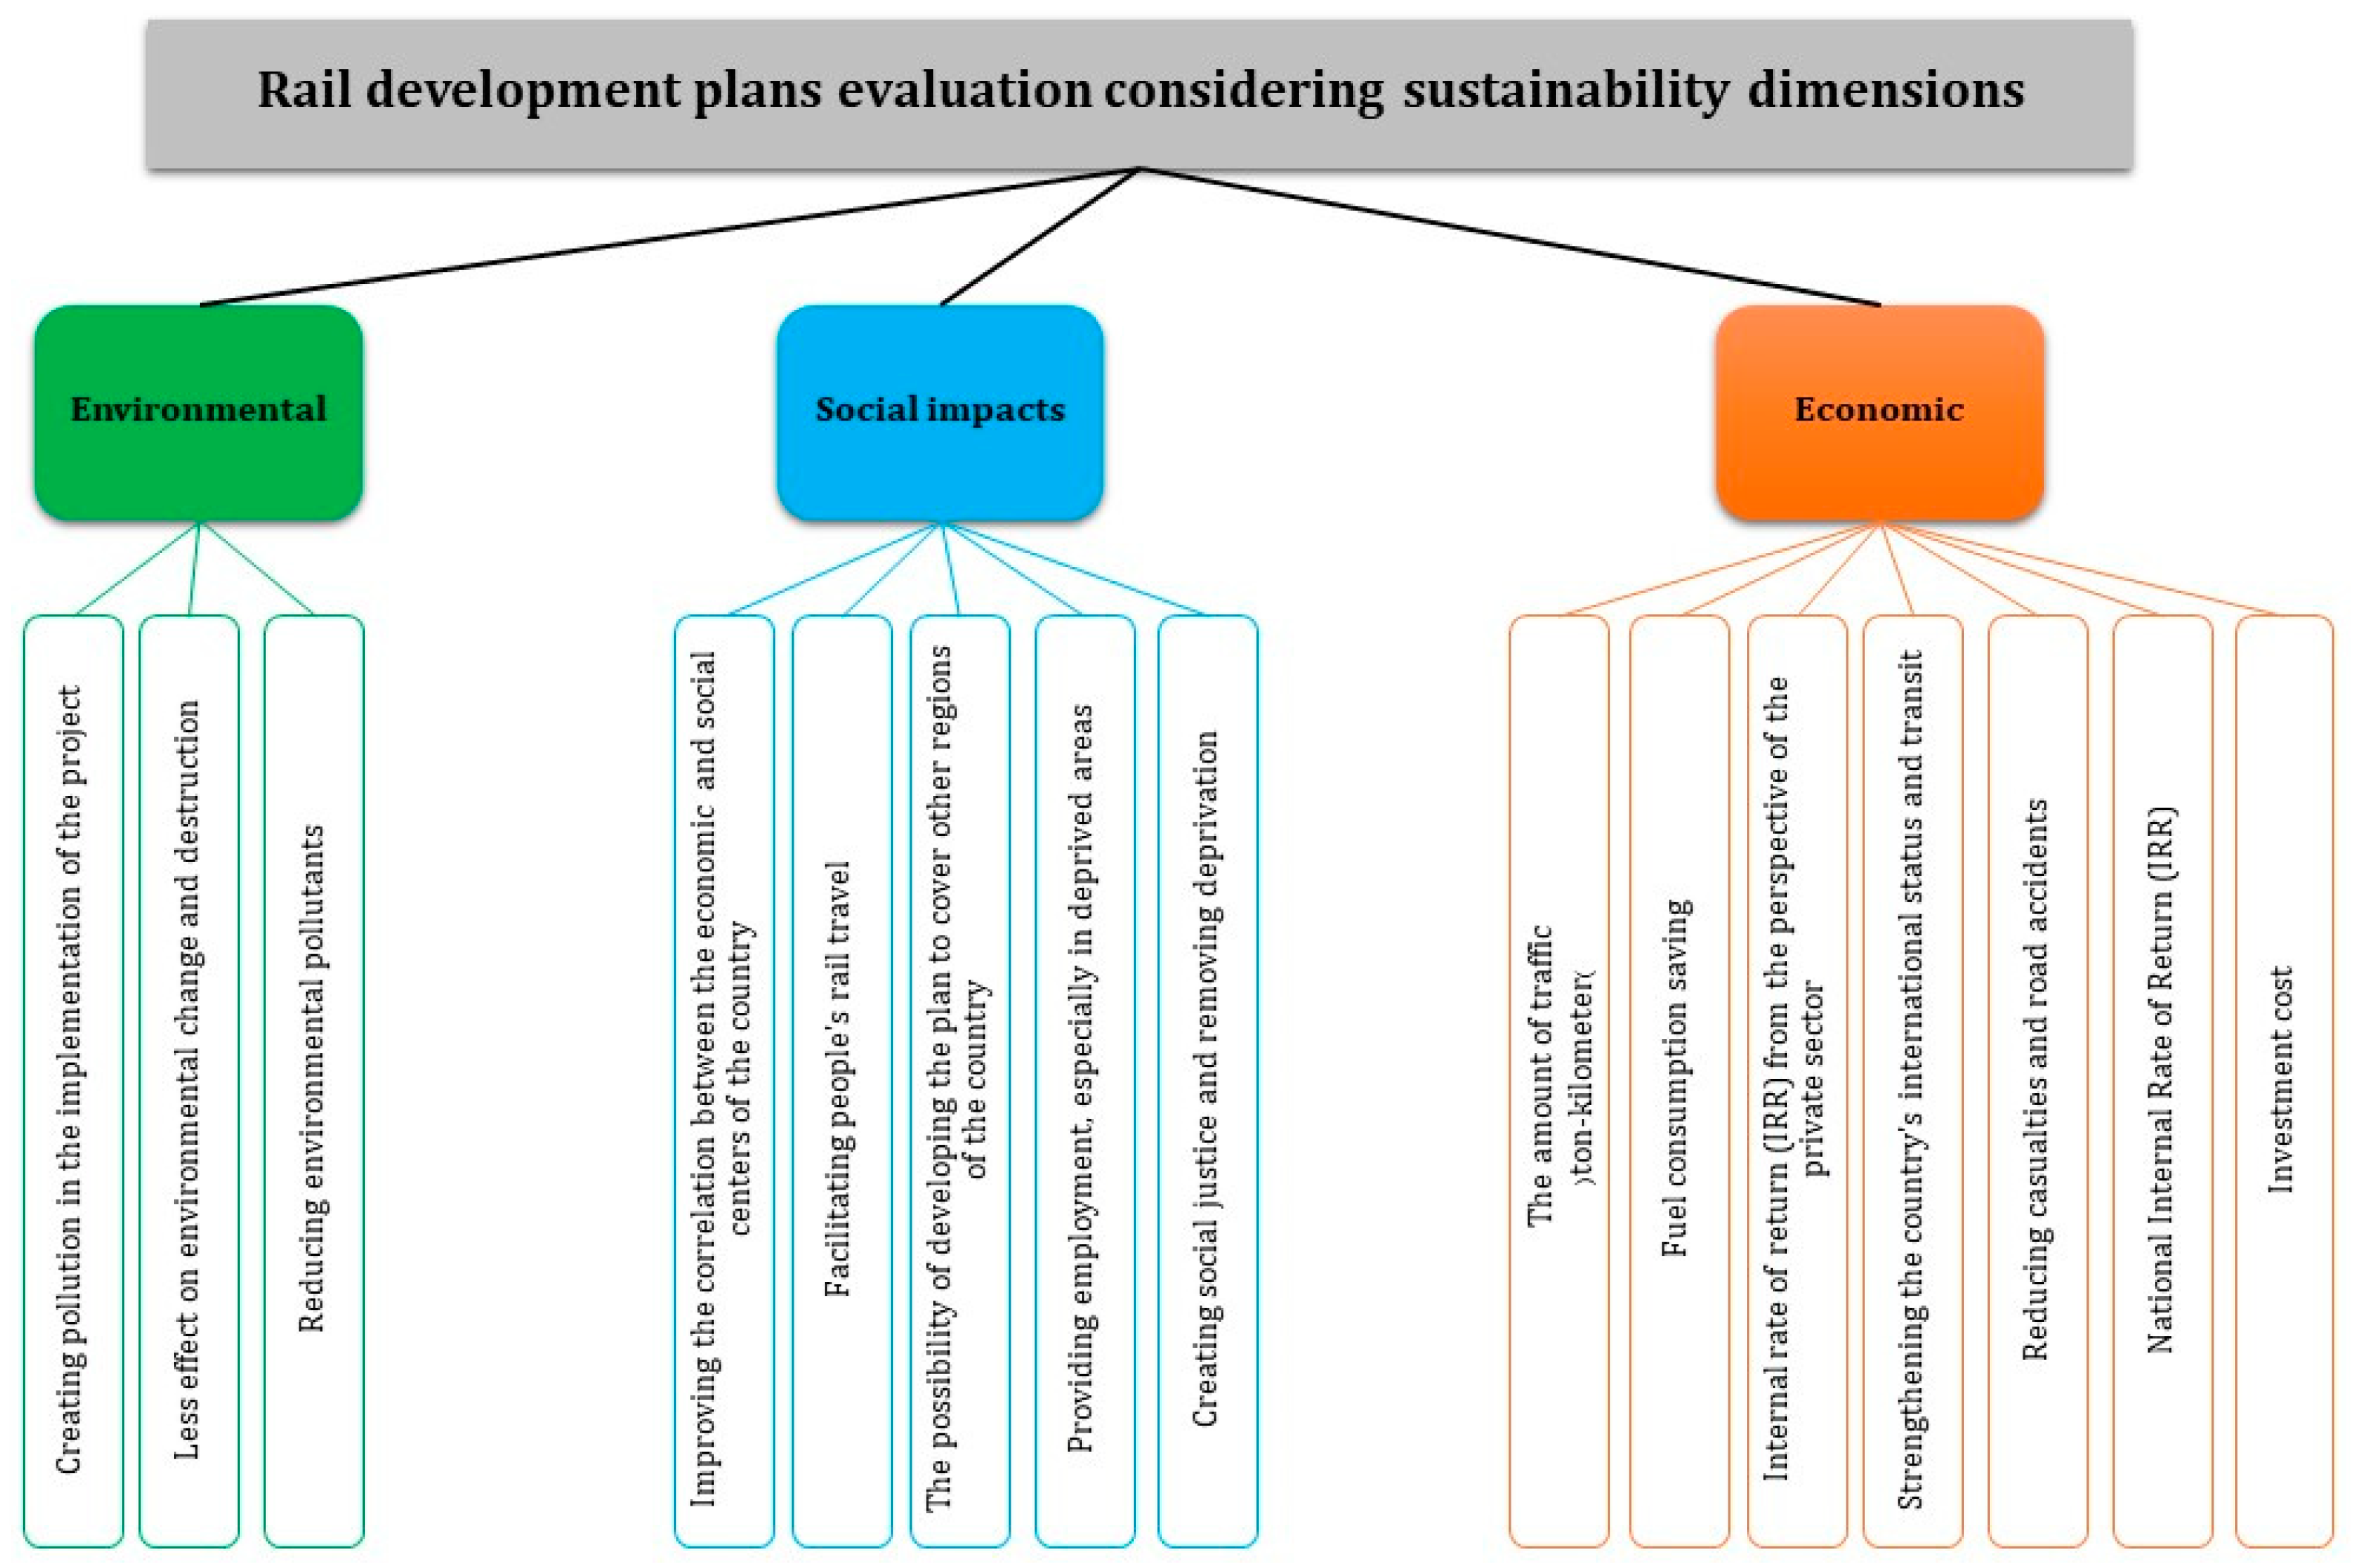
  • Providing comprehensive sustainability indicators to evaluate transportation industry projects; this study is the first study that evaluates large-scale rail transport projects by considering all sustainability criteria in economic, social, and environmental categories.
  • Designing a model to evaluate transportation projects considering sustainability indicators and involving uncertainty. This study is the first research that deals with the evaluation of rail transportation projects considering uncertainty. So, considering uncertainty at the same time along with involving sustainability criteria in the evaluation of projects is a new contribution, which is addressed in this study.
In general, the proposed study is innovative from the aspect of the solution method due to providing a new multi-criteria decision-making approach and also considering uncertainty and sustainability criteria in the evaluation of rail transportation projects. In this regard, in Section 2, an overview of the research articles is presented; then, in Section 3, the solution method is presented; and in Section 4, the case study and the evaluation indicators are presented. In Section 5, the findings are explained, and, finally, in Section 6, conclusions and management insights are presented.

2. Literature Review

In the domain of project evaluation and project selection, various studies have been conducted that focused on various industries. For instance, Hamurcu et al. [22] presented a study on the selection of rail transport projects with the process of hierarchical analysis and ideal planning. In their study, it is stated that the Istanbul Municipality intends to develop the rail transportation system of the city according to different goals. In this regard, taking into account various indicators that were weighted with multi-criteria decision-making approaches, various goals were considered as the ideal goals of the project. The important evaluation indicators of railway projects in their study include security, capacity, speed, cost, and credit. According to the mentioned criteria and different scenarios, the target projects were evaluated. In their study, a Financial Computable General Equilibrium (FCGE) model was presented, which simultaneously considered macroeconomic indicators with financial flows. The model was designed to analyze the economic effects of fiscal policies, such as transportation investment expenditure and alternative procurement approaches, on economic growth and distribution across socioeconomic classes, and it relates investment expenditure to specific financial resources. Hamurcu and Eren [23] presented a framework to evaluate and select rail system projects according to the fuzzy network analysis process. In their study, 15 indicators were presented in four categories: technology, environment, economy, and transportation. According to the results obtained from their study, it can be seen that the cost required for the implementation of railway projects, the rate of return on investment, the comfort of passengers, the ability to implement and help employment, and the response to transportation demand were the most important indicators. According to these indicators and the ANP approach, the studied projects were weighted and prioritized. Yücel and Taşabat [24] presented a study on the selection of railway system projects with multi-criteria decision-making methods in the city of Istanbul. In their study, it is stated that transportation projects are usually evaluated and selected based on indicators, such as net present value analysis (NPVA), benefit–cost analysis (BCA), and internal efficiency analysis (IEA); but, there is a point that various indicators and components are effective in the evaluation of projects. In this regard, multi-criteria decision-making (MCDM) methods were used in their study. This method, along with financial indicators, such as the stated methods, considers various indicators, such as environmental compatibility management, historical context, how to integrate with other transportation networks, etc. Project evaluation indicators were identified in four categories: passenger services, environment, economy, and urban architecture. The solution method used in this study is the use of two approaches, AHP and BWM, comparing their findings, as a result of which, the projects were weighted according to the identified indicators.
Çoban [25] explored the assessment and decision-making processes for selecting a solar power plant project using multi-criteria evaluation methods. Since the selection of projects is very difficult from the point of view of experts, the hesitant fuzzy linguistic approach was used in their study, which can assign weight to the options in a spectral manner in the uncertainty of the experts’ opinion. The methodology used in their study was AHP, with its hierarchical approach, and according to hesitant fuzzy linguistics, experts expressed their desired score to the indicators and projects. The most important project evaluation criteria were system technology, energy policies, and energy price changes. The noteworthy point in the findings of the project was the closeness of the final weight of the projects, which indicated the attention of how decision makers consider the criteria that influence project selection. Mahmoudi et al. [26] presented a large-scale multiple criteria decision-making approach for project selection. The model presented in their study was a refinery equipment manufacturing company with a project-oriented structure, implementing a comprehensive approach for project selection, combining the TOPSIS-OPA method and the K-means clustering algorithm. The study involved clustering projects based on their characteristics using the K-means algorithm. Each cluster was then assessed using eight criteria, including project duration, project delay, number of project items, project manager’s score, physical weight, number of modifications, and project code and level. The TOPSIS approach was employed to prioritize project difficulty. The criteria were weighted based on expert surveys and the OPA approach.
Haseli et al. [27] presented a new group decision-making approach based on the best–worst method (G-BWM). Due to the complexity of real-world multi-criteria decision-making problems, the analysis of different opinions from a decision-making group is required to ensure appropriate decision making. Group decision-making methods collect the opinions of decision makers and provide the best opinions using mathematical equations. So, they developed an innovative approach to group decision-making problems based on the BWM method, called G-BWM, which helps to examine the opinions of decision makers and make democratic decisions using the BWM structure. In order to evaluate the feasibility of the proposed method and its innovation, two numerical examples from the literature with applications in supply chain management (SCM) (i.e., green supplier selection and supplier development/segmentation) were reviewed and discussed. Their results showed that the proposed G-BWM method performs well in group decision making due to the large number of decision makers, ease of use, and achieving democratic decisions in the decision-making process. Tirkolaee et al. [17] presented an integrated decision-making approach to evaluate suppliers in a supply chain context. They proposed a multi-criteria decision-making (MCDM) technique that used the Analytic Hierarchy Process (AHP) and the fuzzy Technique for Order of Preference by Similarity to Ideal Solution (TOPSIS) to evaluate and rank suppliers. Then, taking into account resource constraints, criteria weights, and suppliers’ ranking, in a multi-objective mixed linear programming with constraints (MOMILP) method, the optimal order quantity of each supplier was determined under unknown conditions. To deal with the unknown multi-objectives of the proposed model, the roust goal programming (RGP) approach based on Shannon entropy was used. Their proposed method was applied in a real case study of a green food production company in Iran in order to check its applicability with the help of sensitivity analysis at different levels of uncertainty. Furthermore, the reliability of the proposed method was studied using different uncertainty budgets for a green food manufacturing company.
Wan et al. [28] introduced a generalized trapezoidal fuzzy number-based best–worst method for multi-criteria decision making. They proposed a fuzzy best–worst method called GITrF BWM, which utilizes generalized trapezoidal fuzzy numbers for multi-criteria decision making. The comparisons among criteria are presented using GITrFNs, and the criterion weights are also modeled as GITrFNs. The concept of criterion weight vector is presented in the normalized GITrF form, and a novel representation, Generalized Mean of Interval-valued Trapezoidal Fuzzy Data (GMIR), is provided for GITrFNs. A goal programming model is constructed to obtain the optimized criterion weights in normalized GITrF form. Furthermore, the GITrF similarity index and GITrF similarity ratio are introduced. GMIR is calculated to measure the acceptable similarity of all pairwise comparisons among criteria. For unacceptable similarity in pairwise comparisons, an approach to improve the similarity of these comparisons is presented. Finally, GITrF BWM is proposed for multi-criteria decision making. Three real examples are analyzed to demonstrate the performance of the proposed GITrF BWM. Comparative analyses show that the proposed GITrF BWM outperforms existing methods for multi-criteria decision making in GITrF environments. Dong et al. [29] developed a fuzzy best–worst method based on triangular fuzzy numbers. They proposed a novel fuzzy best–worst method (BWM) based on triangular fuzzy numbers for multi-criteria decision making. In this method, fuzzy similarity equations are considered as fuzzy equations to obtain the best vector to others and the worst vector to others in the form of triangular fuzzy numbers. To obtain the optimal weights of criteria, the fuzzy decision-making problem is formulated, and using a mathematical programming model, the optimal fuzzy weights of criteria are derived to create a normalized triangular fuzzy weight vector. Then, four linear programming models are presented for optimistic decision making, pessimistic decision making, and neutral decision making. By selecting appropriate tolerance parameters, each of the linear programming models has a unique optimal global solution. Additionally, this article introduces the concepts of fuzzy similarity index and fuzzy similarity ratio. Several application examples are used to validate the proposed fuzzy BWM, demonstrating that the proposed fuzzy BWM provides a highly useful approach for multi-criteria decision making in fuzzy environments.
Wan and Dong, [30] extended the best–worst method with fuzzy referentiality. In this paper, a novel recognized fuzzy interval-based best–worst method (IFBWM) was proposed for multi-criteria decision making. When a decision maker (DM) makes comparisons, they may have uncertainties. Therefore, referential comparisons are represented as recognized fuzzy interval values (IFVs), and the best-to-others and worst-to-others vectors are also presented as recognized fuzzy vectors. Based on the combined similarity of recognized fuzzy preference relations, the similarity equations are formulated as recognized fuzzy equations. In this regard, deriving the optimal recognized fuzzy weights of criteria is introduced as a fuzzy decision-making problem. The article ensures that the optimal recognized fuzzy weights of criteria form a normalized recognized fuzzy weight vector by constructing a mathematical programming model. To accommodate the decision maker’s risk preferences, four linear programming models are provided to obtain the optimal recognized fuzzy weights based on the mathematical programming model for optimistic DM, pessimistic DM, and neutral DM. Additionally, the article examines the process of improving the similarity. Several application examples are presented to demonstrate the effectiveness of the proposed IFBWM method. Bai et al. [31] focused on a study with the aim of evaluating the factors affecting the selection of the project portfolio. In this study, a list of financial and non-financial influencing factors on project selection in the investment portfolio were created by using a theoretical literature review. Then, using the combined system and complex networks, the relationships between factors and network links were evaluated and analyzed. The evidence obtained in their study was very interesting. Four factors, namely project managers, buyers, development capacity, and tangible resources, were the most important factors affecting the selection of projects. They provided a quantitative model for weighting and analyzing the relationships between factors and identifying the most important factors affecting the selection of projects in each investment portfolio. Mohammed [32] introduced a fuzzy-based multi-criteria approach for project selection, focusing on investment projects in Iraq’s oil industry. The study employed the Fuzzy Analytic Hierarchy Process (AHP) to assign weights to five selection criteria, namely time, cost, quality, safety, and environmental sustainability, with time and cost being the most significant criteria, accounting for over 70% of the overall weight. Subsequently, the projects were prioritized using the fuzzy Technique for Order of Preference by Similarity to Ideal Solution (TOPSIS) method.
Koohathongsumrit and Luangpaiboon [33] presented a new hybrid FAHP-ZODP approach for the software project selection problem. The FAHP process was used to reflect the preferences of decision makers and zero-one desire planning (ZODP) to maximize the total utility value calculated from the individual utility values of quantitative and qualitative objectives. Their proposed approach was for selecting startup projects during the COVID-19 pandemic, and based on their findings, it could be seen that the presented model had appropriate accuracy. Important criteria in the evaluation of projects in their study were strategic criteria. The evaluation of projects was carried out in two stages; first, it was measured using financial and economic criteria to see if the project had the ability to be implemented in this respect, and then the projects were evaluated using strategic criteria. In the strategic criteria, the profitability and strategic efficiency of the organization were also examined. The approach used was a new multi-criteria method with the THOR method. Tirkolaee and Torkayesh [34] presented a hybrid decision-making model based on clustering under uncertainty. They presented an innovative decision support model based on the K-means algorithm and its combination with the best–worst method, which used MARCOS-CoCoSo to integrate interval fuzzy subsets. Their proposed decision support system took into account the rate of waste generation in medical centers, unpredictable but potential future events, and uncertainty in expert opinions, optimizing the location required for the safe and economical disposal of hazardous health waste. The efficiency of their presented method was compared to several well-known methods to show its high efficiency. A. ForouzeshNejad [9] proposed a data-driven model to evaluate and select projects in the telecoms industry. In the first step, after identifying the project evaluation indicators, he calculated the weight of each indicator with the fuzzy best–worst approach, and then the efficiency label of the projects was identified using the data envelopment analysis (DEA) method. Then, using random forest algorithms and historical data, a prospective model was presented to evaluate and select projects. The results showed that profitability indicators were always important, and along with these indicators, the time of both production and entering the market was also very important. Singh et al. [35] presented a new method for project evaluation and selection based on lean six sigma. In their proposed method, intuitive fuzzy sets based on weighted average were used to aggregate the individual suggestions of decision makers. The weights of the selected criteria were calculated using entropy criteria, and the existing projects were modified using the TOPSIS approach and prioritized with VIKOR. The effectiveness of the proposed method was confirmed through a case study in the Indian manufacturing industry. The most important criterion for evaluating projects in their study was environmental waste and destruction.
Goli et al. [36] provided a comprehensive approach based on the MCDM hybrid method to evaluate the effective factors in the implementation of the cyclical supply chain. Circular economy is one of the most important issues in the optimal use of resources worldwide. The combination of the circular economy and the supply chain created a new concept called the circular supply chain, which aimed to increase the efficiency of the supply chain through the optimal use of resources. At first, they identified the effective factors in the cyclical supply chain and determined the weights of these factors using the Analytical Hierarchy Process (AHP) method. Then, the impact intensity of each factor was calculated. In addition, by using the laboratory method of decision making and evaluation (DEMATEL), the correlation between the effective factors in the cyclical supply chain and their effectiveness was analyzed. Finally, using the simple additive weighting (SAW), the most important factors in implementing a cyclical supply chain were identified. The main results of their research showed that the quality of final products was the most important factor in the implementation of the cyclical supply chain. In addition, adopting a circular economy approach contributed to the goal of zero waste production and could increase the efficiency of supply chains. Chen et al. [37] proposed an intuitive fuzzy approach for assessing the risk of epidemic resurgence in the COViD-19 prevention period. In their paper, the objective was to provide an integrated Interval-Valued Intuitionistic Fuzzy (IVIF) method for intelligent risk assessment based on DEMATEL (Decision-Making Trial and Evaluation Laboratory), BWM (best–worst Method), and SPA (Set Pair Analysis). This integrated technique is named IVIF-DBWM-SPA, where IVIF-DEMATEL and IVIF-BWM are used to determine the overall weights of dimensions and criterion weights in each dimension. In the IVIF-BWM method, two bi-objective programming models are developed considering the perspectives of both pessimistic and optimistic experts. By simultaneously considering the intrapersonal and interpersonal uncertainties of experts, a bi-objective programming model is proposed to determine the dynamic weights of experts. Using the determined weights for experts and criteria, an IVIF-SPA is developed to assess the risk levels of all alternatives. The validity of the proposed method is demonstrated with a real case of risk assessment for the resurgence of a university during the COVID-19 period. Additionally, sensitivity and comparative analyses are presented to illustrate the advantages of the proposed approach. A summary of the literature review is shown in Table 1.
According to the studies carried out in the research literature, a summary of which is shown in Table 1, it is observed that there is a study that evaluates the national macro projects in the field of rail transportation, taking into account the three economic, social, and environmental dimensions, which are the dimensions of sustainability. Therefore, simultaneous consideration of these dimensions in the evaluation of projects has innovation. On the other hand, considering that the amount of demand of projects in the completion stage and also the costs of implementing projects have uncertainty and are different under different scenarios, considering this uncertainty has not been found in any study. Therefore, considering uncertainty in the evaluation of projects is also innovative, which is addressed in this study, and a new method is presented. In general, the contributions of the current research can be summarized as follow:
  • Simultaneously considering the dimensions of sustainability, including economic, social, and environmental aspects in the evaluation of projects: in studies related to the evaluation of projects related to rail transportation, financial and environmental indicators are often considered, but social indicators are also important, especially in national macro-projects that examine the amount of job creation and contribution to the local economy.
  • Considering the uncertainty of demand and cost in the evaluation of project: in the evaluation of projects, due to the existence of various conditions and various uncertainties, the amount of spending and income generation of projects varies, which can greatly affect the evaluation of projects that has been addressed in this study.
  • Providing a new stochastic multi-criteria decision-making approach to deal with uncertainty.
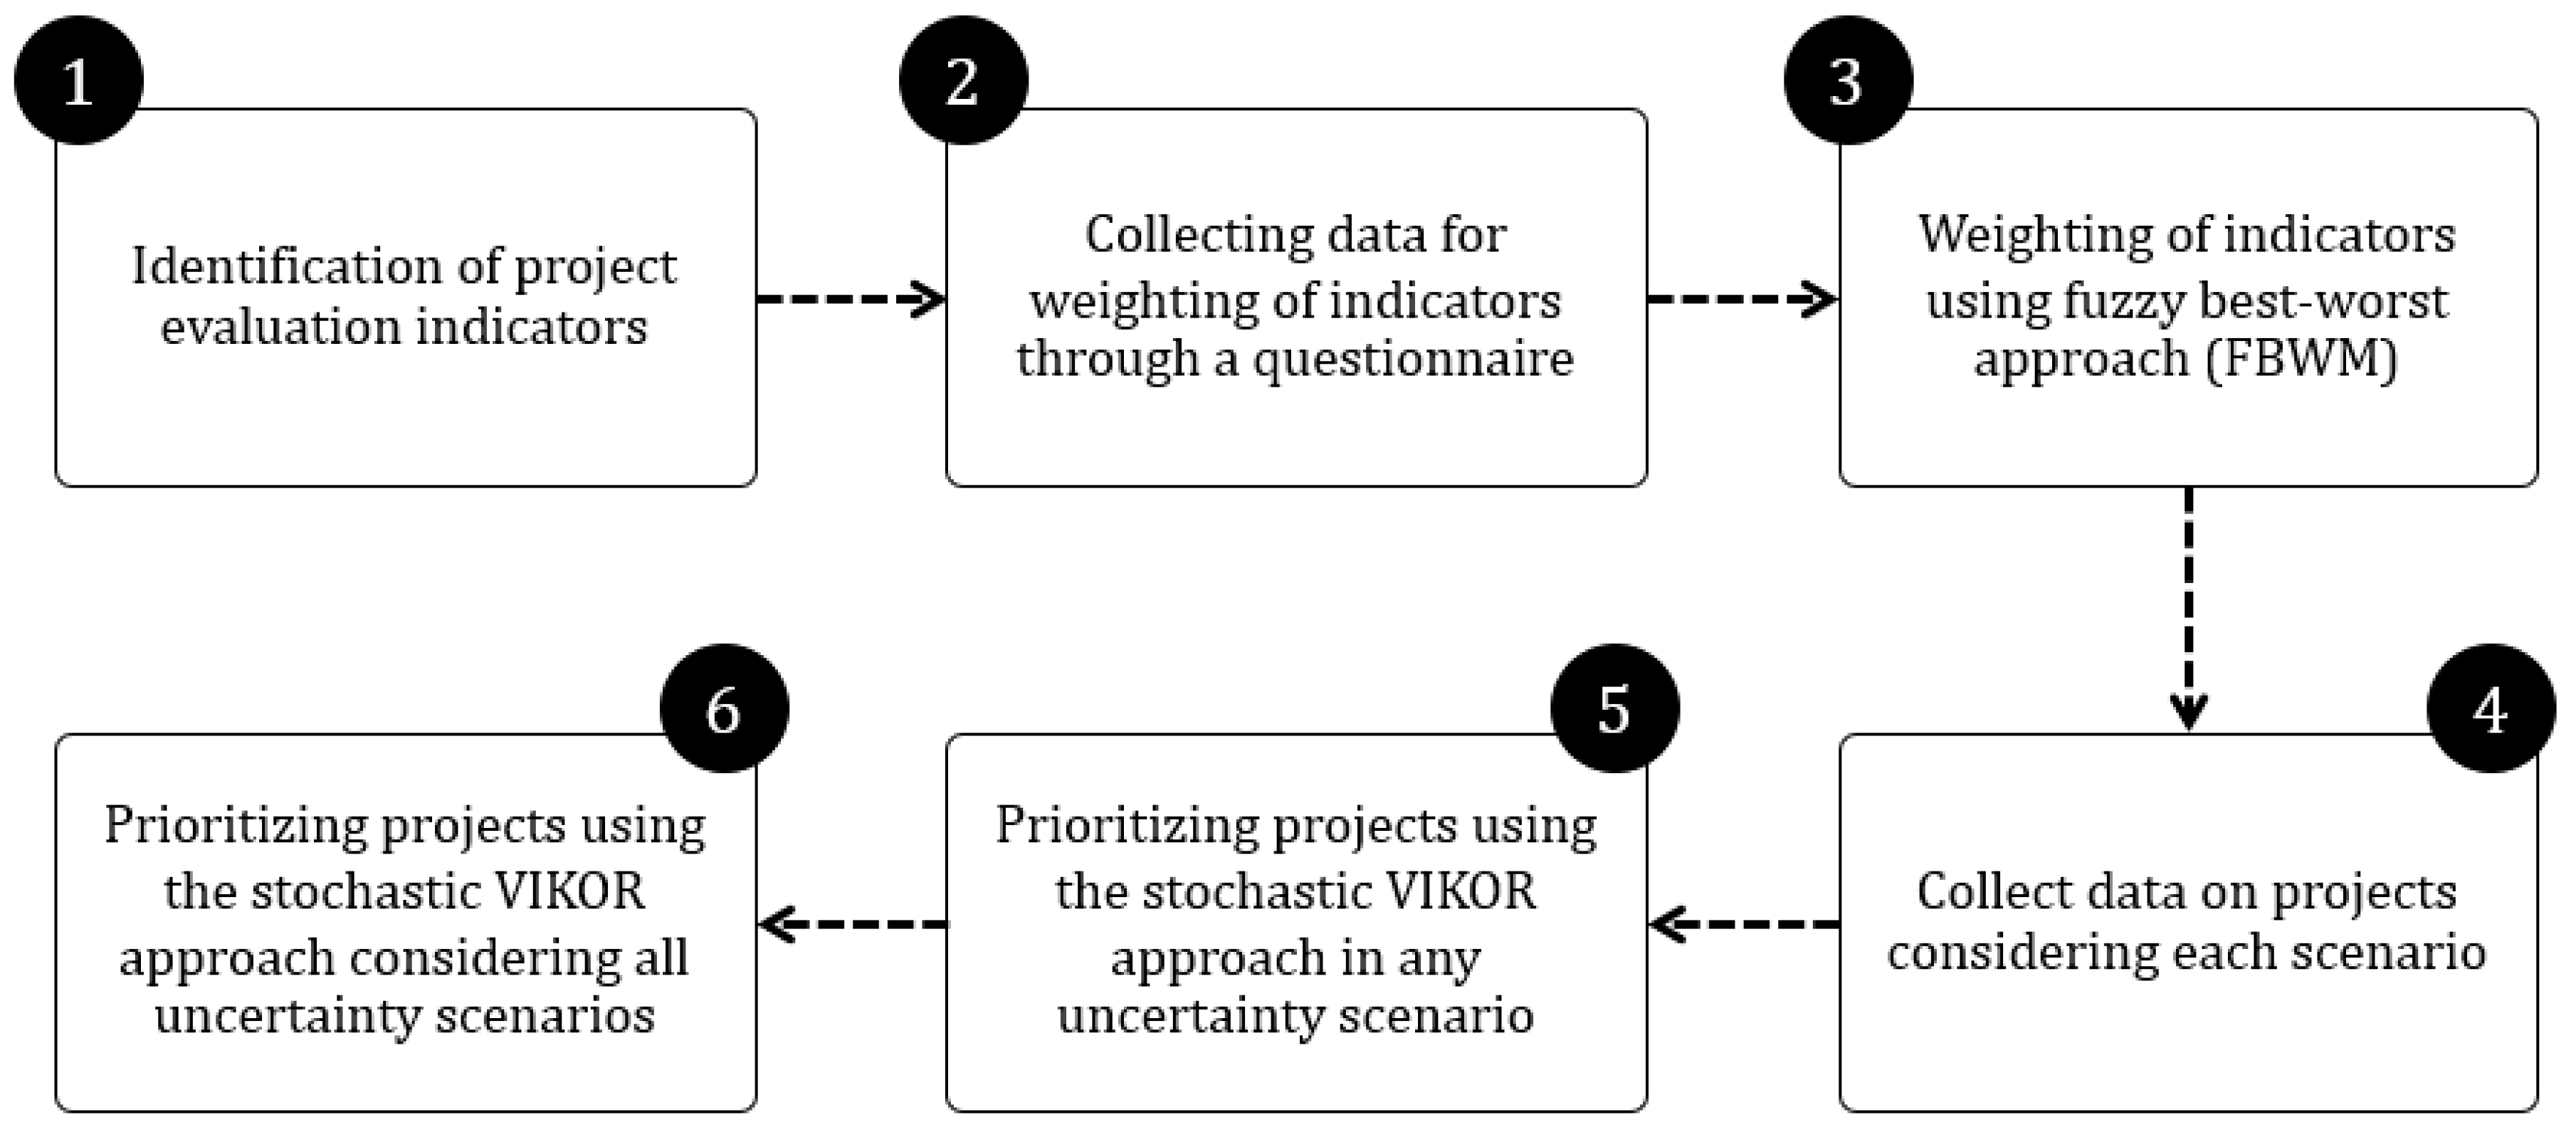
3. Methods

The present study consists of several steps, which are explained in this section. First, using the fuzzy best–worst method (FBWM), the weight of project evaluation indicators is identified. Then, using the stochastic VIKOR approach, the projects will be evaluated and analyzed in different scenarios, and, finally, the final prioritization of the projects will be presented. It should be noted that the stochastic VIKOR method is presented for the first time in this study.

3.1. Fuzzy Best–Worst Method (FBWM)

The fuzzy best–worst method (FBWM) is a fuzzy decision-making method, in which alternatives are evaluated based on the opinions of users or experts [39]. This method is useful for analyzing and prioritizing elements when detailed information is not available or the elements are fuzzy and ambiguous [39,40]. FBWM is a practical and suitable method for analysis and decision making when the elements are fuzzy and ambiguous and users’ opinions about the importance and performance of the elements are needed [29]. In this research, we employ the FBWM proposed [29] that has the following steps.
Step 1:
Determining a set of decision criteria ( C = c 1 , c 2 , c 3 , . . . , c n ).
Step 2:
Determining the best criterion (CB) and the worst criterion (Cw).
Step 3:
Forming the fuzzy comparison vectors between best criterion and other criteria that is denoted by A ~ B = a ~ B 1 , a ~ B 2 , ,   a ~ B n where a ~ B j = a B j l , a B j m , a B j u and a ~ B B = 1,1 , 1 .
Step 4:
Forming the fuzzy comparison vectors between worst criterion and other criteria that is denoted by A ~ w = a ~ 1 w , a ~ 2 w , ,   a ~ n w where a ~ j w = a j w l , a j w m , a j w u and a ~ w w = 1,1 , 1 .
Step 5:
Determining the tolerance parameters ( d j t   and   q j t ) based on preference of the decision maker (DM) and characteristics of the problem.
Step 6:
Based on the risk attitude of the DM, solve one of the optimistic, pessimistic, or mixed approaches. The mathematical model of each model presented in [29].
Step 7:
Calculating the fuzzy deviation denoted by ξ ~ * = ξ * l , ξ * m , ξ * u (see [29] to understand the calculation process).
Step 8:
Obtaining the fuzzy consistency index (FCI) based on procedure explained in [29].
Step 9:
Computing the GMIR (graded mean integration representation) based on procedure explained in [12].
Step 10:
Check the consistency. In this step, there are several principles provided in [29] that should be examined.

3.2. Stochastic VIKOR

The VIKOR method is a consensus solution and multi-criteria optimization. VIKOR was first introduced by Aprikovich in 1998 to solve multi-criteria decision problems and achieve the best possible solution. This method is used to rank and select options according to a set of different indicators. The main goal of the VIKOR method is to bring most of the options closer to the ideal answer in each index so that the options are ranked based on this goal [41].
Various approaches have been presented for the VIKOR method, for example, the fuzzy VIKOR approach, gray VIKOR, and various other examples of these cases. In this study, the stochastic VIKOR approach is presented for the first time. In this method, different scenarios are designed, each scenario has a specific weight, and based on different scenarios, the final weight of the options is determined. In other words, choosing the optimal option is based on different conditions and scenarios ahead, and this way, we will be closer to the optimal solution in the real world. The steps of the stochastic VIKOR method are as follows:
  • Forming the decision matrix: At this stage, the decision matrix of the stochastic VIKOR method is formed. In this regard, it should be noted that the nature of the stochastic VIKOR method is based on the evaluation of options in different scenarios. Therefore, the decision matrix is also formed based on the scenario. Suppose S r = s r 1 ,   s r 2 ,   ,   s r s represents the set of scenarios of the desired problem, where P s s is the probability of the occurrence of scenario s. On the other hand, suppose C = { c 1 ,   c 2 ,   ,   c i } is the set of criteria of the desired problem and A = { a 1 ,   a 2 ,   ,   a j } is also the set of studied options. Considering x j i s as the score of option j in criterion i under scenario s , the decision matrix of the stochastic VIKOR method can be defined as follows. It should be noted that if there are several decision makers, the decision matrices can be averaged considering Table 2.
2.
Normalize the decision matrix
In the second step, the formed decision matrix is normalized or unscaled. Normalizing the decision matrix can be performed in different ways; the present research used the following method.
n j i s = x j i s x j i s 2
3.
Forming the weighted normalized decision matrix: At this stage, in order to calculate the weighted normalized matrix, each column of the scenario is multiplied by the probability of its similar occurrence ( P s s ) and by the weight of the corresponding criterion. Assuming W = w 1 , w 2 ,   , w i as the set of criteria weights, the weighted normalized decision matrix is calculated as follows.
f j i s = P s s × n j i s × w i
4.
Determining the positive and negative ideal point: In the fourth step, positive ideal and negative ideal points are identified. For this purpose, if the criterion is a positive criterion (the more the better), the positive ideal value for each scenario is equal to the largest value in the column of that scenario. On the other hand, if the criterion is a negative criterion (the lower the better), the positive ideal value for each scenario is equal to the smallest value in the column for that scenario. This process is opposite for the negative ideal answer. For example, if the criterion is positive, the ideal positive and negative answers can be calculated as follows.
f s + = max f i j s
f s = min f i j s
5.
Calculation of utility ( S S j ) and regret ( R j ) values for each indicator: In this step, the values of usefulness and regret are calculated using the following relationships.
L j s = i f s + f i j s f s + f s
S S j = s P s s × L j s
T j s = max i f s + f i j s f s + f s
R j = s P s s × T j s
6.
Calculation of VIKOR index values ( Q j ): In this step, the value of the Q j index is calculated according to the following relationship. It should be noted that v is collective utility.
Q j = v × S S j S S * S S S S * + 1 v × R j R * R R *
S S = max S S j , S S * = min S S j    
R = max R j , R * = min R j  
The important thing is to calculate the Q j index in summing up all the scenarios, the value of the Q j index is multiplied by the probability of occurrence of each scenario, and the final Q j value is calculated by their sum.
7.
Sort options by Q j , R j , and S S j values: The alternatives are sorted in descending order based on their S S j , R j , and Q j values. Alternative a is proposed as a compromise solution, ranked as the best according to the value of Q j (minimum) and considering the following two conditions. The first condition is an acceptable advantage according to the following formula.
Q a Q a 1 i 1 , i : n u m b e r   o f   a l t e r n a t i v e s
a alternative with the second position in the Q j ranking list.
The second condition is acceptance of acceptable stability in decision making. Alternative a must also have the highest rank in the ranking list S and R or both. Such an agreement remains constant in the decision-making process.
If one of the two conditions is not met, a set of agreed solutions is proposed:
Alternatives a and a if only the second condition is not fulfilled.
Alternatives a , a , a , , a m if the first condition is not met.
a m is determined using the following equation for the maximum value of m.
Q a m Q ( a ) ( 1 i 1 )

3.3. Hybrid Method

In order to specify the method used in this study, the steps of the research are shown in Figure 1.
The main advantages of the proposed combined method include the following:
  • Considering the uncertainty in the evaluation process, which causes things, like cost changes, demand changes, and time changes, to be involved in evaluating.
  • No limitation of scenario definition in the proposed method is one of its advantages. In the defined method, it is possible to define scenarios and evaluate projects based on them.
  • Combining this method with Fuzzy BWM makes the weight of the indicators more accurately identified to be used in the evaluation of projects in each scenario.

4. Case Study

The present study is about the evaluation of national rail transportation projects in Iran. These projects are in the form of railway line development in different regions of the country, construction of new railways, electrification and updating of existing railways, and development of existing railway technologies. In general, there have been 11 projects evaluated according to the desired research indicators. The project evaluation indicators are categorized into three, economic, social, and environmental, for the case study, and there are 15 indicators in total, as described in Table 3, Table 4 and Table 5. These indicators were finalized using the literature review and expert opinions.
The criteria tree is also shown in Figure 2.

5. Results

5.1. Calculating the Indicators’ Weights

This section is dedicated to computing the weights of the indicators using the FBWM. In this regard, we consider three groups of experts, dispatch the pairwise comparison questionnaire among them, and use the average of the gathered data to implement the FBWM. For example, Table 6 shows the pairwise comparison vector between the best criteria and other ones, and Table 7 demonstrates the pairwise comparison vector between the worst criteria and other ones. The comparison vectors for other indicators are provided in the Supplementary Materials. The FBWM method was implemented; the weights of the criteria and sub-criteria are presented in Table 8. In addition, Table 9 shows the values of CR for each step. Based on this table, for all steps, the value of CR is close to zero, demonstrating the reliability of the outputs.
It can be seen that among the indicators, economic index is by far the most important index, followed by social and, finally, environmental indicators. Among the sub-indices, the investment cost, internal return rate from the national perspective, the impact on the damage of the plan area, and the amount of traffic are the most important indicators. According to this weighting, in the next step, the projects are prioritized according to different scenarios and collectively.

5.2. Ranking the Projects

In this section, potential projects are prioritized using a random Vikor approach. In this regard, it should be mentioned that in order to prioritize these items and according to the environmental conditions of the projects, different scenarios are considered in the evaluations. Considering the economic challenges, one of the important scenarios is cost changes. The approach is that, due to various reasons, the prices and costs of the project may be overestimated, which increases the costs, and, vice versa, there is a possibility that the implementation costs may be reduced. By examining the opinions of experts, a frequency range of 30% of costs is considered to cover the scenario of cost changes, and the probability of project implementation in a critical state is 50%, project implementation with 30% less than the estimated cost is 15%, and project implementation with 30% more than the estimated cost is 35%. Therefore, in summary, in Table 9, the sub-scenarios of cost increase can be examined. Table 10 shows the scenario of cost changes.
Another influential scenario in decision making for the selection of railway development projects and plans is the level of demand. This amount of demand is based on passenger and cargo demand. In this regard, three sub-scenarios were considered for this scenario to be realized, with a probability of 50% of the estimated demand. With a probability of 25%, about 30% more than the fulfilled demand is realized, and with a probability of 25%, about 30% less than the fulfilled demand is realized. According to the explanations given in Table 10, the specifications of the scenario of demand changes can be seen. Table 11 shows the scenario of demand changes.

5.2.1. Scenario of Cost Changes

Table 12 shows the decision matrix for the SVIKOR method. Also, Table 13 shows the ranking of the alternative based on the SVIKOR outputs. According to this table, alternatives P4, P10, and P3 were selected as the best ones. It should be noted that the calculation process, such as normalized decision matrix, values of f+ and f−, etc., is provided in the Supplementary Materials in Tables SB.1–SB.5.

5.2.2. Demand Changes Scenario

Table 14 shows the decision matrix of this scenario. Also, Table 15 shows the ranking of the alternative based on the SVIKOR outputs. According to Table 15, alternatives P4, P3, and P10 were selected as the best ones. It should be noted that the calculation process, such as normalized decision matrix, values of f+ and f−, etc., is provided in the Supplementary Materials in Tables SC.1–SC.5.

5.2.3. Integration of Scenarios

In this, the alternatives are ranked based on the integrated scenarios. Since the probability of occurrence of each of the scenarios is 50%, the value of the VIKOE index ( Q ) was calculated for the projects in Table 16. According to the obtained results, alternatives P4, P3, P10, and P11 are the best ones.

5.3. Comparison of the Fuzzy Best–Worst Method in this Article

As stated in Section 3.1, this study utilized the extended fuzzy best–worst method [29]. In this section, this method is compared with fuzzy best–worst methods [42] and the simple best–worst method [40]. All three methods were applied to 10 different samples, and the results indicate that the obtained weights for various issues are almost similar (a sample is shown in Table 17). However, the CR in the method [29] is lower (shown in Figure 3), demonstrating its higher accuracy.

5.4. Validation of the Proposed Method

In order to validate the proposed random VIKOR method, the projects of this article were compared with VIKOR, Fuzzy VIKOR, and Fuzzy TOPSIS approaches so that the validity of the outputs of this method can be examined. Table 18 shows the ranking of projects in each method.
It can be seen that the findings of the Fuzzy VIKOR and Fuzzy TOPSIS methods are exactly the same as the SVIKOR method. However, the VIKOR approach has a slight difference in the evaluation of the two projects, which does not have a great impact on the final result. Therefore, in general, it can be seen that the results of SVIKOR are correct and accurate, and because it has the ability to define many scenarios, it is much more efficient than other approaches. In fuzzy or simple methods, necessarily, one number or finally a spectrum of three or four numbers (triangular and trapezoidal fuzzy numbers) can be provided for each index, which does not exist in SVIKOR.

5.5. Sensitivity Analysis for SVIKOR

An important parameter to analyze the sensitivity of the random Vikor method, which is presented for the first time, is the probability of the scenarios. In this regard, in this section, sensitivity analysis for different scenarios of cost changes and demand changes is examined. The most important component in the ranking of projects is the Q value of each project, which is observed for changes in the probability of scenarios. In the cost change scenario, the probability of occurrence of scenarios is 15%, 50%, and 35% for pessimistic, probable, and optimistic scenarios, respectively. In the other two cases, where the probability of the scenarios are equal, and in another case, where the scenarios are 80%, 10%, and 10%, respectively, for pessimistic, probable, and optimistic, it is checked, and the comparison of different cases is seen. In Figure 4, the value of Q is seen for different scenarios.
It can be seen that by changing the probability of occurrence in each scenario for cost changes, the value of Q for the projects will change, and, with this approach, the ranking of the projects will also change. This problem shows that the presented method is sensitive to the possibility of scenarios and the ranking of projects will change with their change. Another considered mode is demand changes. In the scenario of demand changes, the probability of occurrence of the scenarios is 25%, 50%, and 25%, respectively, for pessimistic, probable, and optimistic scenarios. In two other cases, where the probability of occurrence of the scenarios is equal, and in the other case, where the scenarios are 10%, 10%, and 80% for pessimistic, probable, and optimistic respectively, the comparison of different cases is seen. In Figure 5, the value of Q is seen for different scenarios.
It can be seen that by changing the probability of occurrence of each scenario of demand changes, the value of Q for the projects will change, and, with the same approach, the ranking of the projects will also change. This problem shows that the presented method is sensitive to the possibility of scenarios, and the ranking of projects will change with their change.

6. Conclusions and Managerial Implications

This study presented a new approach to the evaluation and selection of rail transportation projects considering uncertainty. In various reviewed studies, multi-criteria decision-making approaches were used in project evaluation, but these approaches are based on expert opinions and sometimes fuzzy data [9,43]. In this study, the stochastic VIKOR approach is presented for the first time, so that uncertainty can be taken into account by considering different scenarios in the evaluation of projects. In this regard, due to the uncertainty in the implementation costs and also in the demand for the use of different selected projects, the scenarios of demand changes and cost changes are involved in the evaluation of the projects. The approach means that, by taking into account the changes in demand and the cost of the projects, the evaluations were carried out, and, finally, the ranking of the projects was presented. The presented stochastic VIKOR approach has an advantage over other methods in that it has the ability to define unlimited scenarios in the evaluation of projects. For this reason, it is more efficient than VIKOR, fuzzy VIKOR, and gray VIKOR approaches.
In terms of thematic aspects and evaluation criteria, economic, environmental, and social dimensions were integrated in the evaluation of projects, which were generally evaluated within the paradigm of project sustainability. Studies were conducted in the field of the evaluation of transportation projects that considered the economic and environmental components in an integrated manner [22,24], but a study that also examined the social dimension in the evaluation of transportation projects was not found in studies. Also, it is essential to consider uncertainty along with these dimensions in the evaluation of projects in today’s world, which is not considered in this study.
According to the findings of the article, it was observed that the most important indicators in the evaluation of rail transport projects are financial indicators. The main reason for this problem is the challenging economic conditions in Iran, in which, of course, the importance of financial indicators in the evaluation of projects in most developing countries has a stronger role than other dimensions [9]. For this reason, managers of organizations in developing countries should always emphasize the financial components of selected projects, through which they can provide more economic income for the country and organizations. After the economic dimension, the social dimension is important in developing countries. Since the problem of employment is abundant in these countries, large projects that have the power to generate employment for many groups are placed at higher priority. After the economic and social indicators, it is the turn of the environmental indicators to choose projects with minimum environmental destruction or having a better perspective of helping the environment as much as possible. In addition to the aspects of sustainability in the evaluation of projects, in today’s world, due to the extensive changes in the business environment, there are many uncertainties and risks in the context of projects [44]. These uncertainties are caused by economic changes, including inflation and exchange rates, political changes, changes in laws and regulations, and also the amount of demand for projects. For this reason, it is important to be able to identify the uncertainties in the evaluation of the projects before selecting them, and considering them, proceeding to examine the projects. In this regard, managers of organizations can use the approach developed in this study to evaluate projects by defining different scenarios. Since the presented random VIKOR method has no limit in defining the number of scenarios, managers can define different numbers of scenarios according to the conditions of the organization and evaluate projects based on them. Finally, it should be mentioned that evaluating rail transport projects using sustainability criteria and considering uncertainty in it help us to make better decisions in the field of project implementation. Considering that rail transport has significant effects on the environment, economy, and society, these assessments can provide a path for the sustainable development of rail transport.
In summarizing the findings of this study, it is suggested that due to the existence of wide uncertainties, especially in the field of project implementation costs, scenario-based approaches should always be used to choose a better project [45]. From the findings and the approach presented in this study, the managers of different organizations, especially project-oriented organizations, can use them well in evaluating potential projects. Multidimensionally evaluate your projects by defining multiple scenarios and also estimating the values of indicators in each scenario, as well as by determining the probability of the occurrence of each scenario. In the continuation of this research, it is suggested that this structure should be combined with data-oriented algorithms and approaches, and scenario-oriented models based on inference systems and machine learning algorithms will be presented with the aim of prospective evaluation.

Supplementary Materials

The following supporting information can be downloaded at: https://0-www-mdpi-com.brum.beds.ac.uk/article/10.3390/su151713086/s1.

Author Contributions

Conceptualization, M.N., A.N. and J.A.Z.; validation, K.R. and J.A.Z.; investigation, M.N. and A.N.; methodology, M.N., J.A.Z. and K.R.; writing—original draft preparation, M.N. and K.R.; writing—review and editing, A.N.; visualization, M.N., K.R. and J.A.Z.; Supervision, A.N. All authors have read and agreed to the published version of the manuscript.

Funding

This research received no external funding.

Institutional Review Board Statement

Not applicable.

Informed Consent Statement

Not applicable.

Data Availability Statement

Data available on request from the authors.

Conflicts of Interest

The authors declare no conflict of interest.

References

  1. Candas, M.F.; Kutanoglu, E. Integrated location and inventory planning in service parts logistics with customer-based service levels. Eur. J. Oper. Res. 2020, 285, 279–295. [Google Scholar] [CrossRef]
  2. Alizadeh, Z.; Jalilzadeh, A.; Yousefian, F. Randomized Lagrangian Stochastic Approximation for Large-Scale Constrained Stochastic Nash Games. arXiv 2023, arXiv:2304.07688. [Google Scholar]
  3. Zhalechian, M.; Tavakkoli-Moghaddam, R.; Zahiri, B.; Mohammadi, M. Sustainable design of a closed-loop location-routing-inventory supply chain network under mixed uncertainty. Transp. Res. E Logist. Transp. Rev. 2016, 89, 182–214. [Google Scholar] [CrossRef]
  4. Noruzi, M.; Naderan, A.; Zakeri, J.A.; Rahimov, K. A Robust Optimization Model for Multi-Period Railway Network Design Problem Considering Economic Aspects and Environmental Impact. Sustainability 2023, 15, 5022. [Google Scholar] [CrossRef]
  5. Boroun, M.; Alizadeh, Z.; Jalilzadeh, A. Accelerated Primal-dual Scheme for a Class of Stochastic Nonconvex-concave Saddle Point Problems. arXiv 2023, arXiv:2303.00211. [Google Scholar]
  6. Jurík, L.; Horňáková, N.; Šantavá, E.; Cagáňová, D.; Sablik, J. Application of AHP method for project selection in the context of sustainable development. Wirel. Netw. 2022, 28, 893–902. [Google Scholar] [CrossRef]
  7. ForouzeshNejad, A.A. Leagile and sustainable supplier selection problem in the Industry 4.0 era: A case study of the medical devices using hybrid multi-criteria decision making tool. Environ. Sci. Pollut. Res. 2023, 30, 13418–13437. [Google Scholar] [CrossRef]
  8. Abdel-Basset, M.; Atef, A.; Smarandache, F. A hybrid neutrosophic multiple criteria group decision making approach for project selection. Cogn. Syst. Res. 2019, 57, 216–227. [Google Scholar] [CrossRef]
  9. ForouzeshNejad, A. A hybrid data-driven model for project portfolio selection problem based on sustainability and strategic dimensions: A case study of the telecommunication industry. Soft Comput. 2023, 1–21. [Google Scholar] [CrossRef]
  10. Tang, M.; Liao, H.; Wan, Z.; Herrera-Viedma, E.; Rosen, M.A. Ten Years of Sustainability (2009 to 2018): A Bibliometric Overview. Sustainability 2018, 10, 1655. [Google Scholar] [CrossRef]
  11. Sazvar, Z.; Tavakoli, M.; Ghanavati-Nejad, M.; Nayeri, S. Sustainable-resilient supplier evaluation for high-consumption drugs during COVID-19 pandemic using a data-driven decision-making approach. Sci. Iran. 2022. [Google Scholar] [CrossRef]
  12. Torbacki, W. Achieving Sustainable Mobility in the Szczecin Metropolitan Area in the Post-COVID-19 Era: The DEMATEL and PROMETHEE II Approach. Sustainability 2021, 13, 12672. [Google Scholar] [CrossRef]
  13. Farooq, D.; Moslem, S. Estimating Driver Behavior Measures Related to Traffic Safety by Investigating 2-Dimensional Uncertain Linguistic Data—A Pythagorean Fuzzy Analytic Hierarchy Process Approach. Sustainability 2022, 14, 1881. [Google Scholar] [CrossRef]
  14. Tseng, M.-L.; Tran, T.P.T.; Ha, H.M.; Bui, T.-D.; Lim, M.K. Sustainable industrial and operation engineering trends and challenges Toward Industry 4.0: A data driven analysis. J. Ind. Prod. Eng. 2021, 38, 581–598. [Google Scholar] [CrossRef]
  15. Rostami, O.; Tavakoli, M.; Tajally, A.; GhanavatiNejad, M. A goal programming-based fuzzy best–worst method for the viable supplier selection problem: A case study. Soft Comput. 2023, 27, 2827–2852. [Google Scholar] [CrossRef]
  16. Stoilova, S.; Munier, N. Analysis of Policies of Railway Operators Using SWOT Criteria and the SIMUS Method: A Case for the Bulgarian Railway Network. Sustainability 2021, 13, 6948. [Google Scholar] [CrossRef]
  17. Tirkolaee, E.B.; Dashtian, Z.; Weber, G.-W.; Tomaskova, H.; Soltani, M.; Mousavi, N.S. An Integrated Decision-Making Approach for Green Supplier Selection in an Agri-Food Supply Chain: Threshold of Robustness Worthiness. Mathematics 2021, 9, 1304. [Google Scholar] [CrossRef]
  18. Tirkolaee, E.B.; Goli, A.; Ghasemi, P.; Goodarzian, F. Designing a sustainable closed-loop supply chain network of face masks during the COVID-19 pandemic: Pareto-based algorithms. J. Clean. Prod. 2022, 333, 130056. [Google Scholar] [CrossRef]
  19. Mohagheghi, V.; Mousavi, S.M.; Antuchevičienė, J.; Dorfeshan, Y. Sustainable infrastructure project selection by a new group decision-making framework introducing MORAS method in an interval type 2 fuzzy environment. Int. J. Strat. Prop. Manag. 2019, 23, 390–404. [Google Scholar] [CrossRef]
  20. Ghapanchi, A.H.; Tavana, M.; Khakbaz, M.H.; Low, G. A methodology for selecting portfolios of projects with interactions and under uncertainty. Int. J. Proj. Manag. 2012, 30, 791–803. [Google Scholar] [CrossRef]
  21. Alizadeh, Z.; Polanco, F.P.; Jalilzadeh, A. A Projection-Based Algorithm for Solving Stochastic Inverse Variational Inequality Problems. arXiv 2023, arXiv:2305.08028. [Google Scholar]
  22. Hamurcu, M.; Alağaş, H.M.; Eren, T. Selection of rail system projects with analytic hierarchy process and goal programming. Sigma J. Eng. Nat. Sci. 2017, 8, 291–302. [Google Scholar]
  23. Hamurcu, M.; Eren, T. A fuzzy analytical network process approach to the selection of the rail system projects. Sigma J. Eng. Nat. Sci. 2018, 9, 415–426. [Google Scholar]
  24. Yücel, N.; Taşabat, S.E. The Selection of Railway System Projects with Multi Creteria Decision Making Methods: A Case Study for Istanbul. Procedia Comput. Sci. 2019, 158, 382–393. [Google Scholar] [CrossRef]
  25. Çoban, V. Solar energy plant project selection with AHP decision-making method based on hesitant fuzzy linguistic evaluation. Complex Intell. Syst. 2020, 6, 507–529. [Google Scholar] [CrossRef]
  26. Mahmoudi, A.; Deng, X.; Javed, S.A.; Yuan, J. Large-scale multiple criteria decision-making with missing values: Project selection through TOPSIS-OPA. J. Ambient. Intell. Humaniz. Comput. 2021, 12, 9341–9362. [Google Scholar] [CrossRef]
  27. Haseli, G.; Sheikh, R.; Wang, J.; Tomaskova, H.; Tirkolaee, E.B. A Novel Approach for Group Decision Making Based on the Best–Worst Method (G-BWM): Application to Supply Chain Management. Mathematics 2021, 9, 1881. [Google Scholar] [CrossRef]
  28. Wan, S.; Dong, J.; Chen, S.-M. Fuzzy best-worst method based on generalized interval-valued trapezoidal fuzzy numbers for multi-criteria decision-making. Inf. Sci. 2021, 573, 493–518. [Google Scholar] [CrossRef]
  29. Dong, J.; Wan, S.; Chen, S.-M. Fuzzy best-worst method based on triangular fuzzy numbers for multi-criteria decision-making. Inf. Sci. 2021, 547, 1080–1104. [Google Scholar] [CrossRef]
  30. Wan, S.; Dong, J. A Novel Extension of Best-Worst Method With Intuitionistic Fuzzy Reference Comparisons. IEEE Trans. Fuzzy Syst. 2021, 30, 1698–1711. [Google Scholar] [CrossRef]
  31. Bai, L.; Sun, Y.; Shi, H.; Shi, C.; Bai, J.; Han, X. Dynamic assessment modelling for project portfolio benefits. J. Oper. Res. Soc. 2022, 73, 1596–1619. [Google Scholar] [CrossRef]
  32. Mohammed, H.J. RETRACTED ARTICLE: The optimal project selection in portfolio management using fuzzy multi-criteria decision-making methodology. J. Sustain. Financ. Investig. 2021, 13, 125–141. [Google Scholar] [CrossRef]
  33. Koohathongsumrit, N.; Luangpaiboon, P. An integrated FAHP–ZODP approach for strategic marketing information system project selection. Manag. Decis. Econ. 2022, 43, 1792–1809. [Google Scholar] [CrossRef]
  34. Tirkolaee, E.B.; Torkayesh, A.E. A Cluster-based Stratified Hybrid Decision Support Model under Uncertainty: Sustainable Healthcare Landfill Location Selection. Appl. Intell. 2022, 52, 13614–13633. [Google Scholar] [CrossRef]
  35. Singh, M.; Rathi, R.; Antony, J.; Garza-Reyes, J.A. A toolset for complex decision-making in analyze phase of Lean Six Sigma project: A case validation. Int. J. Lean Six Sigma 2023, 14, 139–157. [Google Scholar] [CrossRef]
  36. Goli, A.; Shahsavani, I.; Fazli, F.; Golmohammadi, A.M.; Tavakkoli-Moghaddam, R. A comprehensive approach to evaluating the effective factors in implementing a circular supply chain by a hybrid MCDM method. Int. J. Supply Oper. Manag. 2023. [Google Scholar] [CrossRef]
  37. Chen, Z.-H.; Wan, S.-P.; Dong, J.-Y. An integrated interval-valued intuitionistic fuzzy technique for resumption risk assessment amid COVID-19 prevention. Inf. Sci. 2023, 619, 695–721. [Google Scholar] [CrossRef]
  38. Santos, N.; Junior, C.d.S.R.; Moreira, M.L.; dos Santos, M.; Gomes, C.F.S.; Costa, I.P.d.A. Strategy Analysis for project portfolio evaluation in a technology consulting company by the hybrid method THOR. Procedia Comput. Sci. 2022, 199, 134–141. [Google Scholar] [CrossRef]
  39. Chen, Z.-H.; Wan, S.-P.; Dong, J.-Y. An efficiency-based interval type-2 fuzzy multi-criteria group decision making for makeshift hospital selection. Appl. Soft Comput. 2022, 115, 108243. [Google Scholar] [CrossRef]
  40. Rezaei, J. Best-worst multi-criteria decision-making method: Some properties and a linear model. Omega 2016, 64, 126–130. [Google Scholar] [CrossRef]
  41. Abdel-Baset, M.; Chang, V.; Gamal, A.; Smarandache, F. An integrated neutrosophic ANP and VIKOR method for achieving sustainable supplier selection: A case study in importing field. Comput. Ind. 2019, 106, 94–110. [Google Scholar] [CrossRef]
  42. Guo, S.; Zhao, H. Fuzzy best-worst multi-criteria decision-making method and its applications. Knowl. -Based Syst. 2017, 121, 23–31. [Google Scholar] [CrossRef]
  43. Birjandi, A.K.; Akhyani, F.; Sheikh, R.; Sana, S.S. Evaluation and selecting the contractor in bidding with incomplete information using MCGDM method. Soft Comput. 2019, 23, 10569–10585. [Google Scholar] [CrossRef]
  44. Tavakoli, M.; Torabi, S.A.; GhanavatiNejad, M.; Nayeri, S. An integrated decision-making framework for selecting the best strategies of water resources management in pandemic emergencies. Sci. Iran. 2023. [Google Scholar] [CrossRef]
  45. Nayeri, S.; Sazvar, Z.; Heydari, J. Towards a responsive supply chain based on the industry 5.0 dimensions: A novel decision-making method. Expert Syst. Appl. 2023, 213, 119267. [Google Scholar] [CrossRef]
Figure 1. Proposed steps.
Sustainability 15 13086 g001
Figure 2. Decision tree.
Sustainability 15 13086 g002
Figure 3. Comparison of CR in different examples using the three methods [29,40,42].
Sustainability 15 13086 g003
Figure 4. Sensitivity analysis on the probability of cost change scenarios.
Sustainability 15 13086 g004
Figure 5. Sensitivity analysis on the probability of occurrence of demand change scenarios.
Sustainability 15 13086 g005
Table 1. Literature review. Note. The asterisk-marked items indicate the use of the component utilized in the table.
AuthorAimDimensionsUncertaintyMethodsCase Study
EconomicEnvironmentalSocial impacts
[22]Evaluation and selection of transportation projects** AHP/Goal ProgrammingRail systems
[23]Evaluation and selection of transportation projects** ANPRail systems
[24]Evaluation and selection of transportation projects** AHP/BWMIstanbul Railway
[25]Evaluation and selection of projects according to sustainability criteria* AHP/hesitant fuzzy linguisticSolar power plant
[26]Project evaluation and selection* TOPSIS-OPA/K-meansRefinery
[32]Project evaluation and selection* Fuzzy AHP/Fuzzy TOPSISIraq oil industry
[27]A new multi-criteria group decision-making approach * G-BWMsupply chain
[17]A hybrid multi-criteria decision-making approach * *AHP-TOPSIS- MOMILPsupply chain
[28]Development of best–worst trapezoidal fuzzy method GITrF BWM---
[29]Development of best–worst triangular fuzzy method Novel Fuzzy BWM---
[30]Development of best–worst triangular fuzzy method IFBWM---
[33]Evaluating and selecting startup projects with digital transformation* FAHP—ZODPThailand software projects
[38]Evaluation and strategic selection of projects in technology consulting organization* *THORSoftware projects
[31]Identifying the most important factors affecting the selection of the project portfolio* Mathematical Models---
[34]Designing a hybrid decision support model under uncertainty ***K-means—BWMChoosing a landfill site
[9]Data-driven evaluation and selection of telecom industry projects* * FBWM-DEA-Random ForestTelecom industry
[35]Evaluation of production industry projects with lean six sigma approach** Antropi—TOPSIS—VIKORIndian manufacturing industries
[36]Evaluation of factors affecting the cyclical supply chain** AHP- DEMATEL-SAWsupply chain
[37]Assessing the risk of epidemic resumption during the period of prevention of COVID-19 IVIF-BWM—IVIF-DEMATEL—IVIF-SPACOVID-19
This StudyEvaluation of plans and mega-projects of rail development at the national level****Fuzzy BWM—Stochastic VIKORRail transportation projects
Table 2. Decision matrix of VIKOR.
c 1 c 2 c i
s r 1 s r s s r 1 s r s s r 1 s r s
a 1 x 111 x 11 s x 121 x 12 s x 1 i 1 x 1 i s
a 2 x 211 x 21 s x 221 x 22 s x 2 i 1 x 2 i s
a j x j 11 x j 1 s x j 21 x j 2 s x j i 1 x j i s
Table 3. Economic criteria.
RowCriterionDescriptionReference
C1Investment costThe cost of studying and implementing the infrastructure, pavement, signs and communications and building stations of a railway project[22,23]
C2National Internal Rate of Return (IRR)IRR or “Internal Rate of Return” is an index in financial analysis. This index is used to estimate the profitability of investment from a national perspective.[23]
C3Reducing casualties and road accidentsTransferring cargo and passengers from the road to the railway will reduce road accidents and casualties.[23,24]
C4Strengthening the country’s international status and transitConsidering the geopolitical position of our country, it is important to create rail corridors in order to strengthen the country’s transit position.[23]
C5Internal rate of return (IRR) from the perspective of the private sector IRR or “Internal Rate of Return” is an index in financial analysis. This index is used to estimate the profitability of investment from the perspective of the private sector.[31,32]
C6Fuel consumption savingTransporting cargo and passengers from the road to the railway will save fuel consumption.[23,24]
C7The amount of trafficThe amount of traffic of each railway axis and the average amount of traffic expected in the rail network[23,24]
Table 4. Social criteria.
RowCriterionDescriptionReference
C8Creating social justice and removing deprivationCreating social justice and satisfaction in the proportional distribution of transportation infrastructure in order to benefit the members of the society and regions of the country from the railway.[35]
C9Providing employment, especially in deprived areasThe construction of transportation infrastructure will create employment in the period of construction and operation directly and create and develop other jobs indirectly.[9]
C10The possibility of developing the plan to cover other regions of the countryThe feasibility of extending the route of a railway project to cover other parts of the country prone to the rail network
(such as the Isfahan-Shiraz railway, which enables the extension of Shiraz to Bushehr port)
[15]
C11Facilitating people’s rail travelFacilitating the movement of passengers, especially in areas with limited transportation network[9]
C12Improving the correlation between the economic and social centers of the countryConnection and solidarity and synergy of economic and social centers to each other and increasing national solidarity[9]
Table 5. Environmental criteria.
RowCriterionDescriptionReference
C13Reducing environmental pollutantsAs green transportation, rail transportation will cause less environmental pollution in exchange for transporting cargo or passengers per unit length.[24,35]
C14Less effect on environmental change and destruction The lower level of environmental destruction and the ecosystem of the region according to the region and the climate of the implementation of the project[23]
C15Creating pollution in the implementation of the projectIt expresses the amounts of environmental pollutants produced during the implementation of the project.[23,24]
Table 6. The best-to-others vector.
ExpertBest CriteriaEconomicSocialEnvironmental
1Economic1112.533.53.544.5
21112.533.52.533.5
31110.6711.51.522.5
Table 7. The others-to-worst vector.
Worst Criteria: Environmental
Expert123
Critreia
Economic2.533.5
1.522.5
1.522.5
Social111
111
111
Environmental111
111
1.522.5
Table 8. The weights of the criteria and sub-criteria.
CriteriaWeight of CriteriaSub-CriteriaInitial Weight of Sub-CriteriaFinal WeightSub-Criteria Code
Economic0.54925Investment cost0.262950.14443C1
National Internal Rate of Return (IRR)0.227750.12509C2
Reducing casualties and road accidents0.096130.05280C3
Strengthening the country’s international status and transit0.101060.05551C4
Internal rate of return (IRR) from the perspective of the private sector 0.071690.03938C5
Fuel consumption saving0.100750.05534C6
The amount of traffic
(ton-kilometer)
0.139670.07671C7
Social0.24176Creating social justice and removing deprivation0.286590.06929C8
Providing employment, especially in deprived areas0.120640.02917C9
The possibility of developing the plan to cover other regions of the country0.187640.04536C10
Facilitating people’s rail travel0.193970.04689C11
Improving the correlation between the economic and social centers of the country0.211150.05105C12
Environmental0.20897Reducing environmental pollutants0.311200.06503C13
Less effect on environmental change and destruction 0.433890.09067C14
Creating pollution in the implementation of the project0.254920.05327C15
Table 9. The values of the CR.
StepCR
Criteria0.022435
Economic sub-criteria0.003542
Social sub-criteria0.006541
Environmental sub-criteria0.003547
Table 10. Cost change scenarios.
ScenarioProbabilityScenario of Cost Changes
S1-115%Optimistic: project implementation with 30% lower cost than estimated
S1-250%Probable: implementation of the project with the estimated cost
S1-335%Pessimistic: Project implementation with 30% more cost than estimated
Table 11. Demand changes scenarios.
ScenarioProbabilityScenario Demand Changes
S2-125%Optimistic: project implementation with 30% lower demand than estimated
S2-250%Probable: implementation of the project with the estimated demand
S2-325%Pessimistic: Project implementation with 30% more demand than estimated
Table 12. The decision matrix of cost-changing scenario.
S1-1S1-2S1-3S1-1S1-2S1-3S1-1S1-2S1-3
C1 C2C3
P10.00904160.00632910.00486850.160.120.09122,268122,268122,268
P20.02551020.01785710.01373630.200.160.1377,53977,53977,539
P30.00484260.00338980.00260760.100.070.05136,877136,877136,877
P40.00865800.00606060.00466200.220.170.14186,397186,397186,397
P50.01443000.01010100.00777000.180.140.1190,84290,84290,842
P60.00519480.00363640.00279720.100.070.05124,293124,293124,293
P70.00347580.00243310.0018716−0.01−0.02−0.0339,82839,82839,828
P80.00623830.00436680.00335910.160.120.09202,564202,564202,564
P90.01605140.01123600.00864300.120.080.0651,53851,53851,538
P100.00390320.00273220.00210170.100.070.05152,209152,209152,209
P110.00175070.00122550.00094270.180.130.10667,207667,207667,207
C4C5C6
P1146514651465−0.05−0.06−0.062170.182170.182170.18
P2366366366−0.05−0.05−0.051376.261376.261376.26
P3448448448−0.05−0.05−0.062429.482429.482429.48
P4146514651465−0.01−0.02−0.033308.443308.443308.44
P5617961−0.06−0.06−0.061612.381612.381612.38
P6494949−0.06−0.06−0.062206.122206.122206.12
P7733733733−0.06−0.06−0.06706.92706.92706.92
P8692692692−0.05−0.05−0.063595.383595.383595.38
P9333333−0.06−0.06−0.06914.77914.77914.77
P10146514651465−0.03−0.04−0.042701.612701.612701.61
P11529529529−0.03−0.04−0.0511,842.4911,842.4911,842.49
C7C8C9
P1658.13658.13658.131.001.001.00195.00195.00195.00
P2781.30781.30781.305.005.005.00312.00312.00312.00
P32025.002025.002025.006.006.006.00540.00540.00540.00
P43769.603769.603769.6010.0010.0010.00729.60729.60729.60
P5495.60495.60495.603.003.003.00201.60201.60201.60
P61380.001380.001380.004.004.004.00414.00414.00414.00
P7715.00715.00715.004.004.004.00660.00660.00660.00
P81680.001680.001680.005.005.005.00268.80268.80268.80
P9563.50563.50563.504.004.004.00386.40386.40386.40
P104725.004725.004725.0010.0010.0010.001080.001080.001080.00
P1110,793.0010,793.0010,793.008.008.008.00602.40602.40602.40
C10C11C12
P17.007.007.001301301305.005.005.00
P26.006.006.005725725725.005.005.00
P38.008.008.006306306308.008.008.00
P46.006.006.006996996998.008.008.00
P54.004.004.005050504.004.004.00
P66.006.006.008638638636.006.006.00
P74.004.004.003853853855.005.005.00
P82.002.002.004484484484.004.004.00
P92.002.002.002092092092.002.002.00
P107.007.007.001305130513057.007.007.00
P115.005.005.008288288287.007.007.00
C13C14C15
P16255.336255.336255.331.001.001.002.002.002.00
P23966.943966.943966.946.006.006.005.005.005.00
P37002.727002.727002.726.006.006.005.005.005.00
P49536.239536.239536.239.009.009.009.009.009.00
P54647.534647.534647.535.005.005.005.005.005.00
P66358.926358.926358.925.005.005.005.005.005.00
P72037.632037.632037.635.005.005.004.004.004.00
P810,363.3310,363.3310,363.334.004.004.005.005.005.00
P92636.732636.732636.735.005.005.004.004.004.00
P107787.127787.127787.129.009.009.008.008.008.00
P1134,134.7834,134.7834,134.785.005.005.005.005.005.00
Table 13. The outputs of the SVIKOR method for the cost-changing scenario.
QjRank
P10.91032128
P20.71325485
P30.46254873
P401
P50.96584519
P60.81325646
P70.978985410
P80.86548457
P9111
P100.32325162
P110.52351544
Table 14. The decision matrix of demand-changing scenario.
S2-1S2-2S2-3S2-1S2-2S2-3S2-1S2-2S2-3
C1 C2C3
P10.00578160.00444740.00578160.080.090.15105,281150,402195,523
P20.01631250.01254810.01631250.120.130.1966,76695,380123,994
P30.00347590.00267380.00347590.040.050.09135,107193,010250,913
P40.00553640.00425870.00553640.120.140.20197,035281,479365,922
P50.00922730.00709790.00922730.100.110.1778,221111,744145,268
P60.00332180.00255520.00332180.040.050.09107,025152,893198,761
P70.00251120.00193170.0025112−0.03−0.03−0.0131,50745,01058,513
P80.00398910.00306850.00398910.090.090.15174,422249,174323,926
P90.01026400.00789540.01026400.050.060.1144,37863,39782,416
P100.00249590.00191990.00249590.040.050.09131,062187,232243,402
P110.00111950.00086110.00111950.090.100.16574,512820,731106,6950
C4C5C6
P11058.460481512.08641965.71232−0.06−0.06−0.051606.324072294.748672983.17327
P2264.61512378.0216491.42808−0.06−0.05−0.041018.682081455.260111891.83814
P3332.82018475.4574618.09462−0.06−0.06−0.051849.269752641.813933434.35811
P41161.024481658.60642156.18832−0.04−0.03−0.012680.428773829.183954977.93914
P581.9046863.003681.90468−0.06−0.06−0.061193.45261704.932282216.41196
P635.28201650.4028865.523744−0.06−0.06−0.061632.927262332.753223032.57919
P7554.87124792.67321030.47516−0.06−0.06−0.06528.198374754.569106980.939838
P8499.82856714.0408928.25304−0.06−0.06−0.052661.232073801.76014942.28813
P923.52134433.6019243.682496−0.07−0.06−0.06677.092767967.2753821257.458
P101058.460481512.08641965.71232−0.05−0.04−0.031999.677182856.681693713.68619
P11382.22184546.0312709.84056−0.05−0.05−0.048765.5742412522.248916278.9236
C7C8C9
P1470.362671.946873.5291.001.001.00195195195
P2558.395797.7071037.0195.005.005.00312312312
P31447.2682067.5252687.7836.006.006.00540540540
P42694.1333848.7625003.39010.0010.0010.00730730730
P53.1574.5105.8633.003.003.00202202202
P68.79112.55816.3254.004.004.00414414414
P74.5556.5078.4584.004.004.00660660660
P810.70215.28819.8745.005.005.00269269269
P93.5895.1286.6664.004.004.00386386386
P1030.09842.99855.89710.0010.0010.00108010801080
P1168.75198.216127.6818.008.008.00602602602
C10C11C12
P1888911301695.005.005.00
P27774005727445.005.005.00
P39994416308198.008.008.00
P47774896999098.008.008.00
P54443550664.004.004.00
P677760486311216.006.006.00
P74442703855015.005.005.00
P82223144485824.004.004.00
P92221472092722.002.002.00
P10888914130516977.007.007.00
P1166658082810777.007.007.00
C13C14C15
P14033576174901.001.001.002.002.002.00
P22557365447506.006.006.005.005.005.00
P34662666086576.006.006.005.005.005.00
P46615945012,2869.009.009.009.009.009.00
P52996428055645.005.005.005.005.005.00
P64100585776145.005.005.005.005.005.00
P71314187724405.005.005.004.004.004.00
P86681954512,4084.004.004.005.005.005.00
P91700242831575.005.005.004.004.004.00
P105020717293249.009.009.008.008.008.00
P1122,00731,43840,8705.005.005.005.005.005.00
Table 15. The outputs of the SVIKOR method for the demand-changing scenario.
QjRank
P10.92321518
P20.59513214
P30.20321542
P40.13254111
P50.93521329
P60.86514236
P70.952325110
P80.9068547
P9111
P100.55654113
P110.60321515
Table 16. Ranking of the alternative in the integrated scenario.
Cost Changes ScenarioDemand Changes ScenarioIntegration of Scenarios
QjRankQjRankQjRank
P10.910321280.923215180.9167688
P20.713254850.595132140.6541935
P30.462548730.203215420.3328822
P4010.132541110.0662711
P50.965845190.935213290.9505299
P60.813256460.865142360.8391996
P70.9789854100.9523251100.96565510
P80.865484570.90685470.8861697
P9111111111
P100.323251620.556541130.4398963
P110.523515440.603215150.5633654
Table 17. Weighting of indicators using three methods in one of the examples.
Criteria[40][42][29]
C10.265840.271700.26295
C20.222850.227760.22775
C30.096410.094390.09613
C40.096710.098840.10106
C50.076260.070930.07169
C60.099900.098840.10075
C70.142040.137610.13967
Table 18. Ranking projects based on different methods.
Stochastic VIKORVIKORFuzzy VIKORFuzzy TOPSIS
P18888
P25555
P32322
P41111
P59999
P66666
P710111010
P87777
P911101111
P103233
P114444
Disclaimer/Publisher’s Note: The statements, opinions and data contained in all publications are solely those of the individual author(s) and contributor(s) and not of MDPI and/or the editor(s). MDPI and/or the editor(s) disclaim responsibility for any injury to people or property resulting from any ideas, methods, instructions or products referred to in the content.

