

The Impact of COVID-19 Lockdown on West Romanian Crop Production in 2020
 , and
, and
Abstract
:1. Introduction
1.1. Research Question
1.2. Literature Review
1.3. Agriculture and Rural Areas
2. Materials and Methods
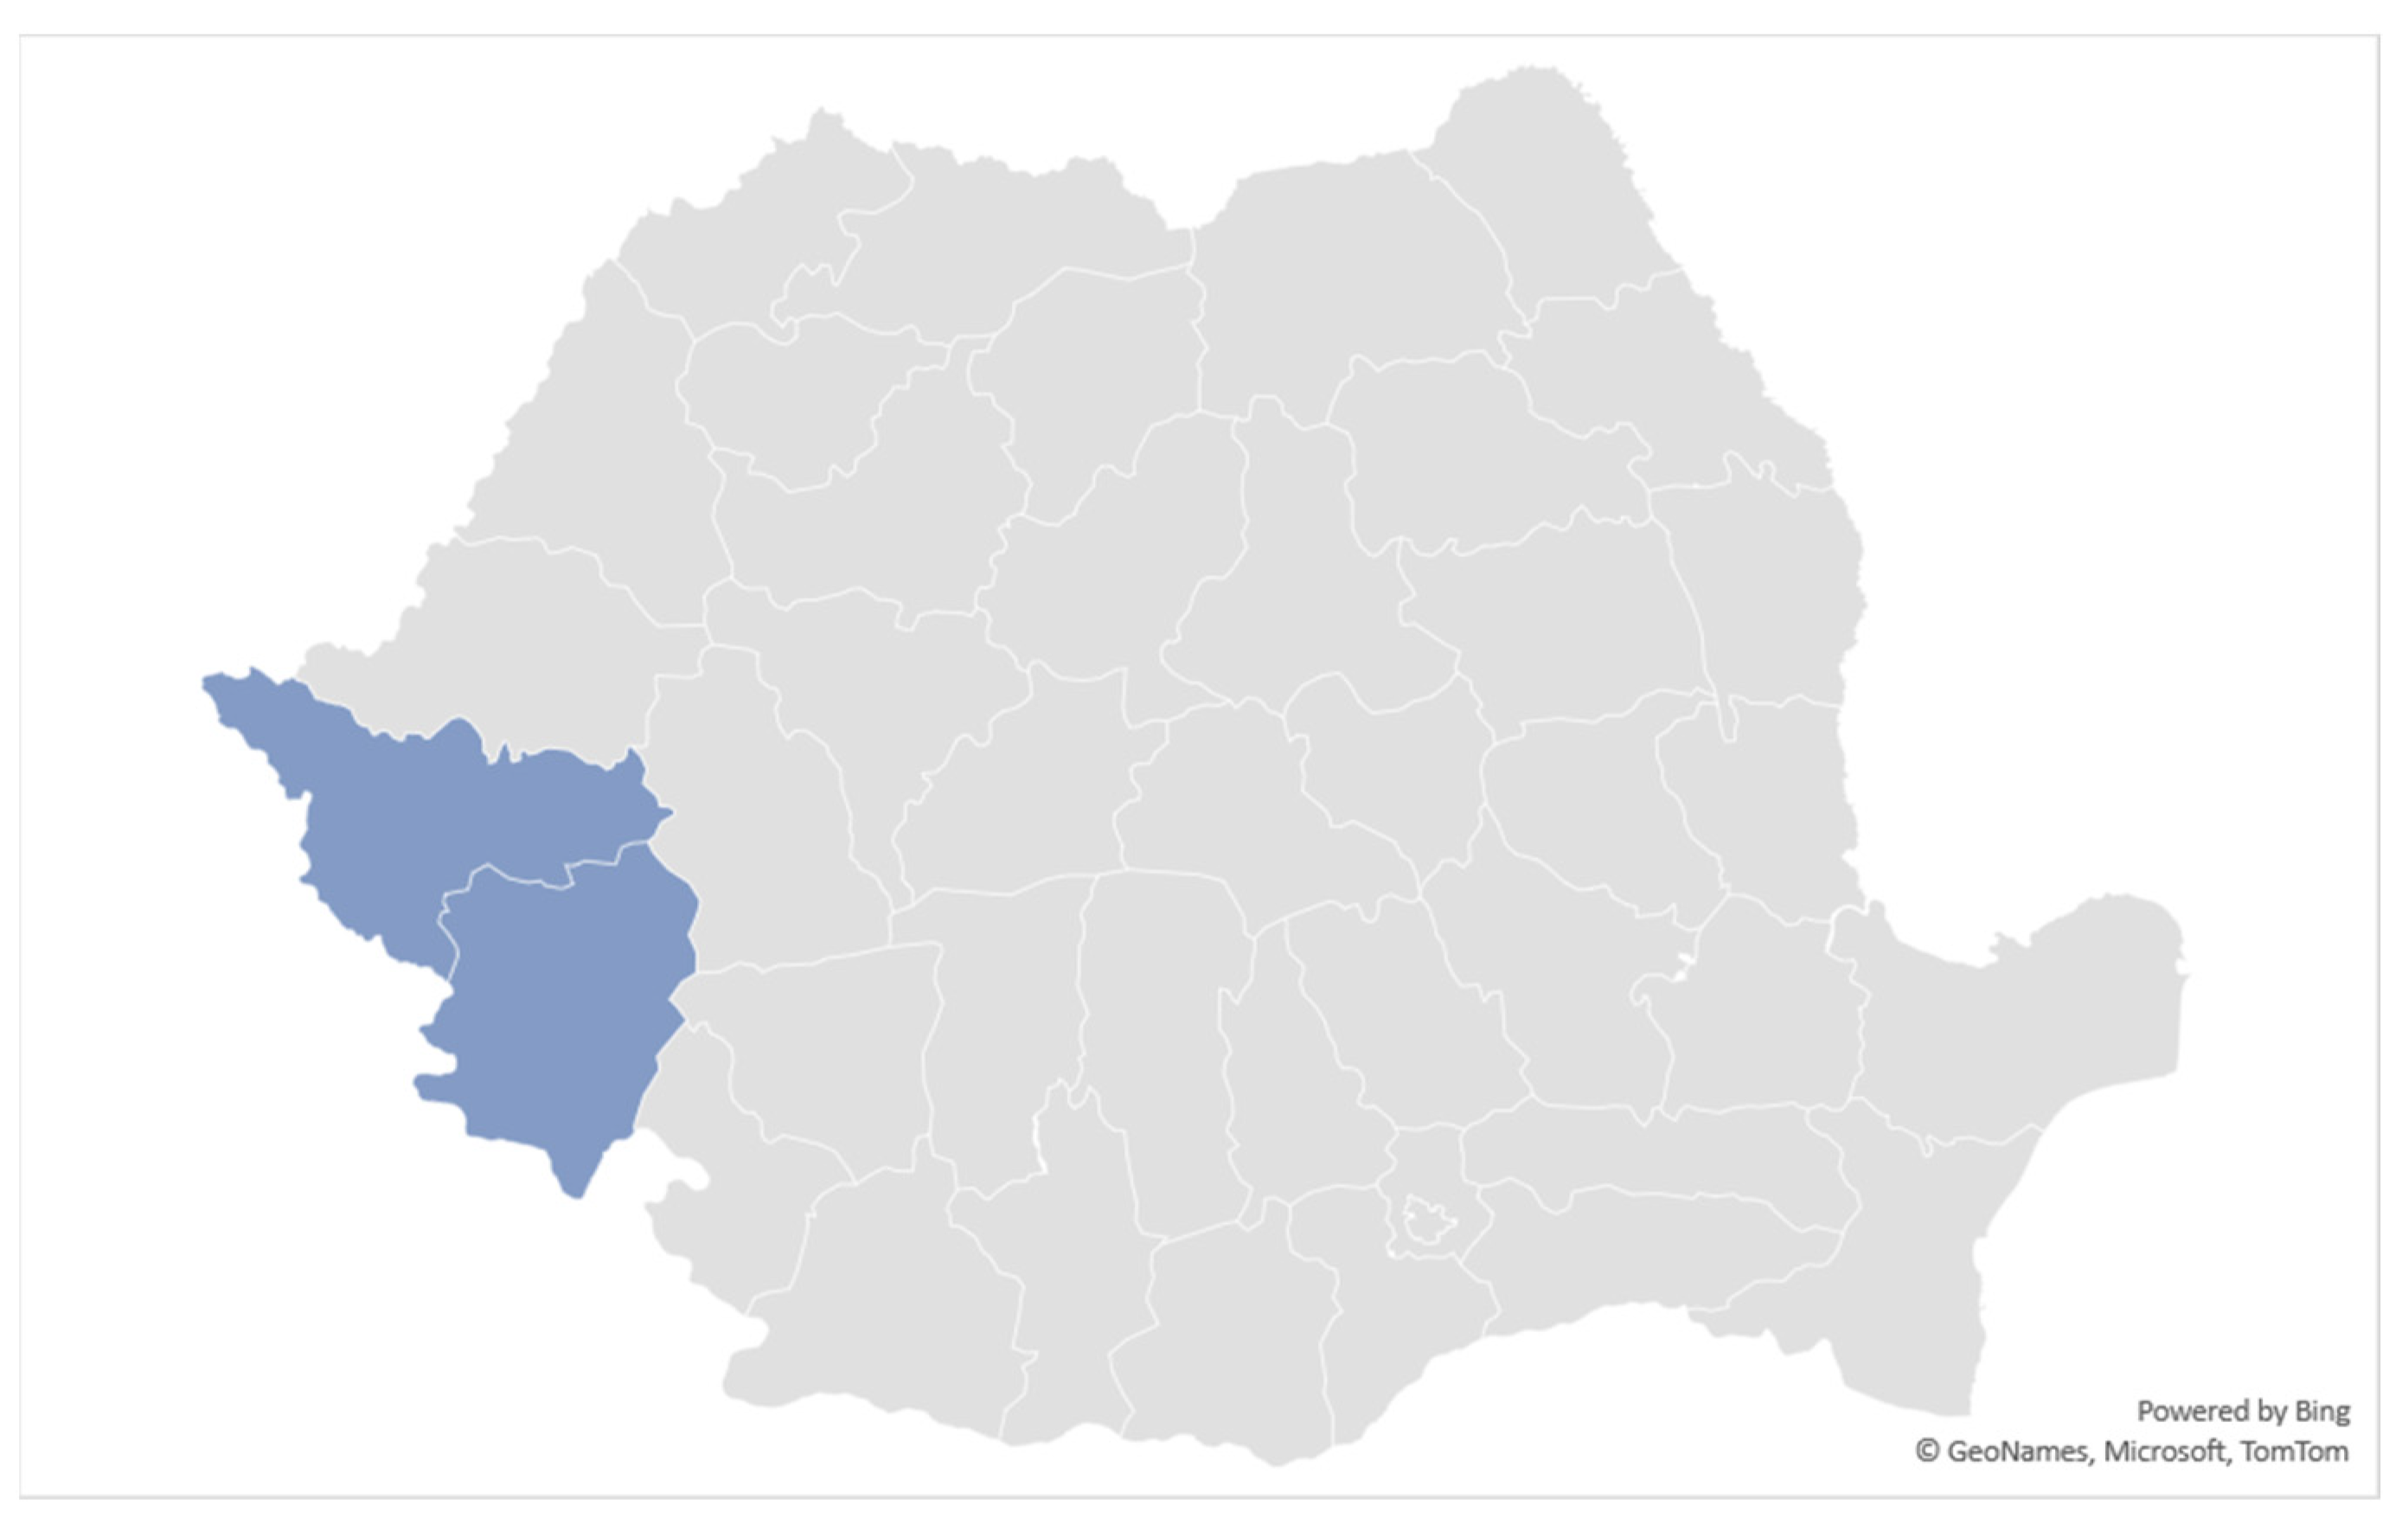
2.1. Area of Study
2.2. Data
2.3. Method
3. Results and Discussion
4. Conclusions
Author Contributions
Funding
Institutional Review Board Statement
Informed Consent Statement
Data Availability Statement
Conflicts of Interest
Appendix A
- (a)
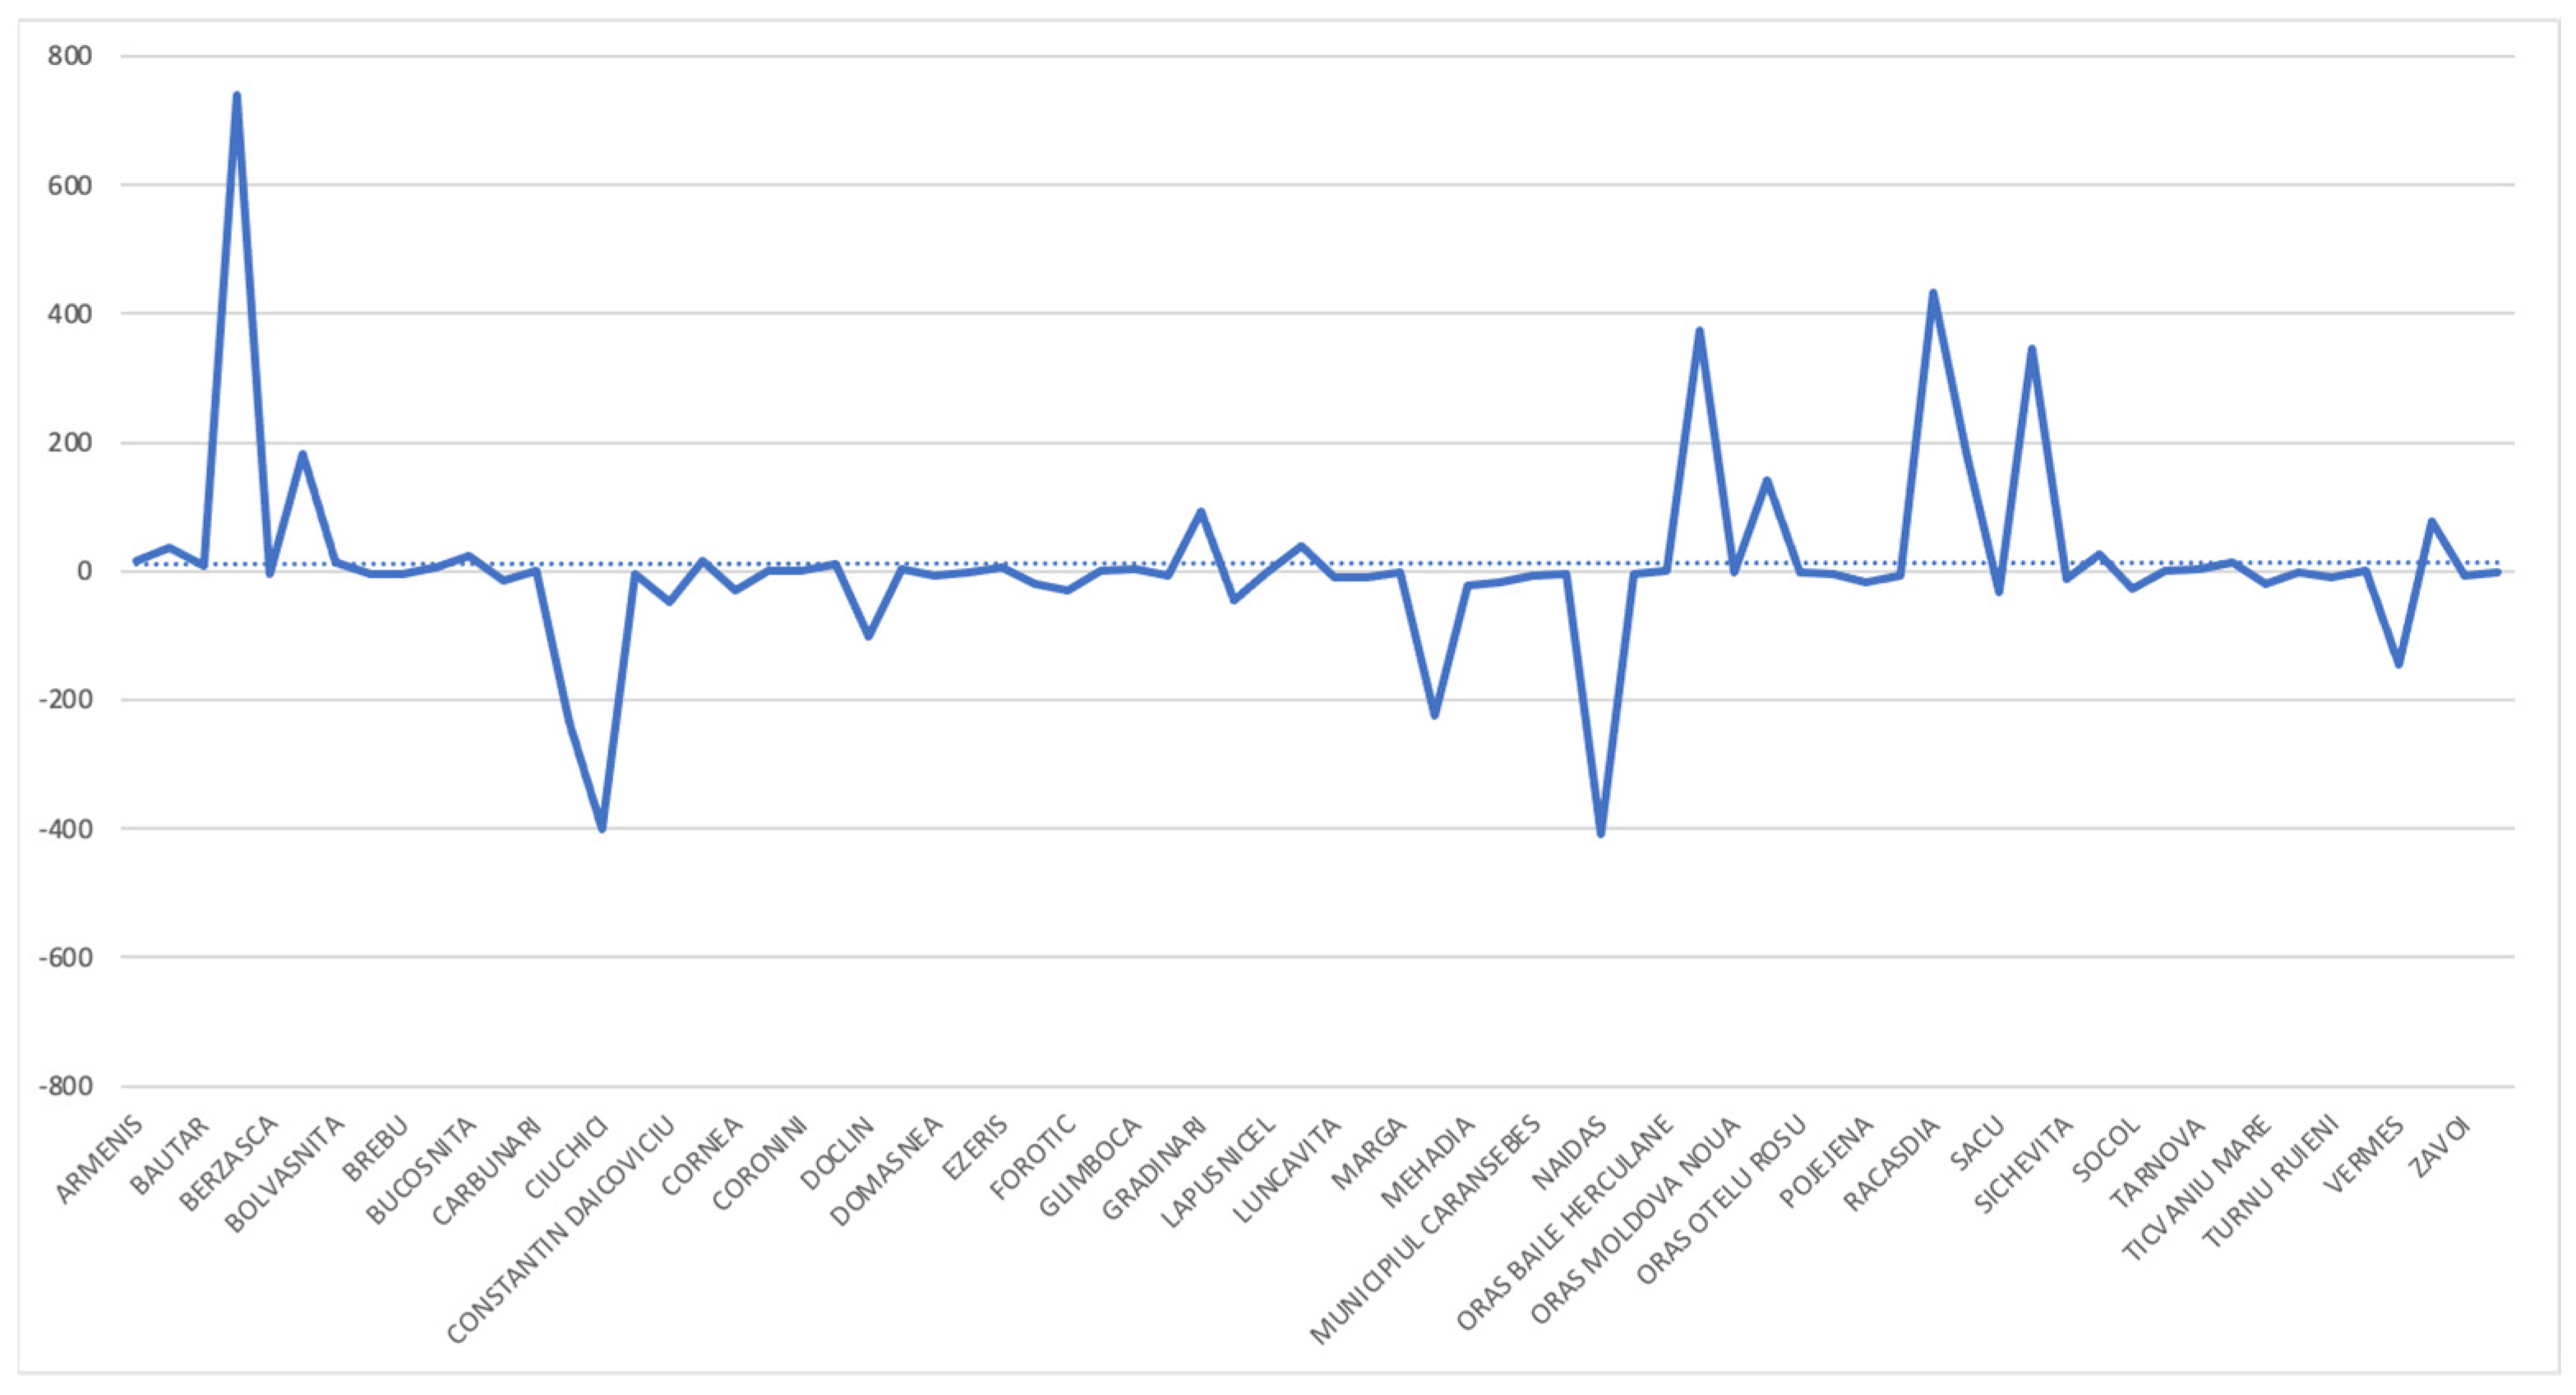
- Caras Severin County
| Place | Area 2019 | Area 2020 | Place | Area 2019 | Area 2020 |
| ARMENIS | 2855.51 | 2708.52 | ARMENIS | 49.13 | 65.35 |
| BANIA | 2316.54 | 2339.52 | BANIA | 157.12 | 193.36 |
| BAUTAR | 1526.92 | 1646.92 | BAUTAR | 28.3 | 36.09 |
| BERLISTE | 4917.11 | 4951.39 | BERLISTE | 961.24 | 1701.49 |
| BERZASCA | 990.94 | 1013.49 | BERZASCA | 78.73 | 73.61 |
| BERZOVIA | 7617.23 | 7996.44 | BERZOVIA | 1757.06 | 1940.14 |
| BOLVASNITA | 2224.67 | 2250.2 | BOLVASNITA | 52.93 | 65.77 |
| BOZOVICI | 2187.98 | 2237.19 | BOZOVICI | 172.4 | 169.08 |
| BREBU | 1532.19 | 1571.21 | BREBU | 135.51 | 131.36 |
| BREBU NOU | 582.38 | 621.25 | BUCHIN | 91.17 | 96.56 |
| BUCHIN | 2303.86 | 2396.93 | BUCOSNITA | 163.31 | 186.89 |
| BUCOSNITA | 2415.37 | 2434.82 | CARASOVA | 100.47 | 86.53 |
| CARASOVA | 1603.45 | 1546.66 | CARBUNARI | 1.65 | 1.64 |
| CARBUNARI | 250.72 | 252.94 | CICLOVA ROMANA | 544.56 | 309.37 |
| CICLOVA ROMANA | 3827.39 | 3893.65 | CIUCHICI | 837.64 | 437.67 |
| CIUCHICI | 3044.22 | 3165.6 | CIUDANOVITA | 27.84 | 24.52 |
| CIUDANOVITA | 656.17 | 614.14 | CONSTANTIN DAICOVICIU | 459.31 | 411.9 |
| CONSTANTIN DAICOVICIU | 1585.22 | 1661.16 | COPACELE | 123.14 | 140.3 |
| COPACELE | 1450.01 | 1621.41 | CORNEA | 120.76 | 89.83 |
| CORNEA | 2236.5 | 2190.31 | CORNEREVA | 75.3 | 76.35 |
| CORNEREVA | 6754.36 | 6821.82 | CORONINI | 20.31 | 20.11 |
| CORONINI | 417.11 | 430.41 | DALBOSET | 173.52 | 184.09 |
| DALBOSET | 1714.03 | 1765.96 | DOCLIN | 271.27 | 171.06 |
| DOCLIN | 3099.46 | 3119.35 | DOGNECEA | 2.08 | 5.06 |
| DOGNECEA | 232.18 | 260.42 | DOMASNEA | 52.81 | 47.18 |
| DOMASNEA | 1606.26 | 1575.52 | EFTIMIE MURGU | 73.81 | 71.75 |
| EFTIMIE MURGU | 1562.37 | 1580.32 | EZERIS | 85.09 | 91.27 |
| EZERIS | 1532.26 | 1539.62 | FARLIUG | 384 | 365.02 |
| FARLIUG | 5014.04 | 5008.73 | FOROTIC | 234.66 | 203.59 |
| FOROTIC | 4761.9 | 4753.23 | GARNIC | 3.91 | 3.59 |
| GARNIC | 853.75 | 896.29 | GLIMBOCA | 29.89 | 32.64 |
| GLIMBOCA | 498.67 | 507.76 | GORUIA | 57.27 | 50.09 |
| GORUIA | 1093.3 | 1122.76 | GRADINARI | 250.1 | 341.95 |
| GRADINARI | 2355.91 | 2457.65 | IABLANITA | 109.19 | 63.71 |
| IABLANITA | 2638.32 | 2532.87 | LAPUSNICEL | 21.55 | 18.95 |
| LAPUSNICEL | 1652.56 | 1650.92 | LAPUSNICU MARE | 116.94 | 156.16 |
| LAPUSNICU MARE | 1365.79 | 1377.2 | LUNCAVITA | 86.77 | 77.56 |
| LUNCAVITA | 1971.09 | 1985.71 | LUPAC | 77.52 | 67.69 |
| LUPAC | 917.42 | 910.36 | MARGA | 11.24 | 9.52 |
| MARGA | 576.82 | 526.22 | MAURENI | 2415.77 | 2192.38 |
| MAURENI | 7536.17 | 7509.05 | MEHADIA | 79.85 | 57.37 |
| MEHADIA | 2619.52 | 2576.18 | MEHADICA | 63.31 | 46.23 |
| MEHADICA | 1470.54 | 1428.34 | M. CARANSEBES | 76.18 | 70.5 |
| M. CARANSEBES | 1345.6 | 1372.66 | M. RESITA | 16.42 | 13.27 |
| M. RESITA | 1423.24 | 1454.66 | NAIDAS | 713.53 | 304.79 |
| NAIDAS | 2055.09 | 2107.61 | OBREJA | 91.04 | 87.4 |
| OBREJA | 2127.28 | 2256.07 | O. BAILE HERCULANE | 1.3 | 1.3 |
| O. ANINA | 365.1 | 367.85 | O. BOCSA | 92.63 | 466.61 |
| O. BAILE HERCULANE | 43.89 | 43.1 | O. MOLDOVA NOUA | 14.46 | 11.93 |
| O. BOCSA | 1364.12 | 1432.41 | O. ORAVITA | 340.57 | 481.69 |
| O. MOLDOVA NOUA | 730.08 | 728.77 | O. OTELU ROSU | 47.73 | 45.9 |
| O. ORAVITA | 4294.46 | 4366.46 | PALTINIS | 165.62 | 160.39 |
| O. OTELU ROSU | 734.97 | 715.14 | POJEJENA | 195.14 | 177.64 |
| PALTINIS | 2516.86 | 2496.68 | PRIGOR | 214.04 | 206.66 |
| POJEJENA | 1101.22 | 1089.36 | RACASDIA | 771.3 | 1204.86 |
| PRIGOR | 3892.73 | 3897.95 | RAMNA | 366.84 | 551.58 |
| RACASDIA | 4274.65 | 4325.2 | SACU | 294.09 | 261.35 |
| RAMNA | 3235.55 | 3310.03 | SASCA MONTANA | 35.68 | 381.73 |
| RUSCA MONTANA | 185.49 | 112.33 | SICHEVITA | 230.83 | 219.36 |
| SACU | 1903.36 | 2002.32 | SLATINA-TIMIS | 82.19 | 109.2 |
| SASCA MONTANA | 2013.85 | 2119.65 | SOCOL | 764.71 | 736.87 |
| SICHEVITA | 2560.28 | 2518.48 | SOPOTU NOU | 68.06 | 69.14 |
| SLATINA-TIMIS | 2763.26 | 2854.88 | TARNOVA | 11.34 | 14.48 |
| SOCOL | 1802.6 | 1973.43 | TEREGOVA | 120.75 | 135.13 |
| SOPOTU NOU | 1448.34 | 1468.85 | TICVANIU MARE | 305.61 | 286.85 |
| TARNOVA | 758.15 | 799.27 | TOPLET | 7.64 | 6.42 |
| TEREGOVA | 8033.79 | 8239.43 | TURNU RUIENI | 76.8 | 68.43 |
| TICVANIU MARE | 4803.94 | 5051.49 | VARADIA | 953.25 | 953.99 |
| TOPLET | 352.58 | 364.33 | VERMES | 1054.72 | 909.34 |
| TURNU RUIENI | 1964.31 | 2012.44 | VRANI | 800.96 | 877.62 |
| VALIUG | 359.65 | 362.29 | ZAVOI | 137.68 | 131.44 |
| VARADIA | 5307.72 | 5144.55 | ZORLENTU MARE | 244.22 | 242.07 |
| VERMES | 4398.91 | 4015.49 | Total | 18,853.76 | 19,702.72 |
| VRANI | 2854.8 | 2954.34 | |||
| ZAVOI | 9487.43 | 9577.99 | |||
| ZORLENTU MARE | 1914.94 | 2000.67 | |||
| Total | 180,786.45 | 182,986.62 |
- (b)
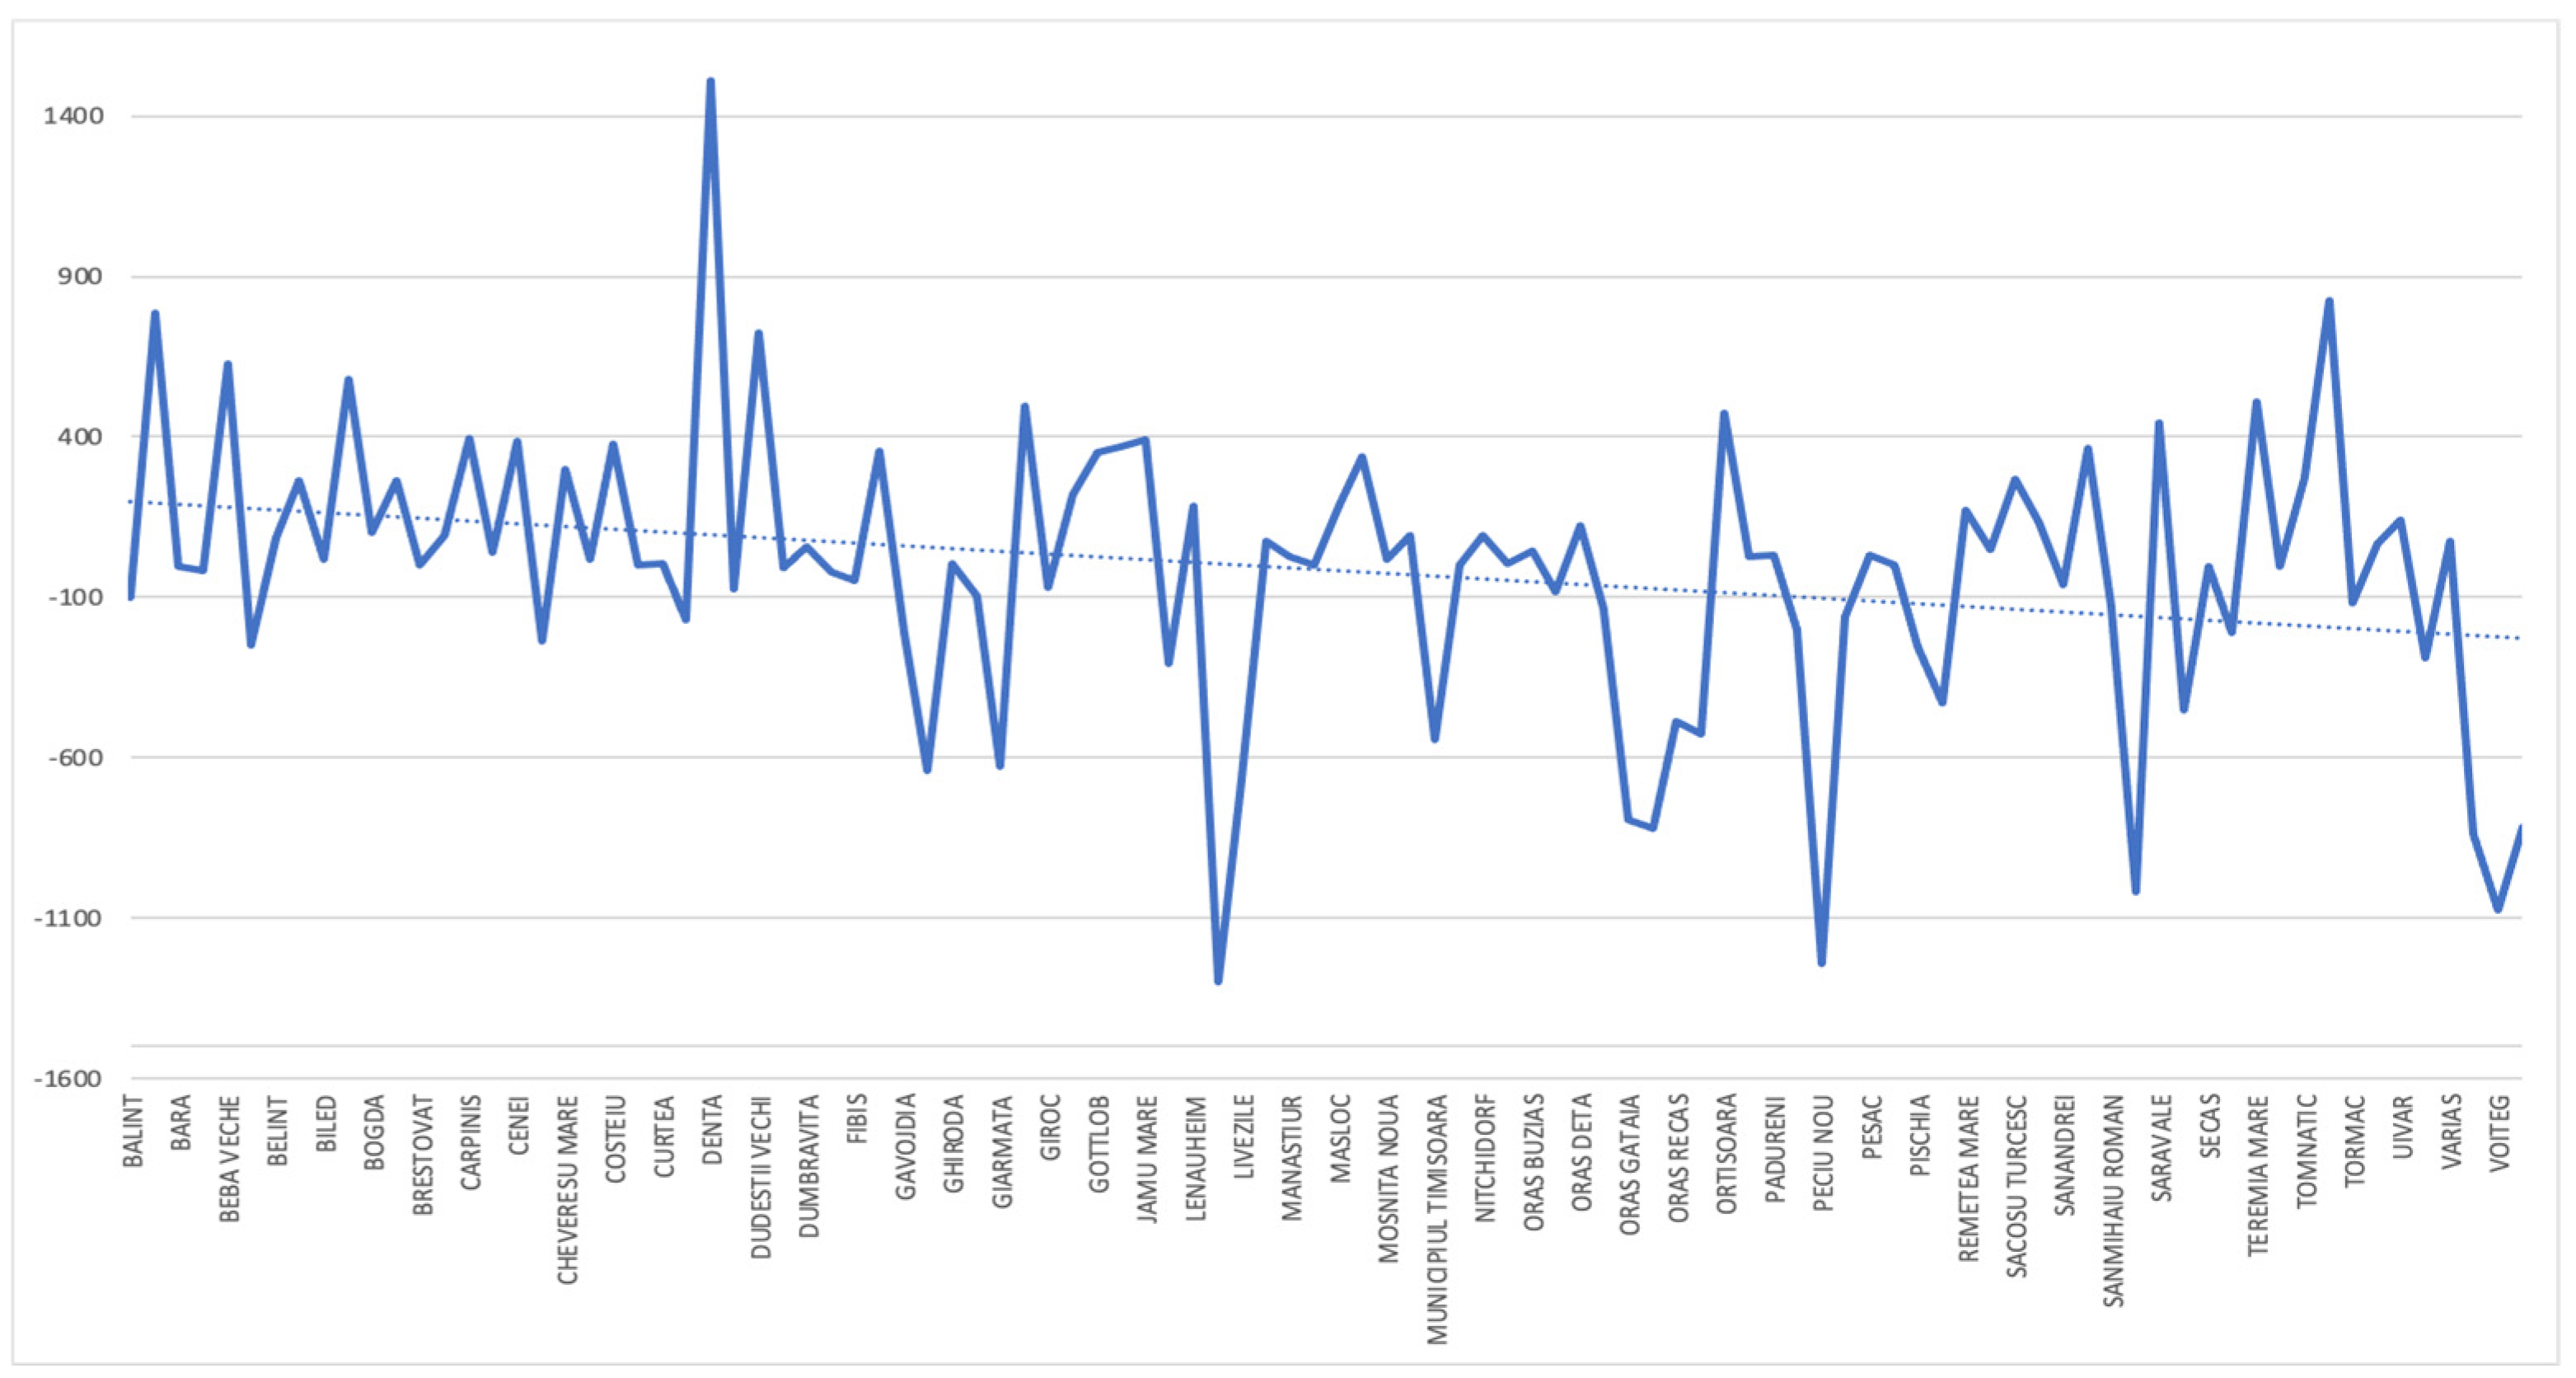
- Timis County
| Place | Area 2019 | Area 2020 | Place | Area 2019 | Area 2020 |
| BALINT | 2610.2 | 2662.2 | BALINT | 747.91 | 647.59 |
| BANLOC | 8910.83 | 8942.68 | BANLOC | 1327.22 | 2111.5 |
| BARA | 3430.24 | 3660.99 | BARA | 31.73 | 27.58 |
| BARNA | 1750.81 | 1629.82 | BARNA | 237.32 | 220.76 |
| BEBA VECHE | 8494.95 | 8496.69 | BEBA VECHE | 1556.4 | 2183.29 |
| BECICHERECU MIC | 3746.79 | 3706.4 | BECICHERECU MIC | 1393.84 | 1142.56 |
| BELINT | 4098.93 | 4309.9 | BELINT | 1916.94 | 2002.77 |
| BETHAUSEN | 3491.37 | 3660.54 | BETHAUSEN | 785.1 | 1048.64 |
| BILED | 4679.22 | 4496 | BILED | 2255.8 | 2274.71 |
| BIRDA | 5276.46 | 5296.47 | BIRDA | 1195.54 | 1775.67 |
| BOGDA | 1415 | 1574.96 | BOGDA | 119.01 | 221.6 |
| BOLDUR | 5343.27 | 5414.71 | BOLDUR | 1488.21 | 1751.03 |
| BRESTOVAT | 4662.56 | 4596.26 | BRESTOVAT | 206.24 | 204.87 |
| BUCOVAT | 2199.62 | 2232.6 | BUCOVAT | 866.21 | 957.44 |
| CARPINIS | 3809.68 | 3794.23 | CARPINIS | 1942.09 | 2335.92 |
| CENAD | 6691.18 | 6712.15 | CENAD | 1863.85 | 1905.26 |
| CENEI | 5756.07 | 5769.77 | CENEI | 2533.78 | 2921.82 |
| CHECEA | 5021.45 | 5058.73 | CHECEA | 3123.79 | 2886.34 |
| CHEVERESU MARE | 4663.12 | 4805.81 | CHEVERESU MARE | 1093.37 | 1391.4 |
| COMLOSU MARE | 7998 | 8020.04 | COMLOSU MARE | 4061.69 | 4078.58 |
| COSTEIU | 3688.79 | 3881.49 | COSTEIU | 1267.1 | 1646.11 |
| CRICIOVA | 989.16 | 1028.62 | CRICIOVA | 374.55 | 374.79 |
| CURTEA | 789.99 | 851.65 | CURTEA | 118.02 | 122.74 |
| DAROVA | 5979.37 | 6030.43 | DAROVA | 766.33 | 596.18 |
| DENTA | 6954.59 | 7003.27 | DENTA | 1355.78 | 2865.89 |
| DUDESTII NOI | 4160.63 | 4127.65 | DUDESTII NOI | 1441.66 | 1365.7 |
| DUDESTII VECHI | 12,186.01 | 12,246.01 | DUDESTII VECHI | 4484.62 | 5209.7 |
| DUMBRAVA | 3052.16 | 3066.72 | DUMBRAVA | 417.29 | 410.99 |
| DUMBRAVITA | 349.66 | 344.57 | DUMBRAVITA | 119.12 | 176.48 |
| FARDEA | 1026.51 | 1038.02 | FARDEA | 171.76 | 151.07 |
| FIBIS | 4222.86 | 4234.56 | FIBIS | 684.72 | 636.55 |
| FOENI | 5087.91 | 5106.07 | FOENI | 1216.6 | 1573.09 |
| GAVOJDIA | 3538.08 | 3646.16 | GAVOJDIA | 998.6 | 789.66 |
| GHILAD | 8843.54 | 8796.53 | GHILAD | 1927.97 | 1287.66 |
| GHIRODA | 1001.79 | 996.84 | GHIRODA | 352.97 | 356.24 |
| GHIZELA | 3935.66 | 3960.14 | GHIZELA | 463.66 | 368.29 |
| GIARMATA | 4761.13 | 4910.21 | GIARMATA | 1844.13 | 1215.94 |
| GIERA | 7275.03 | 7356.67 | GIERA | 1739.02 | 2237.49 |
| GIROC | 1476.58 | 1548.47 | GIROC | 335.68 | 265.38 |
| GIULVAZ | 7932.65 | 8005.15 | GIULVAZ | 1787.18 | 2008.07 |
| GOTTLOB | 3792.49 | 3788.06 | GOTTLOB | 1579.24 | 1932.88 |
| IECEA MARE | 2992.19 | 2993.23 | IECEA MARE | 1578.45 | 1949.15 |
| JAMU MARE | 12,251.77 | 12,213.88 | JAMU MARE | 1859.18 | 2249.98 |
| JEBEL | 5197.7 | 5225.74 | JEBEL | 1117.16 | 812.32 |
| LENAUHEIM | 9845.69 | 9794.06 | LENAUHEIM | 4837.69 | 5021.56 |
| LIEBLING | 6758.79 | 6842.82 | LIEBLING | 2629.84 | 1329.62 |
| LIVEZILE | 4465.22 | 4493.47 | LIVEZILE | 1377.61 | 708.92 |
| LOVRIN | 3451.34 | 3485.12 | LOVRIN | 1188.38 | 1262.41 |
| MANASTIUR | 1690.91 | 1750 | MANASTIUR | 191.89 | 216.68 |
| MARGINA | 1748.87 | 1771.04 | MARGINA | 298.88 | 300.19 |
| MASLOC | 5318.16 | 5442.27 | MASLOC | 1150.88 | 1333.91 |
| MORAVITA | 7099.38 | 7167.01 | MORAVITA | 1655.24 | 1995.11 |
| MOSNITA NOUA | 2196.14 | 2266.98 | MOSNITA NOUA | 585.98 | 604.34 |
| M. LUGOJ | 1790.34 | 1847.2 | M. LUGOJ | 638.99 | 733.39 |
| M. TIMISOARA | 3579.67 | 3630.19 | M. TIMISOARA | 1263.91 | 719.33 |
| NADRAG | 181.68 | 182.19 | NADRAG | 44.34 | 44.98 |
| NITCHIDORF | 3695.79 | 3715.05 | NITCHIDORF | 246.44 | 339.28 |
| OHABA LUNGA | 2218.26 | 2295.75 | OHABA LUNGA | 149.44 | 154.73 |
| O. BUZIAS | 5903.79 | 5837.92 | O. BUZIAS | 1136.25 | 1179.12 |
| O. CIACOVA | 10,459.17 | 10,428.5 | O. CIACOVA | 3003.63 | 2921.37 |
| O. DETA | 2233.85 | 2240.79 | O. DETA | 391.58 | 516.17 |
| O. FAGET | 4689.4 | 4631.35 | O. FAGET | 774.36 | 640.43 |
| O. GATAIA | 13,995 | 12,929.77 | O. GATAIA | 4024.57 | 3230.54 |
| O. JIMBOLIA | 9019.52 | 9034.67 | O. JIMBOLIA | 5234.49 | 4414.89 |
| O. RECAS | 14,352.71 | 14,628.43 | O. RECAS | 4011.44 | 3522.93 |
| O. SANNICOLAU MARE | 11,151.08 | 11,315.23 | O. SANNICOLAU MARE | 4432.7 | 3906.68 |
| ORTISOARA | 122,14.4 | 122,79.2 | ORTISOARA | 2695.47 | 3168.17 |
| OTELEC | 6364.82 | 6414.67 | OTELEC | 1607.92 | 1633.21 |
| PADURENI | 2882.72 | 2908.41 | PADURENI | 637.77 | 671.13 |
| PARTA | 4823.21 | 4849.28 | PARTA | 1890.53 | 1690.28 |
| PECIU NOU | 10,640.69 | 10,651.85 | PECIU NOU | 4283.7 | 3041.15 |
| PERIAM | 4708.93 | 4702.42 | PERIAM | 1784.89 | 1621.89 |
| PESAC | 2807.87 | 2832.32 | PESAC | 1618.64 | 1650.57 |
| PIETROASA | 1201.99 | 1126.87 | PIETROASA | 66.33 | 67.01 |
| PISCHIA | 7083.42 | 7207.12 | PISCHIA | 1731.36 | 1476.51 |
| RACOVITA | 7410.64 | 7576.24 | RACOVITA | 2954.64 | 2524.7 |
| REMETEA MARE | 4252.98 | 4372.3 | REMETEA MARE | 1077.3 | 1250.7 |
| SACALAZ | 8972.04 | 8901.57 | SACALAZ | 3920.32 | 3969.31 |
| SACOSU TURCESC | 8740.75 | 8882.72 | SACOSU TURCESC | 2158.58 | 2425.35 |
| SAG | 2243.74 | 2246.46 | SAG | 674.56 | 811.43 |
| SANANDREI | 6168.92 | 6201.91 | SANANDREI | 691.99 | 633.28 |
| SANDRA | 4418.47 | 4377.89 | SANDRA | 2225.91 | 2588.66 |
| SANMIHAIU ROMAN | 5130.46 | 5135.08 | SANMIHAIU ROMAN | 2042.47 | 1916.75 |
| SANPETRU MARE | 8186.32 | 8261.52 | SANPETRU MARE | 2931.76 | 1913.06 |
| SARAVALE | 8600.87 | 8672.01 | SARAVALE | 2263.29 | 2708.18 |
| SATCHINEZ | 7929.32 | 7925.07 | SATCHINEZ | 3385.76 | 2936.46 |
| SECAS | 2790.79 | 2809.49 | SECAS | 26.24 | 21.42 |
| STIUCA | 4551.45 | 4665.06 | STIUCA | 854.3 | 644.93 |
| TEREMIA MARE | 7256.48 | 7265.32 | TEREMIA MARE | 3388.33 | 3896.88 |
| TOMESTI | 537.71 | 549.75 | TOMESTI | 47.37 | 43.04 |
| TOMNATIC | 3376.55 | 3440.67 | TOMNATIC | 1345.6 | 1620.17 |
| TOPOLOVATU MARE | 7186.25 | 7211.32 | TOPOLOVATU MARE | 1949.65 | 2776.71 |
| TORMAC | 10,512.81 | 10,617.9 | TORMAC | 1294 | 1177.22 |
| TRAIAN VUIA | 3454.84 | 3567.06 | TRAIAN VUIA | 699.13 | 765.56 |
| UIVAR | 9429.82 | 9402.44 | UIVAR | 2922.87 | 3062.32 |
| VALCANI | 5570.96 | 5589.53 | VALCANI | 1768.54 | 1481.59 |
| VARIAS | 10,089.79 | 10,077.03 | VARIAS | 4503.11 | 4576.3 |
| VICTOR VLAD DELAMARINA | 6384.74 | 6627.62 | VICTOR VLAD DELAMARINA | 1717.63 | 882.2 |
| VOITEG | 5854.66 | 5904.07 | VOITEG | 1609.9 | 534.61 |
| Total | 533,160.17 | 536,223.07 | Total | 158,785.22 | 157,969.01 |
References
- Ehsan, Z.-A. Defining a Startup—A Critical Analysis. SSRN Electron. J. 2021. [Google Scholar] [CrossRef]
- OECD. Proposed Guidelines for Collecting and Interpreting Technological Innovation Data: Oslo Manual; Organisation for Economic Co-Operation and Development: Paris, France, 1997. [Google Scholar]
- Kézai, P.K.; Kurucz, A. Crisis Resilience of Startup Companies (The Case of Hungary among the Visegrad Countries with a Focus on the Pandemic). Sustainability 2023, 15, 7108. [Google Scholar] [CrossRef]
- Kalinowski, S. Od paniki do negacji: Zmiana postaw wobec COVID-19. Wieś i Rolnictwo 2020, 3, 45–65. [Google Scholar] [CrossRef] [PubMed]
- Kalinowski, S.; Łuczak, A. Social (in)Security—The Ambivalence of Villagers’ Perceptions during COVID-19. Probl. Polityki Społecznej 2022, 54, 48–67. [Google Scholar] [CrossRef]
- Kalar, B.; Primc, K.; Kump, N. Differences in COVID-19 Policies and Income Distribution: A Cross-Country Comparison. Sustainability 2023, 15, 4916. [Google Scholar] [CrossRef]
- Zakaria, R.H.; Sabri, M.F.; Satar, N.M.; Magli, A.S. The Immediate Impacts of COVID-19 on Low-Income Households: Evidence from Malaysia. Sustainability 2023, 15, 8396. [Google Scholar] [CrossRef]
- Fernández-Bedoya, V.H.; Meneses-La-Riva, M.E.; Suyo-Vega, J.A.; Gago-Chávez, J. de J.S. Entrepreneurship Research in Times of COVID-19: Experiences from South America. Sustainability 2023, 15, 6028. [Google Scholar] [CrossRef]
- Kumar, V.; Alshazly, H.; Idris, S.A.; Bourouis, S. Evaluating the Impact of COVID-19 on Society, Environment, Economy, and Education. Sustainability 2021, 13, 13642. [Google Scholar] [CrossRef]
- Zdolšek, D.; Beloglavec, S.T. Sustainability Reporting Ecosystem: A Once-in-a-Lifetime Overhaul during the COVID-19 Pandemic. Sustainability 2023, 15, 7349. [Google Scholar] [CrossRef]
- Homayoun, S.; Velashani, M.A.B.; Abbas Alkhafaji, B.K.; Jabbar Mezher, S. The Effect of COVID-19 on the Performance of SMEs in Emerging Markets in Iran, Iraq and Jordan. Sustainability 2023, 15, 7847. [Google Scholar] [CrossRef]
- Gregurec, I.; Tomičić Furjan, M.; Tomičić-Pupek, K. The Impact of COVID-19 on Sustainable Business Models in SMEs. Sustainability 2021, 13, 1098. [Google Scholar] [CrossRef]
- Hilmola, O.-P.; Lähdeaho, O.; Henttu, V.; Hilletofth, P. COVID-19 Pandemic: Early Implications for North European Manufacturing and Logistics. Sustainability 2020, 12, 8315. [Google Scholar] [CrossRef]
- Li, N.; Chen, M.; Huang, D. How Do Logistics Disruptions Affect Rural Households? Evidence from COVID-19 in China. Sustainability 2023, 15, 465. [Google Scholar] [CrossRef]
- Keokhoungning, T.; Wongsinlatam, W.; Remsungnen, T.; Namvong, A.; Khunkitti, S.; Inthakesone, B.; Siritaratiwat, A.; Premrudeepreechacharn, S.; Surawanitkun, C. Challenge of Supplying Power with Renewable Energy Due to the Impact of COVID-19 on Power Demands in the Lao PDR: Analysis Using Metaheuristic Optimization. Sustainability 2023, 15, 6814. [Google Scholar] [CrossRef]
- Kassem, M.A.; Radzi, A.R.; Pradeep, A.; Algahtany, M.; Rahman, R.A. Impacts and Response Strategies of the COVID-19 Pandemic on the Construction Industry Using Structural Equation Modeling. Sustainability 2023, 15, 2672. [Google Scholar] [CrossRef]
- Gutierrez, L.; Pierre, G.; Sabbagh, M. Agricultural Grain Markets in the COVID-19 Crisis, Insights from a GVAR Model. Sustainability 2022, 14, 9855. [Google Scholar] [CrossRef]
- Kalinowski, S.; Wyduba, W. Moja sytuacja w okresie koronawirusa. Raport końcowy z badań (My Situation during Coronavirus Period); IRWiR PAN: Warszawa, Poland, 2020. [Google Scholar] [CrossRef]
- Tudorache, A.T.; Nicolescu, L. Insights about the Effects of COVID-19 on International Trade during the Main Pandemic Years in Romania and Poland. Sustainability 2023, 15, 8726. [Google Scholar] [CrossRef]
- de Fátima Brilhante, M.; Rocha, M.L. COVID-19 Impact on the Tourism Accommodation and Restaurant Sectors of São Miguel (Azores). Sustainability 2023, 15, 343. [Google Scholar] [CrossRef]
- Rodríguez-Antón, J.M.; Alonso-Almeida, M.D.M. COVID-19 Impacts and Recovery Strategies: The Case of the Hospitality Industry in Spain. Sustainability 2020, 12, 8599. [Google Scholar] [CrossRef]
- Korinth, B. Impact of the COVID-19 Pandemic on International Tourism Income in Tourism Receiving Countries. Sustainability 2022, 14, 12550. [Google Scholar] [CrossRef]
- Czuczor, K.; Kozma, G.; Dorogi, Z.; Li, T.; Radics, Z. The Comprehensive Analysis of the Network of Superstructure Based on Territorial Characteristics of Accommodation and Food and Beverage Service Providers Considering the Financial Crisis and COVID-19: The Case of Bihor County, Romania. Sustainability 2023, 15, 6759. [Google Scholar] [CrossRef]
- Oxford Economics. The Impact of COVID-19 on the United States Travel Economy, 2020 Analysis; Oxford Economics: Oxford, UK, 2020. [Google Scholar]
- Siche, R. What Is the Impact of COVID-19 Disease on Agriculture? Sci. Agropecu. 2020, 11, 3–6. [Google Scholar] [CrossRef]
- Tonnang, H.E.Z.; Sokame, B.M.; Wamalwa, M.; Niassy, S.; Muriithi, B.W. System Dynamics Modeling for Assessing the Impact of COVID-19 on Food Supply Chains: A Case Study of Kenya and Rwanda. Sustainability 2023, 15, 4717. [Google Scholar] [CrossRef]
- Kusz, B.; Witek, L.; Kusz, D.; Chudy-Laskowska, K.; Ostyńska, P.; Walenia, A. The Effect of COVID-19 on Food Consumers’ Channel Purchasing Behaviors: An Empirical Study from Poland. Sustainability 2023, 15, 4661. [Google Scholar] [CrossRef]
- Abu Nahleh, Y.; Al Ali, B.; Al Ali, H.; Alzarooni, S.; Almulla, S.; Alteneiji, F. The Impact of COVID-19 on Supply Chain in UAE Food Sector. Sustainability 2023, 15, 8859. [Google Scholar] [CrossRef]
- Wang, J.; Fu, M.-J. Study on the Distribution of Fresh Food Support System—An Example of Shanghai during the Epidemic Closure of 2022. Sustainability 2023, 15, 7107. [Google Scholar] [CrossRef]
- Phillipson, J.; Gorton, M.; Turner, R.; Shucksmith, M.; Aitken-McDermott, K.; Areal, F.; Cowie, P.; Hubbard, C.; Maioli, S.; McAreavey, R.; et al. The COVID-19 Pandemic and Its Implications for Rural Economies. Sustainability 2020, 12, 3973. [Google Scholar] [CrossRef]
- Bochtis, D.; Benos, L.; Lampridi, M.; Marinoudi, V.; Pearson, S.; Sørensen, C.G. Agricultural Workforce Crisis in Light of the COVID-19 Pandemic. Sustainability 2020, 12, 8212. [Google Scholar] [CrossRef]
- Payne-Gifford, S.; Whatford, L.; Tak, M.; Van Winden, S.; Barling, D. Conceptualising Disruptions in British Beef and Sheep Supply Chains during the COVID-19 Crisis. Sustainability 2022, 14, 1201. [Google Scholar] [CrossRef]
- Vatta, K.; Bhogal, S.; Green, A.S.; Sharma, H.; Petrie, C.A.; Dixit, S. COVID-19 Pandemic-Induced Disruptions and Implications for National Food Security and Farm Incomes: Farm-Level Evidence from Indian Punjab. Sustainability 2022, 14, 4452. [Google Scholar] [CrossRef]
- Balgah, R.; Benjamin, E.; Kimengsi, J.; Buchenrieder, G. COVID-19 Impact on Agriculture and Food Security in Africa. A Systematic Review and Meta-Analysis. World Dev. Perspect. 2023, 31, 100523. [Google Scholar] [CrossRef]
- ILO International Labour Organisation, ILO Sectoral Brief, COVID-19 and the Impact on Agriculture and Food Security. 2020. Available online: https://www.ilo.org/wcmsp5/groups/public/---ed_dialogue/---sector/documents/briefingnote/wcms_742023.pdf (accessed on 8 July 2023).
- Zúñiga, B.; Calderón, K.; Ale, T. Impacts of COVID-19 on Agriculture and Food Security. Cent. Agrícola 2021, 48, 72–82. [Google Scholar]
- Singh, G.; Kumar, M. Impact of COVID-19 Pandemic on Agriculture and Management Strategies; Springer: Berlin/Heidelberg, Germany, 2021; Volume 2, pp. 1–6. [Google Scholar]
- Bhojiya, A.; Abubakar, Y. Global impact of COVID-19 on agriculture. J. Indian Res. 2021, 9, 82–87. [Google Scholar]
- English, L.; Pelkki, M.; Montgomery, R.; Tian, N.; Popp, J. Evaluating Economic Impacts of COVID-19 for Arkansas’ Agriculture and Forestry Sectors in 2020. 2022. Available online: https://ageconsearch.umn.edu/record/330155 (accessed on 8 July 2023).
- Stanisic, T.; Lazarević, S.; Pantic, N.; Lekovic, M. COVID-19 Pandemic and Economic Results of Agriculture in the European Union. Ekon. Poljopr. 2022, 69, 1151–1163. [Google Scholar] [CrossRef]
- Say Peng, T.; Chuen, N.; Lyndon, N.; Aman, Z.; Kannan, P.; Hashim, K.; Teo, H.M.; Syazlie, M.; Ibrahim, C. A Review on Post-COVID-19 Impacts and Opportunities of Agri-Food Supply Chain in Malaysia. PeerJ 2023, 11, e15228. [Google Scholar] [CrossRef]
- Umar, N. A Global Analysis of COVID-19 Impact on Agriculture. Jundishapur Journal of Microbiology 2022, 15, 1126–1138. [Google Scholar]
- Paudel, D.; Neupane, R.C.; Sigdel, S.; Poudel, P.; Khanal, A.R. COVID-19 Pandemic, Climate Change, and Conflicts on Agriculture: A Trio of Challenges to Global Food Security. Sustainability 2023, 15, 8280. [Google Scholar] [CrossRef]
- Barcaccia, G.; D’Agostino, V.; Zotti, A.; Cozzi, B. Impact of the SARS-CoV-2 on the Italian Agri-Food Sector: An Analysis of the Quarter of Pandemic Lockdown and Clues for a Socio-Economic and Territorial Restart. Sustainability 2020, 12, 5651. [Google Scholar] [CrossRef]
- Tripathi, H.G.; Smith, H.E.; Sait, S.M.; Sallu, S.M.; Whitfield, S.; Jankielsohn, A.; Kunin, W.E.; Mazibuko, N.; Nyhodo, B. Impacts of COVID-19 on Diverse Farm Systems in Tanzania and South Africa. Sustainability 2021, 13, 9863. [Google Scholar] [CrossRef]
- Shamsuddin, M.; Hossain, M.B.; Rahman, M.; Tazim, M.F.; Ali, M.R.; Kawla, M.S.; Begum, T.; Albeshr, M.F.; Arai, T. Impact of COVID-19 Pandemic on Fisheries Sector and Actions Taken to Cope with the Situation: A Case Study from a Top Fish-Producing Country. Sustainability 2023, 15, 3605. [Google Scholar] [CrossRef]
- Yu, J.; Zhang, J.; Zhou, M.; Cai, W. Impact of COVID-19 on the Comprehensive Resilience of Rural Areas—A Case Study of Jilin Province of China. Sustainability 2023, 15, 3152. [Google Scholar] [CrossRef]
- Et-Touile, H.; Arib, F. Impacts of COVID-19 Pandemic on Agriculture, Food Prices, and Food Security in Morocco. Int. J. Financ.Account. Econ. Manag. Audit. (IJFAEMA) 2021, 3, 973–988. [Google Scholar] [CrossRef]
- Dickson, R.S.; Yao, D. The Impact and Opportunities of COVID-19 in Ghana. Open J. Soc. Sci. 2020, 8, 71–86. [Google Scholar] [CrossRef]
- Jiang, Z.; Wang, X.; Wang, H.; Lu, G.; Wang, G.; Zhang, X.; Gong, X. The Impact and Opportunities of COVID-19 in China. J. Serv. Sci. Manag. 2020, 13, 558–566. [Google Scholar] [CrossRef]
- Prezentare Scheme de Plată/Măsuri de Sprijin Şi Ajutoare Derulate de APIA. Available online: https://apia.org.ro/despre-apia/scheme-de-plata-masuri-de-sprijin-derulate-de-apia/ (accessed on 6 June 2023).


| Direct Payments |
|---|
| SAPS—Single Area Payment Scheme |
| Redistributive payment scheme |
| Payment scheme for agricultural practices beneficial for the climate and the environment (Greening payment) |
| Payment scheme for young farmers |
| Coupled support—Soya |
| Coupled support—Alfalfa |
| Coupled support—Peas beans for industrialisation |
| Coupled Support—Beans for Industrialisation |
| Coupled Support—Hemp for Oil and Fibre |
| Coupled support—Rice |
| Coupled support—Seed potato |
| Coupled support—Hops |
| Coupled support—Sugar beetroot |
| Coupled support—Tomatoes for industrialisation |
| Coupled Support—Cucumbers for Industrialisation |
| Coupled support—Crops from greenhouses (tomatoes, cucumbers, peppers, and cabbage) |
| Coupled support—Crops from solariums (tomatoes, cucumbers, cabbage, eggplants, and peppers) |
| Coupled support—Plums for industrialisation |
| Coupled Support—Apples for Industrialisation |
| Coupled support—Cherries/cherries for industrialisation |
| Coupled support—Apricot/buttermilk for industrialisation |
| Coupled support—Early, semi-early and summer potatoes |
| Coupled support—Sheep |
| Coupled support—Goats |
| Coupled Support—Bovine Meat |
| Coupled support—Dairy cows |
| Coupled support—Milk buffaloes |
| Coupled support—Silkworms |
| Transitional National Aid |
| ANT 1—Transitional National Aid for arable crops |
| ANT 2—Transitional National Aid for flax for fibre |
| ANT 3—Transitional National Aid for hemp for fibre |
| ANT 4—Transitional National Aid for tobacco |
| ANT 5—Transitional National Aid for hops |
| ANT 6—Transitional National Aid for sugar beet |
| ANT 7—Transitional National Aid—Decoupled production scheme, bovine species—Meat sector |
| ANT 8—Transitional National Aid—Decoupled production scheme, bovine species—Milk sector |
| ANT 9 Transitional National Aid—Sheep/goat species |
Disclaimer/Publisher’s Note: The statements, opinions and data contained in all publications are solely those of the individual author(s) and contributor(s) and not of MDPI and/or the editor(s). MDPI and/or the editor(s) disclaim responsibility for any injury to people or property resulting from any ideas, methods, instructions or products referred to in the content. |
© 2023 by the authors. Licensee MDPI, Basel, Switzerland. This article is an open access article distributed under the terms and conditions of the Creative Commons Attribution (CC BY) license (https://creativecommons.org/licenses/by/4.0/).
Share and Cite
Gherasimescu, L.; Imbrea, F.; Imbrea, I.; Șmuleac, L.; Pașcalău, R.; Popoescu, C.A.; Prus, P.; Sălășan, C. The Impact of COVID-19 Lockdown on West Romanian Crop Production in 2020. Sustainability 2023, 15, 13605. https://0-doi-org.brum.beds.ac.uk/10.3390/su151813605
Gherasimescu L, Imbrea F, Imbrea I, Șmuleac L, Pașcalău R, Popoescu CA, Prus P, Sălășan C. The Impact of COVID-19 Lockdown on West Romanian Crop Production in 2020. Sustainability. 2023; 15(18):13605. https://0-doi-org.brum.beds.ac.uk/10.3390/su151813605
Chicago/Turabian StyleGherasimescu, Loredana, Florin Imbrea, Ilinca Imbrea, Laura Șmuleac, Raul Pașcalău, Cosmin Alin Popoescu, Piotr Prus, and Cosmin Sălășan. 2023. "The Impact of COVID-19 Lockdown on West Romanian Crop Production in 2020" Sustainability 15, no. 18: 13605. https://0-doi-org.brum.beds.ac.uk/10.3390/su151813605