Article

Investigation of a SWAT Model for Environmental Health Management Based on the Water Quality Parameters of a Stream System in Central Anatolia (Türkiye)

1
Environmental Health Department, Institute of Health Sciences, Çankırı Karatekin University, Çankırı 18200, Türkiye
2
Eldivan Vocational School of Health Services, Çankırı Karatekin University, Çankırı 18650, Türkiye
*
Author to whom correspondence should be addressed.
Sustainability 2023, 15(18), 13850; https://0-doi-org.brum.beds.ac.uk/10.3390/su151813850
Submission received: 11 August 2023 / Revised: 11 September 2023 / Accepted: 12 September 2023 / Published: 18 September 2023
(This article belongs to the Collection Risk Assessment and Management)

Abstract

:
Water is one of the most critical factors affecting environmental health. Therefore, it is essential to be able to predict water behavior in nature and prevent water pollution to avoid environmental health problems. In order to predict the behavior of water, the hydrological cycle needs to be evaluated at the basin level. To this aim, hydrological models can be used to obtain mathematical representations of hydrological processes. These models allow the anticipation and monitoring of issues regarding water quality, pollution, sediment transport, and proliferation of oil, and petroleum derivatives, among others, which can affect environmental health. In this study, a 2D surface water model was created using the soil and water assessment tool (SWAT) to simulate the lotic ecosystem and present water quality in the Tatlıçay Basin and to propose solutions for improving environmental health in the Cankiri provincial center in Türkiye. The accuracy of the input data and the validity of the model were tested with calibration and validation studies by using monthly or trimonthly observation data obtained from the flow observation and water quality stations of the General Directorate of State Hydraulic Works from 2016 to 2020. The aim was to create a model able to provide fast, accurate, and practical solutions in the face of water-related and environmental issues. The calibration and validation of this model were successfully carried out with very few observation data. Since surface water models are dynamic, long-term daily or monthly flow and water quality measurements should increase the accuracy of their predictions. Additionally, in the presence of pollution sources that may affect environmental health, monitoring and analyses of their possible effects should be carried out. As one of the few studies from the Middle East describing a hydrological model, this research makes a significant contribution to the literature on environmental health.

1. Introduction

River ecosystems represent one of the most well-known and important sources of clean water, with unrivalled importance for the biosphere [1]. Like all other clean water sources, rivers are under threat from natural and anthropogenic pressures [2]. Therefore, it is important to define these pressures and identify their pollutant burden [3]. Hydrological models are among the most accurate tools to analyze water resources. Hydrological models can be applied at basin scale, are cost- and time-efficient, can use already available data, and can be employed for areas where parameter measurement is difficult [4]. When using hydrological models, precautions can be taken to protect urban and environmental health, and possible unexpected problems can be easily overcome [5,6].
Hydrological modelling involves tools that allow the opportunity to solve equations representing real surface water systems, suitably simplified [7]. At the same time, since they are able to model water quality parameters, they can predict the movement of pollutants in aqueous environments even in inaccessible areas without requiring large-scale, expensive chemical analyses and intensive labor and identify measures to prevent water and environmental pollution [8,9,10]. Several different software programs can be used for hydrological modelling, based on pollutants’ features [11,12,13].
Hydrological model software may be chosen according to the available data, the types of problems encountered, and the solutions to be implemented [14]. In the field of environmental health, the SWAT model is one of the most used, as it can effectively identify and monitor the factors that may seriously damage environmental health, such as water pollution, particle/sediment, and nutrient transport, allowing for the design of effective solutions [15,16,17,18].
The SWAT hydrological model works with easily accessible data, which can be climatic (rainfall, temperature, solar radiation, and relative humidity), physical (land use, soil features, topography, and slope), hydrological (flow discharge rates, water levels), and chemical (point and distributed pollutant burden) [19,20]. After calibration and sensitivity analysis based on observed values defined in the model, these data allow the model to provide daily, monthly, or annual outputs regarding the flow and water quality on a basin scale [21,22].
The main aim of this study, encompassing the years 2020–2022, was to present alternative recommendations about the use of hydrological models to predict and monitor water quality-related issues that may affect environmental health and to investigate the behavior, distribution, and sources of pollutants disrupting water quality [23,24]. We focused on the Tatlıçay river ecosystem, an important water resource in the Çankırı province, with a moderate population density, located in the Central Anatolia region of Türkiye, and decided to define it using the SWAT model. Our goal was to determine the water quality in this system, create a foundation for the analysis of the pollutant burden and its possible future effects on environmental health, and suggest effective solutions.
Hydrological modeling, which enables us to study the of water quality with high accuracy even in inaccessible areas, belongs to the field of engineering, together with hydrology, hydrogeology, construction, and the environment. In addition, hydrological modeling and water quality studies are also part of the global environmental health literature. However, this study has also a national and local value, as it presents the current water quality of a certain region in Türkiye. This research will encourage the use of hydrological models for ecosystem-based water quality management and the development of information systems by national and local governments.

2. Materials and Methods
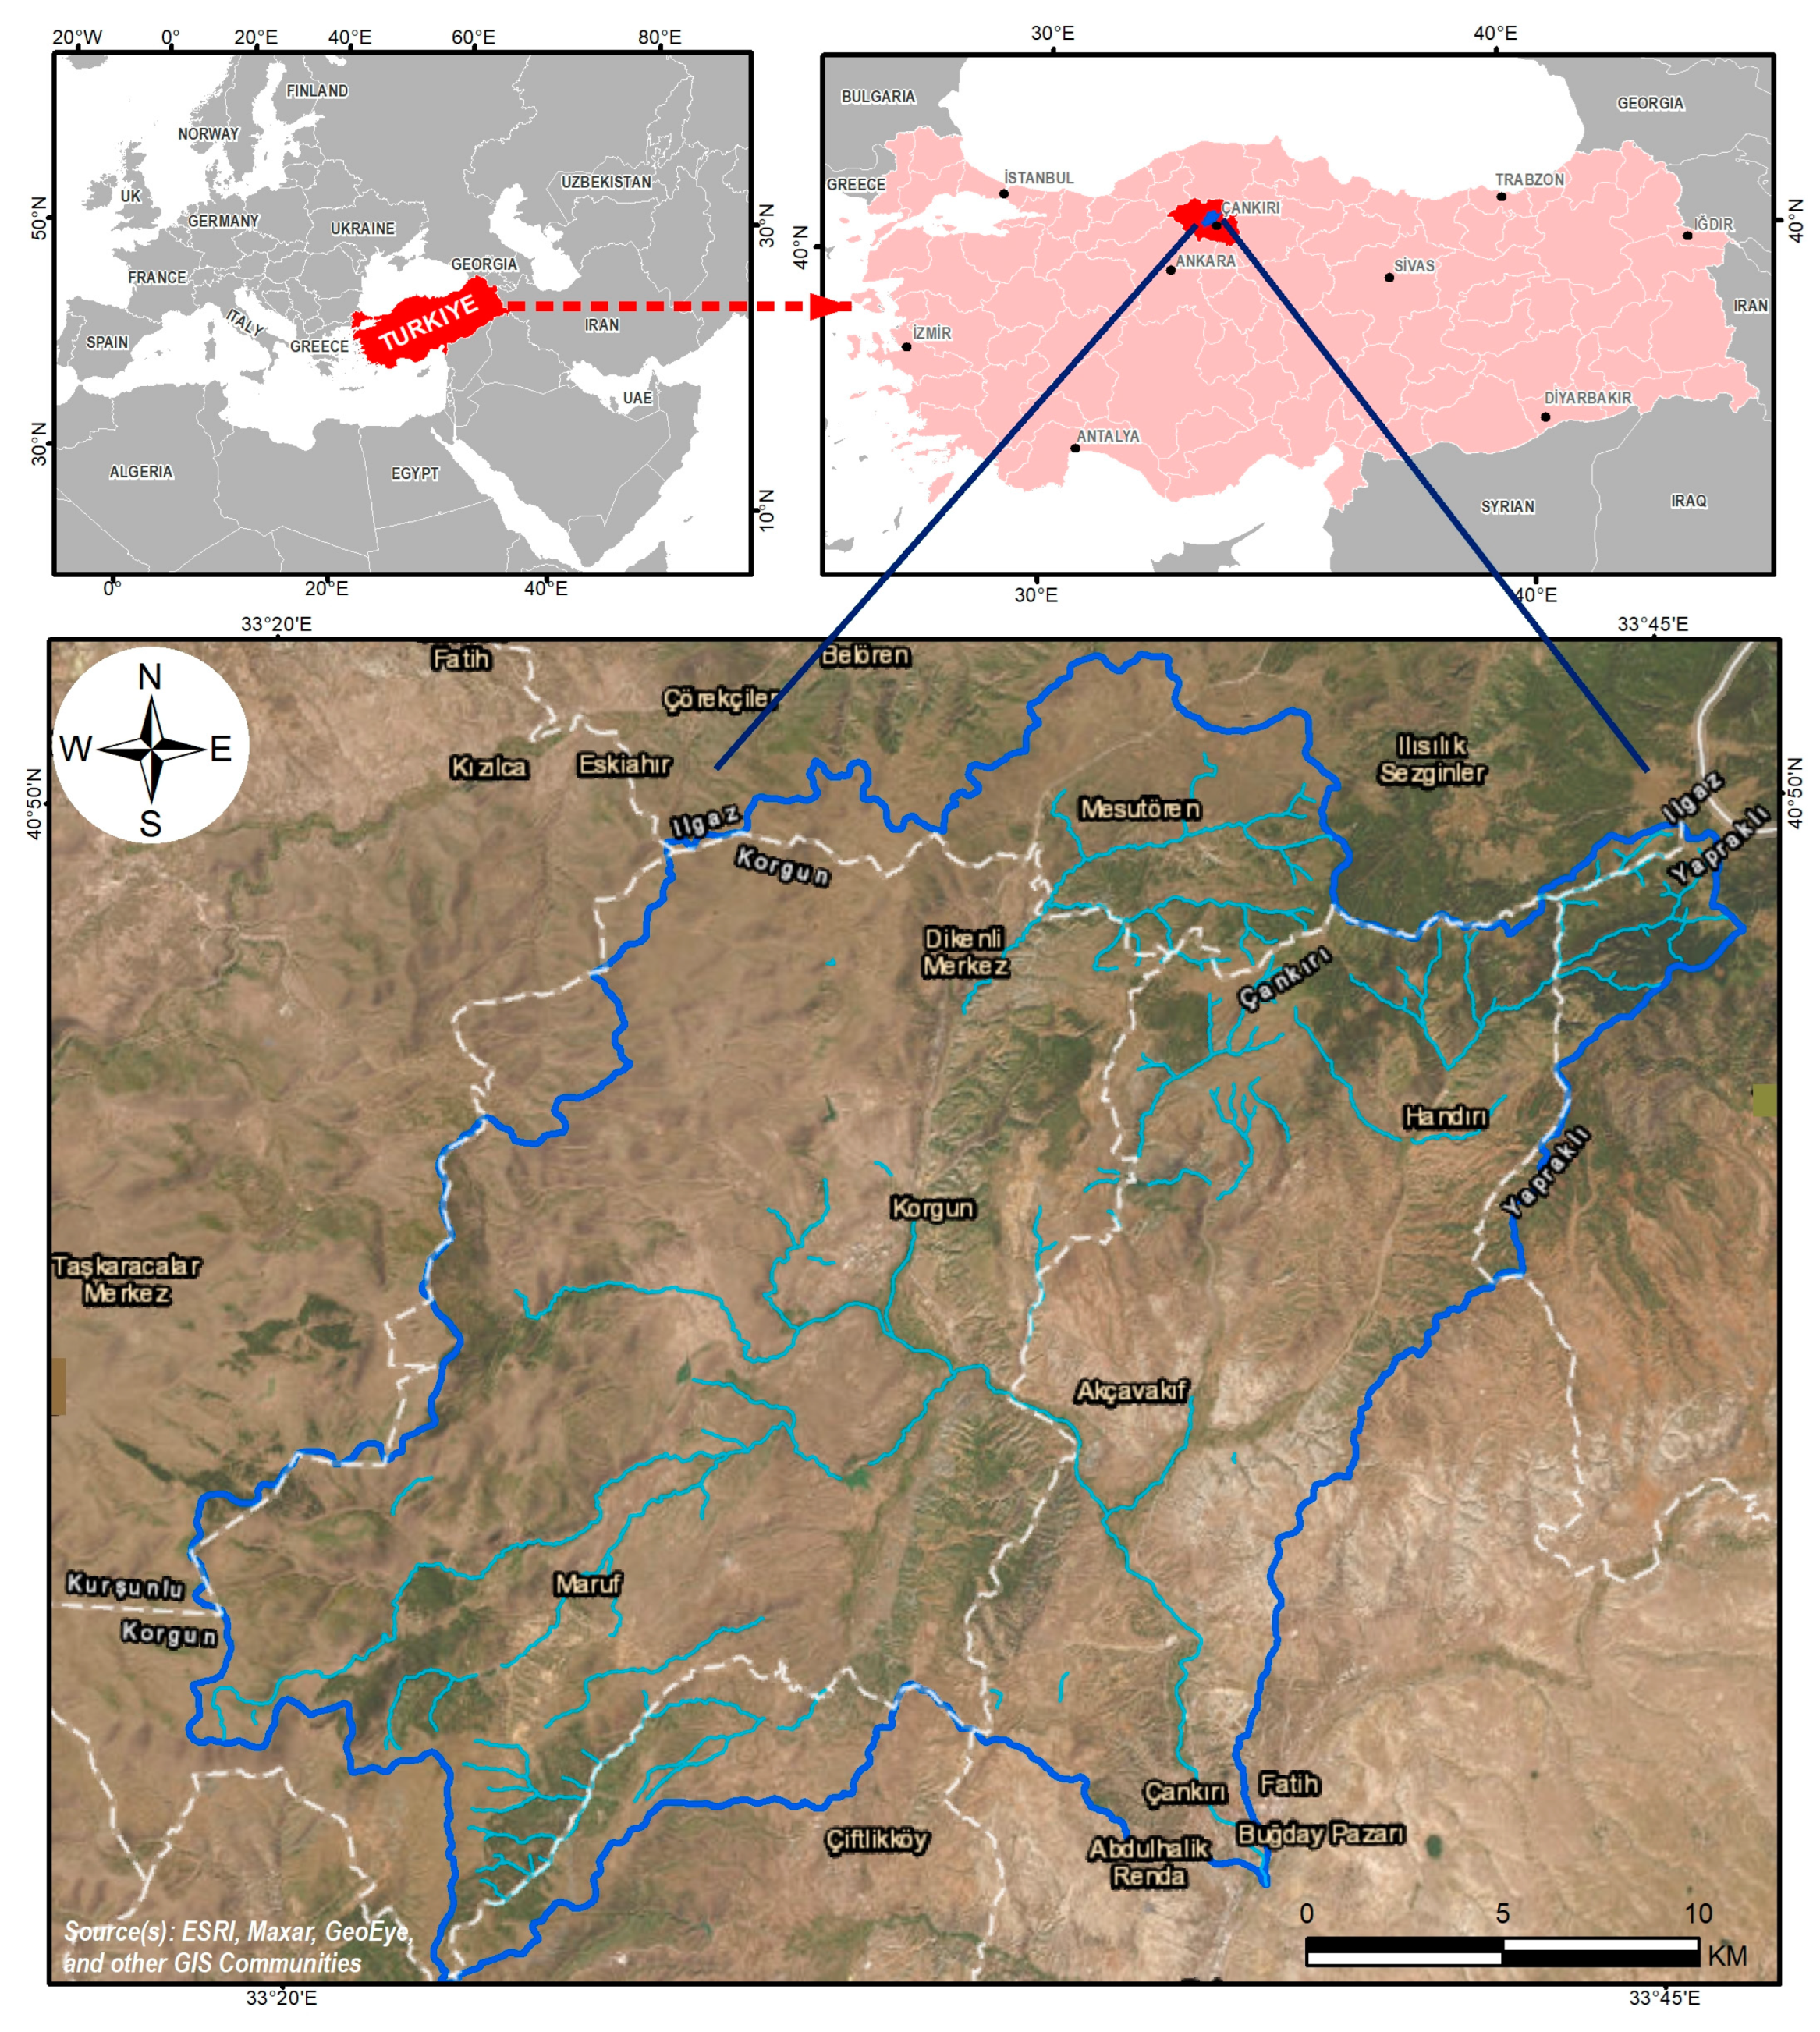
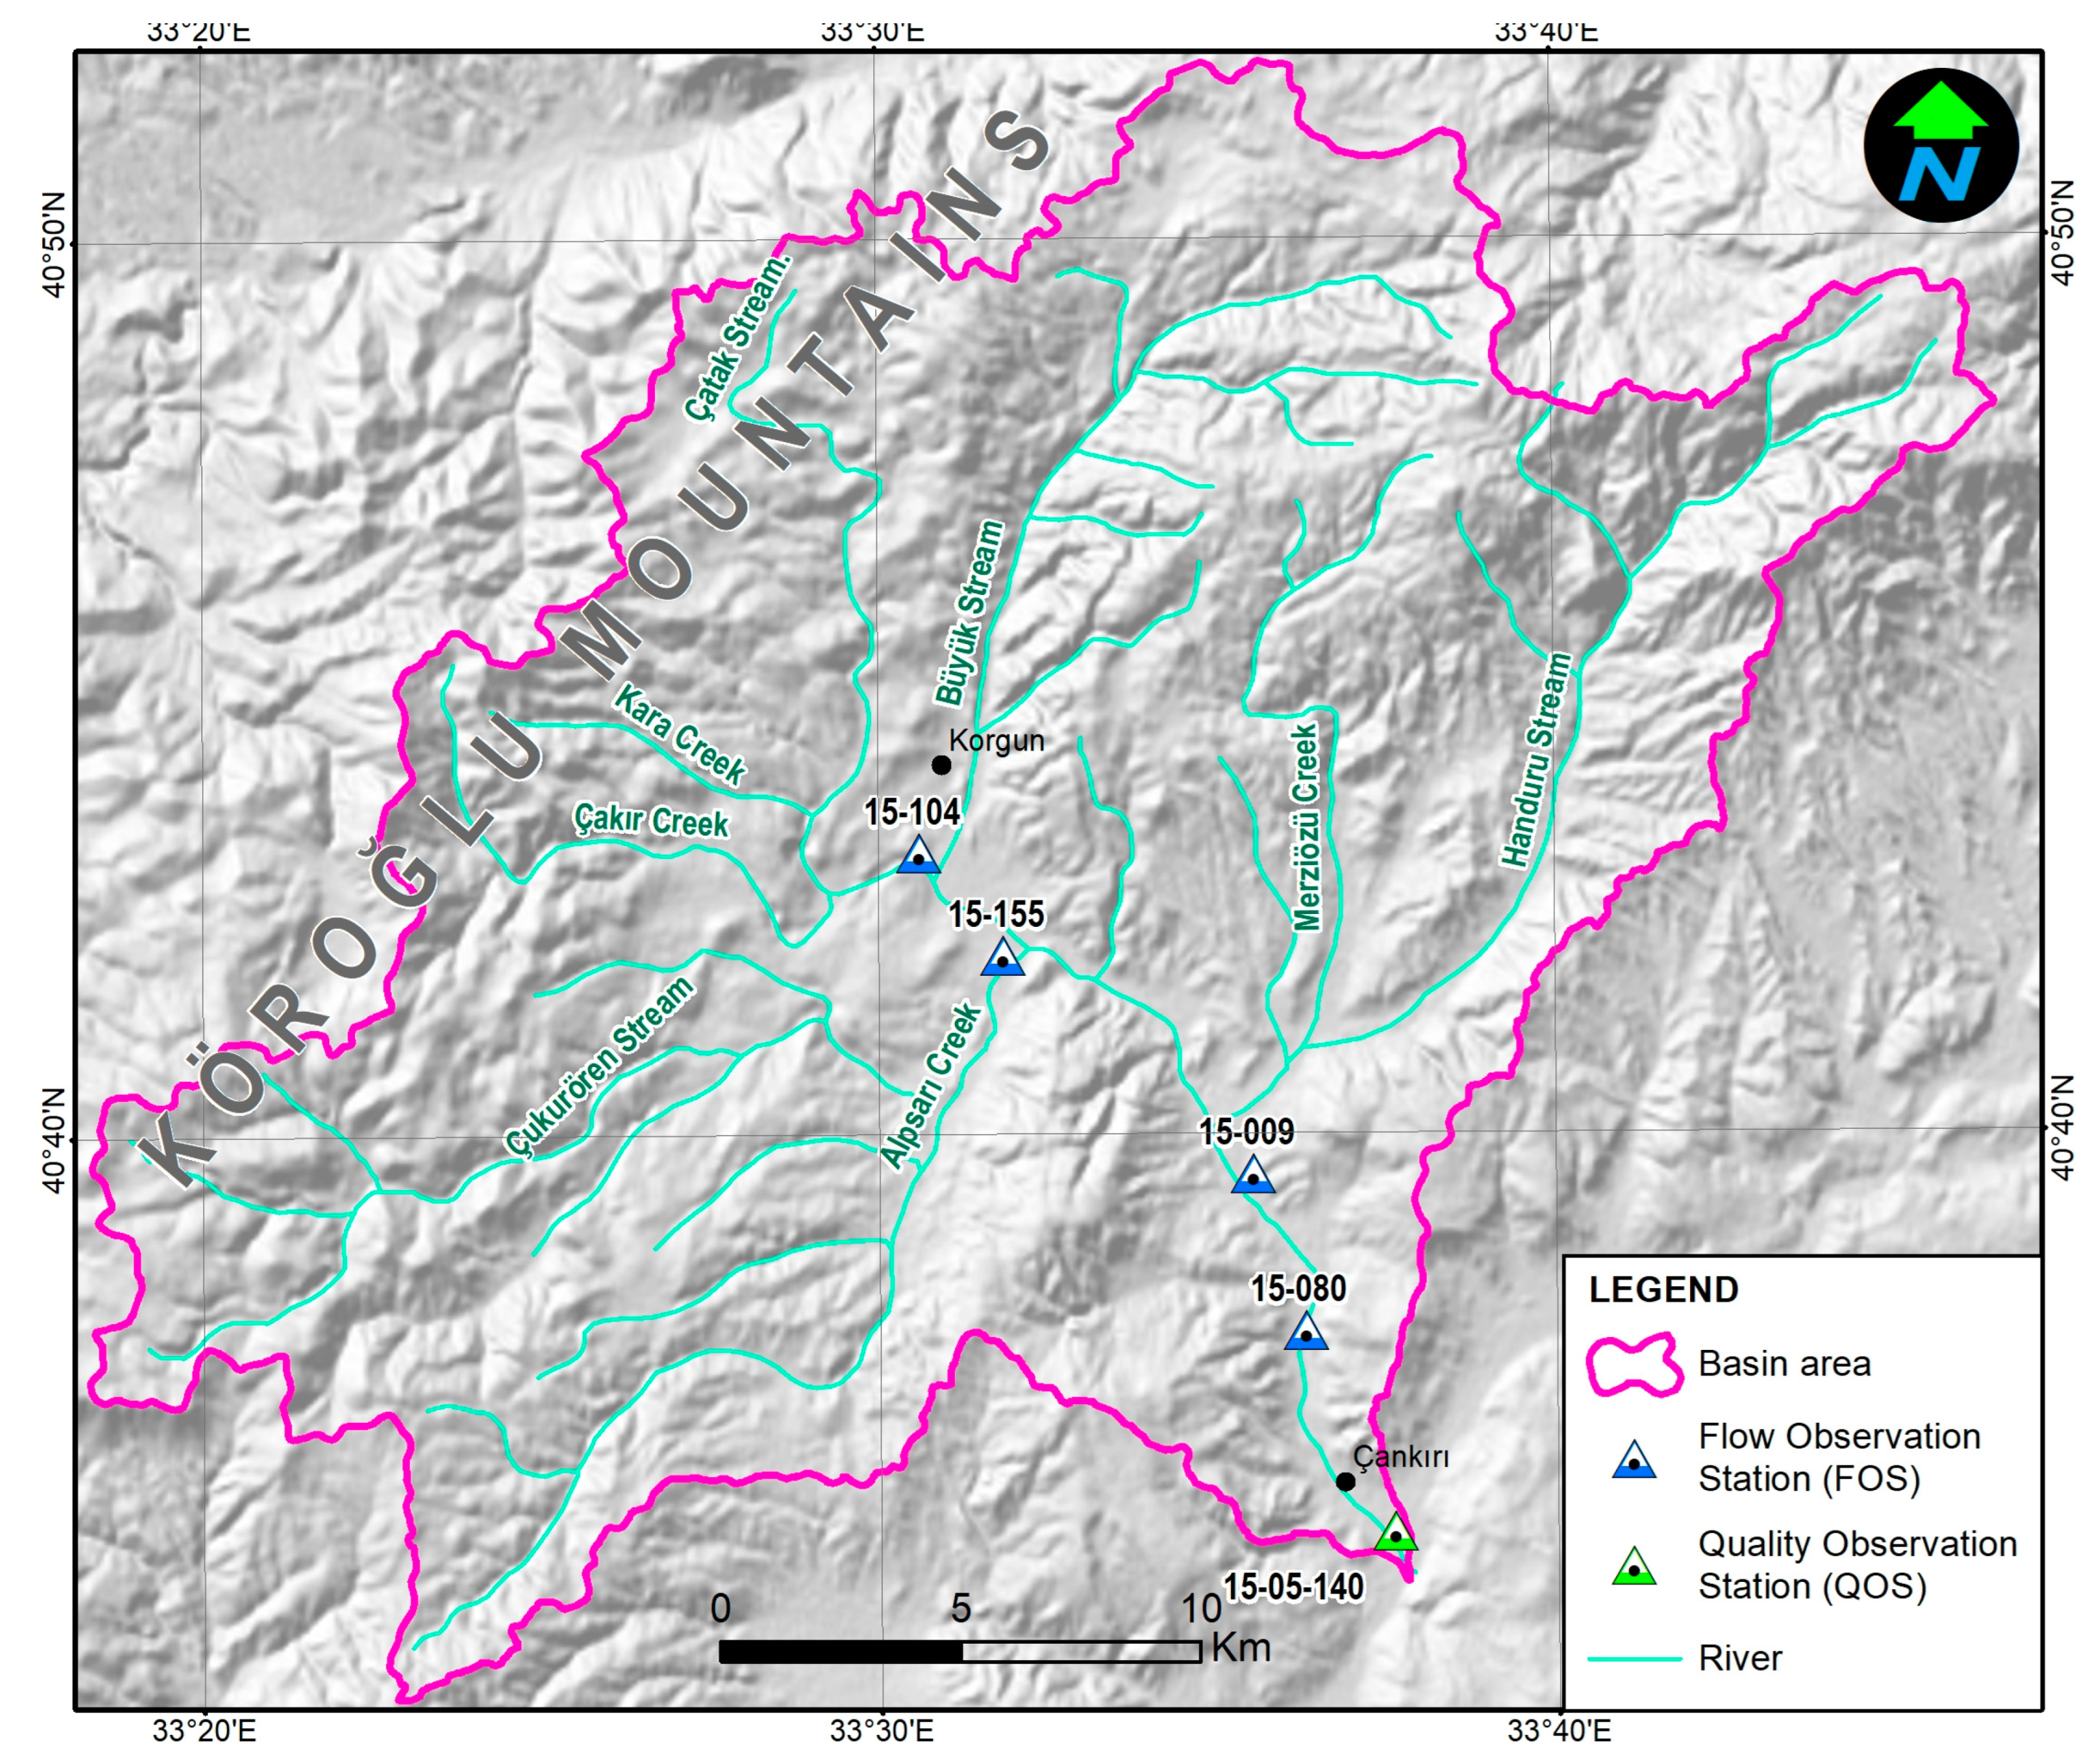
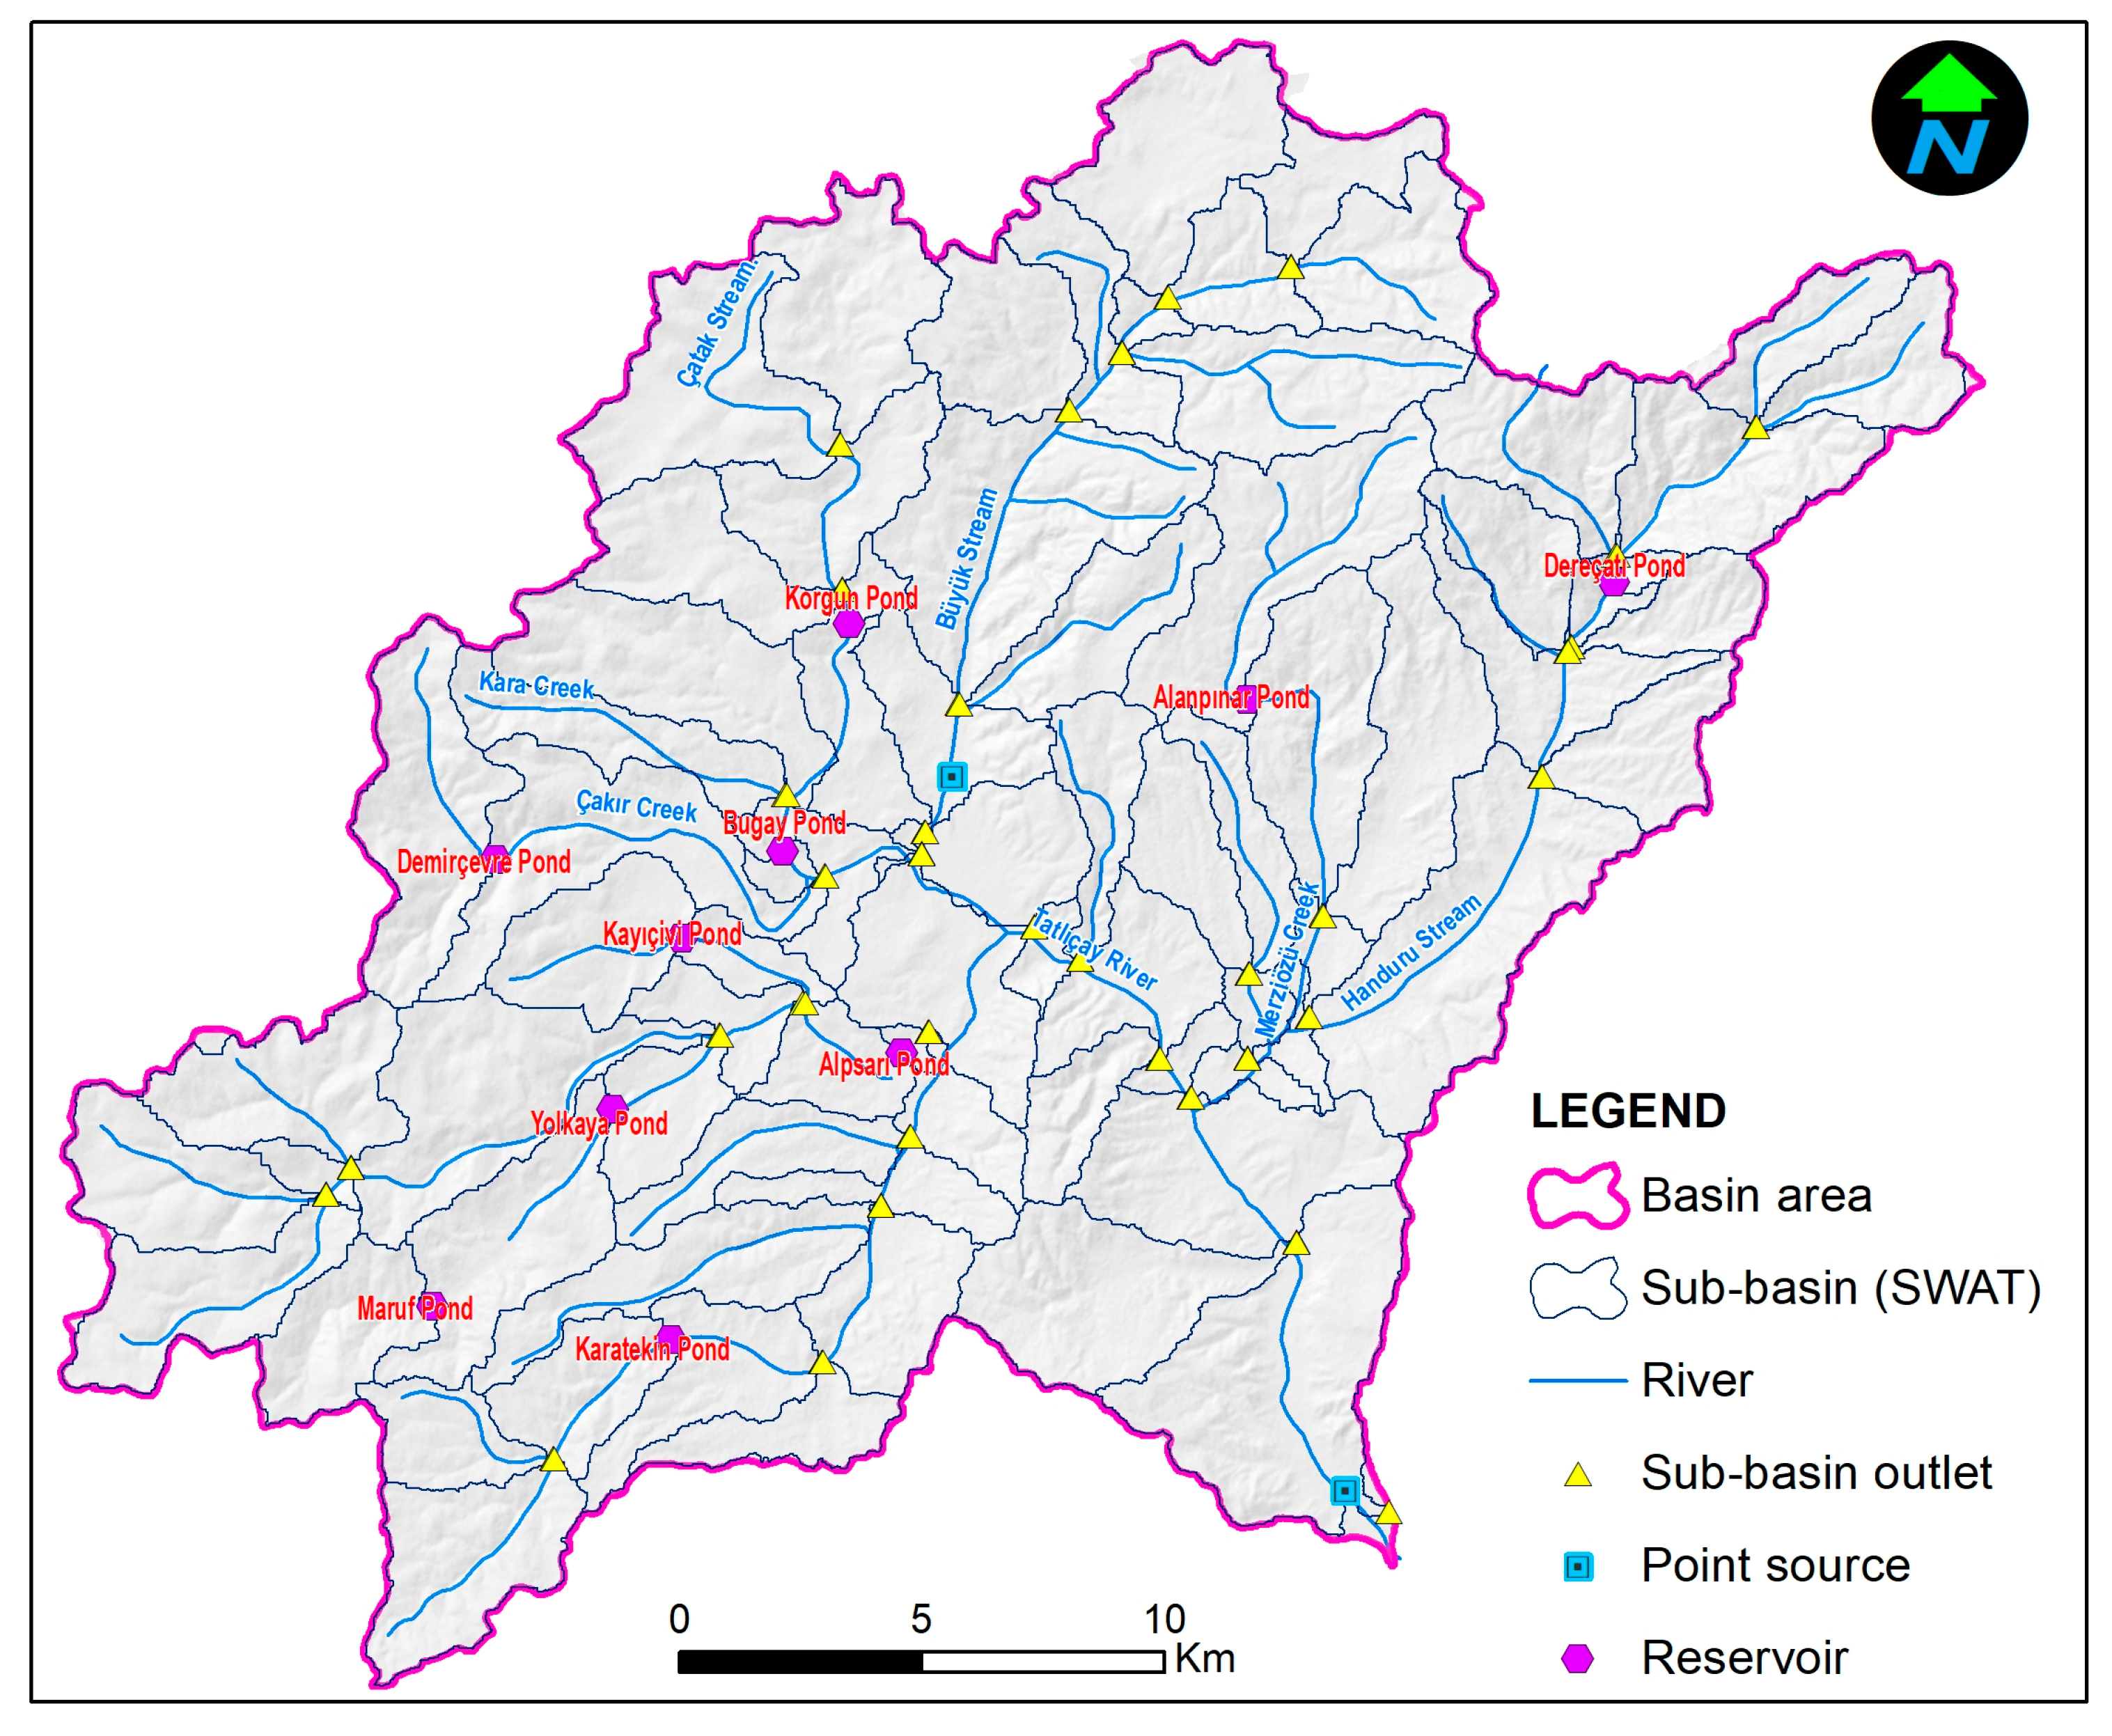
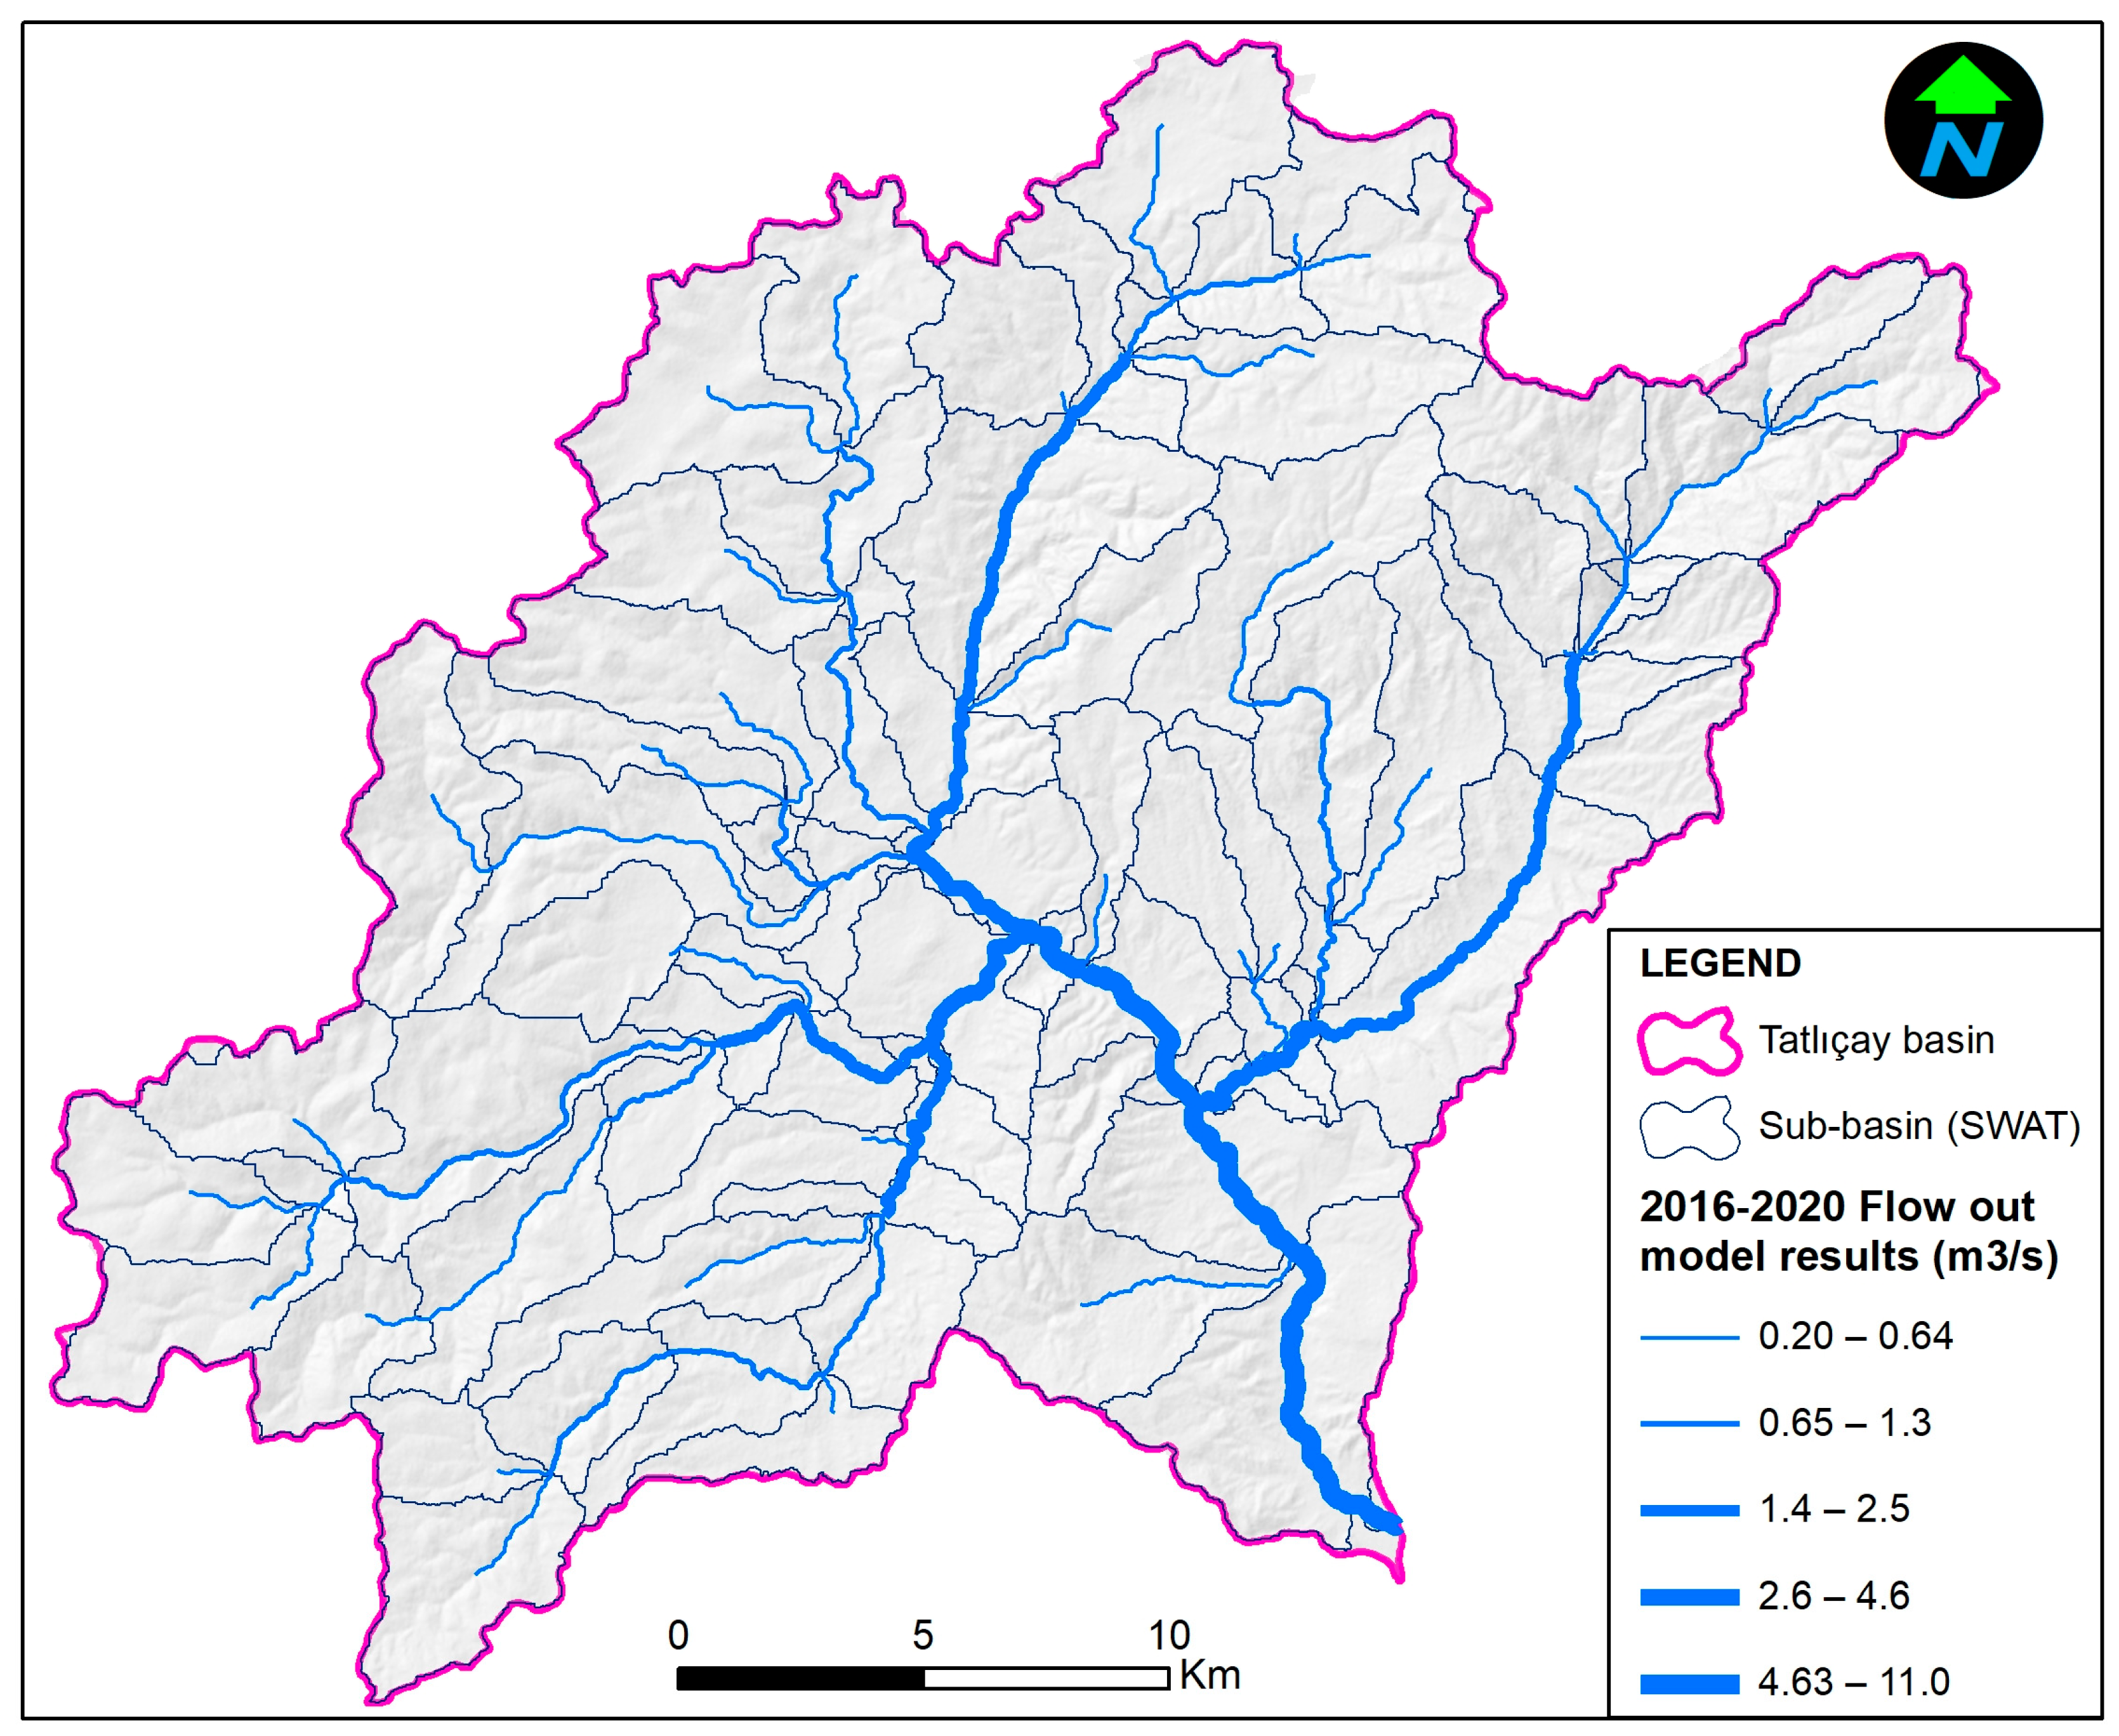
2.1. Study Area

The study area was the Tatlıçay Basin in the Central Anatolia region of Türkiye, within the Çankırı province. The dominant plant cover is Iranian–Anatolian steppe, and continental climate dominates (Figure 1). The study area represents a sub-basin of the Kızılırmak, one of the most important rivers in Türkiye.
The Tatlıçay river ecosystem, chosen for the SWAT model implementation, contains anthropogenic elements potentially affecting environmental health, such as agricultural practices and urban waste discharge. The collection of river water for gardening and agriculture and the creation of irrigation ponds within the basin lower the level of the Tatlıçay and deteriorate its water quality. Agricultural practices in the basin make large use of fertilizers and pesticides, which harm the Tatlıçay river ecosystem. Additionally, urban waste from densely populated areas in the Tatlıçay Basin is directly discharged into the river without prior treatment. All these factors negatively affect environmental health and degrade the water quality in the Tatlıçay river ecosystem. Direct irrigation from the river using polluted water then affects public health, through the consumption of the products grown in this area. Considering the pollution burden in the Tatlıçay Basin in Cankiri, the annual total nitrogen (TN) burden is 130 tons, while the annual total phosphorus (TP) burden is 17 tons.
There are no flow-monitoring stations that can perform current measurements on the Tatlıçay and its 674.2 km2 water collection basin (Figure 2).
However, Tatlıçay water quality station no. 15-05-140 operated by the General Directorate of State Hydraulic Works (DSI) measures 400 different parameters and is located at the outlet of the Tatlıçay Basin [25]. At this station, instantaneous flow values and quality parameters were measured in monthly or trimonthly periods from 2016 to 2020 [26].
It was found that the total nitrogen (TN) and total phosphorus (TP) loads recorded at the DSI quality monitoring station no. 15-05-140 in 2016–2019 in January, February, and March could negatively affect environmental health (Table 1 and Table 2).

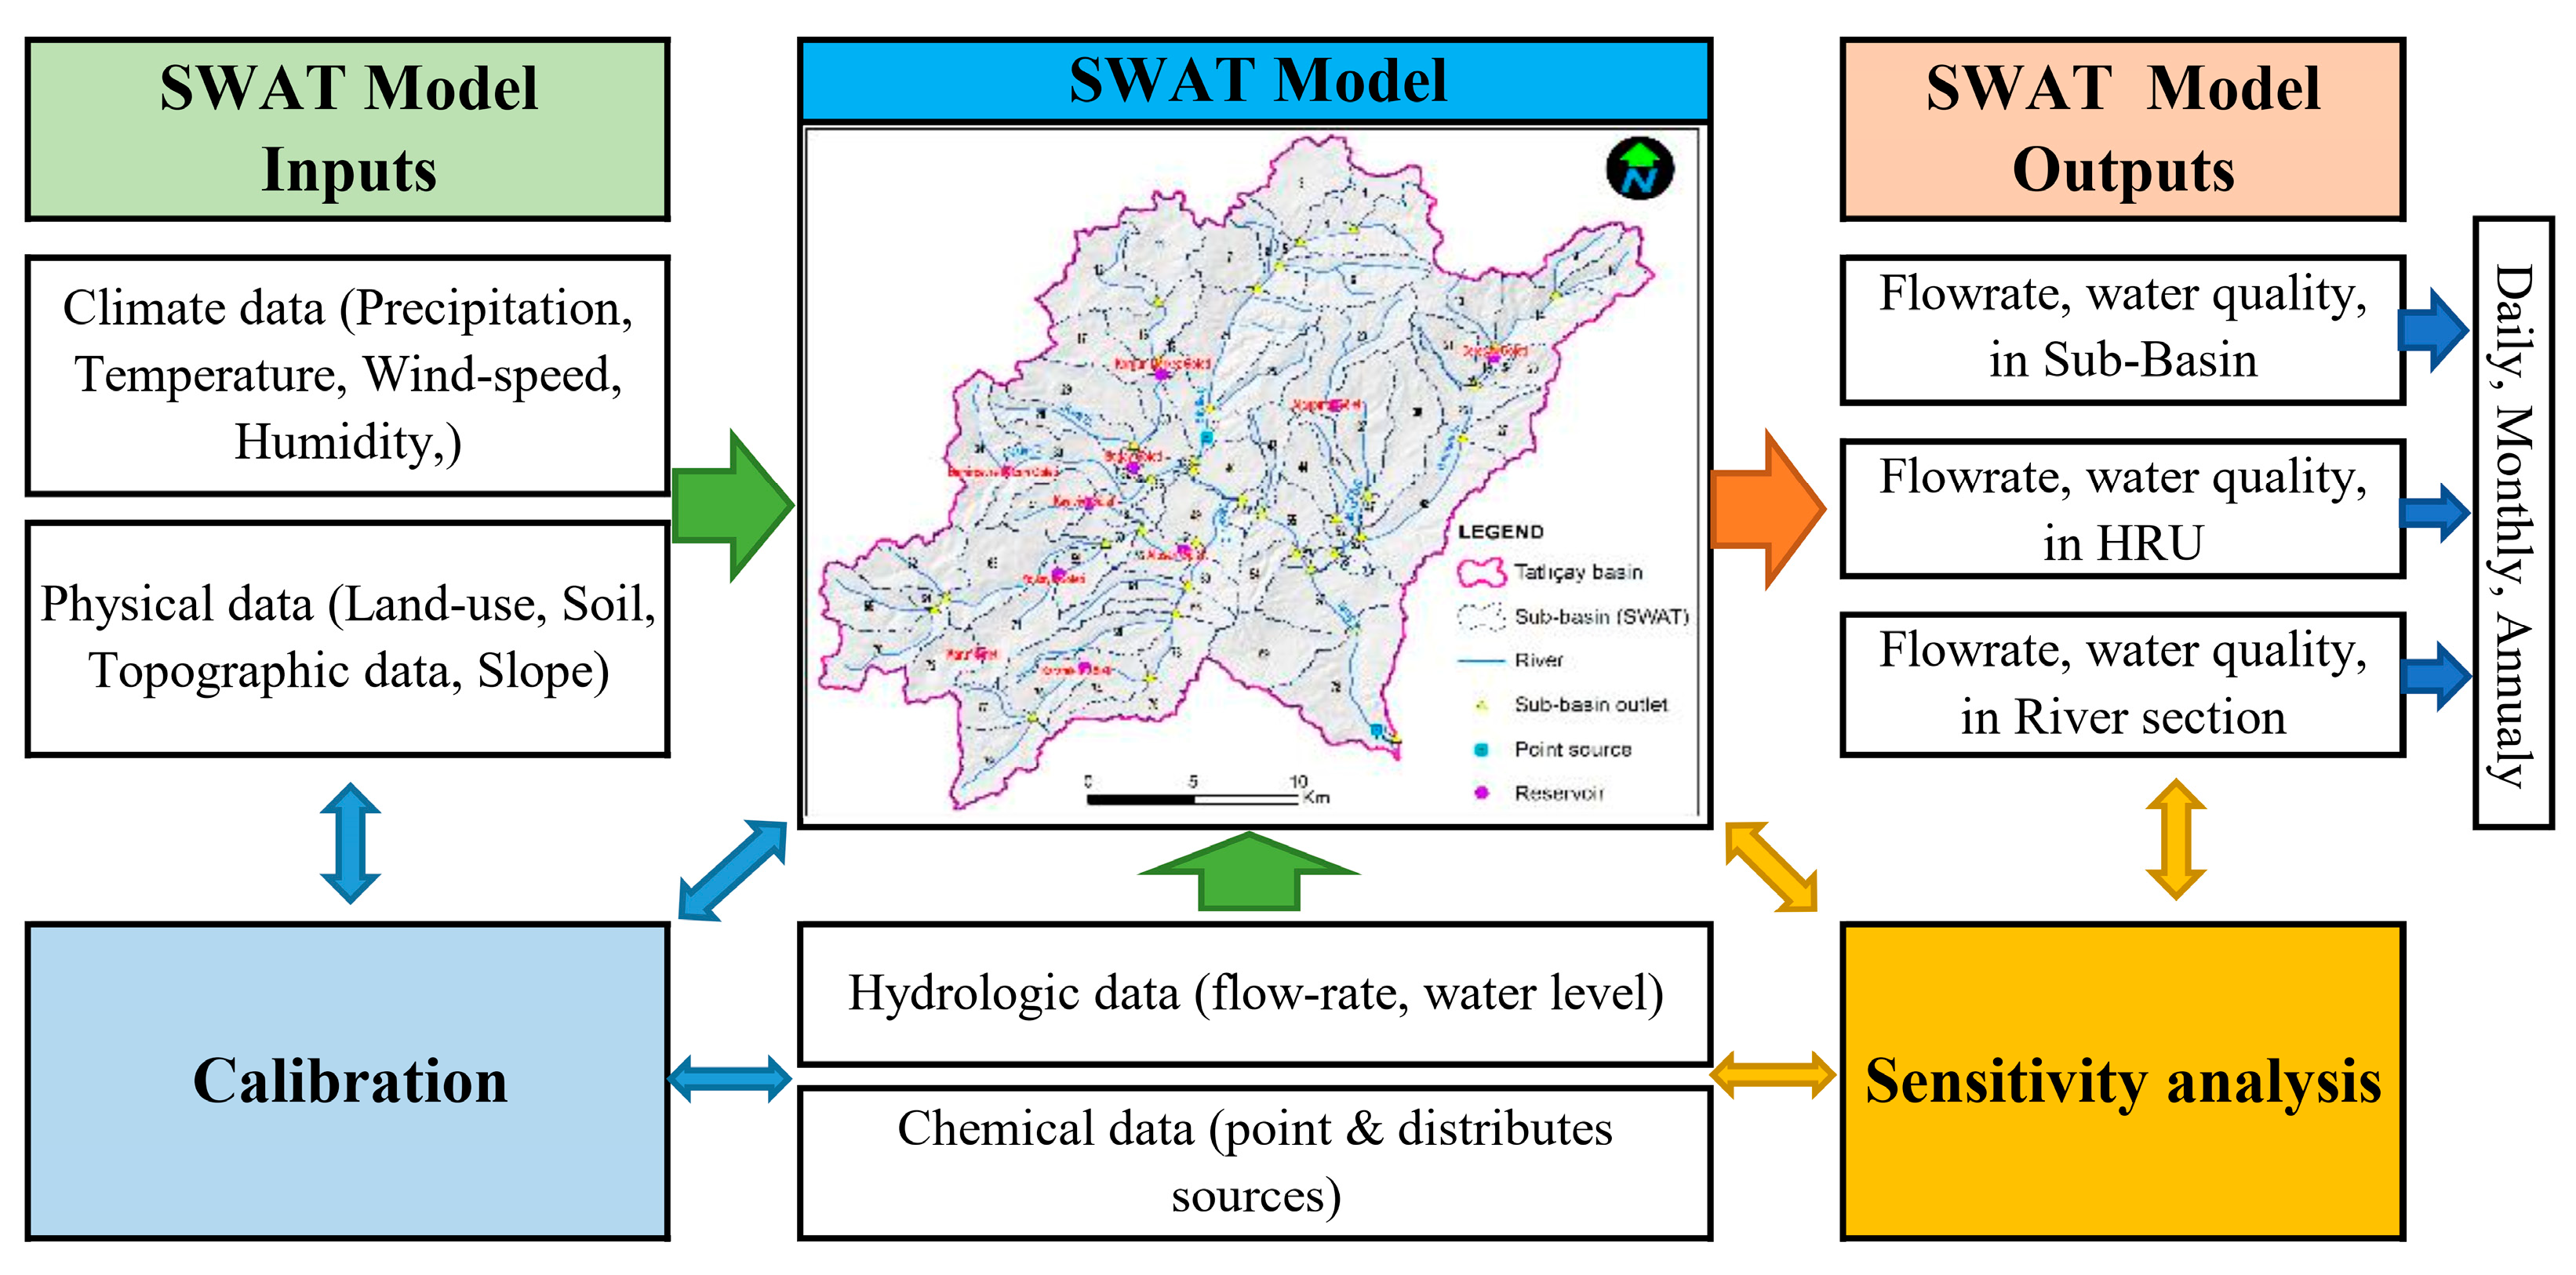
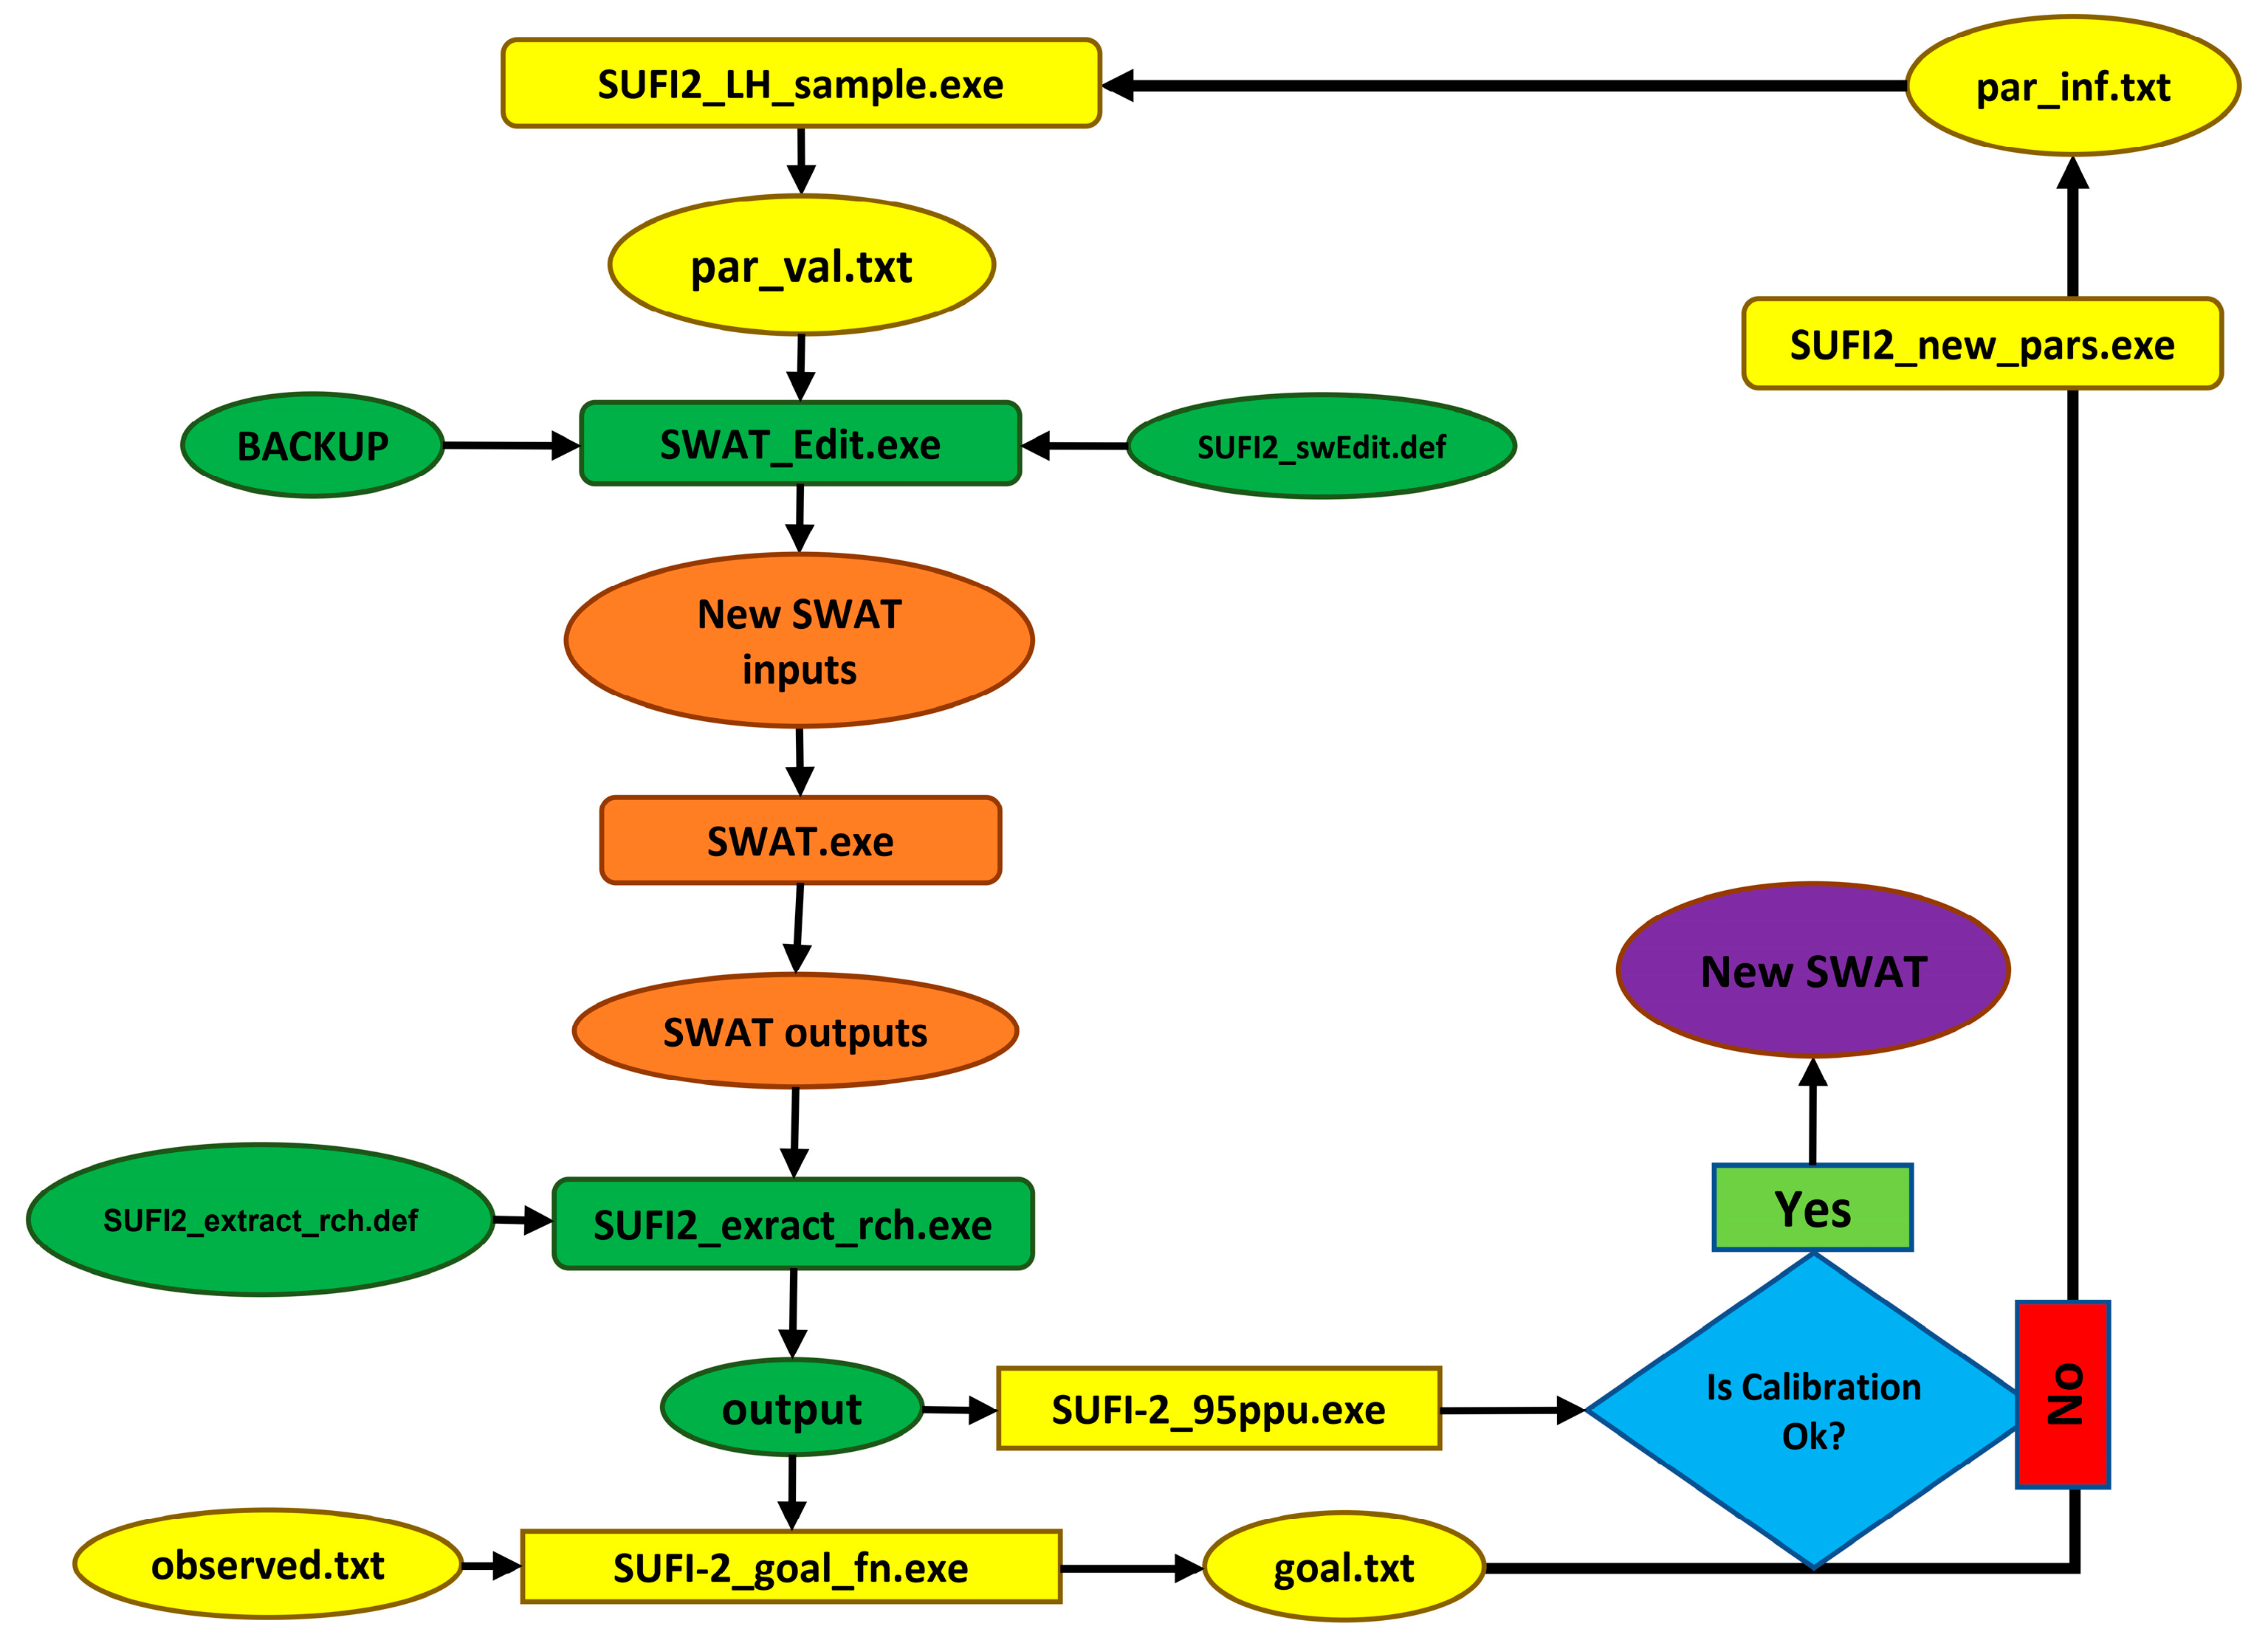
2.2. SWAT Model Application

SWAT is commonly used to assess land use, estimate the effects of land management applications and climate change on the environment, and assess erosion prevention and control, diffuse pollution control, and regional and watershed management. The software is frequently chosen for its rapidity, user-friendly interface, easily accessible data requirements, and GIS solution support [16]. Models created using the SWAT2012 interface for version 4.8.8 pay attention to basic hydrological principles such as the water cycle when assessing simultaneously climatic and physical conditions.
To create a model with SWAT, information about the digital elevation map of the study area, land use and soil properties maps, meteorological data (rainfall, temperature, relative humidity, solar radiation, and mean wind speed), management implementations in the basin, and ponds/reservoirs is necessary [27]. After these data are input, the SWAT model of the basin is divided into sub-basins, and then each sub-basin is divided into units characterized by homogenous land use/management, topographic features, and soil properties, which are called hydrologic response units (HRU) [28]. Later, the hydrological cycle is simulated on a daily basis using the following equation:
    S W t = S W 0 + Σ R d a y Q s u r f E a W s e e p Q g w
  • SWt: Final soil water content (mm)
  • SW0: Initial soil water content (mm)
  • Rday: Amount of precipitation (mm)
  • Qsurf: Amount of runoff (mm)
  • Ea: Evapotranspiration amount (mm)
  • Wseep: Amount of water passing through the vadose zone (mm)
  • Qgw: Return flow amount (mm)
After accurately defining the operation of the hydrological system in the modelled basin, negative factors acting on the system are identified, and the status of pollution in the area can be modelled [29].
During the natural water cycle, there are natural and anthropogenic-derived factors affecting the water quality. In addition to natural events such as climate change, floods, storms, and earthquakes, anthropogenic factors significantly affect water quality [1]. Structures such as dams and ponds change the natural flow of water and the climatic features of the environment, while inappropriate agricultural methods, excess carbon release, unplanned urbanization, and industrialization, changes in plant patterns, leaching from waste storage sites, and urban discharge cause water pollution. The nutrient cycle is linked to chemical conversions involving nitrogen and phosphorus compounds in the soil. It is possible to model the whole nutrient cycle for nitrogen and phosphorus using the SWAT model. The nitrogen cycle is a dynamic system involving water, air, and soil. Plants require more nitrogen than other basic elements, apart from carbon, oxygen, and hydrogen. The levels of nitrogen and phosphorus can be modelled in the soil profile and shallow aquifers by SWAT [16].
The Tatlıçay SWAT model was completed using the ArcSWAT Version 2012 developed by Texas A&M University (TAMU) operating on ArcGIS 10.5 (Figure 3).

2.3. Model Setup

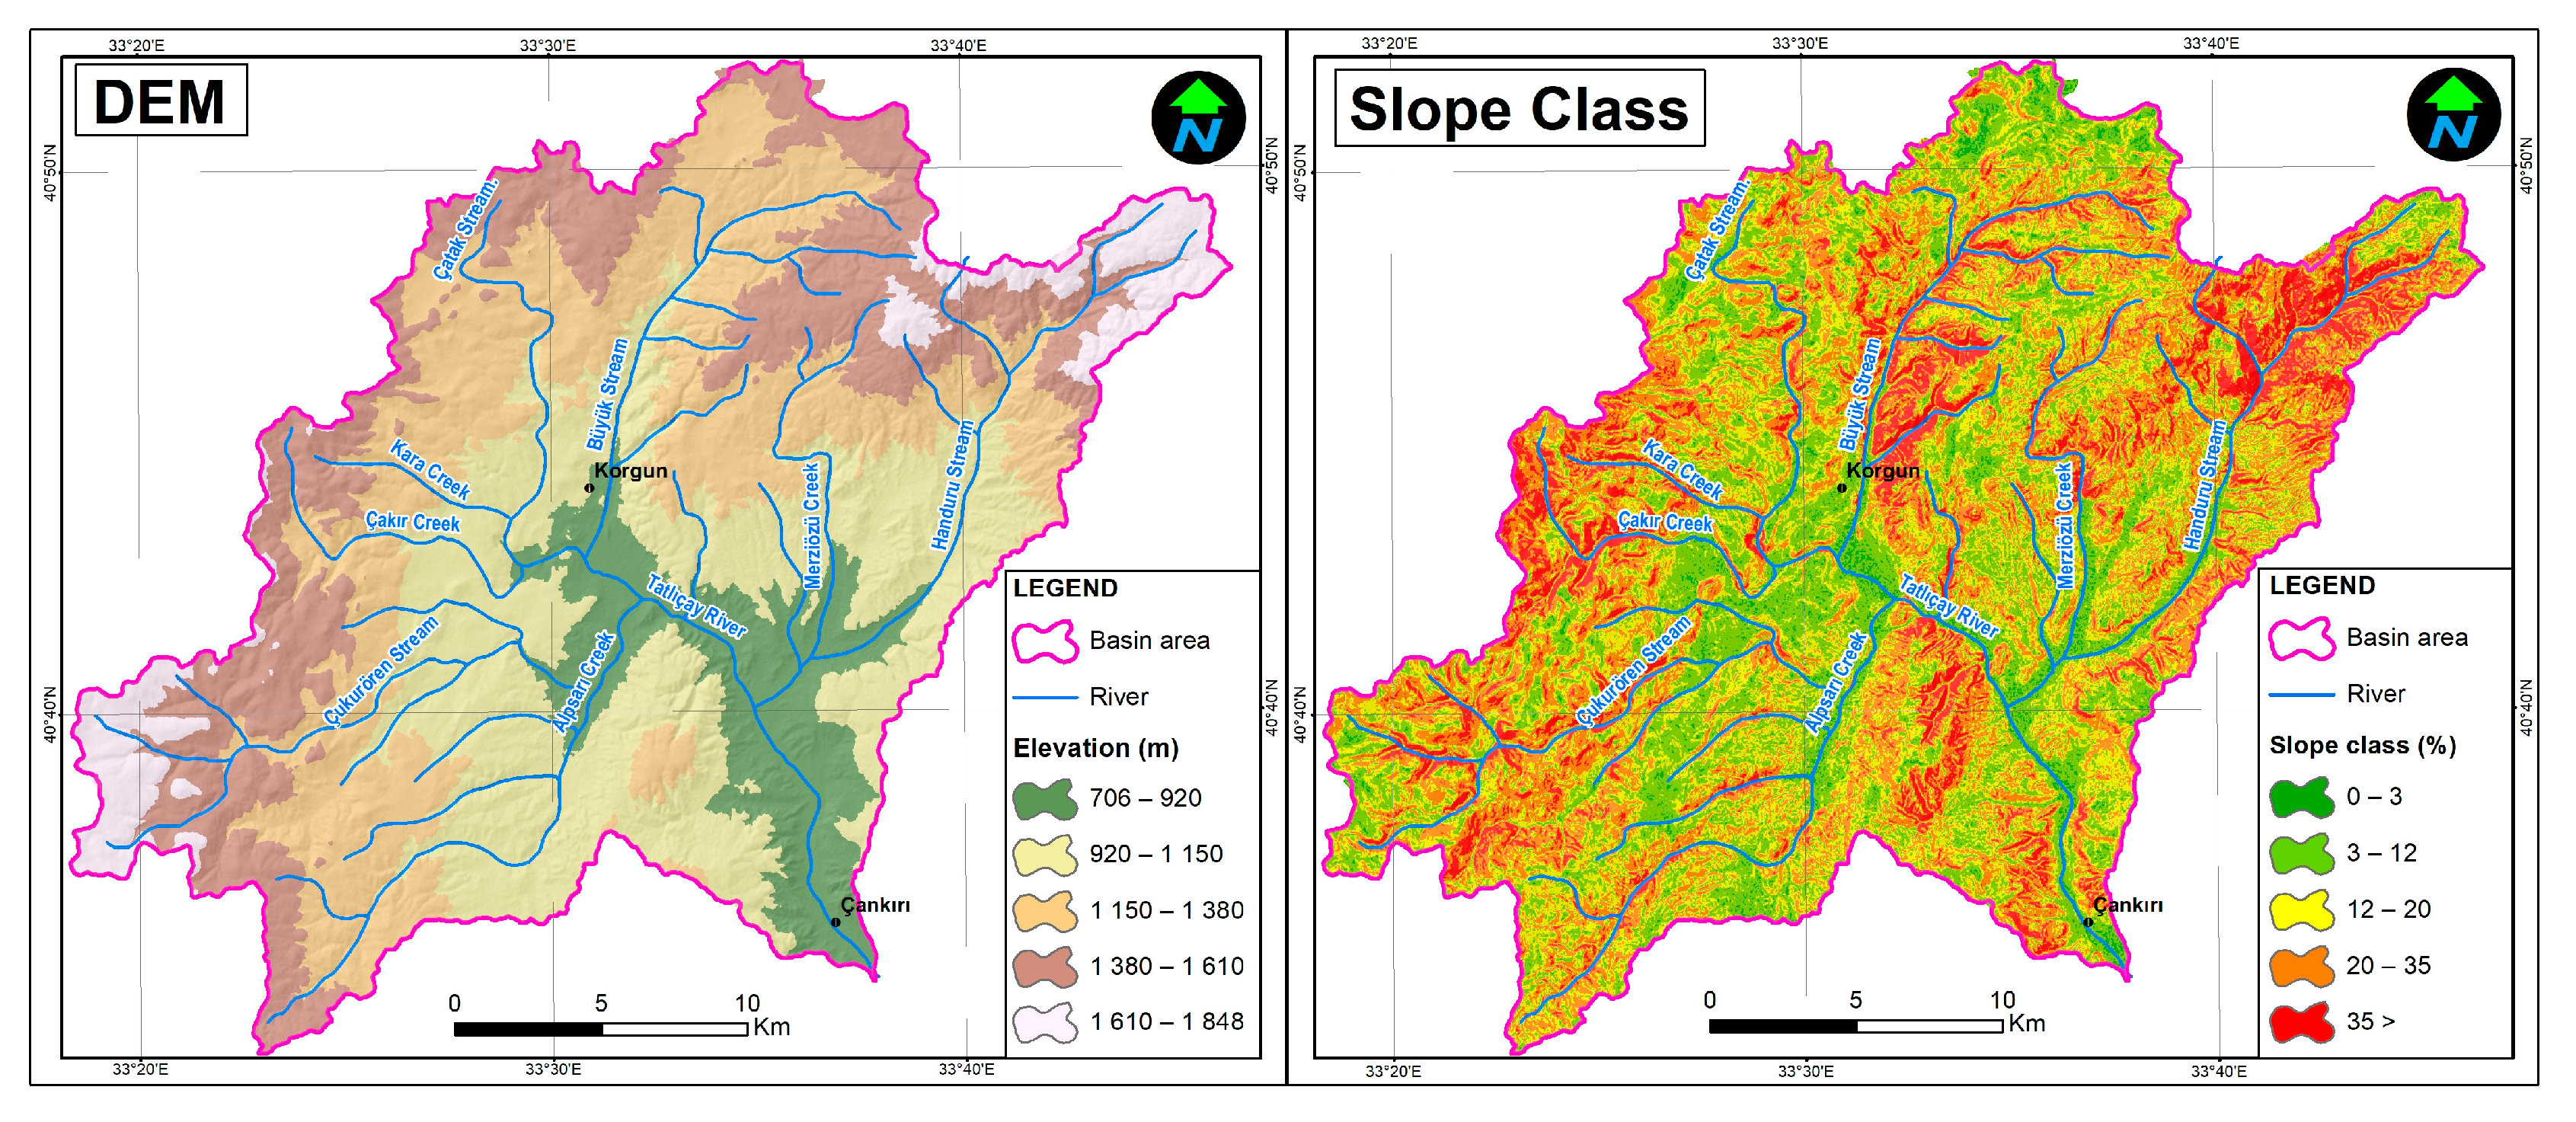
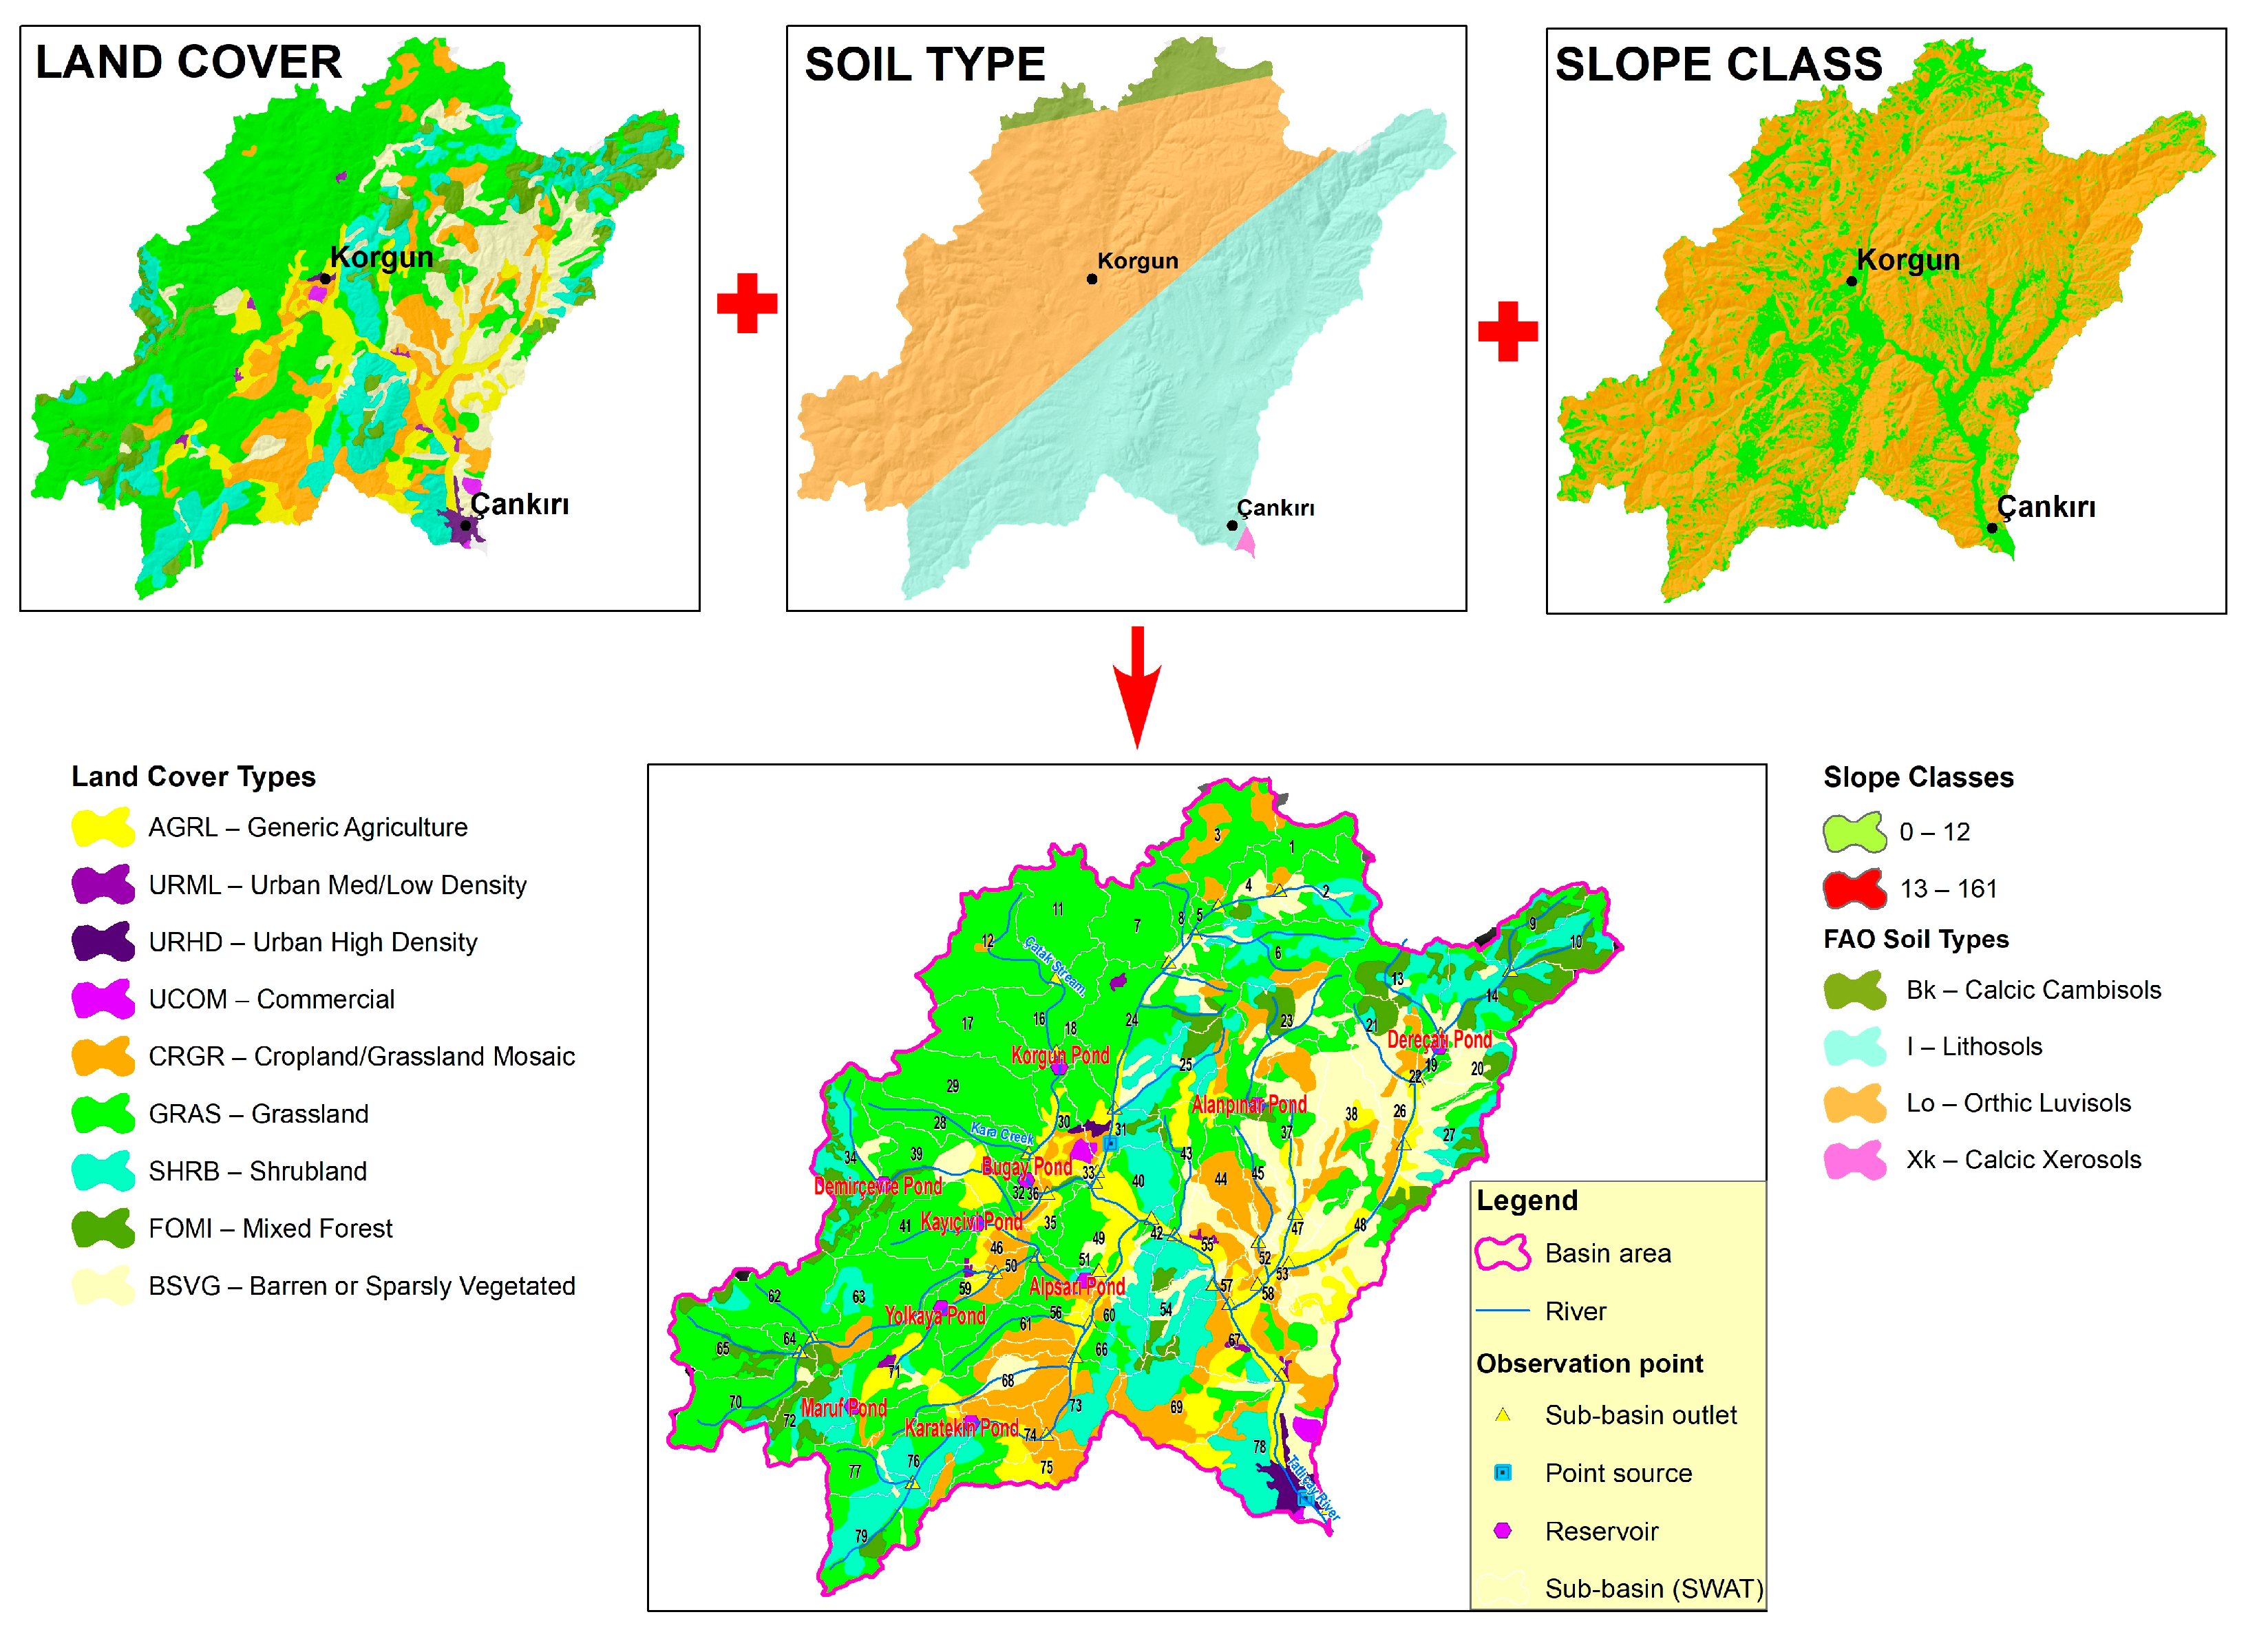
2.3.1. Data Definition

The data from the Tatlıçay river ecosystem and their corresponding sources reported in Table 3 were uploaded in the SWAT model.
The slope classes described under the geographical structure heading were reclassified for the SWAT model HRU definition. The basin was divided into two portions, with areas having less than 12% slope defined as “flat/sloping” and areas with a slope greater than 12% defined as “steep”. The CORINE data of Tatlıçay Basin were transformed into SWAT land use classes and defined in the model taking into account the existing land uses. The data regarding the physical and chemical soil properties, obtained from FAO/UNESCO, were rearranged for the SWAT Model using Harmonized World Soil Database (HWSD) data. Daily precipitation (mm), temperature (max/min, °C), relative humidity (%), wind speed (m/s), insolation (MJ/m2), and evapotranspiration (mm) data recorded from 2013 to 2020 at the meteorology station present in the basin were input as climatic parameters. In addition, pond areas, point source pollution loads, and basin features were defined. The parameters characterizing the pond areas, including hydrological data, flow (m3), etc., acquired from the Kızılırmak Basin Master Plan (General Directorate of State Hydraulic Works (DSI), 2019), were entered into the model. In the calculation of the pollution loads (TN, TP), address-based population data and per capita pollution load values obtained from the Turkish Statistical Institute were used [32,33].

2.3.2. Watershed Delineations

For the digital elevation model of the study area, 30 m resolution SRTM data from Reference [34] were used. The elevation in the Tatlıçay Basin varies from 706 m to 1848 m. Çankırı city is located at the lowest elevation in the basin (Figure 4).
CORINE data prepared by the European Environment Agency (EAA) in 2018 were used to classify land cover and use in the Tatlıçay Basin [35].
For the Tatlıçay SWAT model, the basin division tool was used with Digital Elevation Model (DEM) data in the ArcSWAT interface when separating the basin areas. The basin was divided into 79 sub-basins, each with a 500 ha area. Two pollutant discharge points in the Korgun and Çankırı settlements and 10 current and planned ponds were defined in the model of the basin (Figure 5).

2.3.3. HRU Definition

For the Tatlıçay SWAT model, a total of 269 HRU were defined paying attention to land use, slope, soil structure, and spatial distribution [28]. The criteria used to define the HRU and the flow scheme are reported in Figure 6.

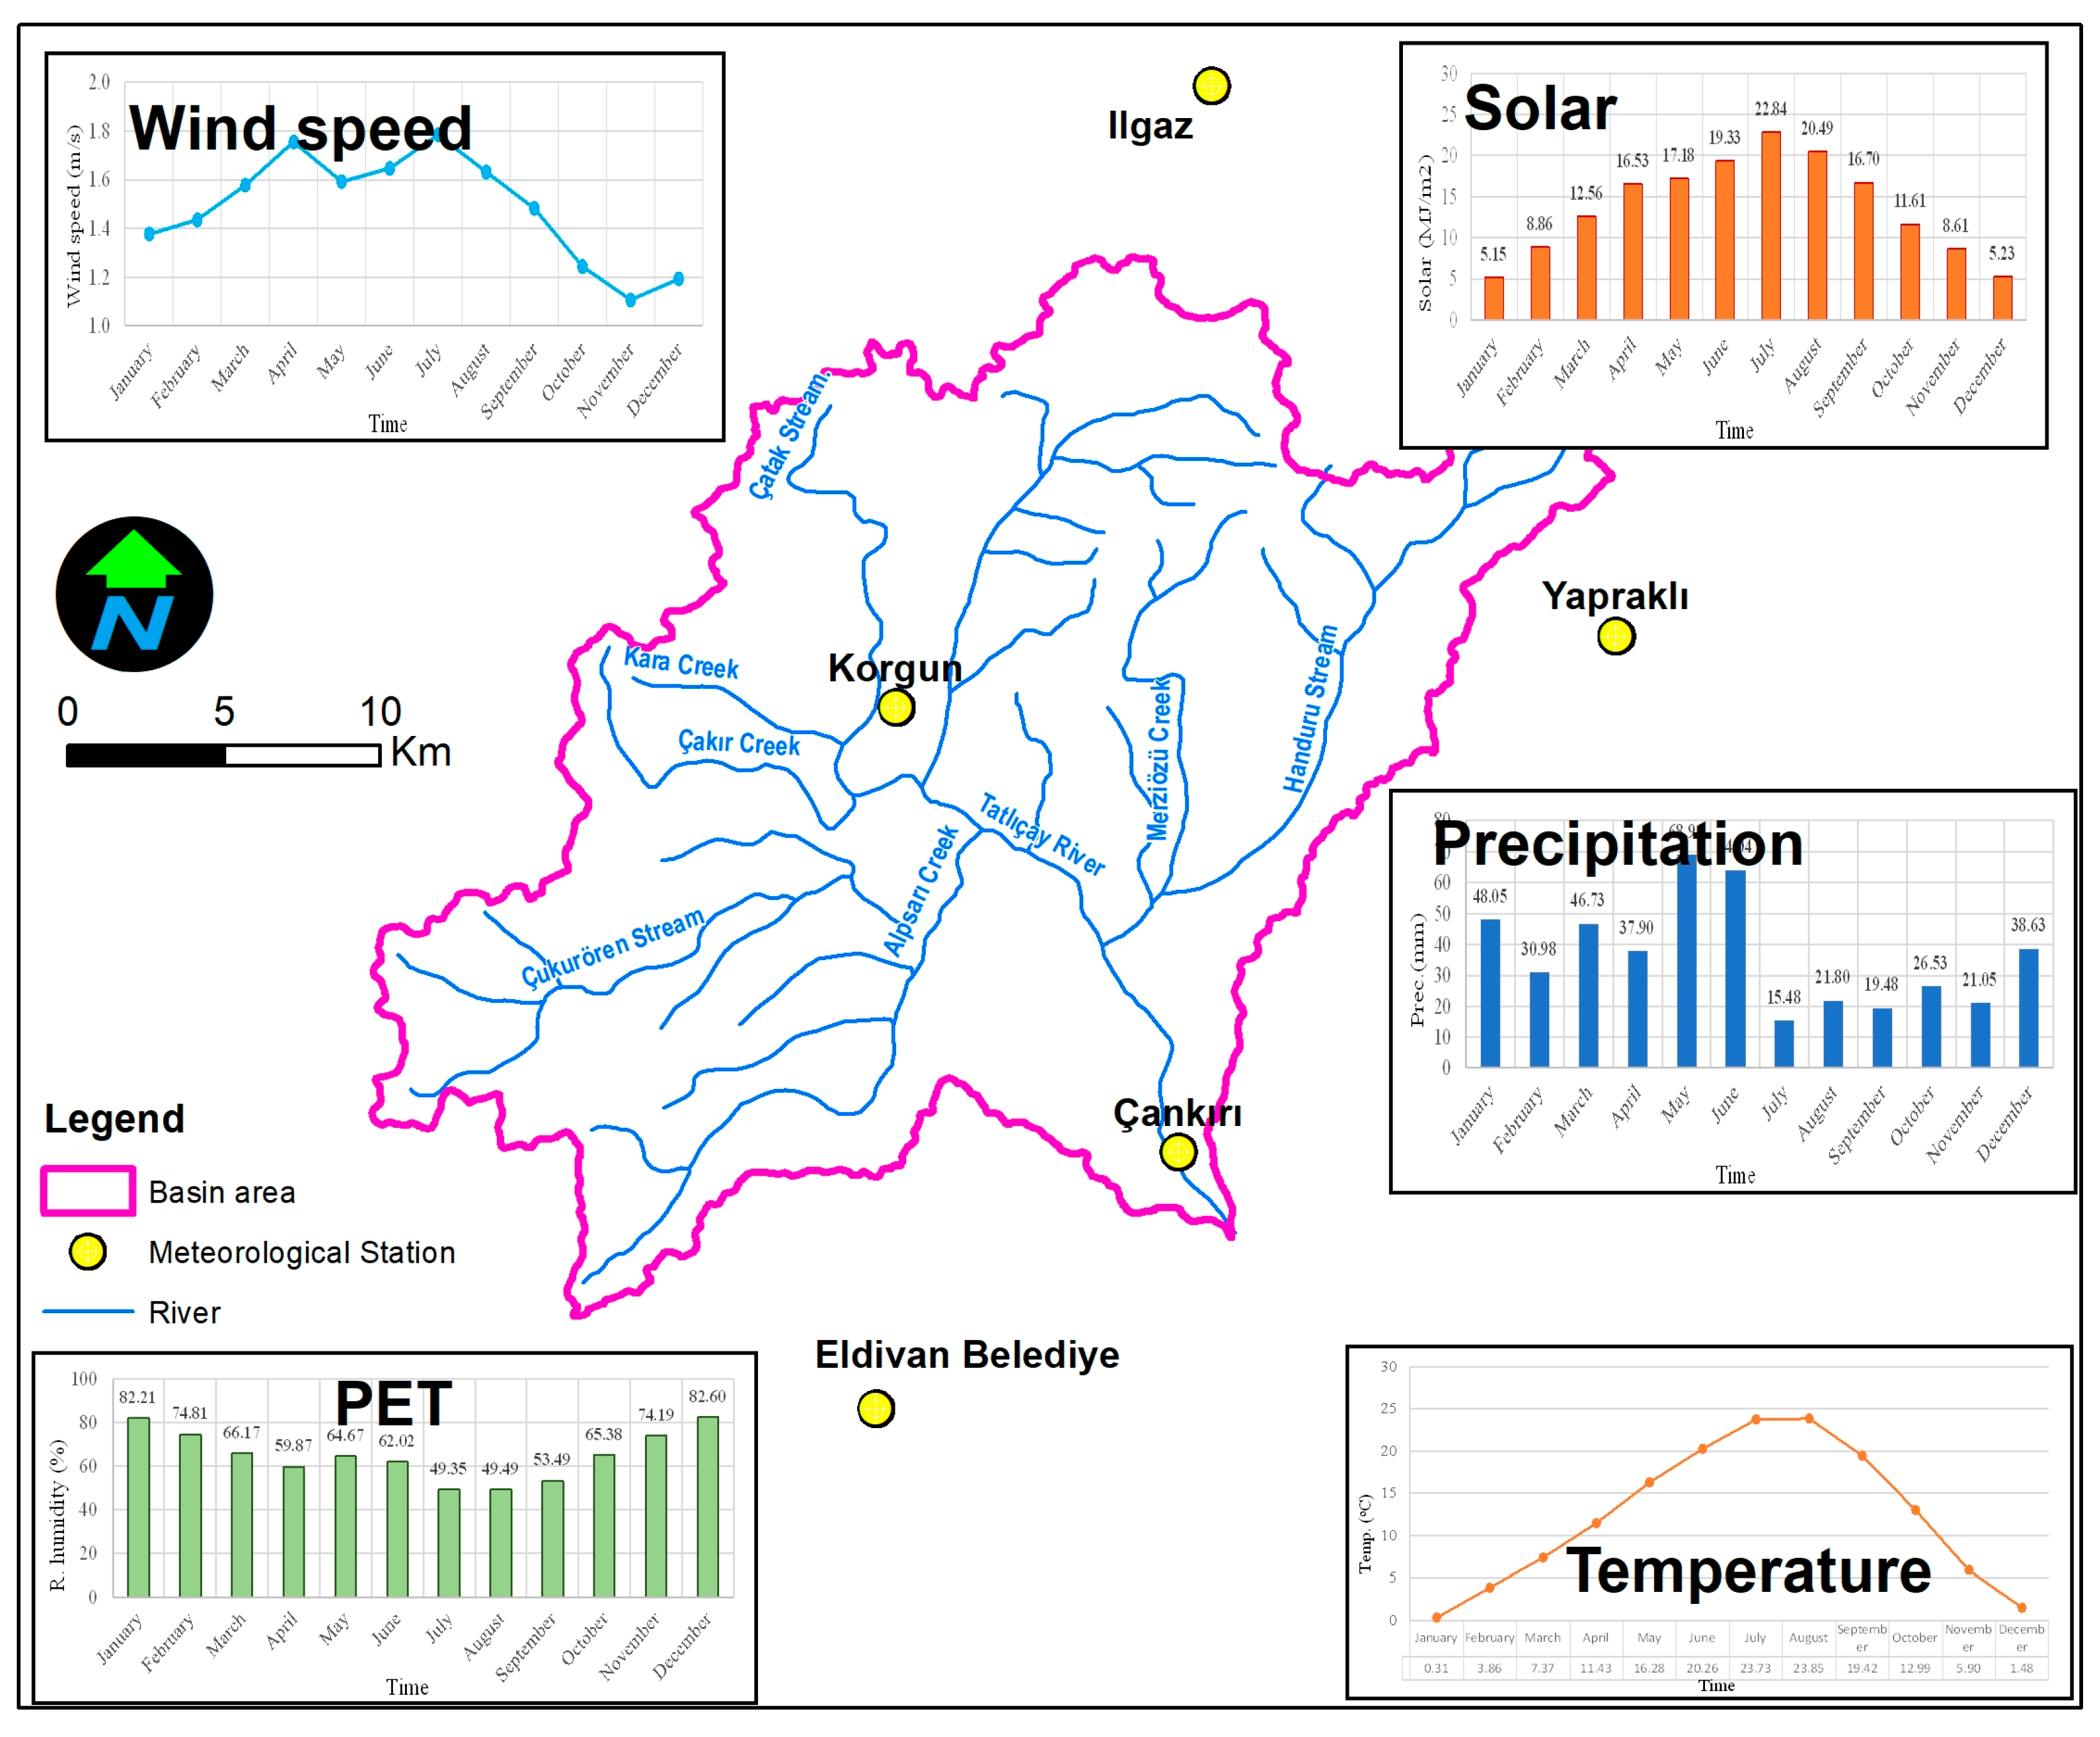
2.4. Climatic Parameters

In this study, the climatic parameter inputs for the SWAT model were obtained from the meteorology station no. 17080 in the Çankırı provincial center, representing the basin. The hydrometeorological features used included daily rainfall (mm), temperature (max/min °C), relative humidity (%), wind speed (m/s), solar radiation (MJ/m2), and evapotranspiration (mm) for the years from 2013 to 2020 (Figure 7).

3. Results

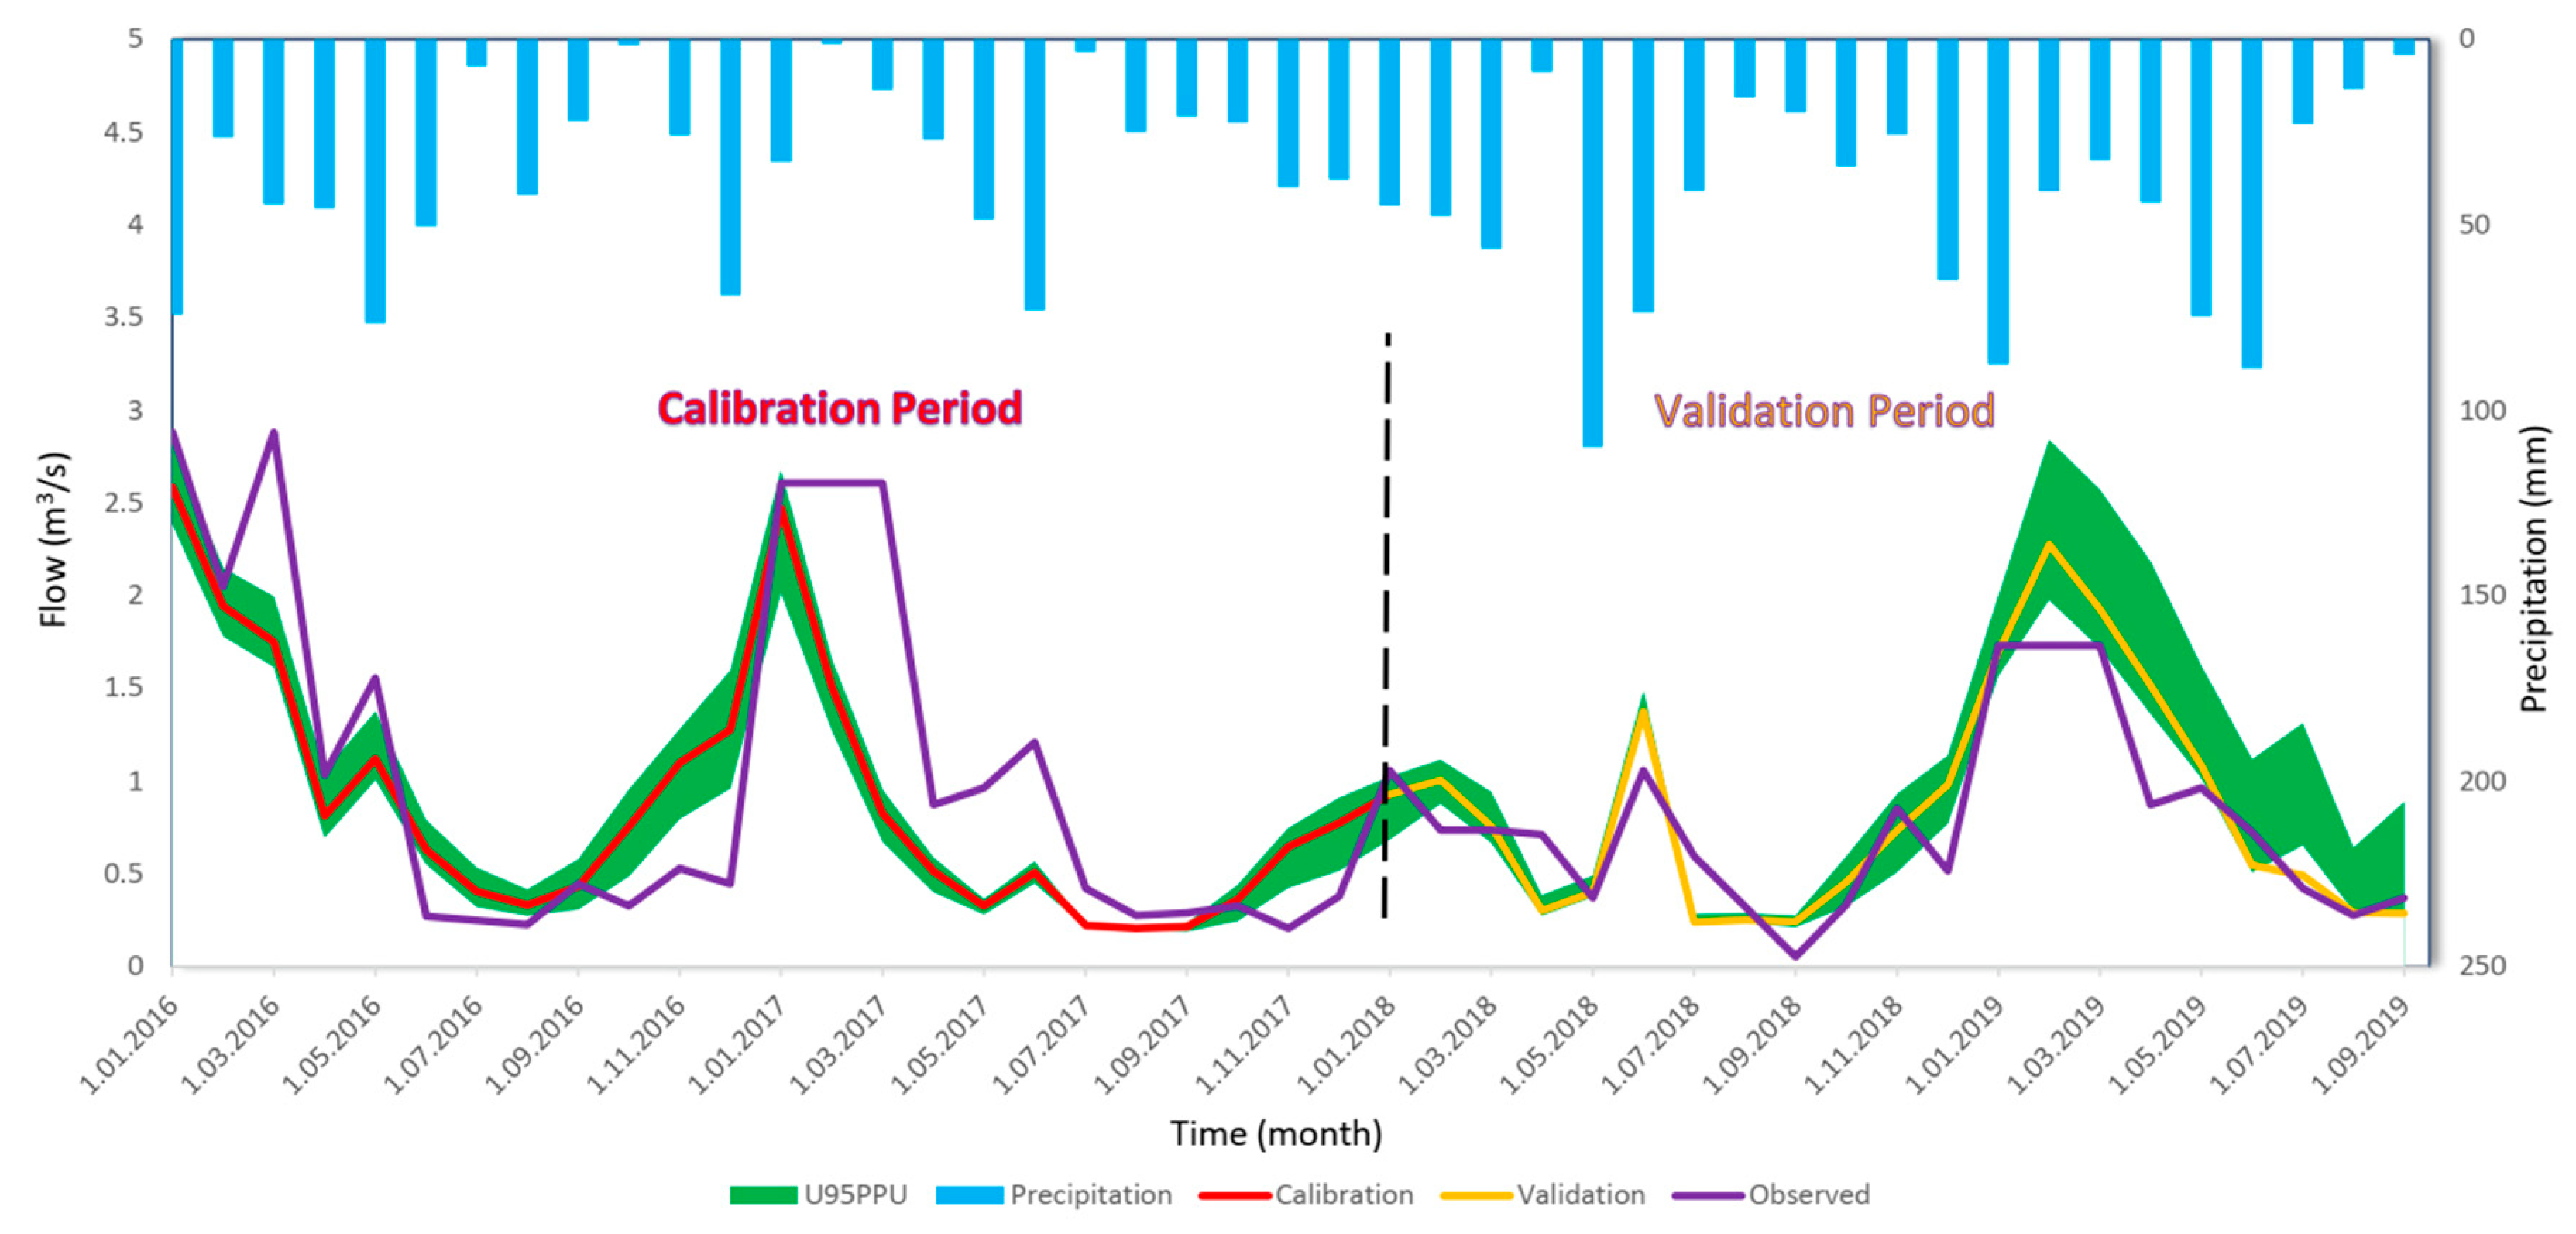
Sensitivity Analysis, Calibration and Validation

SWAT-CUP software (2019) was used for sensitivity analysis, calibration, and validation. The software ensured the analysis of the basin parameters in the model with the sequential uncertainty fitting (SUFI-2) algorithm. The SUFI-2 algorithm defines the parameter uncertainty for variables such as conceptual model parameters and measured data [36]. This parameter uncertainty is defined by measures named 95PPU, d-factor, and p-factor [37]. The SUFI-2 algorithm in SWAT-CUP operates as shown in Figure 8.
The identified sensitive parameters were manually varied from (±)10% to (±)20%, considering their effect on the natural system in the ArcSWAT software, and transferred to the SWAT-CUP software to identify their most appropriate values.
With sensitivity analysis, the parameters ALPHA_BF, ESCO, GWQMN, ESCO, SLSUBSN, and HRU_SLP were identified to be sensitive (Table 4). It appeared that these parameters directly affected the surface flow and nutrient (TN and TP) burden.
According to the value intervals in Table 5, 1000 runs were performed using the SUFI-2 algorithm with SWAT-CUP software, and fit values were found.
When the parameters determined by the SUFI-2 algorithm were input in SWAT-CUP software for calibration and validation using data from 2016–2017 and 2018–2019, respectively, the model provided successful results, though the data were acquired from a short observation period.
The calibration and validation stages in modelling applications assess the model performance based on connection values between the observed data and the model outcomes. In hydrological models, it is recommended to use the Nash–Sutcliffe efficacy statistic (NSE) [39], the coefficient of prominence (R2), and the percentage error statistic (PBIAS), along with both direct and derived statistical methods to more comprehensively assess the model performance and ensure the reliability of the model outputs [40]. Table 6 reports the range of values and corresponding success statistics for flow and nutrient SWAT models.
  NSE       =           1 i = 1 n ( O i P i ) 2 i = 1 n O i O ¯ 2
  • Oi: Observed value
  • Pi: Calculated value
R   2       =                 i = 1 n ( O i O ¯ ) ( P i P ¯ ) 2   i = 1 n ( O i O ¯ ) 2 i = 1 n P i P ¯ 2 2
  • Oi: Observed value
  • Pi: Calculated value
  • O ¯ : Variance of observed value
  PBIAS     =           i = 1 n O i P i i = 1 n O i × 100
  • Oi: Observed value
  • Pi: Calculated value
Using the SUFI-2 algorithm with the SWAT-CUP software, 1000 runs were performed. It was found that the values obtained from the 792nd run provided the best performance. The performance statistics (R2, NSE, and PBIAS) for the SWAT-CUP models for flow, TN, and TP are presented in Table 7.

4. Discussion

In this study, the sample study area of the Tatlıçay river ecosystem located within the Çankırı province in the Central Anatolia region of Türkiye was modelled with the hydrological modelling SWAT software. There is no flow-monitoring station performing daily recordings in the Tatlıçay Basin. There is one quality monitoring station performing monthly measurements located at the outlet of the Çankırı basin. The lack of current daily data over the years lowered the model quality. We set up a model of the Tatlıçay river ecosystem using flow and nutrient (TN and TP) data from the quality monitoring station in Çankırı city center.

4.1. Flow Model

The calibration and validation results for the flow model from 2016 to 2020 and a comparative graph with rainfall are shown in Figure 9. The mean flow distribution for the whole river ecosystem from 2016 to 2020 is presented in Figure 10.
The model success statistics for the calibration and validation results of the flow model were compared. The R2 values in the validation stage appeared to increase compared to those in the calibration stage. This increase in R2 indicated that the model’s capacity to estimate future variations increased during the validation [42]. In the validation stage, the NSE value appeared to increase compared to the calibration stage. This increase in the NSE value indicated that the accuracy rate of the model predictions was higher than during the validation process. The PBIAS value during the calibration showed that the model data were overestimated compared to the observed data. However, though this value varied in a negative way during the validation stage, it was close to 0 at the end of the calibration; therefore, it may be concluded that the model can make successful predictions [43].
When the flow model results were compared to monthly mean rainfall data from the Çankırı Meteorological Monitoring Station (MMS), it appeared that the flow in the river ecosystem was compatible with the rainfall data (see Figure 9). Considering the whole river ecosystem shown in Figure 10, the regular accumulation of flow in all river tributaries would support this situation.

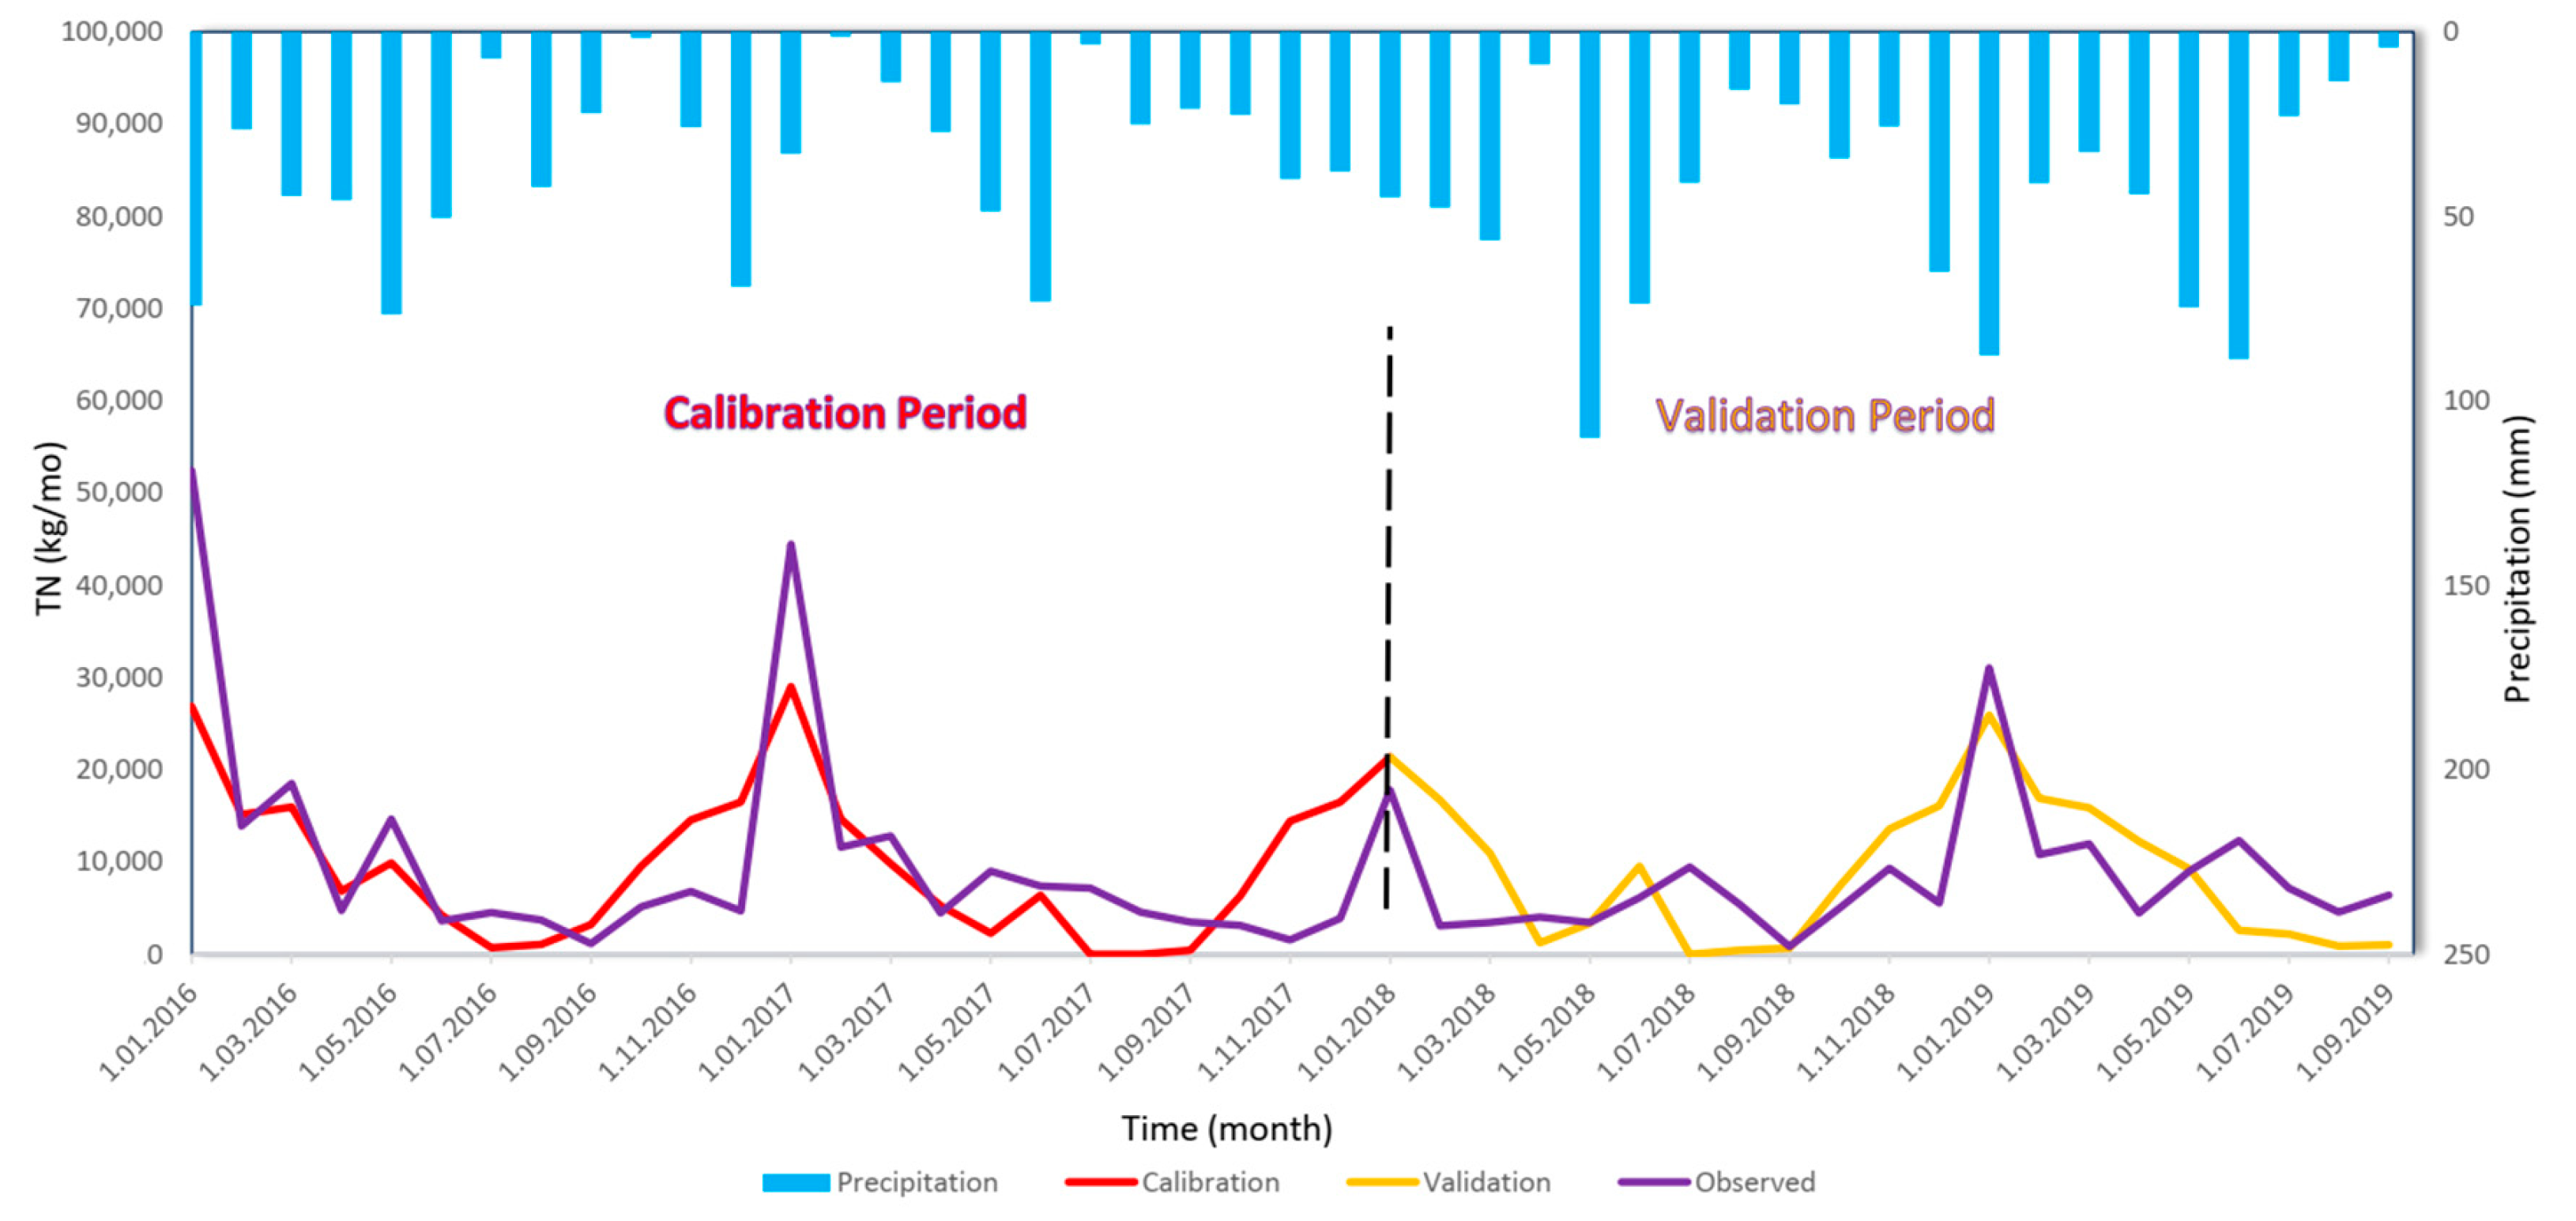
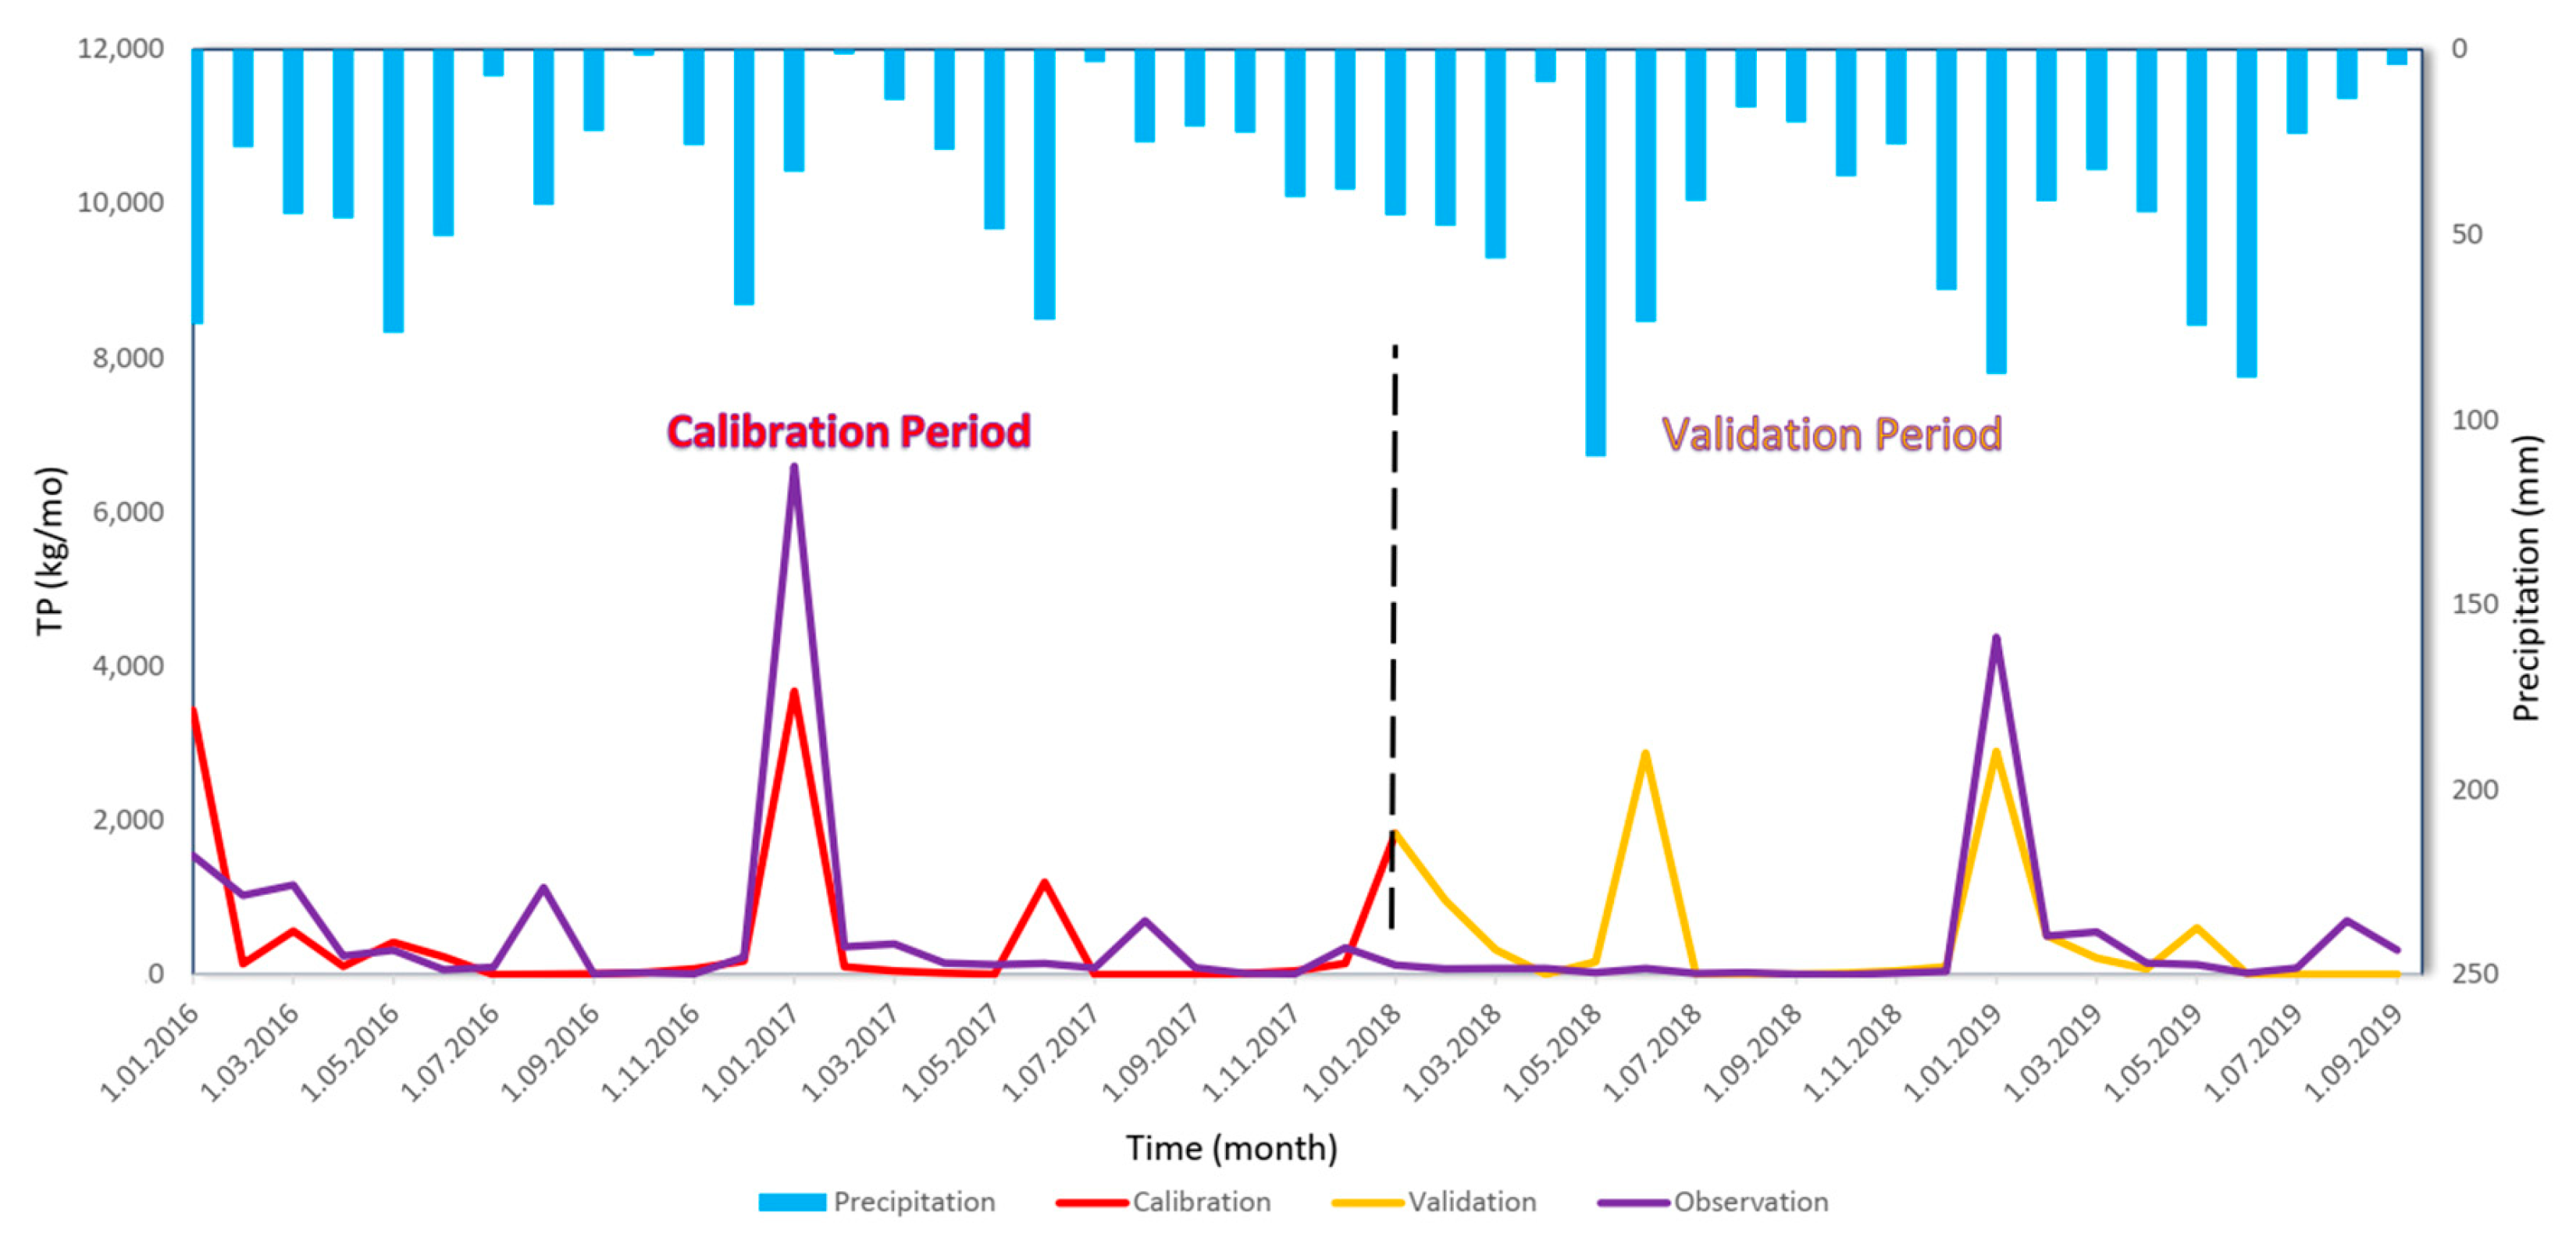
4.2. Model Findings Regarding Nutrient (TN and TP) Pollution

The model calibration and validation results for TN and TP pollution from 2016 to 2020 and the corresponding rainfall graph are presented in Figure 11 and Figure 12, respectively.
When the model statistics for the calibration and validation results for the TP and TN pollution were compared, the R2 value in the validation stage appeared lower compared to that in the calibration stage. This indicated that the model had a low prediction capacity [44]. The NSE value in the validation stage was found to be lower than that in the calibration stage. This was attributed to the short observation period and suggested variations in the predictions. In the calibration stage, the PBIAS value indicated that the predicted values were higher than the observed ones, while in the validation stage, they were much lower.
When the TN and TP model results were compared with the monthly mean rainfall data from Çankırı MMS, it appeared that the TN and TP levels in the river ecosystem were not compatible with the rainfall data (see Figure 11 and Figure 12). Considering the whole river system, the TN and TP burden in all stream tributaries increased in town centers and the main branch of the Tatlıçay as the low slope of the areas increased.
This modelling study obtained successful results in the calibration and validation process using very few observation data. When the model results were assessed, it appeared that the sources of the TN and TP burden in the Tatlıçay were anthropogenic, like agricultural activities and urban discharge [43,45,46].

5. Conclusions

Water is one of the most important elements influencing environmental health. This study was performed with the aim to investigate the behavior of water in nature and the distribution and sources of pollutants disrupting water quality by using a hydrological model for the prediction and monitoring of possible issues related to water quality and environmental health. Such a model would also help find solutions to these health issues. A SWAT model was calibrated and validated, with acceptable error statistics, for the Tatlıçay river ecosystem. The model calibration achieved high accuracy, even if limited flow and water quality data, provided by the few measurement stations in the Tatlıçay basin, were available. The resulting model may produce effective solutions in future problematic situations threatening environmental health.
Hydrological modelling also allows the study with high accuracy of areas where water quality cannot be measured or is difficult to measure. These studies have been included in the engineering literature, such as hydrology, hydrogeology, construction, and environmental engineering studies. Additionally, they are also part of the global environmental health literature. In Türkiye, some academic studies have been conducted on the water quality in certain regions and some national and local projects, e.g., the Environmental Health Information System have been established. This research offers a great contribution to the environmental health literature, as it is one of the very few hydrological modelling studies conducted in Türkiye. Additionally, hydrological models can help ecosystem-based water quality management and promote the development of information systems for national and local administrations.
Since the surface water models are dynamic, the accuracy of their predictions should be improved by performing long-term, daily or monthly flow and water quality measurements. Additionally, uncertainties should be resolved, and the effects of pollutants on environmental health should be assessed.
The model results showed that the causes of poor water quality in the Tatlıçay river system are urban discharge and agricultural practices. To prevent water pollution in the Tatlıçay basin in the future, it is recommended to construct package water treatment facilities in settlement areas with a dense population and water treatment facilities according to future population projections in the Çankırı provincial center. Additionally, it is recommended to improve fertilization practices to allow safe field irrigation.
The use of the SWAT model could facilitate the local management of environmental health if the pollutant parameters and hydrological data of each area are regularly updated by the local governments as well as by the national institutions responsible for national water management. Thus, a warning system can be developed before the pollutant limits determined for the study area are exceeded, and measures such as improved treatment plant capacity or technology and on-site destruction of pollutant sources or reduction of their use can be promptly applied. Furthermore, interferences with the detection systems are not infrequent. Therefore, knowledge of the relevant literature and the regular assessment of the advantages and limits of the current monitoring technologies are necessary to reduce environmental risks.

Author Contributions

This is an original research article prepared for publication by compiling the results of the Master’s thesis titled “Application of SWAT Model In Water Quality Assessment In The Lotic Ecosystem: A Case Study In Tatlıçay Basin (Çankırı, Türkiye)” by the first author E.G., under the supervision of O.Ü. All authors contributed to the study conception and design. Material preparation, data collection and analysis were performed by E.G. and O.Ü. The first draft of the manuscript was written by E.G., and all authors commented on previous versions of the manuscript. Research and publication ethics were complied with during the study. All authors have read and agreed to the published version of the manuscript.

Funding

This research received no external funding.

Institutional Review Board Statement

Not applicable.

Informed Consent Statement

Not applicable.

Data Availability Statement

The data used to support the findings of this study are included within the manuscript. The datasets generated during and/or analyzed during the current study are available from the corresponding author on reasonable request.

Acknowledgments

We are very grateful to Hatice Kılıç Germeç for her help during modelling and desktop work. We thank the Republic of Türkiye, the General Directorate of State Hydraulic Works (DSI) and Çankırı Municipality for scientific work permits and logistic support.

Conflicts of Interest

The authors declare no conflict of interest.

References

  1. Saha, P.P.; Zeleke, K.; Hafeez, M. Streamflow modeling in a fluctuant climate using SWAT: Yass River catchment in south eastern Australia. Environ. Earth Sci. 2014, 71, 5241–5254. [Google Scholar] [CrossRef]
  2. Song, X.; Zhang, J.; Zhan, C.; Xuan, Y.; Ye, M.; Xu, C. Global Sensitivity Analysis in Hydrological Modeling: Review of Concepts, Methods, Theoretical Framework, and Applications. J. Hydrol. 2015, 523, 739–757. [Google Scholar] [CrossRef]
  3. WHO. Mortality Rate Attributable to Unsafe Water, Sanitation, and Hygiene. 2022. Available online: https://ourworldindata.org/grapher/mortality-rate-attributable-to-wash (accessed on 10 November 2022).
  4. Germeç, E.; Ürker, O. Hydrological Modeling in Environmental Health: Role, Significance and Comparative Analysis of Application Methods. Review. Turk. J. Health Sci. Life 2020, 3, 12–18. [Google Scholar]
  5. Gleick, P.H. Water resources. In Encyclopedia of Climate and Weather; Oxford University Press: New York, NY, USA, 1996; pp. 42–86. [Google Scholar]
  6. Singh, V.P.; Frevert, D.K. Watershed Models; CRC Press: New York, NY, USA, 2010; Volume 28, p. 678. [Google Scholar]
  7. Federal Interagency Stream Corridor Restoration Working Group. Stream Corridor Restoration: Principles, Processes, and Practices. 2001, p. 653. Available online: https://www3.uwsp.edu/cnr-ap/UWEXLakes/PublishingImages/resources/restoration-project/StreamRestorationHandbook.pdf (accessed on 10 August 2023).
  8. Gleick, P.H. Water in Crisis: A Guide to the World’s Fresh Water Resources; Oxford University Press: New York, NY, USA, 1993; p. 504. [Google Scholar]
  9. Wang, G.; Li, S.B.; Qi, C.; Ding, F. A Review of Surface Water Quality Models. Sci. World J. 2013, 2013, 231768. [Google Scholar] [CrossRef] [PubMed]
  10. Abell, J.M.; Hamilton, D.P.; Rutherford, J.C. Quantifying temporal and spatial variations in sediment, nitrogen and phosphorus transport in stream inflows to a large eutrophic lake. Environ. Sci. Process. Impacts 2013, 15, 1137–1152. [Google Scholar] [CrossRef] [PubMed]
  11. Serengil, Y.; Augustaitis, A.; Bytnerowicz, A.; Grulke, N.; Kozovitz, A.R.; Matyssek, R.; Müller-Starck, G.; Schaub, M.; Wieser, G.; Aydin Coskun, A.; et al. Adaptation of forest ecosystems to air pollution and climate change: A global assessment on research priorities. iForest 2011, 4, 44–48. [Google Scholar] [CrossRef]
  12. Wu, H.; Chen, B. Evaluating uncertainty estimates in distributed hydrological modeling for the Wenjing River watershed in China by GLUE, SUFI-2, and ParaSol methods. Ecol. Eng. 2015, 76, 110–121. [Google Scholar] [CrossRef]
  13. Wang, G.; Jager, H.I.; Baskaran, L.M.; Baker, T.F.; Brandt, C.C. SWAT Modeling of Water Quantity and Quality in the Tennessee River Basin, Spatiotemporal Calibration and Validation. Hydrol. Earth Syst. Sci. Discuss. 2016, 1, 33. [Google Scholar] [CrossRef]
  14. Koltsida, E.; Mamassis, N.; Kollioras, A. Hydrological modeling using the Soil and Water Assessment Tool in urban and peri-urban environments: The case of Kifisos experimental subbasin (Athens, Greece). Hydrol. Earth Syst. Sci. 2023, 27, 917–931. [Google Scholar] [CrossRef]
  15. Gassman, P.W.; Reyes, M.R.; Green, C.H.; Arnold, J.G. The soil and water assessment tool: Historical development, applications, and future research directions. Trans. ASABE 2007, 50, 1211–1250. [Google Scholar] [CrossRef]
  16. Neitsch, S.L.; Arnold, J.G.; Kiniry, J.R.; Williams, J.R. SWAT (Soil and Water Assessment Tool) Theoretical Documentation Version 2009; Texas Water Resources Institute Technical Report No. 406; Texas A&M University System: College Station, TX, USA, 2011. [Google Scholar]
  17. Qiu, L.; Zheng, F.; Yin, R. SWAT-based runoff and sediment simulation in a small watershed, the loessial hilly-gullied region of China: Capabilities and challenges. Int. J. Sediment Res. 2012, 27, 226–234. [Google Scholar] [CrossRef]
  18. Jalowska, A.M.; Yuan, Y. Evaluation of SWAT Impoundment Modeling Methods in Water and Sediment Simulations. J. Am. Water Resour. Assoc. 2018, 55, 1–19. [Google Scholar] [CrossRef] [PubMed]
  19. Gassman, P.W.; Sadeghi, A.M.; Srinivasan, R. Applications of the SWAT Model Special Section, Overview and Insights. J. Environ. Qual. 2014, 43, 1–8. [Google Scholar] [CrossRef]
  20. Saddiqi, M.M.; Karpuzcu, M.E. Modeling of Lesser Meander Sub-Basin with SWAT. Çukurova Univ. J. Fac. Eng. Archit. 2019, 34, 55–69. (In Turkish) [Google Scholar]
  21. Guse, B.; Reusser, D.E.; Fohrer, N. How to improve the representation of hydrological processes in SWAT for a lowland catchment—Temporal analysis of parameter sensitivity and model performance. Hydrol. Process. 2014, 28, 2651–2670. [Google Scholar] [CrossRef]
  22. Me, W.; Abell, J.M.; Hamilton, D.P. Effects of hydrologic conditions on SWAT model performance and parameter sensitivity for a small, mixed land use catchment in New Zealand. Hydrol. Earth Syst. Sci. 2015, 19, 4127–4147. [Google Scholar] [CrossRef]
  23. Panagopoulos, Y.; Makropoulos, C.; Baltas, E.; Mimikou, M. SWAT parameterization for the identification of critical diffuse pollution source areas under data limitations. Ecol. Model. 2011, 222, 3500–3512. [Google Scholar] [CrossRef]
  24. Irvem, A.; El-Sadek, A. Evaluation of Streamflow Simulation by SWAT Model for The Seyhan River Basin Seyhan. Çukurova J. Agric. Food Sci. 2018, 33, 99–110. [Google Scholar]
  25. DSI (General Directorate of Water Affairs). Kızılırmak Basin Master Plan Report Preparation; Basin Master Plan Final Report; Dolsar Engineering: Çankaya/Ankara, Türkiye, 2019; pp. 186–213. (In Turkish) [Google Scholar]
  26. Soil&Water Resources of DSI (General Directorate of Water Affairs). Available online: https://www.dsi.gov.tr/Sayfa/Detay/754 (accessed on 1 October 2022). (In Turkish)
  27. Zhang, N.; He, H.M.; Zhang, S.F.; Jiang, X.H.; Xia, Z.Q.; Huang, F. Influence of Reservoir Operation in the Upper Reaches of the Yangtze River (China) on the Inflow and Outflow Regime of the TGR-Based on the Improved SWAT Model. Water Resour. Manag. 2012, 26, 691–705. [Google Scholar] [CrossRef]
  28. Her, Y.; Frankenberger, J.; Chaubey, I.; Srinivasan, R. Threshold Effects in HRU Definition of the Soil and Water Assessment Tool. Trans. Am. Soc. Agric. Biol. Eng. 2015, 58, 367–378. [Google Scholar] [CrossRef]
  29. Raes, D. Reference Manual—ETo (Evapotranspiration from a Reference Surface) Calculator; Version 3.2; FAO: Rome, Italy, 2012; Available online: https://www.ipcinfo.org/fileadmin/user_upload/faowater/docs/ReferenceManualV32.pdf (accessed on 1 August 2023).
  30. Nachtergaele, F.O.; van Velthuizen, H.T.; Verelst, L. Harmonized World Soil Database; FAO: Rome, Italy; IIASA: Laxenburg, Austria, 2009; Available online: https://www.fao.org/soils-portal/data-hub/soil-maps-and-databases/harmonized-world-soil-database-v12/en/ (accessed on 1 August 2023).
  31. FAO-UNESCO. Digital Soil Map of the World (DSMW), and Derived Soil Properties; FAO: Rome, Italy, 2003; Available online: https://www.fao.org/land-water/land/land-governance/land-resources-planning-toolbox/category/details/en/c/1026564/ (accessed on 1 August 2023).
  32. TUIK. Türkiye 2040 Population Projections. Available online: https://data.tuik.gov.tr/Bulten/Index?p=Nufus-Projeksiyonlari-2018-2080-30567#:~:text=Demografik%20g%C3%B6stergelerdeki%20mevcut%20e%C4%9Filimler%20devam,bin%20233%20ki%C5%9Fiye%20ula%C5%9Fmas%C4%B1%20beklenmektedir (accessed on 1 December 2022).
  33. TUIK. Address Based Population Registration System Results. Available online: https://data.tuik.gov.tr/Bulten/Index?p=49685 (accessed on 1 December 2022).
  34. USGS. Shuttle Radar Topography Mission (SRTM) 1 Arc-Second Global 2017, Rev.2021. Available online: https://www.usgs.gov/centers/eros/science/usgs-eros-archive-digital-elevation-shuttle-radar-topography-mission-srtm-1?qt-science_center_objects=0#qt-science_center_objects (accessed on 10 June 2023).
  35. EEA. CORINE Land Cover (CLC) 2018, Version 2020_20u1. 2020. Available online: https://www.copernicus.eu/en/access-data/copernicus-services-catalogue/corine-land-cover-2018-vector-version-202020u1-may-2020 (accessed on 1 August 2023).
  36. Athira, P.; Sudheer, K.P. Calibration of distributed hydrological models considering the heterogeneity of the parameters across the basin: A case study of SWAT model. Environ. Earth Sci. 2021, 80, 131. [Google Scholar] [CrossRef]
  37. Abbaspour, K.C.; Vejdani, M.; Haghighat, S. SWATCUP calibration and uncertainty programs for SWAT. In Proceedings International Congress on Modelling and Simulation (MODSIM’07); Oxley, L., Kulasiri, D., Eds.; Modelling and Simulation Society of Australia and New Zealand: Melbourne, VIC, Australia, 2007; pp. 1603–1609. [Google Scholar]
  38. Abbaspour, K.C. Calibration of hydrologic models: When is a model calibrated? In MODSIM 2005 International Congress on Modeling and Simulation; Zerger, A., Argent, R.M., Eds.; Modelling and Simulation Society of Australia and New Zealand: Melbourne, VIC, Australia, 2005; pp. 2449–12445. ISBN 0-9758400-2-9. Available online: http://www.mssanz.org.au/modsim05/papers/abbaspour.pdf (accessed on 10 December 2022).
  39. Nash, J.E.; Sutcliffe, J.V. River Flow Forecasting through Conceptual Model. Part 1—A Discussion of Principles. J. Hydrol. 1970, 10, 282–290. [Google Scholar] [CrossRef]
  40. Moriasi, D.N.; Zeckoski, R.W.; Arnold, J.G.; Baffaut, C.B.; Malone, R.W.; Daggupati, P.; Guzman, J.A.; Saraswat, D.; Yuan, Y.; Wilson, B.W.; et al. Hydrologic and Water Quality Models: Key Calibration and Validation Topics. Trans. ASABE 2015, 58, 1609–1618. [Google Scholar] [CrossRef]
  41. Moriasi, D.N.; Arnold, J.G.; Van Liew, M.W.; Bingner, R.L.; Harmel, R.D.; Veith, T.L. Model Evaluation Guidelines for Systematic Quantification of Accuracy in Watershed Simulations. Trans. ASABE 2007, 50, 885–900. [Google Scholar] [CrossRef]
  42. Hasan, M.A.; Pradhanang, S.M. Estimation of flow regime for a spatially varied Himalayan watershed using improved multi-site calibration of the Soil and Water Assessment Tool (SWAT) model. Environ. Earth Sci. 2017, 76, 787. [Google Scholar] [CrossRef]
  43. Cai, Y.; Zhang, F.; Shi, J.; Johnson, V.C.; Ahmed, Z.; Wang, J.; Wang, W. Enhancing SWAT model with modified method to improve Eco-hydrological simulation in arid region. J. Clean. Prod. 2023, 403, 136891. [Google Scholar] [CrossRef]
  44. Rathjens, H.; Kiesel, J.; Winchell, M.; Arnold, J.; Ratchens, R.S. Technical note: Extending the SWAT model to transport chemicals through tile and groundwater flow. Hydrol. Earth Syst. Sci. 2023, 27, 159–167. [Google Scholar] [CrossRef]
  45. Allen, R.G.; Pereira, L.S.; Raes, D.; Smith, M. Crop Evapotranspiration, Guidelines for Computing Crop Water Requirements; FAO Irrigation and Drainage Paper 56; Food and Agriculture Organization of the United Nations: Rome, Italy, 1998; 300p. [Google Scholar]
  46. Sharma, A.; Patel, P.L.; Sharma, P.J. Influence of climate and land-use changes on the sensitivity of SWAT model parameters and water availability in a semi-arid river basin. CATENA 2022, 215, 106298. [Google Scholar] [CrossRef]
Figure 1. Map of the Tatlıçay Basin.
Sustainability 15 13850 g001
Figure 2. Location of the observation stations in the Tatlıçay Basin.
Sustainability 15 13850 g002
Figure 3. The SWAT model setup.
Sustainability 15 13850 g003
Figure 4. Topographic properties of the study area.
Sustainability 15 13850 g004
Figure 5. Reservoirs and point sources of pollution defined within sub-basins in the SWAT model.
Sustainability 15 13850 g005
Figure 6. HRU definition scheme.
Sustainability 15 13850 g006
Figure 7. Climatic parameters considered.
Sustainability 15 13850 g007
Figure 8. SUFI-2 algorithm in SWAT-CUP [38].
Sustainability 15 13850 g008
Figure 9. Calibration and validation results for the flow model.
Sustainability 15 13850 g009
Figure 10. Flow model for the Tatlıçay river ecosystem.
Sustainability 15 13850 g010
Figure 11. Calibration and validation results for TN pollution.
Sustainability 15 13850 g011
Figure 12. Calibration and validation results for TP pollution.
Sustainability 15 13850 g012
Table 1. TN loads used for calibration and validation (kg/month).
TNYear123456789101112
kg/month201652,472.013,913.118,519.54743.814,692.73631.64535.13714.91179.25156.96834.94705.9
kg/month201744,479.111,604.612,848.04466.59031.17401.77191.44562.03504.03135.51556.03887.8
kg/month201817,790.63115.93449.84017.63448.76158.69450.45422.3864.15009.09319.45558.9
kg/month201931,058.710,818.011,977.14466.59031.112,347.07191.44562.06414.7
Table 2. TP loads used for calibration and validation (kg/month).
TPYear123456789101112
kg/month201614,337.21026.81165.2241.2316.364.696.01129.710.428.19.6226.6
kg/month20176598.6359.5398.0150.4130.1144.386.4699.991.914.98.6350.3
kg/month2018121.673.080.879.324.882.114.327.93.30.822.145.5
kg/month20194376.3499.2552.7150.4130.118.886.4699.9320.2
Table 3. Data required for the model.
Data NameTypeSource
Digital elevation modelRasterShuttle Radar Topography Mission
(STRM 30)
Land coverVectorCORINE 2018
Soil dataVectorFAO soil data [30,31]
Climate dataTableGeneral Directorate of Meteorology (MGM)
Hydrological dataTableGeneral Directorate of State Hydraulic Works (DSI)
Point pollutant sourcesTableTurkish Statistical Institute [32,33]
Flow (m3/s)TableDSI
Total nitrogen load (TN) TableDSI
Total phosphorus load (TP) TableDSI
Table 4. Sensitive parameters in the model.
NoParameterDataExplanation
1ALPHA_BF.gwBase flow alpha value (1/day)
2GWQMN.gwNecessary threshold water depth for a return flow to a shallow aquifer due to irrigation (mm H2O)
3GW_DELAY.gwGroundwater delay (days)
4SLSUBSN.hruSoil depth from surface to lowest level (mm)
5HRU_SLP.hruHRU mean slope steepness (m/m)
6ESCO.hruSoil evaporation equilibration factor
Table 5. SWAT-CUP parameter values.
NoParameter NameMin_ValueMax_ValueFit Value
1r__ALPHA_BF.gw−0.20.2−0.1642
2v__GW_DELAY.gw200300264.55
3r__GWQMN.gw−0.20.20.161
5r__SLSUBBSN.hru−0.20.20.0782
6r__HRU_SLP.hru−0.20.20.1498
7r__ESCO.hru−0.20.20.011
Table 6. SWAT model success statistics [40,41].
Parameter Model Success
Very GoodGoodSatisfactoryFailed
Flow model
R2R2 > 0.850.75 < R2 ≤ 0.850.60 < R2 ≤ 0.75R2 ≤ 0.60
NSE NSE > 0.800.70 < NSE ≤ 0.800.50 < NSE ≤ 0.70NSE ≤ 0.50
PBIASPBIAS < ±10±10 < PBIAS ≤ ±15±15< PBIAS ≤ ±25PBIAS ≥ ±25
Nutrient model (N, P)
R2R2 > 0.700.60 < R2 ≤ 0.700.30 < R2 ≤ 0.60R2 ≤ 0.30
NSENSE > 0.650.50 < NSE ≤ 0.650.35 < NSE ≤ 0.50NSE ≤ 0.35
PBIASPBIAS < ±25±25 < PBIAS ≤ ±40±40 < PBIAS ≤ ±70PBIAS ≥ ±70
Table 7. SWAT-CUP model performance.
FlowTNTP
CalibrationR20.64R20.56R20.63
NSE0.60NSE0.55NSE0.60
PBIAS15.4PBIAS7.2PBIAS29.8
ValidationR20.81R20.39R20.34
NSE0.66NSE0.04NSE0.17
PBIAS−2.1PBIAS−10.0PBIAS−43.9
Disclaimer/Publisher’s Note: The statements, opinions and data contained in all publications are solely those of the individual author(s) and contributor(s) and not of MDPI and/or the editor(s). MDPI and/or the editor(s) disclaim responsibility for any injury to people or property resulting from any ideas, methods, instructions or products referred to in the content.

