Article

Selection of the Energy Performance Indicator for Hotels Based on ISO 50001: A Case Study

by
Luis Angel Iturralde Carrera
1,
Andrés Lorenzo Álvarez González
2,
Juvenal Rodríguez-Reséndiz
3,* and
José Manuel Álvarez-Alvarado
3,*
1
Facultad de Química, Universidad Autónoma de Querétaro, Querétaro 76010, Mexico
2
Facultad de Ingeniería, Universidad Autónoma de Juárez, Chihuahua 32310, Mexico
3
Facultad de Ingeniería, Universidad Autónoma de Querétaro, Querétaro 76010, Mexico
*
Authors to whom correspondence should be addressed.
Sustainability 2023, 15(2), 1568; https://0-doi-org.brum.beds.ac.uk/10.3390/su15021568
Submission received: 25 November 2022 / Revised: 22 December 2022 / Accepted: 10 January 2023 / Published: 13 January 2023
(This article belongs to the Special Issue Energy-Building-Indoor Environment for Long-Term Sustainability)

Abstract

:
The work deals with the study of the Energy Planning stage according to the ISO 50001:2018 Standard at the Hotel Punta la Cueva in Cienfuegos, Cuba. The current energy management indicators for hotels are well-studied. However, the study aims to incorporate the variable Degree-Days in the Room Days Occupied (RDO) to establish a correct Baseline and Energy Performance Indicator. The methodology followed is based on the energy management standards of energy review stage. The fundamental results were in obtaining the Energy Baseline with a Coefficient of Determination ( R 2 ) of 0.97. One of the opportunities for improvement consisted of the replacement of 80 bulbs 15 W with 9 W LED bulbs. It has an Internal Rate of Return (IRR) of 28%, a Present Value Net Income (NPV) of 71.5 USD, and an Investment Recovery Period (PRI) of 3.6 years. The second opportunity is a preliminary project for a Photovoltaic Solar System on the roofs of the buildings, where it is possible to install 1011 photovoltaic and achieve a generation of 384 kilowatt-peak (kWp).

1. Introduction

Throughout history, the main economic developments of humanity have been linked to great energy developments, such as the discovery of fire, bringing with it protection and better nutrition; the great Industrial Revolution and today, all the existing development in the energy field. However, all this has brought with it a great deterioration of the environment, causing climate change that seems unstoppable [1]. Climate change is one of the greatest global challenges, mainly due to its consequences: meteorological changes and natural disasters [2,3,4,5].
Energy management programs are being developed to enhance energy efficiency in industries to facilitate energy savings, reduce greenhouse gas emissions, and provide productivity benefits. However, industrial energy efficiency remains unattained; with low implementation rates of energy efficiency measures because of certain barriers, although research has shown its immense potential. There are multiple studies conducted at local, regional, national, and multinational focusing on the barriers to adopting energy efficiency in industries, which coincides with what was mentioned by [1,6,7,8].
As companies in the service sector, hotels do not manufacture products; their basic purpose is accommodation, space rental, and meal service. Around this, the need arises to permanently maintain and guarantee the best conditions of cleaning, lighting, air conditioning, and ventilation, which requires an investment of thermal and electrical energy through different sources such as natural gas, electricity, and diesel. In hotel organizations, energy expenditure ranges from 3% to 6% of total expenses, so their savings and management represent a significant contribution to the finances company [7,9].
In this regard, energy management systems are important in their ability to support organizations seeking to increase energy efficiency and minimize their negative environmental impact [10,11]. In this context, the ISO 50001 standard plays an important role in guiding organizations in the implementation of an energy management system [12,13]. By presenting a structure that is increasingly similar to the other International Organization for Standardization (ISO) standards, the integration of ISO 50001 with them is facilitated [14]. Despite its importance, Marimón and Casadestus [11] drew attention to the lack of research on ISO 50001; and Ref. [15] highlighted the need for research to identify the challenges related to the adoption of ISO 50001 for supply chains, according to [16,17].
The application of renewable energy sources is increasing day by day. Solar energy is the most promising among renewable energy sources due to its pollution-free nature. The application of it as a savings opportunity in hotels would allow a greater performance of the same and a contribution to the protection of the environment in which they coincide [15,18,19,20,21,22].
Hotels in the Caribbean have great potential for energy savings. According to the ISO 50001:2018 standard, the energy performance indicators are necessary tools for the correct energy management of facilities; some authors [23,24,25,26,27,28] suggest using energy consumption per unit of production, defined as the ratio of energy consumption to a reference value (tourists- nights sold, rooms occupied per day, gastronomic services sold or a number of workers in different units of time given in days, weeks, months, and years. In search of more convenient indicators, many studies [29,30,31,32] attempted to correlate daily, monthly, or annual electricity consumption with relevant factors such as number of rooms rented per year, number of workers or number of guests per night. However, most of these studies show little correlation with the relevant factors, or the results achieved cannot be reproduced in other hotels. Indicators with a correlation of R 2 > 0.6 are considered potential indicators, and those with R 2 > 0.8 are potentially strong indicators [24,33,34,35].
Some studies based on the ISO 50001:2018 standard [24,33,36,37,38], where energy performance indicators are determined for hotel facilities, did not take into account the influence of the outside temperature, the differences between the rooms, services provided to non-guests, and differences between the services and activities offered to tourists. Although numerous studies demonstrated that parameters such as the level of occupancy and weather conditions strongly influence energy consumption, most indicators of energy efficiency discussed in the literature do not consider the outside temperature.
On the other hand, there are several indicators used for energy management in buildings and hotels, the most common being kWh year m 2 , kWh person according to [23,24,25]. These indicators do not consider the type of tourism, the time of year, and the type of climate in our country.
The analysis of variance is a method typical of the experimental designs that permit knowing if there exists a dependency relationship between the variables under study and the statistical significance of the factors involved in each energy performance index [39,40].
For this context, this study aims to develop the energy planning stage, including the implementation of an energy management system based on the ISO 50001:2018 standard, to define the baseline and energy goal and from this propose an indicator of energy performance with a high correlation between its variables, which allows for evaluating the energy consumption of the company and predicting its behavior.
This article is structured as follows: Section 1, Introduction in which the fundamentals of energy management systems are exposed, as well as the main energy indicators used in the hotel sector; it also exposes the contribution that this article makes to the field of knowledge. Section 2, Materials and Methods in which the fundamentals of the international standard ISO 50001:2018 are presented in a general way, specifically the methodology corresponding to the energy review stage, which is followed in the study. Section 3, Results, includes a brief description of the case study hotel, including the analysis of the main energy carriers, the historical data for energy consumption, and its stratification by areas within the hotel. The Energy Baseline is also proposed, as well as the Energy Performance Indicator incorporating the variable Degree Days. Finally, several opportunities for improvement in energy performance are presented, where the substitution of fluorescent lamps for LED technology is proposed, as well as the use of a photovoltaic solar system on the roofs of the hotel. Section 4, Discussion, an analysis of the results obtained is carried out and compared with similar studies. Section 5, Conclusions, the main results of this study, and the bibliographical references are given.

2. Materials and Methods

ISO 50 001 is based on the Plan-Do-Check-Act (PDCA) as shown in Figure 1 continual improvement framework and incorporates energy management into everyday organizational practices. In the context of energy management, the PDCA approach can be outlined as follows:
  • Plan: understand the context of the organization, establish an energy policy and an energy management team, consider actions to address risks and opportunities, conduct an energy review, identify significant energy uses (SEUs) and establish energy performance indicators (EnPIs), energy baseline(s) (EnBs), objectives and energy targets, and action plans necessary to deliver results that will improve energy performance in accordance with the organization’s energy policy;
  • Do: implement the action plans, operational and maintenance controls, and communication, ensure competence and consider energy performance in design and procurement;
  • Check: monitor, measure, analyse, evaluate, audit and conduct management review(s) of energy performance and the EnMS;
  • Act: take actions to address nonconformities and continually improve energy performance and the EnMS.
As previously mentioned, the objective of the investigation is to focus on the planning stage, which can be seen reflected in Figure 1 within the ISO 50001 standard.
The methodology followed in this work is based on the planning stage of the ISO 50001 standard, see Figure 2, specifically focused on the energy review to analyze energy uses and consumption, identify areas of significant energy use, and identify the main opportunities for energy improvements. This figure is a synthesis of the standard at that stage and a better understanding of it is expected with it.
The present investigation deals with the study of the Energy Planning stage according to the ISO 50001:2018 Standard at the Hotel Punta la Cueva in Cienfuegos, Cuba, with the objective of defining the base and goal energy lines, as well as the energy performance indicator for the installation. To do this, we start by conducting a bibliographic search on the main energy management indicators used for this type of study in hotel facilities, reaching the conclusion that the current energy management indicators for hotels are well studied. However, this study intends to incorporate the Day-Degrees variable in the Room-Days-Occupied (RDO) to establish a correct baseline and indicator of energy performance. For this, firstly, we proceed to identify and evaluate the significant uses of energy in the institution also taking into account the operation, mode of operation and control parameters that affect the operation of the equipment that the entity has. Then, the development of the methodology is continued according to the energy management standards in its review stage, obtaining as the main result an energy baseline and a goal line with a Coefficient of Determination ( R 2 ) higher than that of the other studies reported in the literature with other energy performance indicators, a calculation is made by the linear regression method with multiple variables to check with the results obtained. In addition, the research presents the savings opportunities of the installation in a general way and highlights the improvement that the replacement of the luminaires that the entity has with LED bulbs would bring, as well as its economic justification. In addition, the advantages that the installation of a photovoltaic solar system on the roof of its buildings would bring to the hotel are presented.
The hotel has a Quality Policy that all its tourist facilities and workers achieve the satisfaction of the expectations of its clients, standing out for hospitality, ethical and cultural values, being of vital importance the continuous improvement of the quality of its product by the implementation of ISO 9000 Quality Management Systems based on the efficiency and effectiveness of the processes, the sense of belonging of its workers and their continuous training, always based on caring for the environment.
A study of the consumption of electrical energy and production in the years 2018 and 2019 was carried out, which showed a high instability in the productive parameters and consumption of electrical energy of the entity as one of the causes of the non-efficient use of electrical energy in the balanced feed production process. The production process was analyzed, which allowed for finding opportunities to improve energy performance, some of these with investments and others linked to the control and adjustment of operational parameters and improvements in the planning and organization of production.
Figure 3 shows the distribution of the consumption of energy carriers in the hotel.

2.1. Energy Baseline

The daily controls were processed, establishing the goals and the energy baseline based on the results of the energy review. In addition, the energy baseline was obtained, which resulted in those with the highest energy consumption in the stratification.

2.2. Calculation of the Variable Degrees Days

Degrees days ( D G d ) can be defined as the heating or cooling requirements (in degrees Celsius or Kelvin) necessary to reach the comfort zone, accumulated in a certain period of time, generally a month, although it could be weekly or even hourly [35].
For a day, degrees’ days are determined as Equation (1):
D G d = ( T d T r )
For a month, the degrees days are determined as Equation (2):
D G = D G d
where
  • D G d is Degrees days of the day;
  • D G is Degrees days of the month;
  • T d is Average temperature of each day of the month (°C);
  • T r is Reference temperature (18 °C).
It corresponds to the average temperature in typical buildings. When using Equation (1), only the values of ( T d T r ) > 0 are taken into account.

2.3. Calculation of the Energy Performance Indicator

The energy performance indicator is a tool to control energy consumption in different months of the year. The curve drawn from the energy baseline describes the optimal behavior of the hotel. Values below the curve show a good performance and a poor energy performance above it. The Theoretical Energy Performance Indicator (EntPI) for the hotel is obtained by relating the energy equation to the independent variable of the organizations, in the case of analysis of the product of Degree-Days and RDO Equation (3):
E n t P I = E t D G R D O

2.4. Climatic Characteristics of This Area
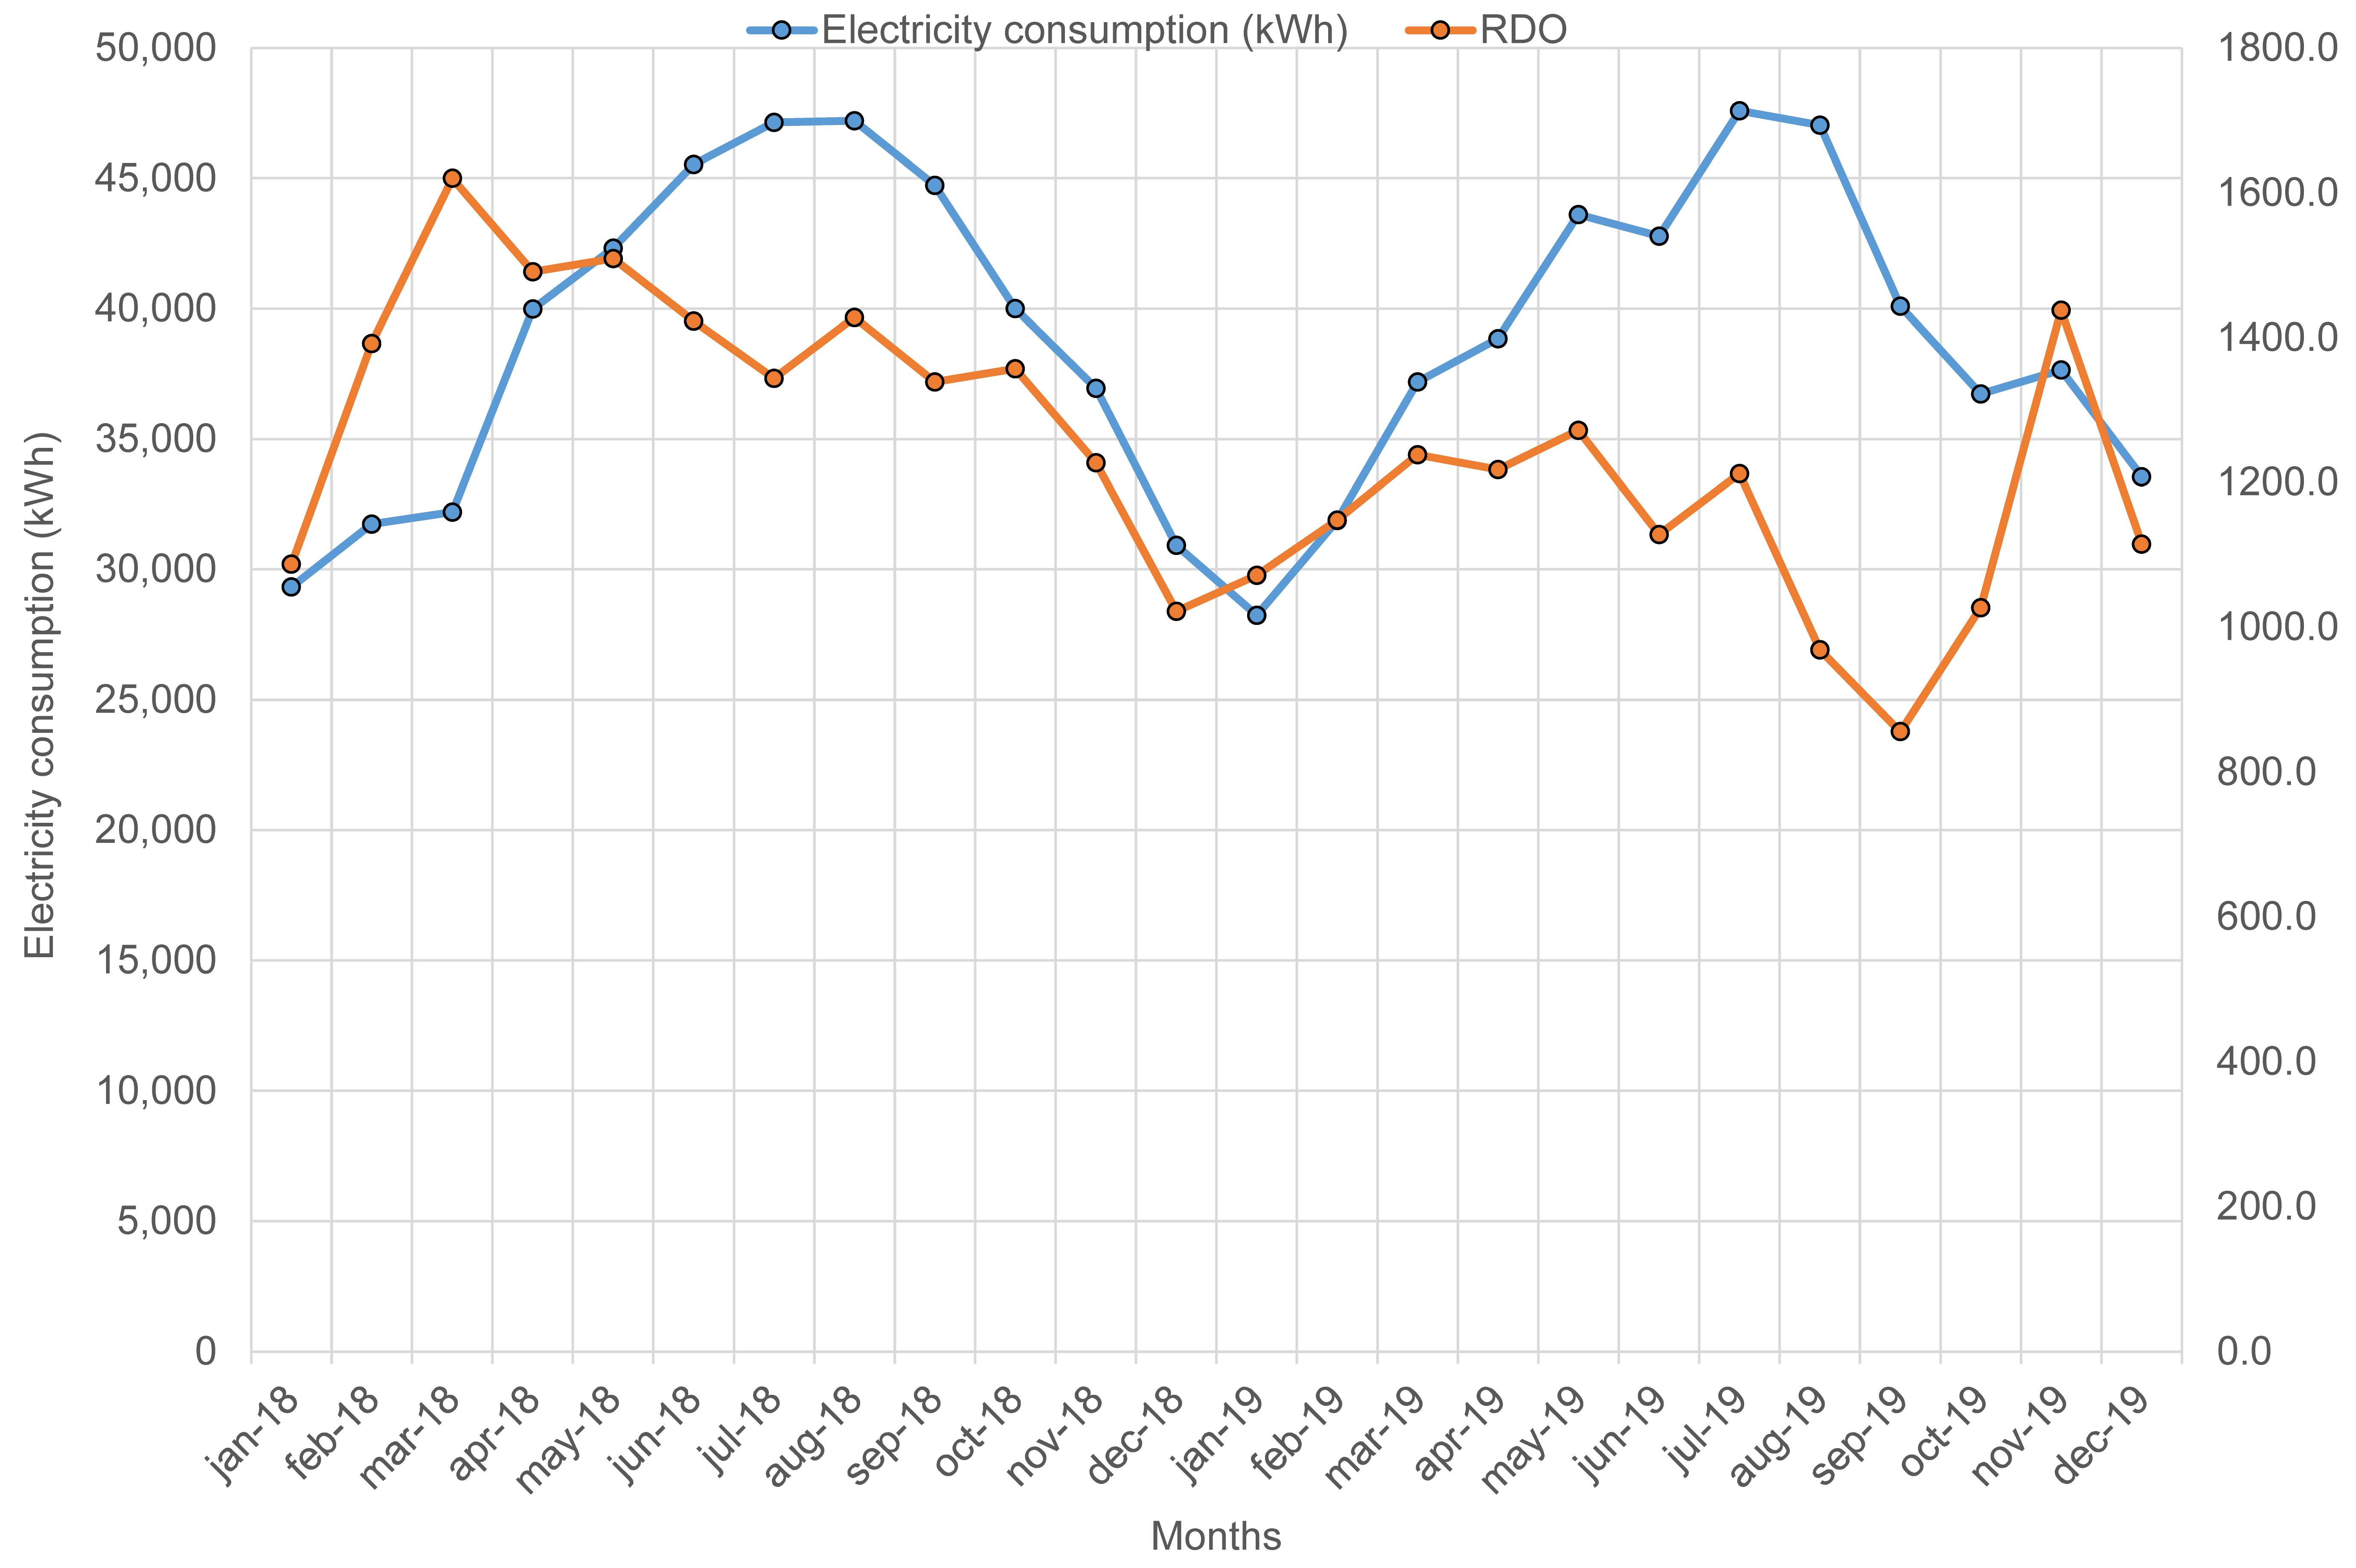
Punta las Cuevas Hotel is located at coordinates 22.1 degrees north and −80.43 degrees west. The climatology of the site is represented by an annual global radiation of 1616.9 kWh m 2 year . The month with the highest average radiation is July, with 160.6 kWh m 2 year . The average annual temperature is 24.5 °C for the humidity of 74.6% [22]. As a tropical country, the air conditioning of spaces and the hotel industry is decisive in ensuring the comfort of customers, hence the conditions for incorporating the degree days are essential.

3. Results

The most significant service provided by the hotel is the accommodation, for which it has 67 air-conditioned rooms, 64 standard doubles, and 3 quadruples, and satellite TV. In addition, it offers other facilities such as an a la carte restaurant, bar, barbecue, party room, swimming pool, infirmary, central safe, telephone, and parking. Another important service is the sale of food through the “Yaima” restaurant, with international food for 52 capacities, and the “El Crepúsculo” barbecue (40 capacities), an “Imago” party room (100 capacities) that works with night shows on weekends and offers rental services for company events. The lobby bar offers cocktail service from 10:00 a.m. to 3:00 a.m. It also has a swimming pool and beach area that provide picnic services and so-called pool parties with the participation of singers and DJs. In addition, it has a nursing service, rental of passive means for recreation, and softball matches. In addition, it has a parking area and offers dining services for the workers of the company and gastronomic activities for them.
In the study of energy consumption and production in the hotel, the service provision process was analyzed, and opportunities for improvement in energy performance linked to operational control and investment in technology were found.
It was verified that the entity covers its energy needs with the use of four energy carriers: electricity, diesel, gasoline, and liquefied gas, and the consumption structure of the energy carriers for the years 2018 and 2019 was obtained, see Figure 4, which infers that the highest consumption in both years within the hotel is electricity representing 95.46% and 96.30% with respect to the other carriers.
It was shown that the electrical energy in the installation is distributed in seven areas: rooms, services, kitchen, complex, administrative, exteriors, and warehouses. Figure 5 shows the stratification of the consumption and cumulative percentage of the use of electrical energy, in which it can be seen that the highest consumption of electricity in the hotel is found in the rooms, representing 71.26% with respect to the other areas of the hotel installation. To complete the analysis of the Pareto principle 80–20, that is, which areas represent 80% of the electrical energy consumption within the hotel, the service and kitchen areas can be included; among these, they represent more than 84% of the electricity consumption of the hotel.
The stratification was carried out in the area of rooms based on the energy capacity installed in equipment, processing capacity in the machines, and hours of switching on the equipment, which allowed for determining that the equipment that consumes the most electricity is the 1-ton Split with 92.64% compared to other consumers. This is due to their quantity and the high power that they possess; other factors that can influence them are their technological backwardness, lack of maintenance, misuse of these, and high temperatures during most of the year in Cuba.
In the study of energy consumption and production in the company. In Figure 6, constant variations in production (RDO) are noted, and the consumption of electrical energy (kWh) was verified as one of the causes of the non-efficient use of electrical energy in the productive process.
These variations in the behavior of production with respect to consumption in the years analyzed are due to:
  • From 18 January to 18 March, there was an increase in production and consumption (high season).
  • From 18 March to 18 September, there was a significant increase in consumption and a decrease in RDO; this generally corresponds to the increase in temperatures and services that do not involve lodging, as national tourism predominates.
  • From 18 September to 19 January, a decrease in consumption and production is observed due to being part of the low season.
  • From 19 January to 19 September, there is a correspondence between the behavior of both variables.
  • From 19 September to the end of the year, there is first an increase in RDO and a decrease in consumption; this could be due to energy savings and the type of tourism. In the second stage, there is a decrease in both variables.
The Pareto principle was made in order to determine the energy carrier with the highest consumption by identity, then the area with the highest consumption of the said carrier will be lengthened through the same process; with these results, a graph of consumption vs. room days was plotted. It was occupied taking as a reference that both variables are the ones with the greatest incidence in the consumption–production consequence of the hotel.

3.1. Baseline Energy (BLEn) and Energy Performance Indicator (EntPI)

For the presentation of the preliminary BLEn, it was decided to analyze the consumption of electrical energy and the RDO in the period 2018–2019, as shown in Figure 7. In the said figure, the consumption equation for both is presented, which is with a correlation level R 2 of 0.0378. This value represents a low correlation between the variables analyzed and the proposed model equation (a good correlation level is considered for R 2 values greater than 0.75). The energy not associated with production was 31,145 kWh, representing more than 80% of the total energy consumed by the company.
The low correlation between electricity consumption and RDO is due to the service of the Hotel; it is a temporary hotel, mainly for national tourism and business services, overnight services, and pool parties. In addition, cocktail services are in its air-conditioned bar lobby and party and meeting room. Other services are gastronomy for both passing tourists and their workers. These indicators do not consider the type of tourism, the time of year, and the type of climate in our country.
Therefore, it is necessary to continue analyzing to find an indicator that has a higher correlation. Thus, it was decided to take into account the incidence of climate in this area of the Caribbean. It was not considered to apply the data filtering technique due to the low correlation between consumption and RDO, so it is assumed that it does not reach the recommended correlation value of 0.75. This low level of correlation has been demonstrated in numerous works for these variables presented above. However, most researchers agree that the variable Days Degrees (DG) has a marked influence on the energy consumption of the installation if the air conditioning is the most consumed service in the Hotel. It is then necessary to incorporate the DG as an influencing variable in energy consumption [7,9,28,41,42,43].
Figure 8 shows the correlation graph between rooms occupied days adjusted with degree days ( RDO DG ) and electrical energy consumption (kWh). The graph is obtained from the historical records corresponding to the years 2018 and 2019. As can be seen, the correlation value exceeds 0.75, so it can be considered correct.
According to the results obtained, an increase in the correlation between consumption and production of the hotel can be observed; this is due to the high incidence of temperature in this area of the Caribbean, which brings with it an increase in the consumption of the main energy carrier of the installation which is electricity due to the increase in the use of air conditioning, which is one of the variables with the highest incidence in the consumption of said carrier.
Once the base period or line of best fit has been identified through a linear regression analysis, this can be considered as an energy baseline, from which the energy performance of the entity can be monitored and assessed, shown in Figure 8.
The target line is obtained using the procedure of excluding the values above the baseline from the domain and correlating only those points that represent good operating practices below the baseline. Note that the red points are now considered for the correlation of the goal line, obtaining an R 2 equal to 0.9194 in the years 2018–2019. All this is shown in Figure 9.
To achieve an improvement in the correlation of the previous graph, 8.33% of the data was filtered. For which a new baseline was obtained and, in turn, the corresponding target line for this case:
  • The energy baseline has an equation and correlation R 2 = 0.93;
  • The goal line has an equation and correlation R 2 = 0.97;
  • With the goal line obtained, an improvement in the data correlation and a 5.3% decrease in energy not associated with the process is observed, with 1088 kWh of energy saved.
These results can be seen in Figure 10, which coincide with those obtained by [9].
As shown in Figure 10, the correlation value ( R 2 ) of the energy goal line is approximately 0.97; it is possible to incorporate this goal line as the future energy baseline of the Hotel.
The target performance indicator was obtained from this target line [44], which is shown in Figure 11.
Training needs were identified in the implementation and operation, the plan was defined, and a record was established. In addition, the organization was able to provide internal information on its Energy Management System (EnMS): energy performance, savings or deviations, achievements by area or processes, and a process was implemented that allows anyone who works for, or on behalf of, the organization makes comments or suggestions for the improvement of the EnMS.

3.2. Verification of the Energy Performance Indicator through a Multivariable Analysis

The multivariable linear regression method (Y = Electricity Consumption (kWh), X 1 = DG and X 2 = RDO) has been made use of to develop EnB and EnPI and report the R-squared value as well as p-values. In this case, the EnB is obtained as Y = a X 1 + b X 2 + c.
Table 1 shows the variables to be analyzed and, in turn, the results that show the significance of these variables for the proposed multivariable regression model, where these variables have a high significance in this model.
Table 2 shows the indicators of the multivariable linear regression analysis, where the coefficient of determination can be seen, among others, which reaches a value of 0.90.
Figure 12 shows the relationship between the dependent variable against the simple percentile, and an almost linear behavior can be seen in this relationship, which means that the proposed model fits the analyzed data, obtaining the following equation of the model Y = 7429.18412 + 8.888 X 1 + 90.51074 X 2 .

3.3. Savings Opportunities

The savings opportunities are made to provide the hotel management with solutions to reduce the consumption of its main energy carriers; in this case, we focus on electrical energy, the largest carrier consumed by the installation. In this way, the hotel will increase its efficiency and, at the same time, its profits.

3.3.1. Air Conditioning

  • Clean the evaporators periodically. Check the correct operation of the defrost system;
  • Clean the filters of the air conditioning equipment weekly;
  • Reduce outside air intakes by properly sealing the doors, using hydraulic arms, and reducing the opening time of the doors through organizational measures;
  • Adjust the thermostats in air-conditioned rooms to 24 °C;
  • Turn off air conditioning equipment in empty rooms;
  • Use of curtains on windows and doors to reduce heat gain;
  • The selection of the rooms, without affecting the quality of the client, should be prioritized in those rooms that have a lower thermal load depending on the season, including programming of the hotel conditions that prioritize those that have less consumption, optimally avoiding the waste of electrical energy since this is the most consuming area of the hotel;
  • Substitute the common Splits for those with inverter technology, as these are much more efficient;
  • Replace the air conditioners in the management area with Split inverters according to the required capacity.

3.3.2. Lightning

Make the most of natural light, placing translucent paper on windows and glass doors, allowing light to pass through and rejecting heat:
  • Sectionalize lighting circuits to compartmentalize their use;
  • Illuminate specific points instead of illuminating backgrounds;
  • Paint walls, ceilings, and columns in light colors;
  • Lower the height of the lamps;
  • Change output signs from incandescent to light-emitting diodes (LEDs).

3.3.3. Electric Motors

  • Appropriate selection of electric motors in hotel water supply pumps, mainly in the swimming pool;
  • Achieve the longest periods of operation of the motor and its load at maximum efficiency (75–95% of its nominal power);
  • Verify repairs on rewound motors;
  • Evaluate the replacement of old or intensively used motors with high-efficiency standardized ones;
  • Keep the motor-load transmission means in good condition, as well as the motor bearings.

3.4. Proposal for the Substitution of Equipment

To increase energy efficiency and save electricity, one possibility to reduce energy consumption is the replacement of fluorescent luminaires with LED luminaires [45,46,47]. This study was carried out to replace the lighting in the outdoor areas of the hotel, which have 80 Illumenova brand light bulbs (CFL, 15 W, 6500 k, 120 V 60 Hz , E27). The proposal is to replace them with Gedeme brand bulbs (LED bulbs, E27, 9 W) sold nationally in wholesale stores.
The useful life of the Gedeme brand light bulb:
  • 50,000 h/365 days (12 working hours per day) = 50,000 h/(365 × 12) = 11 years. Income: Income is given by the savings brought by the new light bulbs installed, which have a value of 18.5 USD year . Expenses: You need to buy a total of 80 Gedema brand light bulbs which would cost 32 USD;
  • The interest rate used is 8%, established by the General Directorate of Treasury of the Central Bank of Cuba in Circulars 5/2011 and 2/2012;
  • The income tax is 35%, according to article 97 of Law 113 published in the Official Gazette No. 053 Ordinary of 21 November 2012;
  • The result of the processing is shown in Figure 13, where it can be seen from year 0 to the second year and the final results to be achieved in the eleventh year of operation of the light bulbs.
The graphic representation of Economic Indicators of the economic evaluation of the replacement of light bulbs in the hotel is given in Figure 13.
In short, the investment has an Internal Rate of Return (IRR) of 28%, a Net Present Value (NPV) of 71.5 USD, and an Investment Recovery Period (PRI) of 3.6 years.

3.5. Potential for Photovoltaic Generation on the Roofs of the Hotel Buildings

The efficiency of a photovoltaic solar system (PVSS) depends largely on its surroundings’ meteorological conditions. The climatic conditions in Cuba are ideal for the installation of the same due to the high solar irradiation existing in the place [48].
Solar photovoltaic technology is one of the renewable energy options that can currently help decarbonize the world by mitigating greenhouse gases, according to rules [49,50]. Among these are some popular simulation methods using energy modeling tools such as PVsyst, Sketchup, PV Online, RETScreen, etc [51], according to the rules [52,53,54,55].
The simulation with the PVSyst to determine the potentialities of photovoltaic generation on the roofs of the hotel buildings showed that there is an available area of building roofs of 2057.78 m 2 , an area where there is the possibility of installing a total of 1011 modules photovoltaic of the DSM-380 model, with a generation capacity of 384 kilowatt-peak ( kW p ) and a real annual generation of 506.5 MWh year .
Figure 14 shows the behavior of the photovoltaic solar system during the year.
Figure 14 shows the energy production, the system losses, and the losses due to its collection during the year. The months with the highest production are March and April due to the level of irradiation, the temperature, and the efficiency of the PVSS in these months. System losses do not have large variations during the year. Collection losses are higher in the months of greatest production and in the summer months.
Figure 15 shows the breakdown of losses in the PVSS. The greatest losses are given by the level and type of radiation, mainly due to the high percentage of diffuse radiation in Cuba, due to the high temperatures existing in the place, and losses due to the quality and type of solar panels. For a higher quality of performance, five sub-arrangements were made, and this also allows for lower prices due to the capacity of the inverters used.

4. Discussion

Although the climate strongly influences consumption, in particular, the consumption of electricity, this factor is frequently omitted in the implementation of systems of energy management. A relevant parameter to take into account is the influence of the outside temperature is the Degree Days.
This study shows that an important step in achieving greater efficient energy in hotels is an adequate selection and implementation of EntPI. Defining an effective is required includes physical parameters, such as temperature exterior, and operational parameters, such as occupancy level. In Cuban hotels, current practices make the high consumption of electricity and high energy costs, partly due to the absence of an effective Energy Management System. The proposed EntP is based on the data currently handled by the staff of the installation and is quite easy to calculate, which considerably facilitates its implementation in the hotels studied. This EntP can be implemented in other Cuban (and foreign) hotels based on its characteristics.
A correlation analysis was performed where it was shown that the variable ( RDO DG ) has a significant influence on the energy consumption model for the hotel ( R 2 = 0.97).
Another novel point in this work is the use of renewable energy sources, which would allow a saving of electrical energy, which is the energy carrier that consumes the most of the installation, for which it would be directly influencing it, as with the change of luminaire that would bring economic savings. All this would contribute to the protection of the environment and the greater competitiveness of the hotel.
Table 3 shows the results chosen by other authors in similar studies varying the energy performance indicator.
In the case of hotels, it is not so easy to obtain an energy indicator. The construction characteristics of the hotel, its geographic location, the quality of services, and its size are some of the variables that are taken into account when proposing an energy performance indicator. In the case of the Caribbean, in addition to this, there is the possibility of having a transit-type hotel, a tourist who makes use of its services without staying directly at the hotel. From this, it is inferred that, on many occasions, the presented energy consumption does not have to be directly related to the level of occupancy in rooms that it can present. Table 3 presents the correlation levels for various indicators used in hotels, the correlation between the most significant variables that affect energy consumption in the hotel facility was verified by means of two mathematical methods. It should be noted that the best R 2 correlations are achieved for those that take into account the degree days in their analysis considering the occupancy level. For the case study, R 2 correlation level of 0.97 is reached for kWh RDO DG , after filtering out some values with anomalous behavior within the sample used. The EntPI set for the study is 0.1 kWh RDO DG ; this energy performance indicator value is known as critical EntPI, i.e., it is always recommended for the hotel to be below this value. It is, therefore, a necessary contribution for the hotel to have a value that can characterize at a given time how the hotel is performing in terms of energy management.

5. Conclusions

For the Punta la Cueva hotel, it was possible to determine that the fundamental energy carrier is electricity, representing more than 95% of the total consumption of carriers in the facility for the years 2018 and 2019. The consumption of electrical energy for the year 2019 was 465,183 kWh, 0.6% less than the previous year. For their part, the areas with the most significant consumption are Rooms, Services, and Kitchen (together 84.64% of the total).
A correlation analysis was performed where it was shown that the variable RDO DG has a significant influence on the energy consumption model for the hotel ( R 2 = 0.97). The proposed target line whose consumption model brings energy savings not associated with the production of 1028 kWh with respect to the baseline (5.3%). Through multivariate analysis, a correlation above 0.90 was obtained, which validates the relationship between the variables.
A simulation was carried out in the PVSyst software, resulting in the possibility of installing 1011 photovoltaic modules of the DSM-380 model, with a generation capacity of 384 kWp and a real annual generation of 506.5 MWh year .
The main findings of this research are:
  • This is a method of easy application based on basic mathematical concepts and energy management;
  • The reduction of variables that allows easy adjustments. At the beginning of the experiment, there were a large number of variables that affect the energy consumption in the installation and we ended up proposing only three with a high correlation;
  • The reduction of experiments that brings a significant reduction in computational and execution time, allowing faster decision-making with fewer resources (materials, use of equipment, indirect materials or energy);
  • An energy performance indicator is proposed that allows us to predict the behavior of the installation’s consumption over time and, in turn, reduce it;
  • This is a method of proposing savings opportunities is provided with its economic valuation;
  • The use of renewable energy sources is proposed to take advantage of the roofs of the facility and reduce the consumption of electricity by fossil fuels. This will prevent the emission of polluting agents into the atmosphere.

Author Contributions

Conceptualization, L.A.I.C. and A.L.Á.G.; Methodology, L.A.I.C. and A.L.Á.G.; Writing—original draft preparation, L.A.I.C., A.L.Á.G., J.R.-R. and J.M.Á.-A.; Writing—review and editing, L.A.I.C., A.L.Á.G., J.R.-R. and J.M.Á.-A.; Supervision, J.R.-R. and J.M.Á.-A. All authors have read and agreed to the published version of the manuscript.

Funding

This research received no external funding.

Institutional Review Board Statement

Not applicable.

Informed Consent Statement

Not applicable.

Acknowledgments

This research was carried out with the help of the Autonomous University of Querétaro and the Center for Energy and Environment Studies of the University of Cienfuegos.

Conflicts of Interest

The authors declare no conflict of interest.

References

  1. Iturralde Carrera, L.Á.; Monteagudo Yanes, J.P.; Castro Perdomo, N.A. La eficiencia energética y la competitividad empresarial en América del norte. Rev. Univ. Soc. 2021, 13, 479–489. [Google Scholar]
  2. Santos, J.A.; Fraga, H.; Malheiro, A.C.; Moutinho-Pereira, J.; Dinis, L.T.; Correia, C.; Moriondo, M.; Leolini, L.; Dibari, C.; Costafreda-Aumedes, S.; et al. A review of the potential climate change impacts and adaptation options for European viticulture. Appl. Sci. 2020, 10, 3092. [Google Scholar] [CrossRef]
  3. Uddin, M.N.; Bokelmann, W.; Entsminger, J.S. Factors affecting farmers’ adaptation strategies to environmental degradation and climate change effects: A farm level study in Bangladesh. Climate 2014, 2, 223–241. [Google Scholar] [CrossRef] [Green Version]
  4. Han, P.; Tong, Z.; Sun, Y.; Chen, X. Impact of Climate Change Beliefs on Youths’ Engagement in Energy-Conservation Behavior: The Mediating Mechanism of Environmental Concerns. Int. J. Environ. Res. Public Health 2022, 19, 7222. [Google Scholar] [CrossRef] [PubMed]
  5. Raza, A.; Razzaq, A.; Mehmood, S.S.; Zou, X.; Zhang, X.; Lv, Y.; Xu, J. Impact of climate change on crops adaptation and strategies to tackle its outcome: A review. Plants 2019, 8, 34. [Google Scholar] [CrossRef] [PubMed] [Green Version]
  6. Hasan, A.M.; Trianni, A. A review of energy management assessment models for industrial energy efficiency. Energies 2020, 13, 5713. [Google Scholar] [CrossRef]
  7. Ochoa, G.V. Application of equivalent occupation method as a tool for energy management in hotel sector. Int. J. Energy Econ. Policy 2018, 8, 187–192. [Google Scholar]
  8. Bruni, G.; De Santis, A.; Herce, C.; Leto, L.; Martini, C.; Martini, F.; Salvio, M.; Tocchetti, F.A.; Toro, C. From Energy Audit to Energy Performance Indicators (EnPI): A Methodology to Characterize Productive Sectors. The Italian Cement Industry Case Study. Energies 2021, 14, 8436. [Google Scholar] [CrossRef]
  9. Marriaga, M.A.P.; Contreras, M.P.D.; Salas, A.P.; Chamorro, M.V.; Zarante, P.H.B. Calculation of Energy Performance Indicators of a Company in the Hotel Sector. Contemp. Eng. Sci. 2018, 11, 3609–3619. [Google Scholar] [CrossRef]
  10. Lira, J.M.S.; Salgado, E.G.; Beijo, L.A. Which factors does the diffusion of ISO 50001 in different regions of the world is influenced? J. Clean. Prod. 2019, 226, 759–767. [Google Scholar] [CrossRef]
  11. Marimon, F.; Casadesús, M. Reasons to adopt ISO 50001 energy management system. Sustainability 2017, 9, 1740. [Google Scholar] [CrossRef] [Green Version]
  12. Kanneganti, H.; Gopalakrishnan, B.; Crowe, E.; Al-Shebeeb, O.; Yelamanchi, T.; Nimbarte, A.; Currie, K.; Abolhassani, A. Specification of energy assessment methodologies to satisfy ISO 50001 energy management standard. Sustain. Energy Technol. Assess. 2017, 23, 121–135. [Google Scholar] [CrossRef]
  13. da Silva Gonçalves, V.A.; dos Santos, F.J.M.H. Energy management system ISO 50001: 2011 and energy management for sustainable development. Energy Policy 2019, 133, 110868. [Google Scholar] [CrossRef]
  14. Durakbasa, N.M. Micro-and nano-scale manufacturing development through precision metrology. TQM J. 2016, 28, 685–703. [Google Scholar] [CrossRef]
  15. de Sousa Jabbour, A.B.L.; Verdério Júnior, S.A.; Jabbour, C.J.C.; Leal Filho, W.; Campos, L.S.; De Castro, R. Toward greener supply chains: Is there a role for the new ISO 50001 approach to energy and carbon management? Energy Effic. 2017, 10, 777–785. [Google Scholar] [CrossRef] [Green Version]
  16. Rampasso, I.S.; Melo Filho, G.P.; Anholon, R.; de Araujo, R.A.; Alves Lima, G.B.; Perez Zotes, L.; Leal Filho, W. Challenges presented in the implementation of sustainable energy management via ISO 50001: 2011. Sustainability 2019, 11, 6321. [Google Scholar] [CrossRef] [Green Version]
  17. Laskurain, I.; Ibarloza, A.; Larrea, A.; Allur, E. Contribution to energy management of the main standards for environmental management systems: The case of ISO 14001 and EMAS. Energies 2017, 10, 1758. [Google Scholar] [CrossRef] [Green Version]
  18. Jamil, I.; Zhao, J.; Zhang, L.; Rafique, S.F.; Jamil, R. Uncertainty analysis of energy production for a 3 × 50 MW AC photovoltaic project based on solar resources. Int. J. Photoenergy 2019, 2019, 1056735. [Google Scholar] [CrossRef]
  19. Lalith Pankaj Raj, G.; Kirubakaran, V. Energy efficiency enhancement and climate change mitigations of SMEs through grid-interactive solar photovoltaic system. Int. J. Photoenergy 2021, 2021, 6651717. [Google Scholar] [CrossRef]
  20. Pérez-Denicia, E.; Fernández-Luqueño, F.; Vilariño-Ayala, D. Suitability assessment for electricity generation through renewable sources: Towards sustainable energy production. CT&F-Cienc. Tecnol. Futuro 2021, 11, 109–122. [Google Scholar]
  21. Thangavelu, S.; Umapathy, P. Design of new high step-up DC-DC converter Topology for solar PV applications. Int. J. Photoenergy 2021, 2021, 7833628. [Google Scholar] [CrossRef]
  22. Carrera, L.A.I.; Borges, R.J.; Santana, E.M.; González, A.L.Á. Potencialidades de generación fotovoltaica sobre la cubierta del edificio crai de la universidad de cienfuegos. Univ. Soc. 2022, 14, 318–330. [Google Scholar]
  23. Zhou, X.; Mei, Y.; Liang, L.; Fan, Z.; Yan, J.; Pan, D. A dynamic energy benchmarking methodology on room level for energy performance evaluation. J. Build. Eng. 2021, 42, 102837. [Google Scholar] [CrossRef]
  24. Dibene-Arriola, L.M.; Carrillo-González, F.M.; Quijas, S.; Rodríguez-Uribe, M.C. Energy efficiency indicators for hotel buildings. Sustainability 2021, 13, 1754. [Google Scholar] [CrossRef]
  25. Teng, Z.R.; Wu, C.Y.; Xu, Z.Z. New energy benchmarking model for budget hotels. Int. J. Hosp. Manag. 2017, 67, 62–71. [Google Scholar] [CrossRef]
  26. Jin, Y.; Long, Y.; Jin, S.; Yang, Q.; Chen, B.; Li, Y.; Xu, L. An energy management maturity model for China: Linking ISO 50001:2018 and domestic practices. J. Clean. Prod. 2021, 290, 125168. [Google Scholar] [CrossRef]
  27. Poveda-Orjuela, P.P.; García-Díaz, J.C.; Pulido-Rojano, A.; Cañón-Zabala, G. ISO 50001:2018 and its application in a comprehensive management system with an energy-performance focus. Energies 2019, 12, 4700. [Google Scholar] [CrossRef] [Green Version]
  28. Poveda-Orjuela, P.P.; García-Díaz, J.C.; Pulido-Rojano, A.; Cañón-Zabala, G. Parameterization, analysis, and risk management in a comprehensive management system with emphasis on energy and performance (ISO 50001:2018). Energies 2020, 13, 5579. [Google Scholar] [CrossRef]
  29. Torres, Y.D.; Plasencia, M.Á.G.; López, A.V.; Cabrera, L.P.; Barrios, O.C.; Haeseldonck, D. Implementation of the energy management standard NC 50001 (up to energetic-planning phase) in a telecommunication company. Ing. Energ. 2020, 41, 6. [Google Scholar]
  30. Guayanlema, V.; Fernández, L.; Arias, K. Análisis de indicadores de desempeño energético del Ecuador. Enerlac 2017, 1, 121–139. [Google Scholar]
  31. González, A.M.; Nordelo, A.B.; Yanes, J.P.M.; Bedregal, H.R.V.; Toca, C.E.S. Nuevos índices de consumo energético para hoteles tropicales; New energy indicators for tropical hotels. Ing. Energ. 2017, 38, 198–207. [Google Scholar]
  32. Rodríguez, L.R.; Insuasti, J.A.P.; Peña, W.Y.; Sierra, C.O.; Arroyave, C.P.S.; Soto, C.A.P.; Vispo, N.F.S.; Pinchao, J.M.H.; Torres, R.D.G.; Lara, G.R. Método de cálculo del índice de eficiencia energética de los hoteles. Rev. Tecnol.-ESPOL 2017, 30. [Google Scholar]
  33. Salem, R.; Bahadori-Jahromi, A.; Mylona, A.; Godfrey, P.; Cook, D. Energy performance and cost analysis for the nZEB retrofit of a typical UK hotel. J. Build. Eng. 2020, 31, 101403. [Google Scholar] [CrossRef]
  34. Palani, H.; Karatas, A. Identifying Energy-Use Behavior and Energy-Use Profiles of Hotel Guests. Appl. Sci. 2021, 11, 6093. [Google Scholar] [CrossRef]
  35. Álvarez Guerra Plasencia, M.A.; Cabello Eras, J.J.; Sousa Santos, V.; Sagastume Gutiérrez, A.; Haeseldonckx, D.; Vandecasteele, C. Experiencias en la Utilización de Información Meteorológica para el Pronóstico y Control del Consumo de Electricidad en Hoteles. 2018. Available online: http://hdl.handle.net/20.500.11765/9949 (accessed on 1 October 2022).
  36. Barrera, J.J. Propuesta de un Plan de Eficiencia Energética en el Hotel Chrisban Hotel Boutique. 2021. Available online: http://repositorio.uan.edu.co/handle/123456789/4612 (accessed on 5 October 2022).
  37. Alvarado-Torres, S.M. Estrategias Pasivas Para Mejorar el Confort y Disminuir el Consumo Energético en Hoteles de Clima Templado-HúMEDO. Caso de Estudio: Proyecto Hotelero en Pereira, Colombia. 2021. Available online: https://hdl.handle.net/10983/26709 (accessed on 15 October 2022).
  38. Duric, Z.; Potočnik Topler, J. The role of performance and environmental sustainability indicators in hotel competitiveness. Sustainability 2021, 13, 6574. [Google Scholar] [CrossRef]
  39. Torres Navarro, C.; Malta Callegari, N.; Jara Olave, H. Modelos de regresión y diseño de línea base para indicadores energéticos en una empresa siderúrgica. Ing. Energ. 2021, 42. Available online: http://scielo.sld.cu/scielo.php?script=sci_arttext&pid=S1815-59012021000100004 (accessed on 5 October 2022).
  40. Laayati, O.; Bouzi, M.; Chebak, A. Smart energy management: Energy consumption metering, monitoring and prediction for mining industry. In Proceedings of the 2020 IEEE 2nd International Conference on Electronics, Control, Optimization and Computer Science (ICECOCS), Kenitra, Morocco, 2–3 December 2020; pp. 1–5. [Google Scholar]
  41. Mendoza, R.P.C.; Yanes, J.P.M.; Nordelo, A.B.; Oqueña, E.C.Q. Línea de Base Energética en la implementación de la norma ISO 50001. Estudios de casos. El Hombre y la Máquina 2015, 46, 137–143. [Google Scholar]
  42. Quesada-Céspedes, J.A. Modelo de Gestión de Energía según las Normas ISO 50000 Para el HOTEL del Sur y Desarrollo de un Prototipo Para Monitorear Datos Energéticos. 2022. Available online: https://repositoriotec.tec.ac.cr/handle/2238/13941 (accessed on 25 October 2022).
  43. Tournaki, S.; Tsoutsos, R.; Morell, I.; Guerrero, Z.; Urosevic, A.; Derjanecz, C.; Nunez, C.; Rata, M.; Biscan, S.; Pouffary, S.; et al. Towards Nearly Zero Energy Hotels Technical Analysis and Recommendations. In Proceedings of the 5th International Conference on Renewable Energy Sources and Energy Efficiency, Istanbul, Turkey, 21–23 October 2021; pp. 21–23. [Google Scholar]
  44. Moghadasi, M.; Izadyar, N.; Moghadasi, A.; Ghadamian, H. Applying machine learning techniques to implement the technical requirements of energy management systems in accordance with ISO 50001:2018, an industrial case study. Energy Sources Part Recover. Util. Environ. Eff. 2021, 1–18. [Google Scholar] [CrossRef]
  45. Campisi, D.; Gitto, S.; Morea, D. Economic feasibility of energy efficiency improvements in street lighting systems in Rome. J. Clean. Prod. 2018, 175, 190–198. [Google Scholar] [CrossRef]
  46. Yoomak, S.; Ngaopitakkul, A. Optimisation of lighting quality and energy efficiency of LED luminaires in roadway lighting systems on different road surfaces. Sustain. Cities Soc. 2018, 38, 333–347. [Google Scholar] [CrossRef]
  47. Jhunjhunwala, A.; Vasudevan, K.; Kaur, P.; Ramamurthi, B.; Bitra, S.; Uppal, K. Energy efficiency in lighting: AC vs. DC LED lights. In Proceedings of the 2016 First International Conference on Sustainable Green Buildings and Communities (SGBC), Chennai, India, 18–20 December 2016; pp. 1–4. [Google Scholar]
  48. González, A.L.Á.; Carrera, L.A.I.; Borges, R.J.; Yanes, J.P.M.; Muñoz, M.G. Potencialidades de generación fotovoltaica sobre cubiertas de edificaciones en una instalación hotelera. Univ. Soc. 2022, 14, 565–573. [Google Scholar]
  49. Rokonuzzaman, M.; Mishu, M.K.; Amin, N.; Nadarajah, M.; Roy, R.B.; Rahman, K.S.; Buhari, A.M.; Binzaid, S.; Shakeri, M.; Pasupuleti, J. Self-Sustained autonomous wireless sensor network with integrated solar photovoltaic system for internet of smart home-building (IoSHB) applications. Micromachines 2021, 12, 653. [Google Scholar] [CrossRef]
  50. Agyekum, E.B.; Mehmood, U.; Kamel, S.; Shouran, M.; Elgamli, E.; Adebayo, T.S. Technical performance prediction and employment potential of solar PV systems in cold countries. Sustainability 2022, 14, 3546. [Google Scholar] [CrossRef]
  51. Belmahdi, B.; El Bouardi, A. Solar potential assessment using PVsyst software in the northern zone of Morocco. Procedia Manuf. 2020, 46, 738–745. [Google Scholar] [CrossRef]
  52. Sharma, S.; Kurian, C.P.; Paragond, L.S. Solar PV system design using PVsyst: A case study of an academic Institute. In Proceedings of the 2018 International Conference on Control, Power, Communication and Computing Technologies (ICCPCCT), Kannur, India, 23–24 March 2018; pp. 123–128. [Google Scholar]
  53. Villegas-Mier, C.G.; Rodriguez-Resendiz, J.; Álvarez-Alvarado, J.M.; Jiménez-Hernández, H.; Odry, Á. Optimized Random Forest for Solar Radiation Prediction Using Sunshine Hours. Micromachines 2022, 13, 1406. [Google Scholar] [CrossRef]
  54. Węglarski, M.; Jankowski-Mihułowicz, P.; Chamera, M.; Dziedzic, J.; Kwaśnicki, P. Designing Antennas for RFID Sensors in Monitoring Parameters of Photovoltaic Panels. Micromachines 2020, 11, 420. [Google Scholar] [CrossRef] [Green Version]
  55. Martínez-Sánchez, R.A.; Rodriguez-Resendiz, J.; Álvarez-Alvarado, J.M.; Macías-Socarrás, I. Solar Energy-Based Future Perspective for Organic Rankine Cycle Applications. Micromachines 2022, 13, 944. [Google Scholar] [CrossRef]
  56. Huovila, A.; Tuominen, P.; Airaksinen, M. Effects of building occupancy on indicators of energy efficiency. Energies 2017, 10, 628. [Google Scholar] [CrossRef] [Green Version]
  57. Eras, J.C.; Santos, V.S.; Gutierrez, A.S.; Vandecasteele, C. Data supporting the improvement of forecasting and control of electricity consumption in hotels. Data Brief 2019, 25, 104147. [Google Scholar] [CrossRef] [PubMed]
  58. Marriaga, M.A.P.; Contreras, M.P.D.; Salas, A.P.; Chamorro, M.V.; Zarante, P.H.B. Analysis of the Potential for Energy Savings in a Company in the Hotel Sector. Contemp. Eng. Sci. 2018, 11, 2865–2873. [Google Scholar] [CrossRef]
  59. eddine Mechri, H.; Amara, S. Investigation and analysis of energy and water use of hotel buildings in Tunisia. Energy Build. 2021, 241, 110930. [Google Scholar] [CrossRef]
  60. Molina González, A.; Velarde Bedregal, H.R.; Borroto Nordelo, A.E.; Santiesteban Toca, C.E.; Monteagudo Yanes, J.P. Nuevos índices de consumo energético para hoteles tropicales. Ing. Energ. 2017, 38, 198–207. [Google Scholar]
  61. Eras, J.J.C.; Santos, V.S.; Gutiérrez, A.S.; Plasencia, M.Á.G.; Haeseldonckx, D.; Vandecasteele, C. Tools to improve forecasting and control of the electricity consumption in hotels. J. Clean. Prod. 2016, 137, 803–812. [Google Scholar] [CrossRef]
Figure 1. The PDCA cycle model (Plan, Do, Check, Act).
Sustainability 15 01568 g001
Figure 2. Methodology used, based on the standard ISO 50001.
Sustainability 15 01568 g002
Figure 3. Distribution of the consumption of the energy carriers of the hotel by areas.
Sustainability 15 01568 g003
Figure 4. Consumption structure of energy carriers in Equivalent Tons (TCC). (a) in the year 2018; and (b) in the year 2019.
Sustainability 15 01568 g004
Figure 5. Structure of electricity consumption by areas.
Sustainability 15 01568 g005
Figure 6. Electricity consumption and production over time.
Sustainability 15 01568 g006
Figure 7. Dispersion graph of energy vs. production (RDO) (2018–2019).
Sustainability 15 01568 g007
Figure 8. Dispersion graph of energy consumption vs. production ( RDO DG ) (2018–2019).
Sustainability 15 01568 g008
Figure 9. Baseline and target line of energy consumption vs. RDO DG (2018–2019).
Sustainability 15 01568 g009
Figure 10. Baseline and target line corresponding to the filtered data of energy consumption vs. RDO DG (2018–2019).
Sustainability 15 01568 g010
Figure 11. Graph of the energy performance indicator (2018–2019).
Sustainability 15 01568 g011
Figure 12. Normal probability plot.
Sustainability 15 01568 g012
Figure 13. Economic indicators of the investment in the replacement of light bulbs in the Hotel Punta la Cueva, Cienfuegos.
Sustainability 15 01568 g013
Figure 14. Efficiency of the PVSS during the months of the year.
Sustainability 15 01568 g014
Figure 15. PVSS loss graph.
Sustainability 15 01568 g015
Table 1. Analysis parameters of the multiple linear regression method.
VariablesCoefficientsTypicalTypical ErrorProbability StatisticLower 95%Superior 95%
Y7429.183268.782.270.03631.3914,226.98
X 1 8.892.204.040.00064.3213.46
X 2 90.516.6813.567.45 × 10 12 76.63104.40
Table 2. Regression statistics.
Regression Analysis ParametersValues
Multiple correlation coefficient0.95
determination coefficient R 2 0.90
R 2 tight0.89
Typical error2016.58
Observations24
Table 3. Analysis of energy performance indicators most used in the hotel industry.
Energy Performance Indicator UsedCorrelation Obtained ( R 2 )AuthorLinear RegressionEMS
kWh People -[56]simpleISO 50001:2011
kWh RDO 0.51[32]simpleISO 50001:2011
kWh month RDO 0.65[57]simpleISO 50001:2018
kWh month 0.67[9,58]simpleISO 50001:2011
kWh m 2 0.72[59]simpleISO 50001:2018
kWh Hours Degrees 0.73[60]simpleISO 50001:2011
kWh Degree Days 0.77[41]simpleISO 50001:2011
kWh Equivalent Occupation 0.80[7]simpleISO 50001:2011
kWh RDO Equivalent 0.90[32]simpleISO 50001:2011
kWh Day Rooms Degree Day 0.91[61]simpleISO 50001:2011
kWh RDO DG 0.92[35]simpleISO 50001:2011
kWh E C A 0.77[39]multipleISO 50001:2018
kWh DG RDO 0.90Our workmultipleISO 50001:2018
kWh DG RDO 0.97Our worksimpleISO 50001:2018
Disclaimer/Publisher’s Note: The statements, opinions and data contained in all publications are solely those of the individual author(s) and contributor(s) and not of MDPI and/or the editor(s). MDPI and/or the editor(s) disclaim responsibility for any injury to people or property resulting from any ideas, methods, instructions or products referred to in the content.

