1. Introduction
The general improvement in the quality of life that has been attained in recent decades has led to an increased aging of the world’s population. Considering only the example of Europe, the decrease in birth rates and increase in life expectancy has resulted in a larger proportion of elderly people [
1]. According to the statistics reported in [
1], the number of people older than 65 will increase from 90.5 million at the beginning of 2019 to 129.8 million in 2050. The 65–74 age group will increase by 16.6%, while the 75–84 age group will increase by 56.1% and the under-55 age group will decrease by 13.5%. Such an aging population naturally has an impact on the entire society and the services it needs, including transportation. It is well known that older people have more limited mobility, poorer visual abilities, longer reaction times, and often physical limitations that do not allow them to safely navigate traffic. Therefore, many older people prefer to walk, which increases the percentage of pedestrians, especially in urban areas where the distances to be covered are shorter. However, this does not mean that they are safe: it is well known that the survival probability when pedestrians are involved in a crash decreases with increasing age, meaning that the older the pedestrian involved in a collision, the greater the probability of serious injuries or even death [
2]. This is also confirmed by alarming crash statistics involving elderly pedestrians. The Road Safety Observatory [
3] calculated that 50% of pedestrians involved in accidents are over 65 years old, an increase of 7% compared to 2010. Slovenia reported a slightly better—but still consistent—trend in these statistics: 31% of all pedestrians involved in accidents were older than 65.
This paper aims to shed light on the situation of elderly pedestrian safety in Slovenia by analyzing the crash data reported in the national accident database. The ultimate goal is to understand if there are some repetitive patterns and to propose effective measures that could be put into practice by road safety stakeholders to improve the road safety of older people. In addition, a regression model based on the crash data of older pedestrians was developed to predict the crash severity of the selected accident typology and to highlight the road design elements with the greatest influence on elderly pedestrian crashes.
This paper is organized into five sections. The Introduction is followed by a literature review to highlight the existing evidence on older pedestrian safety and the accident severity prediction models already applied in other scientific works. The Methodology section that follows explains the theoretical background of the statistical tests and methods used in the research and briefly discusses the database and data collection technique. In the Results section, the statistical analyses of the obtained crash data are presented and the normality tests and developed regression model are introduced. Finally, in the Discussion and Conclusion sections, the main observations and findings are summarized and specific suggestions are made to improve the road safety of elderly pedestrians.
2. Related Works
The problem of elderly pedestrian road safety was highlighted as early as the 1990s, when Zegeer et al. [
4] conducted an analysis of two U.S. crash databases—the North Carolina motor vehicle crash file and the FARS data—for the period 1980–1990, taking into account time factors, roadway and location factors, vehicle maneuvers, and alcohol involvement. Based on their findings, they suggested a number of educational and technical actions that U.S. practitioners could take to improve elderlies’ safety.
With the increase of the interest in walking and the growth of aging, the topic gained new momentum among researchers worldwide in the 2000s. In 2016, Tournier et al. [
5] conducted a comprehensive review of the problems older pedestrians face in traveling by foot. They identified three main difficulties: reduced walking ability and insecurity when trying to avoid an obstacle, wayfinding and navigation skills that decline with increasing age, and road crossing. In [
6], the authors presented the results of a survey conducted among a group of older people in southern Ontario. The results confirmed three factors that affect older pedestrians’ susceptibility to accidents, namely, walking difficulties, fear of falling, and the capability to judge a crossing. Nakawaga [
7] used a semi-structured survey to investigate accidents between a vehicle and pedestrians who were 65 years of age or older. The test group consisted of 18 elderly pedestrians, and most of them identified self-failure as the cause of the accident in which they were involved. In addition, the authors identified different classes of accidents based on four aspects: the type of self-regulation, the motivation of self-regulation, the cause of self-regulation failure, and the characteristics of the accident caused by self-regulation failure.
The interest in the safety of elderly pedestrians is also confirmed by the will of researchers to find an appropriate way to model the different characteristics of accidents involving this type of road user. Lee et al. [
8] developed a negative binomial regression to model accident severity, i.e., the number of accidents with serious injuries or fatalities and the number of accidents with minor injuries. In [
9], Kim used a multinomial logistic regression to predict the number of collisions per age group. The authors of [
10] used a Bayesian logistic regression model to understand the main causes of fatal and serious injury crashes involving elderly pedestrians and a Bayesian network model to show the relationship between the identified significant factors and crash severity. The models identified vehicle maneuver, lighting conditions, road type, and shoulder type as being influential toward crash severity. Kamboozia et al. [
11] focused on elderly pedestrian accidents on rural roads in Iran and compared the results of multiple logistic regression and multilevel perceptron in modeling pedestrian accident severity using 11 independent variables. The authors of [
12] compared a fixed-parameter model and an ordered probit model with random parameters to model accident severity using a six-year accident database, and the ordered probit model with random parameters fitted better than the fixed-parameter model. Finally, a valuable work was also conducted by Alwari and Ali [
13]: the authors developed a multiple linear regression model to determine the major causes leading to crashes and applied it to two time periods: from 1979 to 2000 and from 2010 to 2017. Interestingly, they noticed that while the greatest problem in the first period was the vehicle status (i.e., poor maintenance), during the second period the highest effect was due to pedestrians, confirming the need for further studies.
In this paper, the authors present the results of a statistical analysis based on a 10-year database of accidents involving elderly pedestrians. The accidents are first analyzed using general statistics to understand their characteristics. They are then tested for normality and, finally, an ordinal logistic model is chosen to model accident severity and to identify the most influential factors on traffic safety among the elderly.
For completeness, a general limitation is noted here. When examining accident data, especially pedestrian accident data, it should be noted that the reporting rate is quite high, as is frequently highlighted by [
14]. Even if accidents are reported, the lack of information is an important issue. Thus, although the Slovenian national database on traffic accidents contains very detailed information, it should not be forgotten that these general biases might exist.
4. Results
Results are presented in the next three subsections, first as findings from the statistical analysis of elderly pedestrian accident data, then elaborating normality tests to assess the distribution followed by the data, and finally, by presenting the results and interpretation of the regression model.
4.1. Statistical Analysis of Elderly Pedestrian Accident Data
Among all the data recorded in the considered database, five different categories were considered: firstly, the trend over the years of accidents involving elderly pedestrians was analyzed; then the effect of time, road, and external conditions was taken into account; finally, the causes leading to crashes were highlighted.
4.1.1. Trend of Pedestrian Crash Data over the Years
The first factor considered in the analysis is the trend of pedestrian accidents over time. A 10-year period was used for the analyses, with
Figure 1 showing a comparison of the trend for different age groups of pedestrians. Specifically, five age groups were considered: children, from 0 to 14 years; young pedestrians, from 15 to 24 years; young adults, from 25 to 44 years; adults, from 45 to 64 years; and elderly pedestrians, from 65 years. As shown in
Figure 1, the total number of accidents among elderly pedestrians exceeds that of all other groups; only in 2012, 2013, and 2014 were the total number of accidents of adult pedestrians comparable to those of elderly pedestrians. Nevertheless, it should be noted that adults comprise a large portion of the walking population, as opposed to the elderly, who tend to move around less or to walk in safe areas due to their limited mobility. Focusing on
Figure 1, the drop in the number of accidents in year 2020, and the following increase in 2021, should be noted. One reason for this rapid change that should be considered is the effect of the COVID-19 pandemic, which kept all people, but especially elderlies, at home. In percentage terms, 27% of all pedestrian crashes involve elderly pedestrians compared to 23% of adults, 19% of young adults, 16% of young people, and 15% of children (
Figure 2).
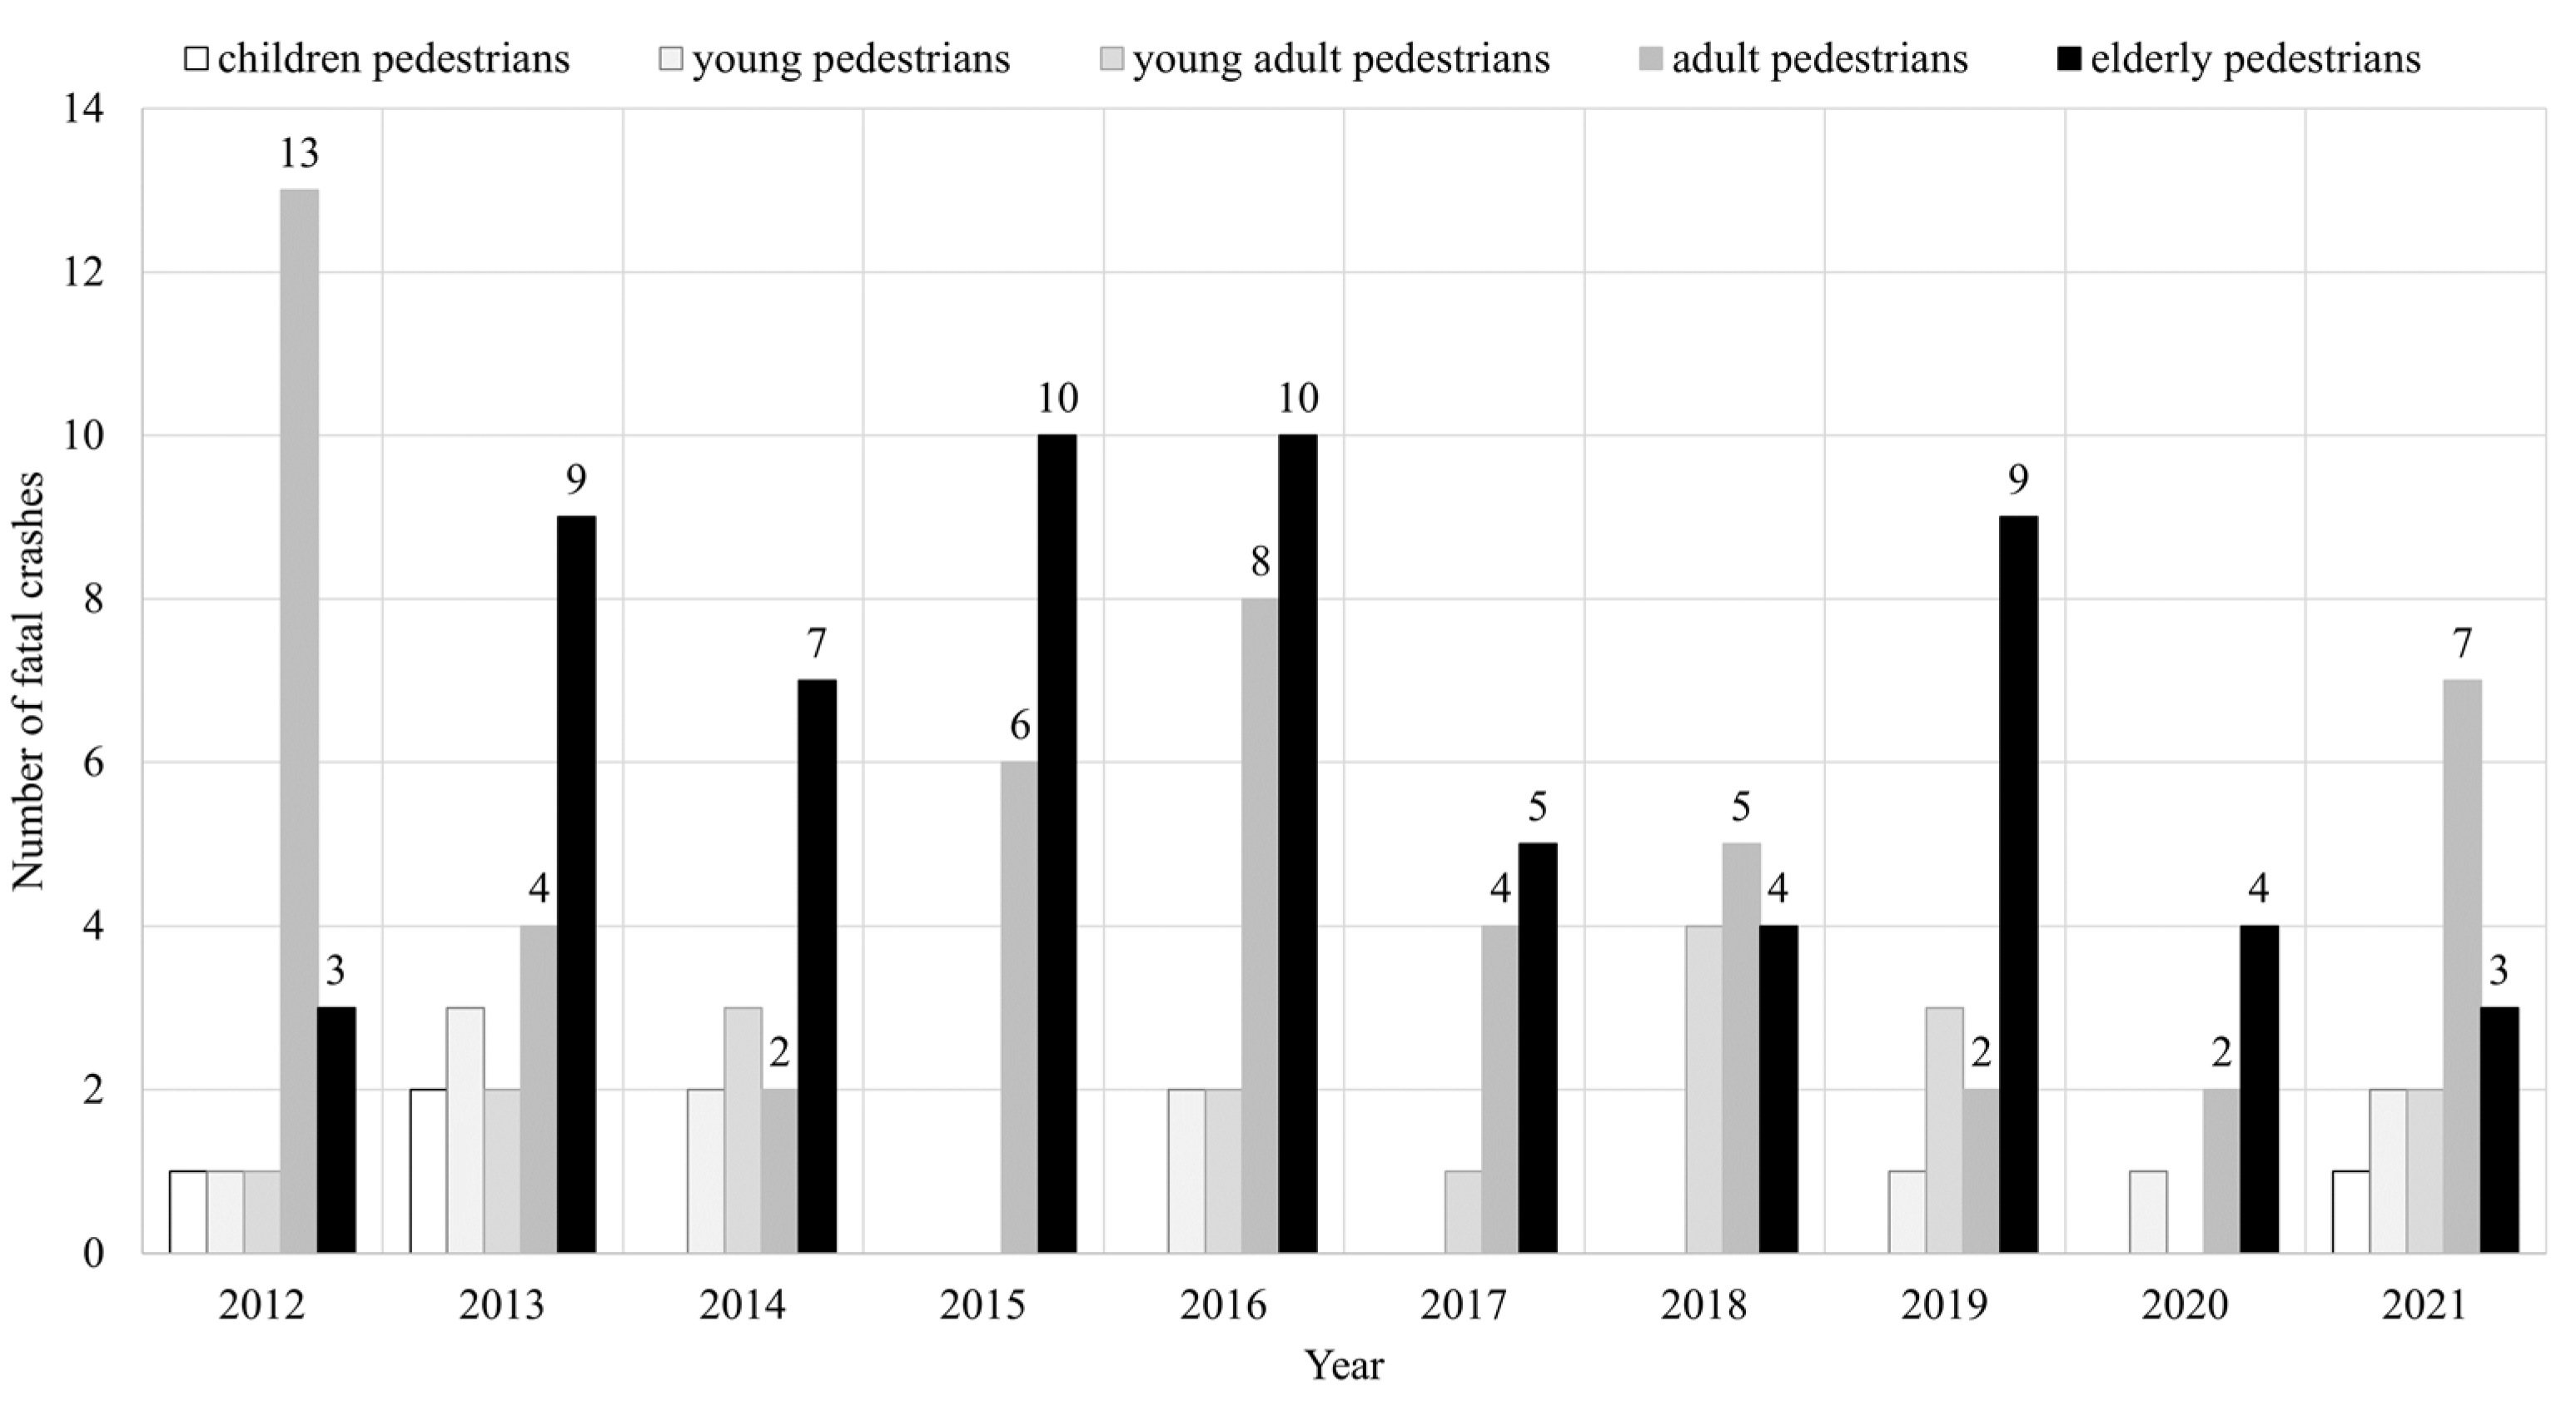
In
Figure 3, only fatal accidents are considered. Even with this accident severity, it can be observed that the two most critical groups of pedestrians are the elderly and adults. However, while adults saw a jump in the number of fatal accidents to 13 only in 2012, a pattern can be seen among the elderly, with very high accident numbers in 2013, 2015, 2016, and 2019.
In terms of percentage,
Figure 4 shows a sharp increase in the involvement of elderlies in fatal accidents: from 2012 to 2013, there was a jump from 15.79% to 45%, with a generally constant trend in the following years. This trend above 45% was maintained for the whole analyzed period, though a slight decrease is observed in 2016, while a drop in fatal accidents involving the elderly occurred in 2018 and 2021, with 30.77% and 20% fatal accident rates, respectively.
4.1.2. Effect of Time on Elderly Pedestrian Crashes
This section analyses the effect of time on pedestrian accidents, considering the time of day, days of the week, months, and seasons.
Figure 5 shows the trend of pedestrian accidents throughout the day, highlighting two peaks: one in the morning from 8.00 to 11.00 a.m. and one in the late afternoon from 4.00 to 7.00 p.m. This appears to be consistent with the times when elderly people are more likely to be out and about, typically in the early morning, when they normally fulfill their daily obligations (e.g., going to the market, visiting the doctor, etc.) and in the evening, when they usually prefer to go out for pleasant activities, such as a relaxing walk or a visit to see a friend. In addition, it can be noted that the entire period from 7.00 a.m. to 8.00 p.m. seems to be critical for elderly pedestrians, while the hours from 8.00 p.m. to 7.00 a.m. show a decreasing trend. Considering the days of the week, it can be observed (
Figure 6) that accidents are more or less evenly distributed from Tuesday to Friday, while there is a sharp decrease on Saturdays and Sundays. As a matter of fact, it is usual for elderlies in Slovenia to mostly arrange their activities on days of the week, with a tendency to stay home on Saturdays and Sundays. Indeed, on Saturdays, there are crowds of working people visiting the markets and shops; therefore, elderlies try to avoid this day, while on Sundays, commercial activities are generally closed. Looking at the months, it is plausible that most accidents occur in December and January (
Figure 7a), when external conditions are not optimal for the elderly; however, even in this case, there is a steady distribution of accidents across the months. Seasonal changes in accident data confirm the previous statement and show a higher percentage of accidents in autumn and winter (
Figure 7b).
4.1.3. Effect of External Conditions
The external conditions examined were weather (
Figure 8a) and light (
Figure 8b) status. Interestingly, most accidents occur during daylight hours, which is consistent with the results of the previous sections and is confirmed by the need of elderlies to fulfill their daily activities during the day. Additionally, many elderly people are aware of their physical restraints and do not feel secure when being out during night hours. With regard to the weather, the majority of collisions occur when it is sunny (58.31% of all traffic accidents). After that, cloudy and rainy days are also critical for the elderly, with rates of 27.10% and 9.61%, respectively.
4.1.4. Effect of Road Conditions
Finally, the location and condition of the road are also evaluated. As can be supposed, the vast majority of accidents involving the elderly occur in urban areas (94.27%), as shown in
Figure 9, while only 5.73% of accidents occur on rural roads. A more detailed analysis of the places where these types of accidents occur (
Figure 10) shows that the majority occur at isolated crosswalks (11.96% of cases), parking lots (10.92%), and intersections (9.11%), indicating that the highest risk for the elderly is when there is a close interaction with the traffic flow and where they assume that pedestrians have the right of way. Finally, the condition of the road surface is also considered. In line with the previous findings that December and January are the most critical months for elderly pedestrians, and that sunny and cloudy weather most often leads to traffic accidents,
Figure 11 shows that the road surface is mostly dry (72.75%) and in some cases wet (23.41%).
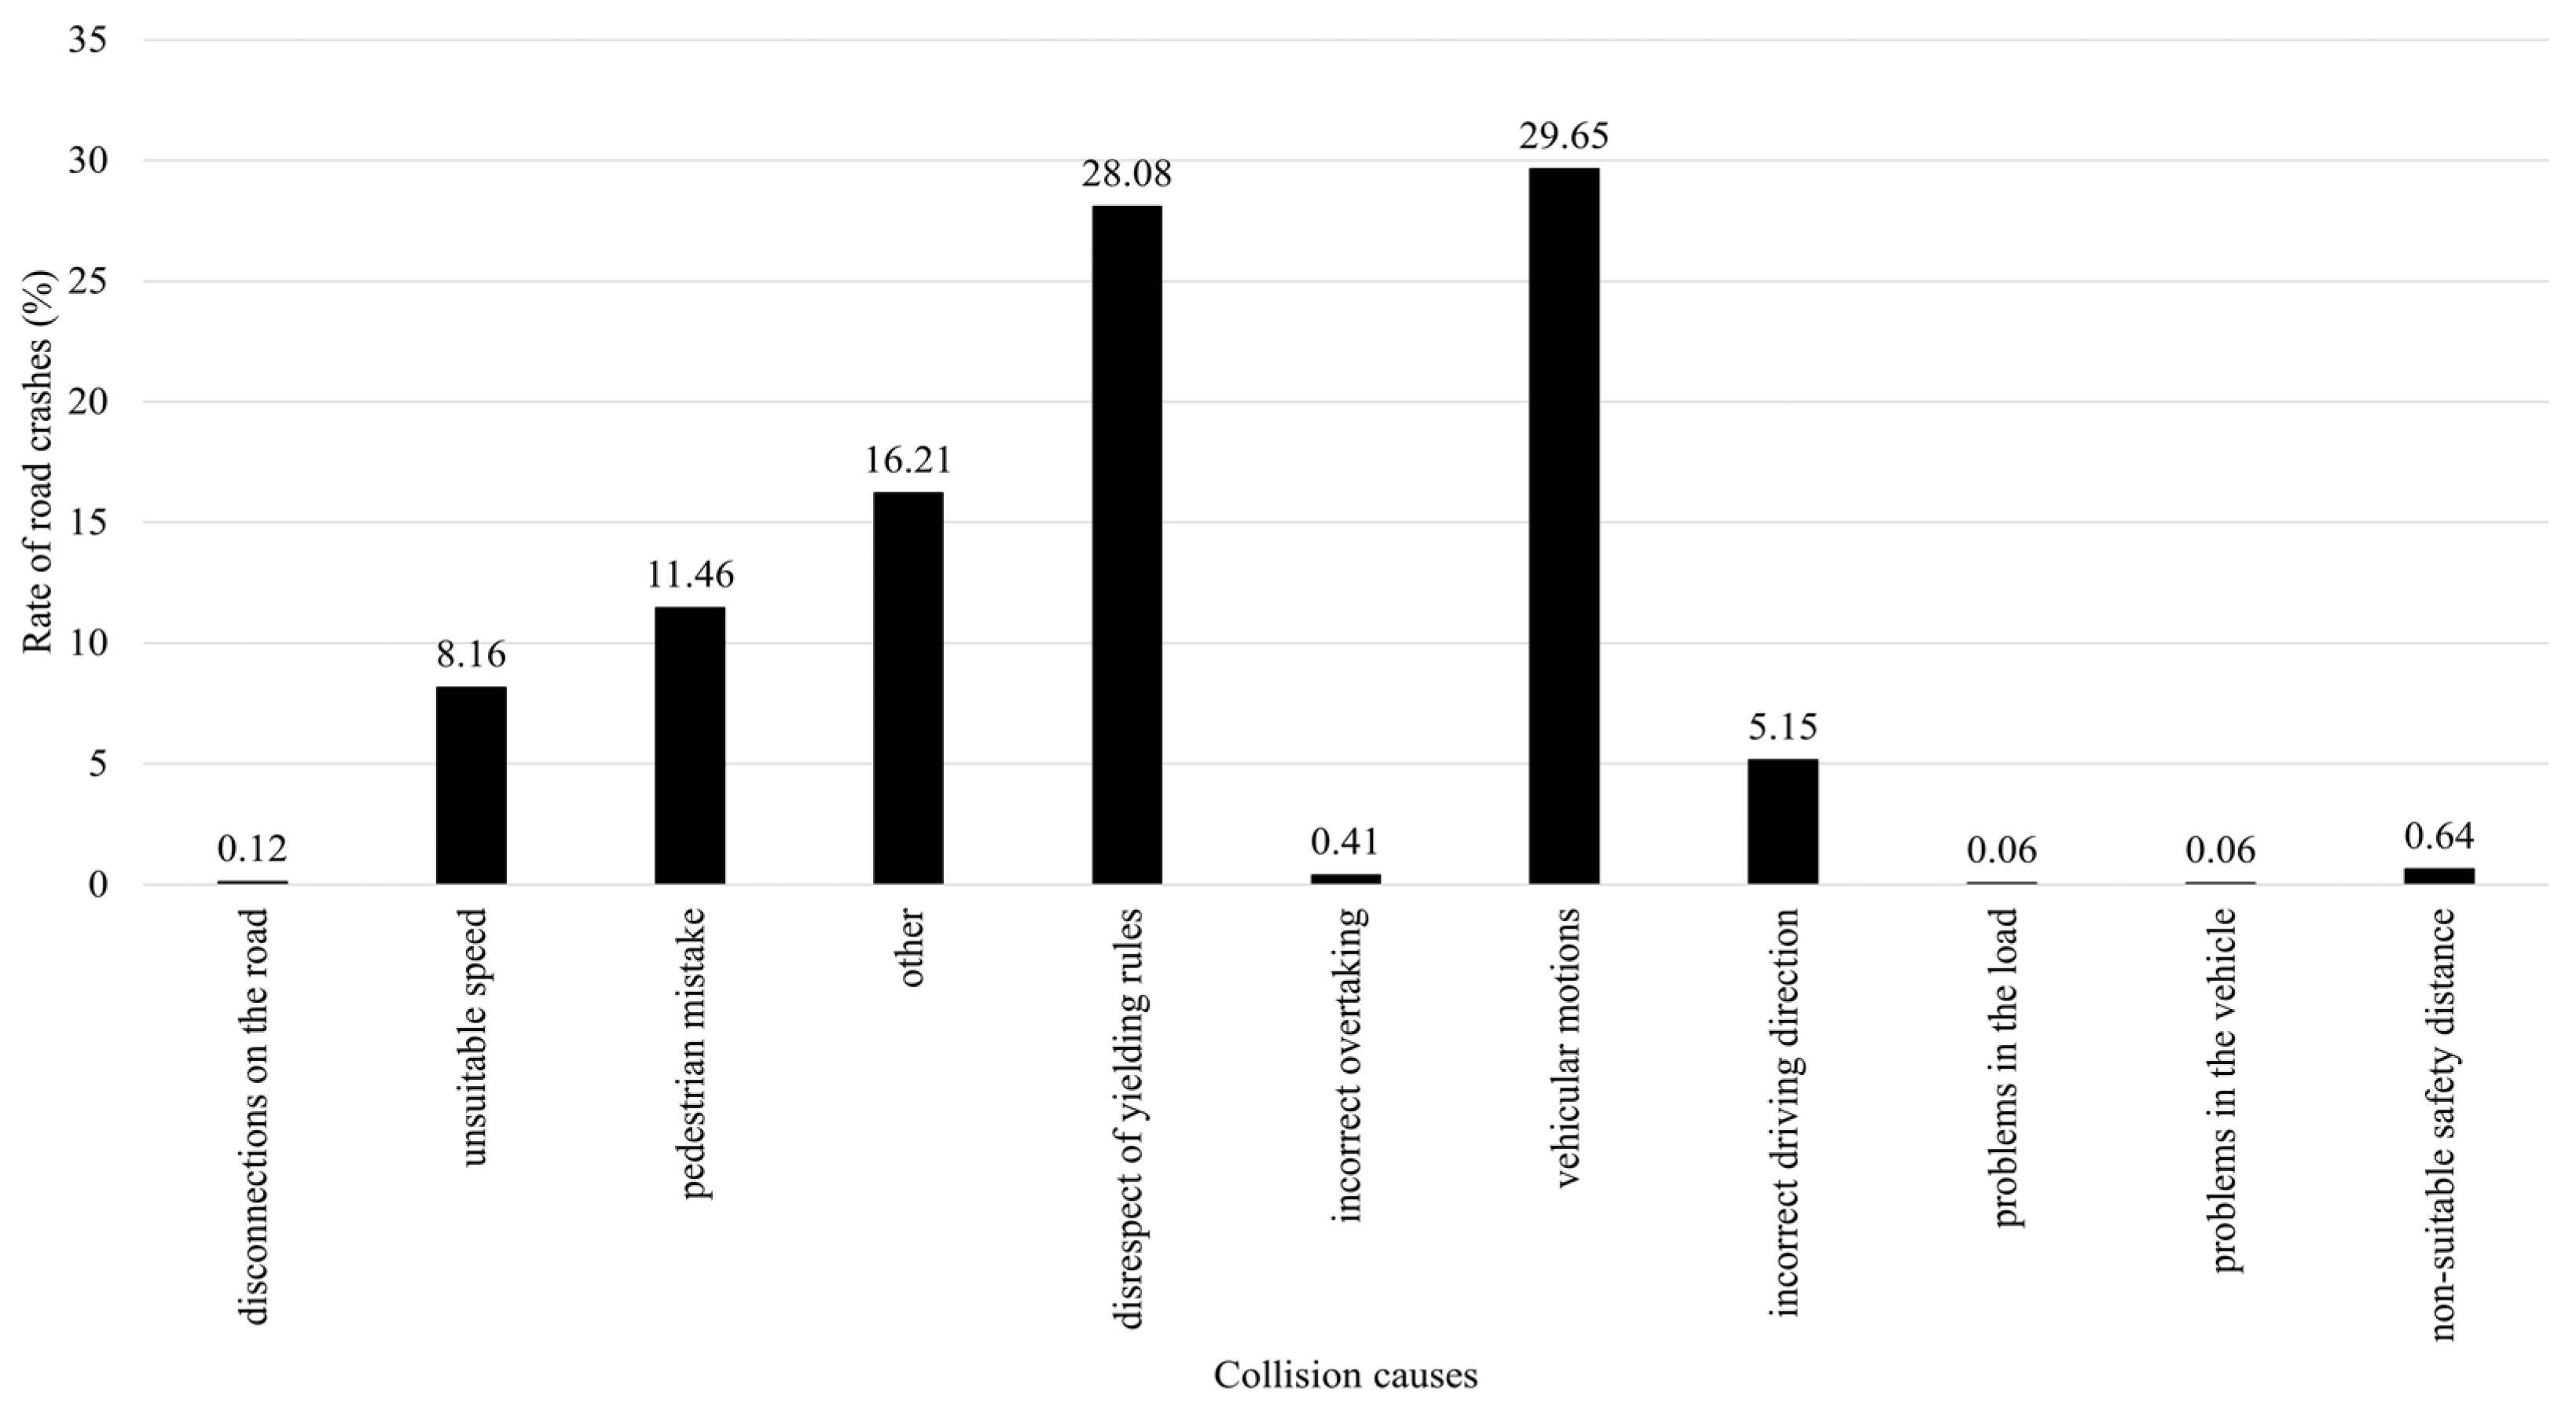
4.1.5. Analysis of the Causes of Pedestrian Crashes
One advantage of the database used as a starting point for this research is that it contains information about the causes that led to the accident, according to police reports. In this database, 11 categories are considered, namely, disconnections on the road, inappropriate speed, pedestrian error, disregard for the right-of-way rules, incorrect overtaking, unpredictable movements of the vehicle, wrong direction of travel, problems with the load, problems with the vehicle, inappropriate safety distance, and other unspecified causes. It can be seen from
Figure 12 that the two causes that lead to most accidents involving elderly pedestrians are disregard for the right of way and unpredictable vehicle movements. Thanks to the help of the national police department, it was possible to further explain the two most common causes of elderly pedestrian accidents, i.e., disregard for the right of way and unpredictable vehicle movements. The first seems to be related to the lower sight and reaction abilities of elderly pedestrians, who probably did not notice the oncoming vehicle and started to cross when the vehicle was unable to safely brake. With regard to unpredictable vehicle movements, the major problems observed by the police agents are rear-driving and driving in parking areas. In these two occasions, indeed, there is bad reciprocal visibility, leading to a situation where at least one of the involved road users cannot see the interacting one. These two reasons are followed by other unspecified causes and pedestrian errors. Accordingly, in the majority of cases (87.55% of the accidents), elderly pedestrians are not the cause of the collisions but are the victims.
4.2. Normality Tests
As explained in
Section 3.2.1, normality tests such as the Kolmogorov–Smirnov test and the Anderson–Darling test are applied to determine whether the data sample has a normal distribution. In this analysis, all aspects of traffic accidents that were generally analyzed in the previous section are considered.
Table 2 summarizes the results for all factors and for both tests. As can be seen, both tests agree for all factors and have
p-values less than the chosen α-value (0.05). Therefore, the null hypothesis that “the data follow a normal distribution” should be rejected. The results of these statistical tests were crucial for the research outcome, and together with the output typology, directly influenced the choice of model. Indeed, the chosen logistic regression model does not require many of the assumptions of the other model, with the more commonly used regression models especially attaching importance to normality.
4.3. The Regression Model and Its Interpretation
As mentioned in the Methodology section, ordinal logistic regression is proposed to model crash severity for elderly pedestrian accident data, with the aim of identifying significant factors that influence it.
The first step before building the regression model is to filter the data. As highlighted in
Section 4.1 Statistical Analysis of Elderly Pedestrian Accident Data, many crashes were generally reported as occurring “on the road”. In many of these data, “other factors” were reported as the cause or the type of collision was identified as “other”. For this reason, they could not be considered sufficiently reliable and were deleted from the database to avoid unnecessary bias. In this way, a more restrained database of 745 collisions was used as input to the regression model. This filtered database was uploaded to the statistical software Minitab [
27], which was used for further analyses.
The accident severity is the output of the model and it is treated as a categorical variable. To respond to the model’s needs, accident severity is classified into four categories, which correspond to the severity levels reported in the database: 0, without consequences; 2, with minor injuries; 3, with severe injuries; and 4, fatal accident. Of the 745 collisions considered, 25 were classified as level 0, 498 as level 2, 203 as level 3, and 19 as level 4. Thus, the model consists of three equations—the number of equations equals the number of response levels minus one—differing from each other by the equation constants. All equation constants are listed in
Table 3 along with the coefficients for the other predictors, their
p-values, and odds ratios. In summary, the ordinal logistic regression model is characterized by 17 predictors (in addition to the 13 already analyzed, gender, alcohol test and its score, and road surface material were also considered), which can be seen, together with their codification, in
Table 3, with one response, and three equations. From
Table 4, it can be seen that 5 of the 17 predictors have
p-values below the significance level, meaning that they have a significant effect on severity. These predictors are: gender and age of the pedestrian involved, light conditions, cause of accident, and traffic conditions. This is an important finding; indeed, it highlights the specific factors that may significantly influence crash severity for the majority of the walking population, or that those factors that are supposed to influence (e.g., the month and the weather conditions) crash severity for elderly pedestrians do not play such a central role.
The “Coefficients” column indicates the coefficients of each predictor in the three model equations. The first equation contains a constant equal to const(1), i.e., 52.53, and all predictors, each with its corresponding coefficient. This equation gives the probability that the accident has no consequences. Similarly, the second equation is composed of const(2) (56.95) and the predictors with their coefficients, and predicts the probability that an accident will have no consequences or minor injuries. The last equation contains const(3) (59.84) in addition to the predictors and their coefficients, and it gives the probability that an accident will be without consequences, with minor or severe injuries.
To evaluate the fit of the regression model, the
p-value calculated on the basis of the deviance residuals and Pearson statistics, matched, unmatched pairs and ties, and the measures of association are considered (
Table 5).
The
p-values calculated for the variance residuals and Pearson statistics are greater than the established significance level, which does not provide evidence that the model should not fit the data. In addition, a moderately high number of concordant pairs, 64.0%, were found, while little ties only represented 0.6%. These data show that the model has good predictive power, confirming the previous hypothesis. In addition, the measures of association are reasonably consistent, indicating that the model is not weak (
Table 4). The Somer’s D and Goodman–Kruskal Gamma values are also close, which is consistent with the fact that there are few tied pairs.
The elements that allow interpretation of the regression model are the coefficients of the predictors and their odds values. The signs of the first indicates whether there is a positive or negative relationship between the predictor and the response. Considering the five predictors that have a significant influence, it can be said that the male gender has a greater probability of increasing accident severity, that people aged 65+ are more prone to severe accidents, and that these types of accidents are more likely to happen during the day and in traffic conditions that transition from infrequent to normal traffic. Finally, cause also has a positive coefficient, indicating that the model identifies the most important causes, which are classified in the database with a higher number, including disregarding the right-of-way rules and vehicle movements, as could be supposed from the results of
Section 4.1. The odds ratios provide information on how likely it is that the collision has a high severity. Odds ratios greater than 1 indicate factors that increase severity. Among the five influential predictors, the cause of the collision and traffic conditions stand out with odds ratios of 1.13 and 1.35, respectively. Interestingly, pavement condition, weather conditions, month, and alcohol test also exacerbate collision outcomes, although they are not identified as significant from their
p-values. This finding is also supported by the preceding statistical analysis.
5. Discussion
From the results of the ordinal logistic regression model, it can be concluded that five factors significantly influence accident severity among elderly pedestrians. Two of these factors—age and gender—are related to the individual, one is related to the external conditions (light), and two are related to the road and traffic, namely, the cause of the accident and traffic conditions.
Considering the results of the first analysis of the database, some more information can be disclosed about these factors. The months when most accidents occur are the winter ones, suggesting that external conditions—both the weather and road surface—are not ideal for older people. In addition, the elderly may find themselves in a riskier situation in such conditions, leading them to engage in behaviors of self-failure that are highlighted by [
6]. In contrast to this finding, it was indicated that a large proportion of the accidents occurred during daylight hours. This is probably due in part to the fact that older people prefer to walk and perform all their routine tasks during the day. Similarly, a large proportion of accidents involving older pedestrians occur in urban areas, confirming the general trend in pedestrian accident data. These two findings underscore the need to introduce physical safety measures, which would work primarily under normal conditions and not only in exceptional cases.
The last two factors are more interesting: of all the causes of accidents recorded, 29% are due to vehicle movements, 28% to disregard for the right-of-way rules, and 11% to pedestrian errors. Firstly, it should be indicated at this point that in 16% of the recorded accidents, no clear cause of the accident was given, with the indication “other”. This fact confirms the problem of missing information that follows any accident database. Moreover, in the case of observance/misobservance of the right-of-way rules, it is not clear whether the fault was on the part of the pedestrian or the vehicle. Nevertheless, it can be noted that a relatively high percentage of accidents are due to an error on the part of the elderly, which again is consistent with the results of [
6], and also the 28% from disregarding the right-of-way rules can lead to the assumption that an error on the part of the pedestrian was the basis of the accident. This aspect highlights the need for a clearer or better regulated right-of-way system for elderly pedestrians, where there is no doubt about which road user has priority. Finally, with regard to traffic, although 63% of accidents occur in normal traffic conditions, the percentages relating to infrequent (24%) and dense (13%) traffic should not be overlooked.
It is also interesting to note that many accidents involving the elderly occur at three possible locations on the road—intersections, isolated crosswalks, and parking lots. These locations are parts of the road where direct interaction between motorized and non-motorized traffic can be observed. In addition, when designing these locations, more attention is usually given to motorized traffic—consider the common arrangement of parking lots: although they should be laid out with special attention to pedestrians, the infrastructure designed for them is usually limited or non-existent.
Based on the highlighted factors, we can assume that countermeasures are needed to improve three aspects of road safety: first, older people’s walking skills, e.g., their ability to judge who has priority or whether it is safe or unsafe to cross the street; second, the consequences of external conditions, e.g., improving surface conditions in bad weather; and, finally, regulatory features, e.g., regulating the speed of motorized traffic at locations where pedestrians and vehicles are directly interacting.
Measures to Improve Elderlies’ Safety
As highlighted by the model’s results, two elements influencing pedestrians’ safety are their age and gender. A way to tackle these aspects, which are directly related to each individual, is to work on elderlies’ road safety education. Improving elderly pedestrians’ knowledge of the proper search behavior at the beginning of crossing the street to make sure the street is free of interacting vehicles, as well as giving them advice on how to manage their own physical abilities, which can differ from men to women, is a key element in improving their road safety. Special actions aimed at improving their safety and friendly public presentations promoting simple tricks, such as using light-colored clothing to be more visible to motorists, can have a positive impact on the safety of this group of road users. All these actions can improve the safety of this vulnerable group of pedestrians in all those conditions, when—at least, apparently—all external conditions are favorable to their safety (e.g., daylight, sunny weather, etc.).
Another aspect that has been highlighted as problematic by the research was the disrespect of the right of way. This aspect, together with two problematic locations identified by the previous analysis, i.e., isolated crosswalks and intersections, can be tackled by a proper road design: shorter distances to cross roads, splitter islands at long crossings, “zig-zag” crossings, and planning an ad hoc signal system can help elderlies recognize difficult road sections and be more cautious. An adequate number of traffic signs, good visibility of road markings and traffic signs, and large, easy-to-read text on signs are also elements that can attract the attention of older pedestrians and guide them to act properly. On the other side, lighted intersections and raised platforms at pedestrian crossings can help pedestrians to be more visible for vehicles entering the interacting area.
To improve pedestrian safety in the third problematic zone identified by the research, i.e., parking lots, various solutions have been proposed worldwide. Usually, they consist of channelizing pedestrian flow on specifically configurated zones of the parking lot. These zones can be divided by vehicular lanes only using horizontal signalization and pictograms, or by providing pedestrians with sidewalks physically separated by the rest of the road surface, leading them along the parking area until their destination. Finally, surfaces without holes and obstacles help prevent falls or look for evasive actions to avoid potential falls. Moreover, it should be considered that older people tire faster than younger ones. Therefore, they need places of rest that allow them to sit for a while and regain their strength. This could also have an effect of safety, as they will feel refreshed and will not have to hurry to their destination.
Finally, rainy weather and wet road surfaces have also been recognized as factors partially conditioning elderly pedestrian collisions. To improve these aspects, the design of a new pedestrian infrastructure or the reconstruction of an existing infrastructure can include the use of rough, non-slip material for the sidewalk, which increases the grip of shoes. Elements to assist older pedestrians, such as handrails, could also be useful in certain locations and conditions. Covered areas where they can wait in bad weather could also improve their status.
6. Conclusions
This article aims to draw attention to the road safety problem for elderly pedestrians and highlight the main factors that affect the safety of older people on the road. Between 2012 and 2021, a total of 1727 traffic accidents involving elderly pedestrians occurred in Slovenia, while 27% of all pedestrian fatalities involved older people. All these accidents were considered in the study and statistically analyzed to highlight dominant elements, with the aim of being able to propose efficient countermeasures. The results of this first statistical analysis highlighted that, differently to other pedestrian age categories, the collisions involving elderly people had a more or less steady trend over the years, with the exception of 2020, when a decrease was noticed, probably due to the first wave of the COVID-19 pandemic. Additionally, it was observed that many collisions happened during the day, which is understandable given the usual routine of elderly people, and during colder months (especially in autumn and winter). Moreover, three different urban locations were recognized as the most dangerous for older pedestrians: isolated crosswalks, intersections, and parking lots. Subsequently, an ordinal logistic regression model was proposed, which allowed finding a relationship between 17 collision factors and accident severity. This model found that 5 of the 17 considered patterns significantly affect the accident severity level when elderlies are involved. These are gender, age, light condition, cause, and traffic. At this point, a limitation of the study should be noted, namely, the extent of underreporting and misreporting of pedestrian collisions encountered in this research during the preparation of the dataset for the model, which led to a reduction in the input database for the regression model. Unfortunately, this is a problem that can greatly affect the results of an investigation but is very difficult to deal with, as has already been indicated by many eminent researchers [
12,
28].
Overall, it has been highlighted that three categories of factors can be identified that influence the safety of older people: personal characteristics, external factors, and characteristics of the collision. To deal with these factors and improve the safety of this group of vulnerable road users, three types of countermeasures have been proposed, which mainly fall into the first two of the so-called “3Es” of road safety: Engineering–Education–Enforcement. Recalling the proposed engineering measures, they are specifically focused on intersection improvements, pedestrian crossing design, and channelization in parking lots.
Finally, it should be noted that the developed research can be the starting point for many future works aimed at the improvement of elderly pedestrian safety. The identification of three particularly dangerous locations puts the basis for deeper analyses on elderly pedestrian behavioral patterns at these infrastructural points. In addition, it would be of particular interest to focus especially on different intersection typologies (e.g., signalized, unsignalized, and roundabout crossings) to understand if there is a direct correlation between the infrastructural characteristics and the frequency and severity of accidents. Taking into account the development of the regression model for this pedestrian age category, it would be interesting to develop a similar study for other age categories and to compare the influencing factors leading to higher crash severity for elderlies with the ones ruling the collisions of differently aged pedestrians.


