
Energy Evaluations of a New Plant Configuration for Solar-Assisted Heat Pumps in Cold Climates


Abstract
:1. Introduction
- heating demand covered directly by the system, without considering the auxiliary intervention;
- system performance index regarding the non-renewable share;
- system performance index related to the renewable energy share;
- CO2 emission level.
2. Methods and Materials
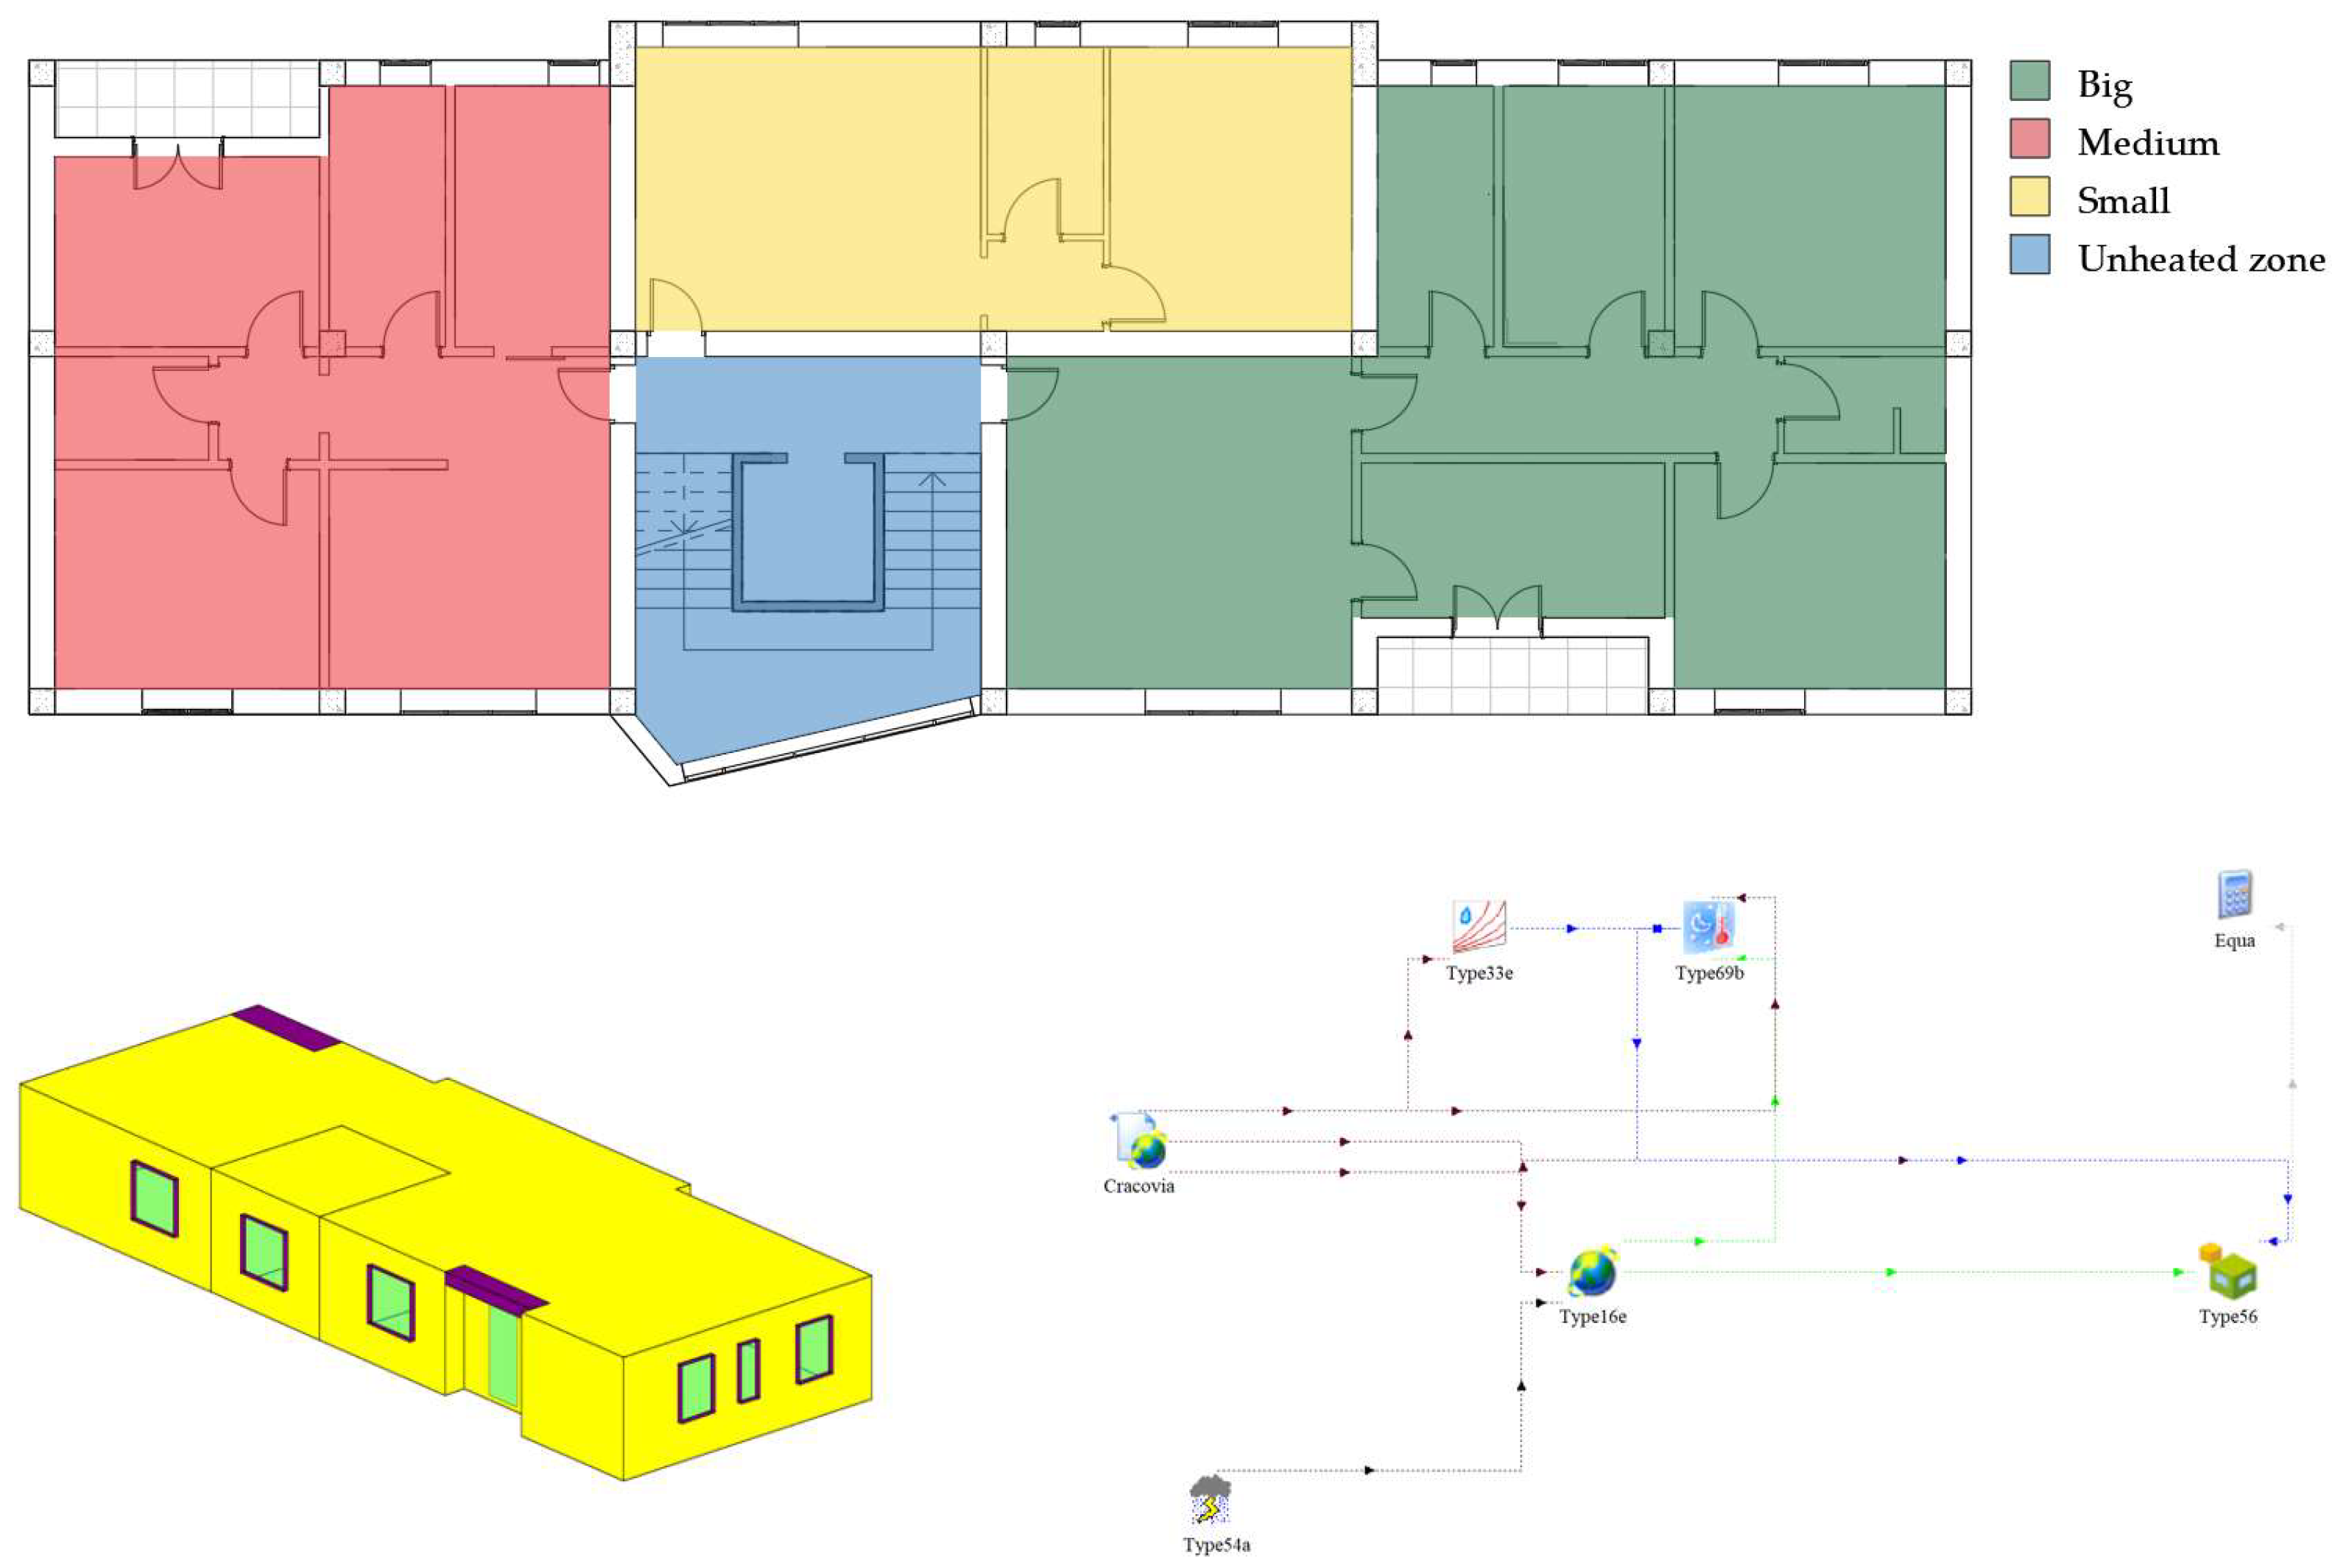
2.1. Case Study Building
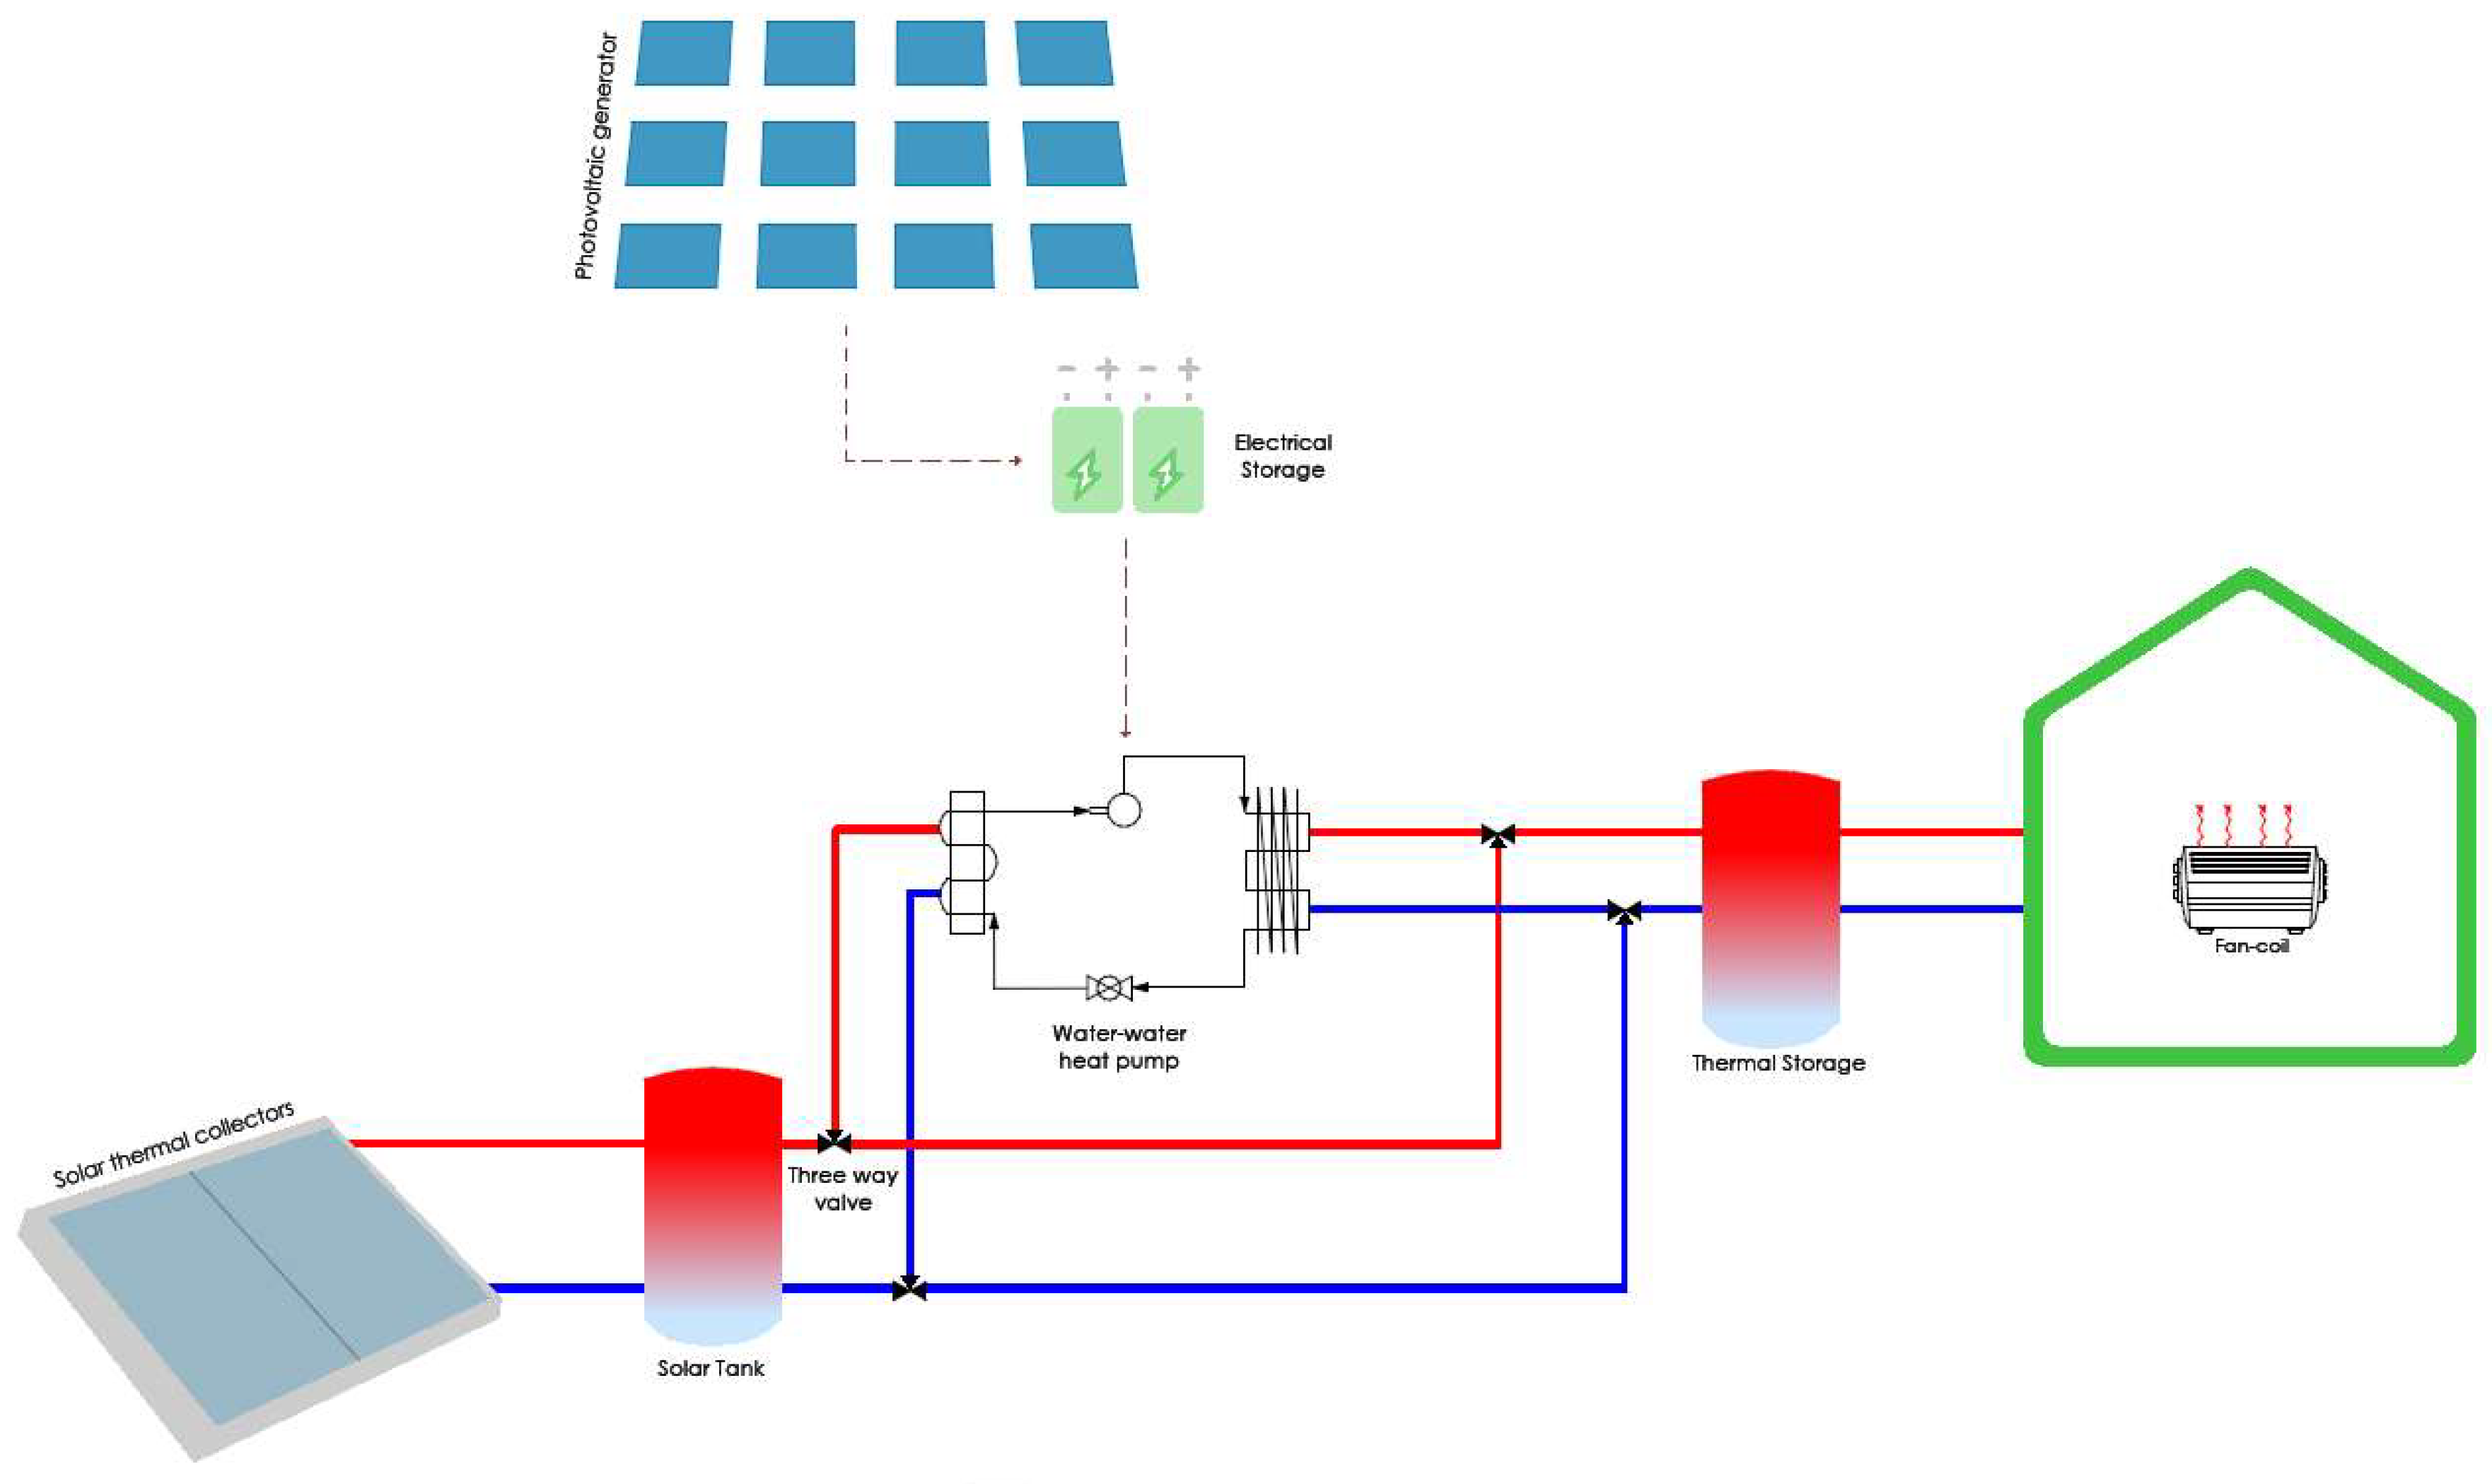
2.2. Heating Plant
2.2.1. Solar Thermal Collectors and Solar Tank
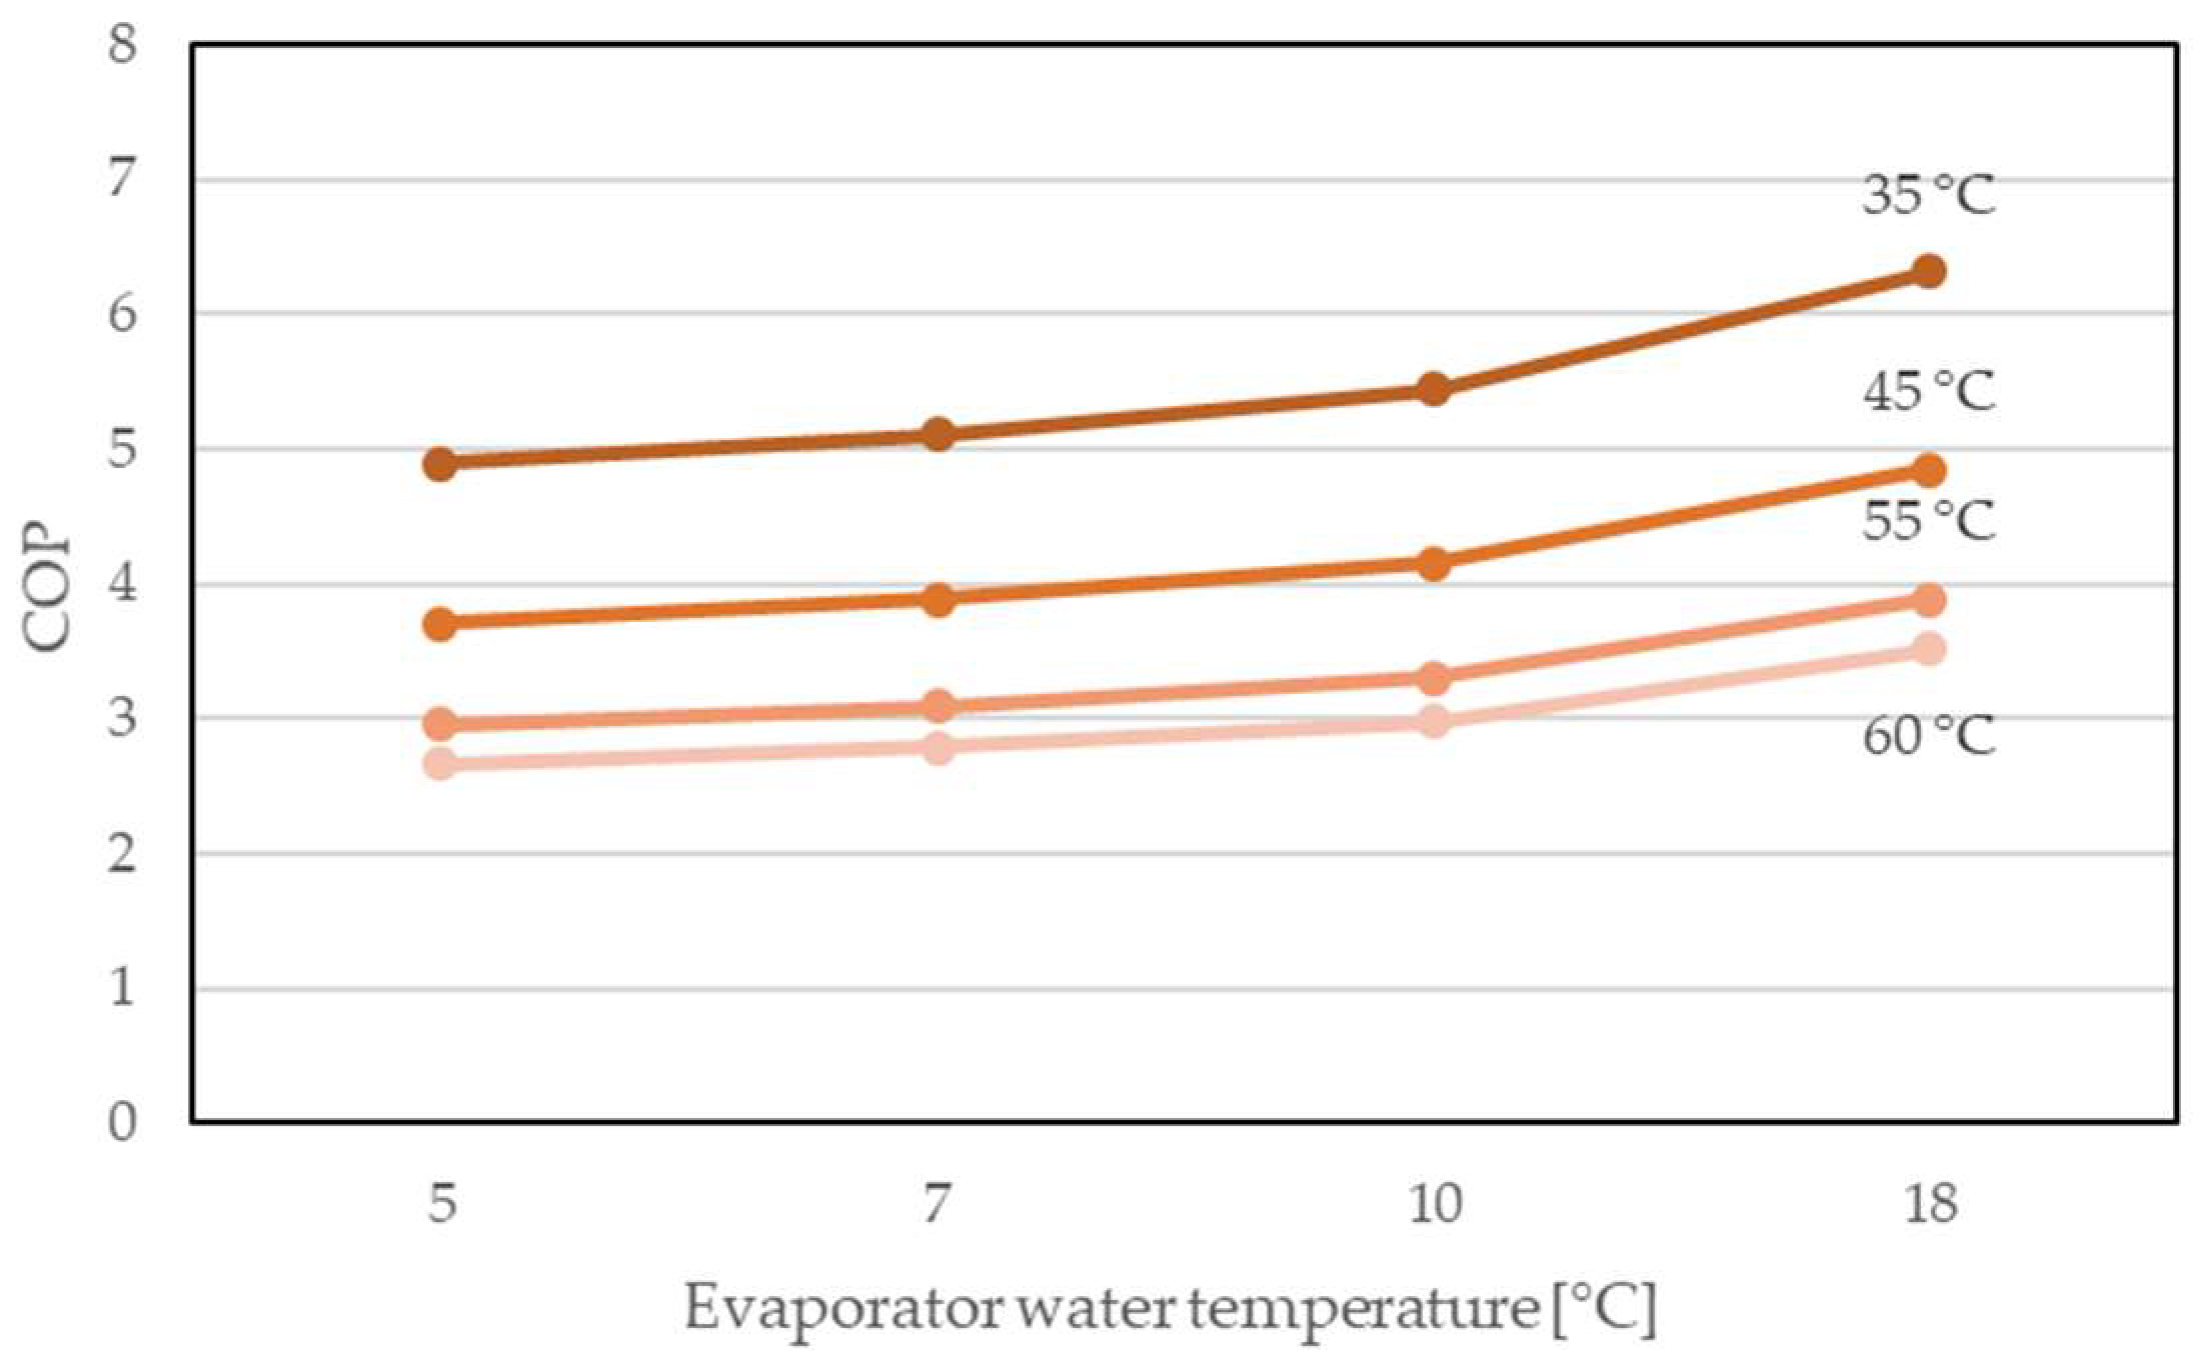
2.2.2. Water–Water Heat Pump
2.2.3. PV Generator and Electrical Storage
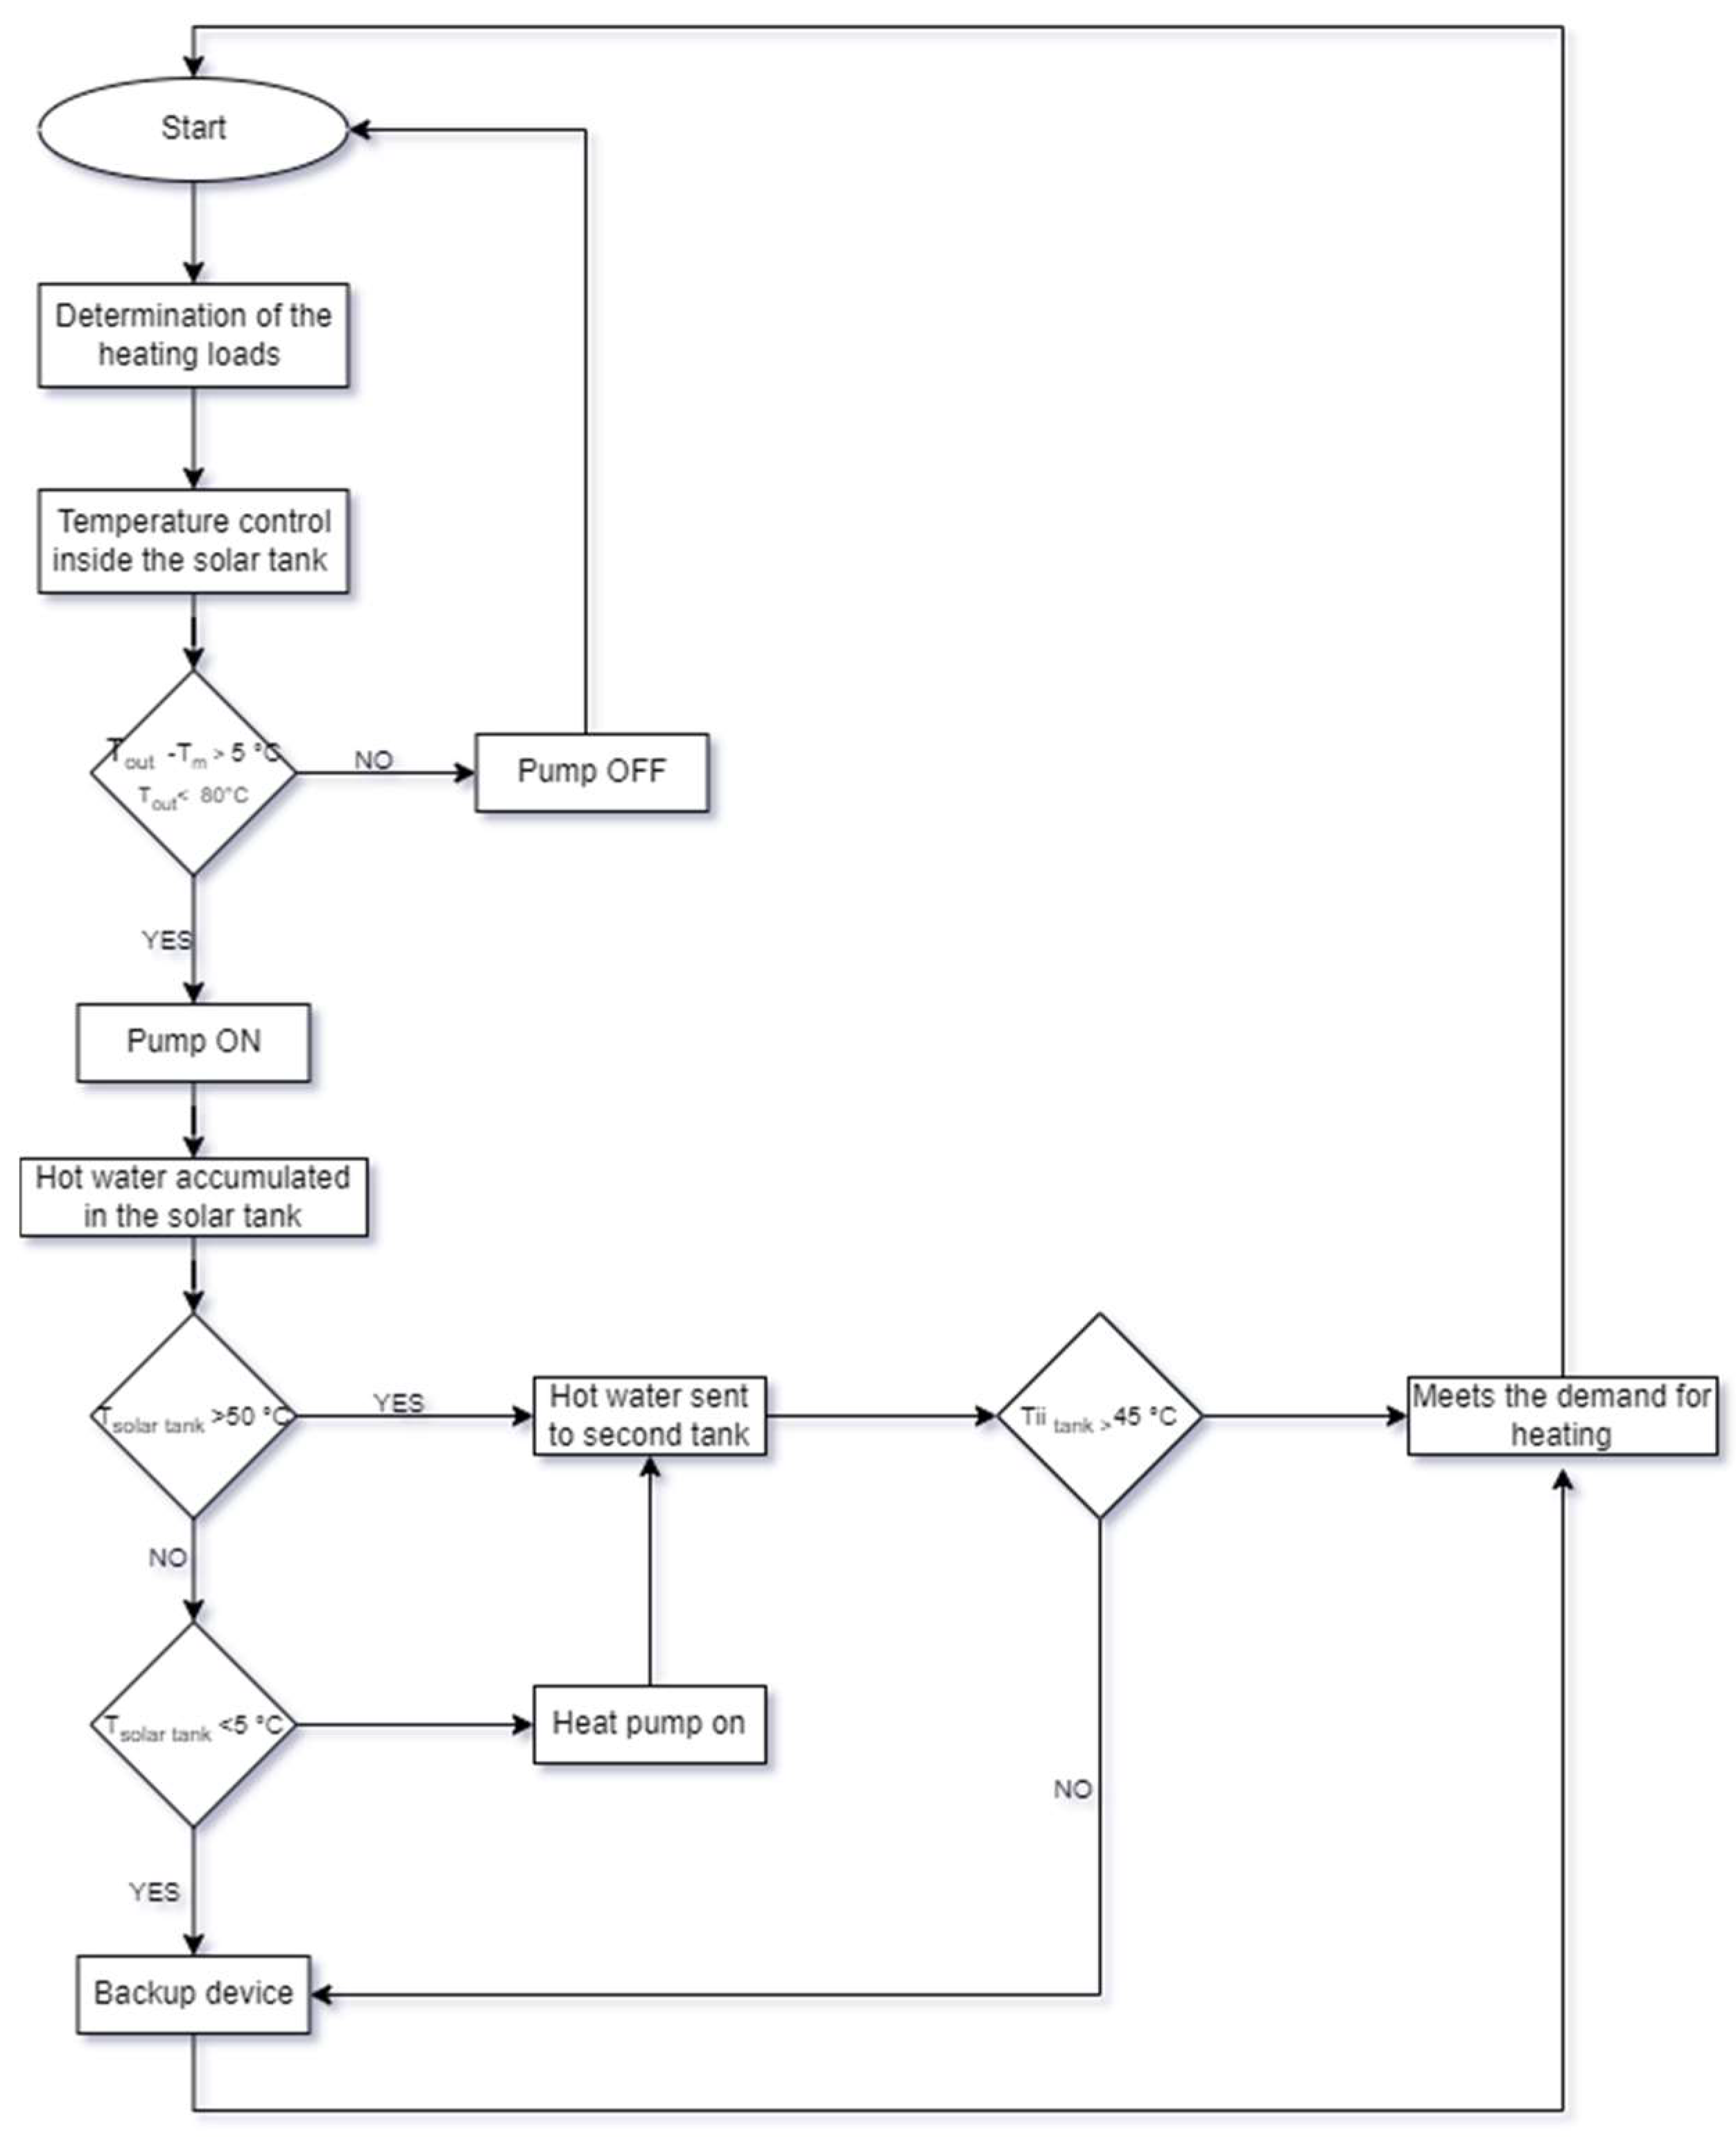
2.3. Implemented Control Strategies
2.4. Simulation Model
2.5. Primary Energy Consumption and Emission Levels
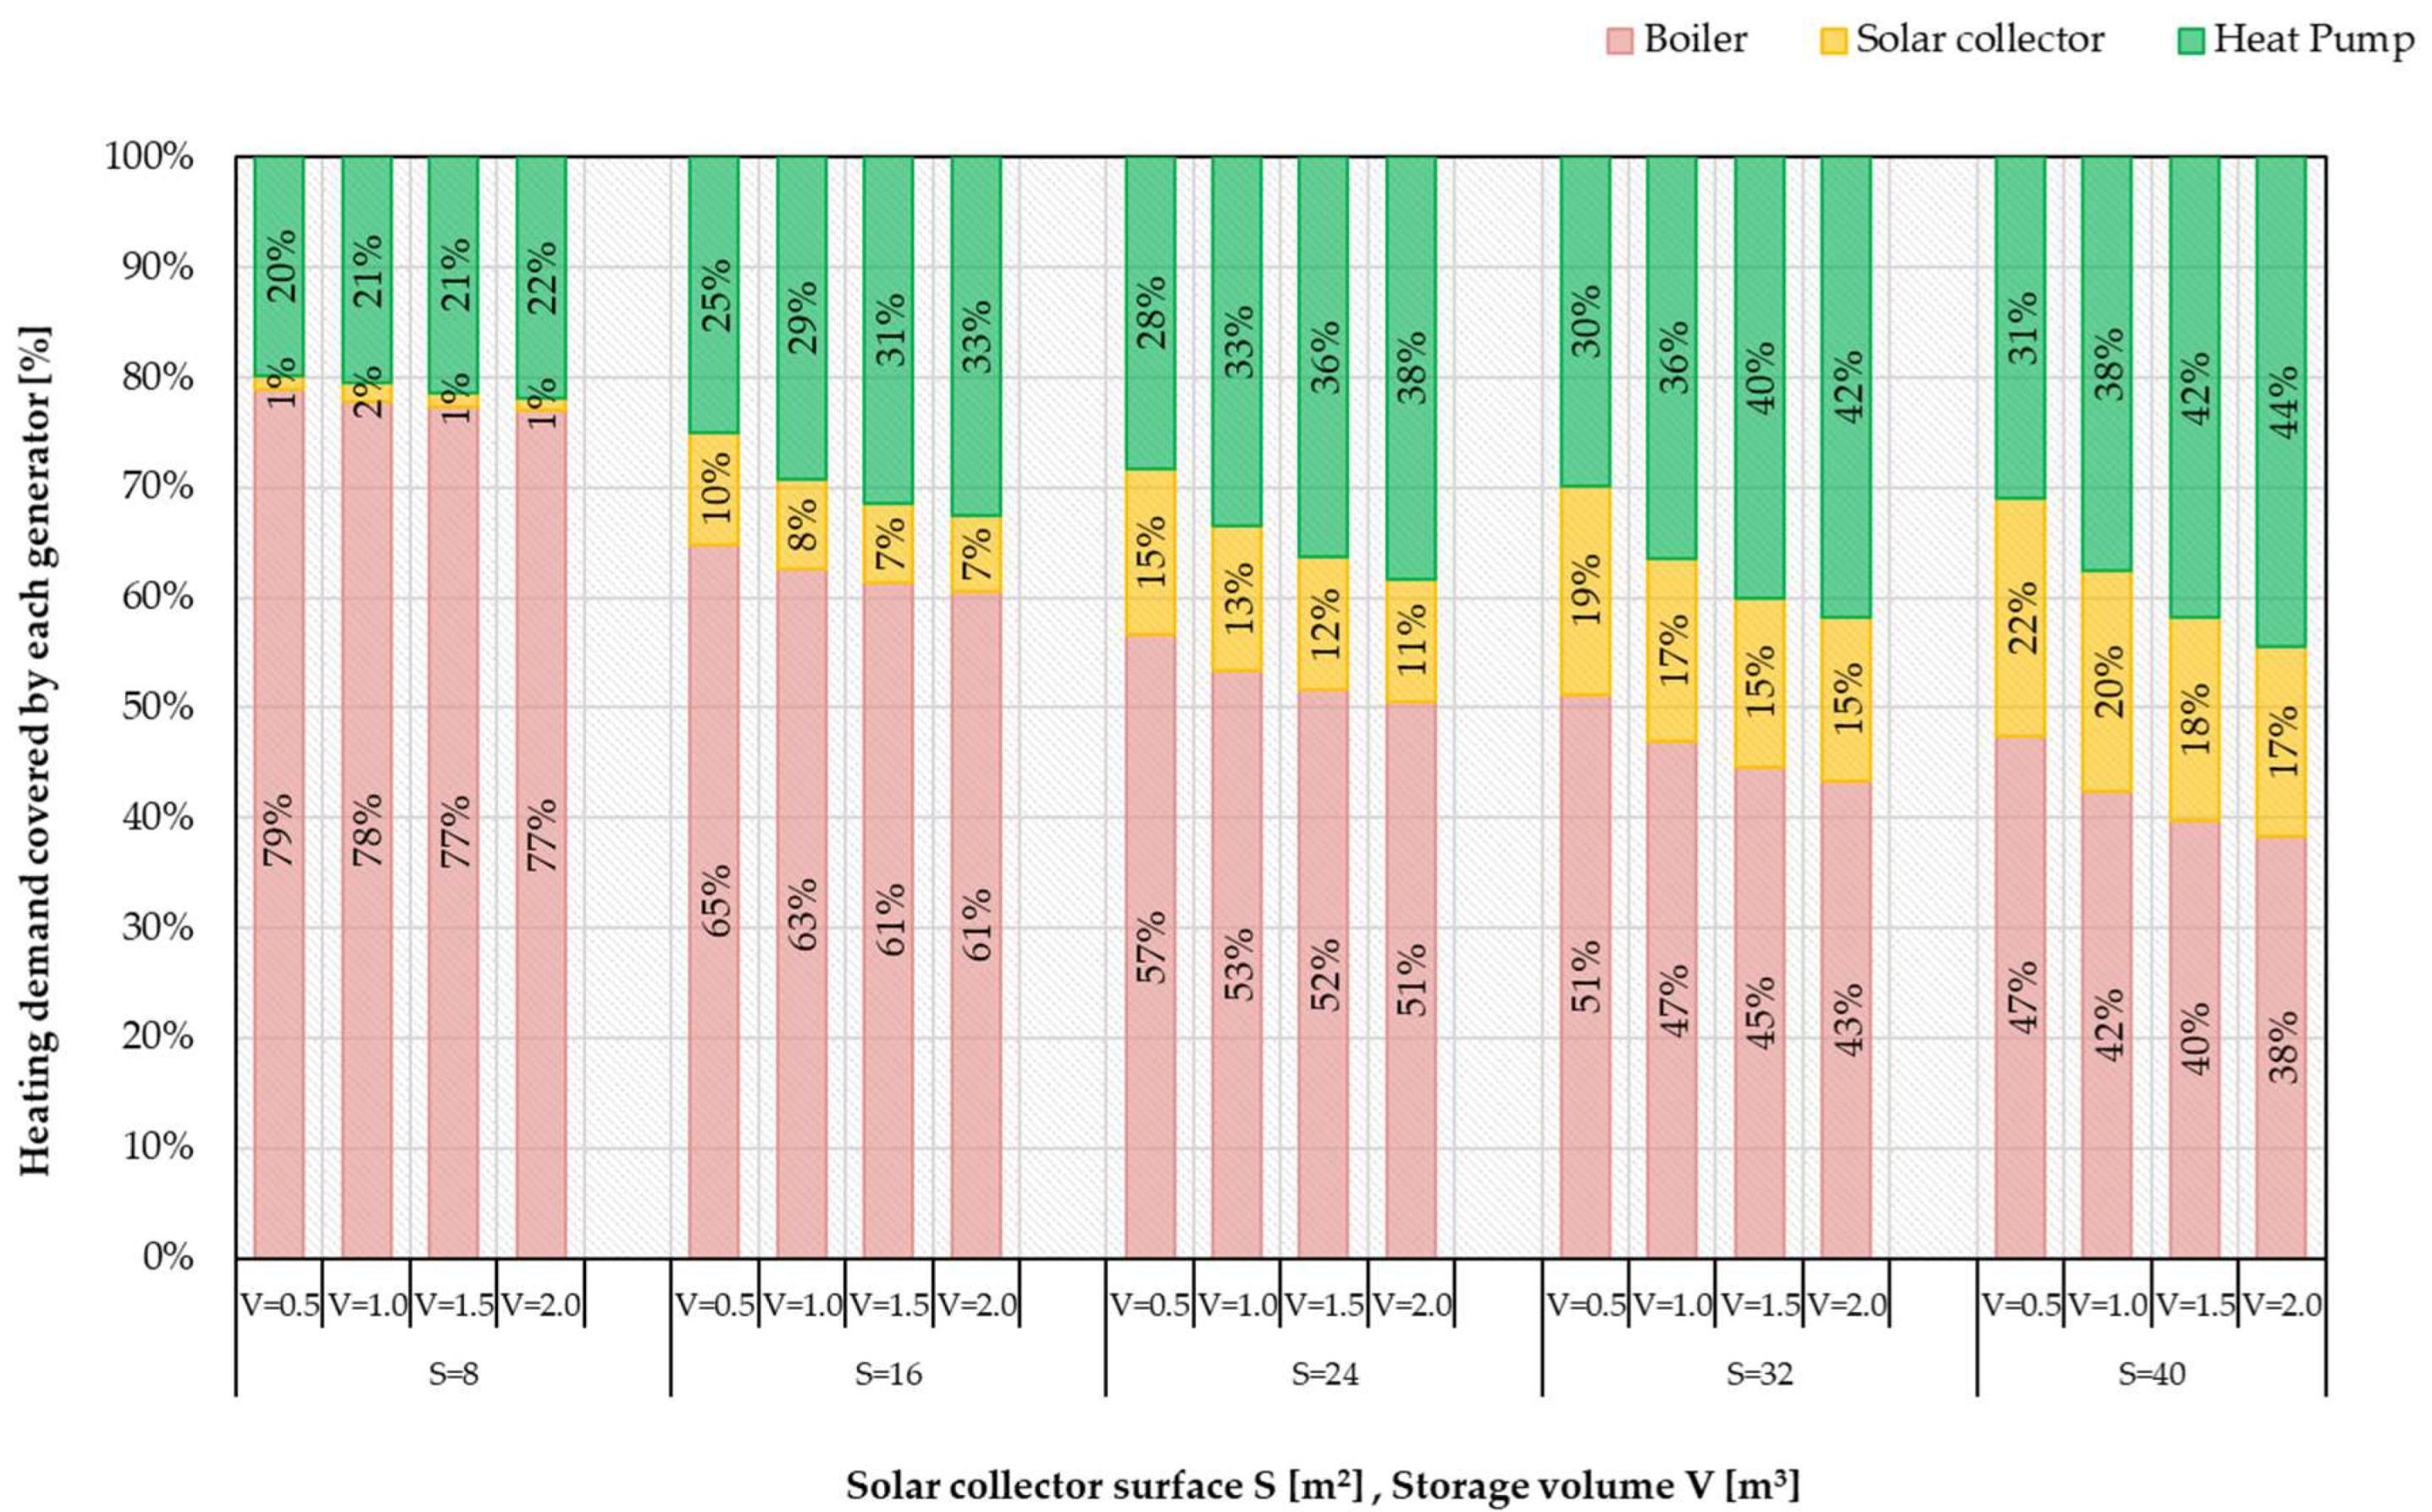
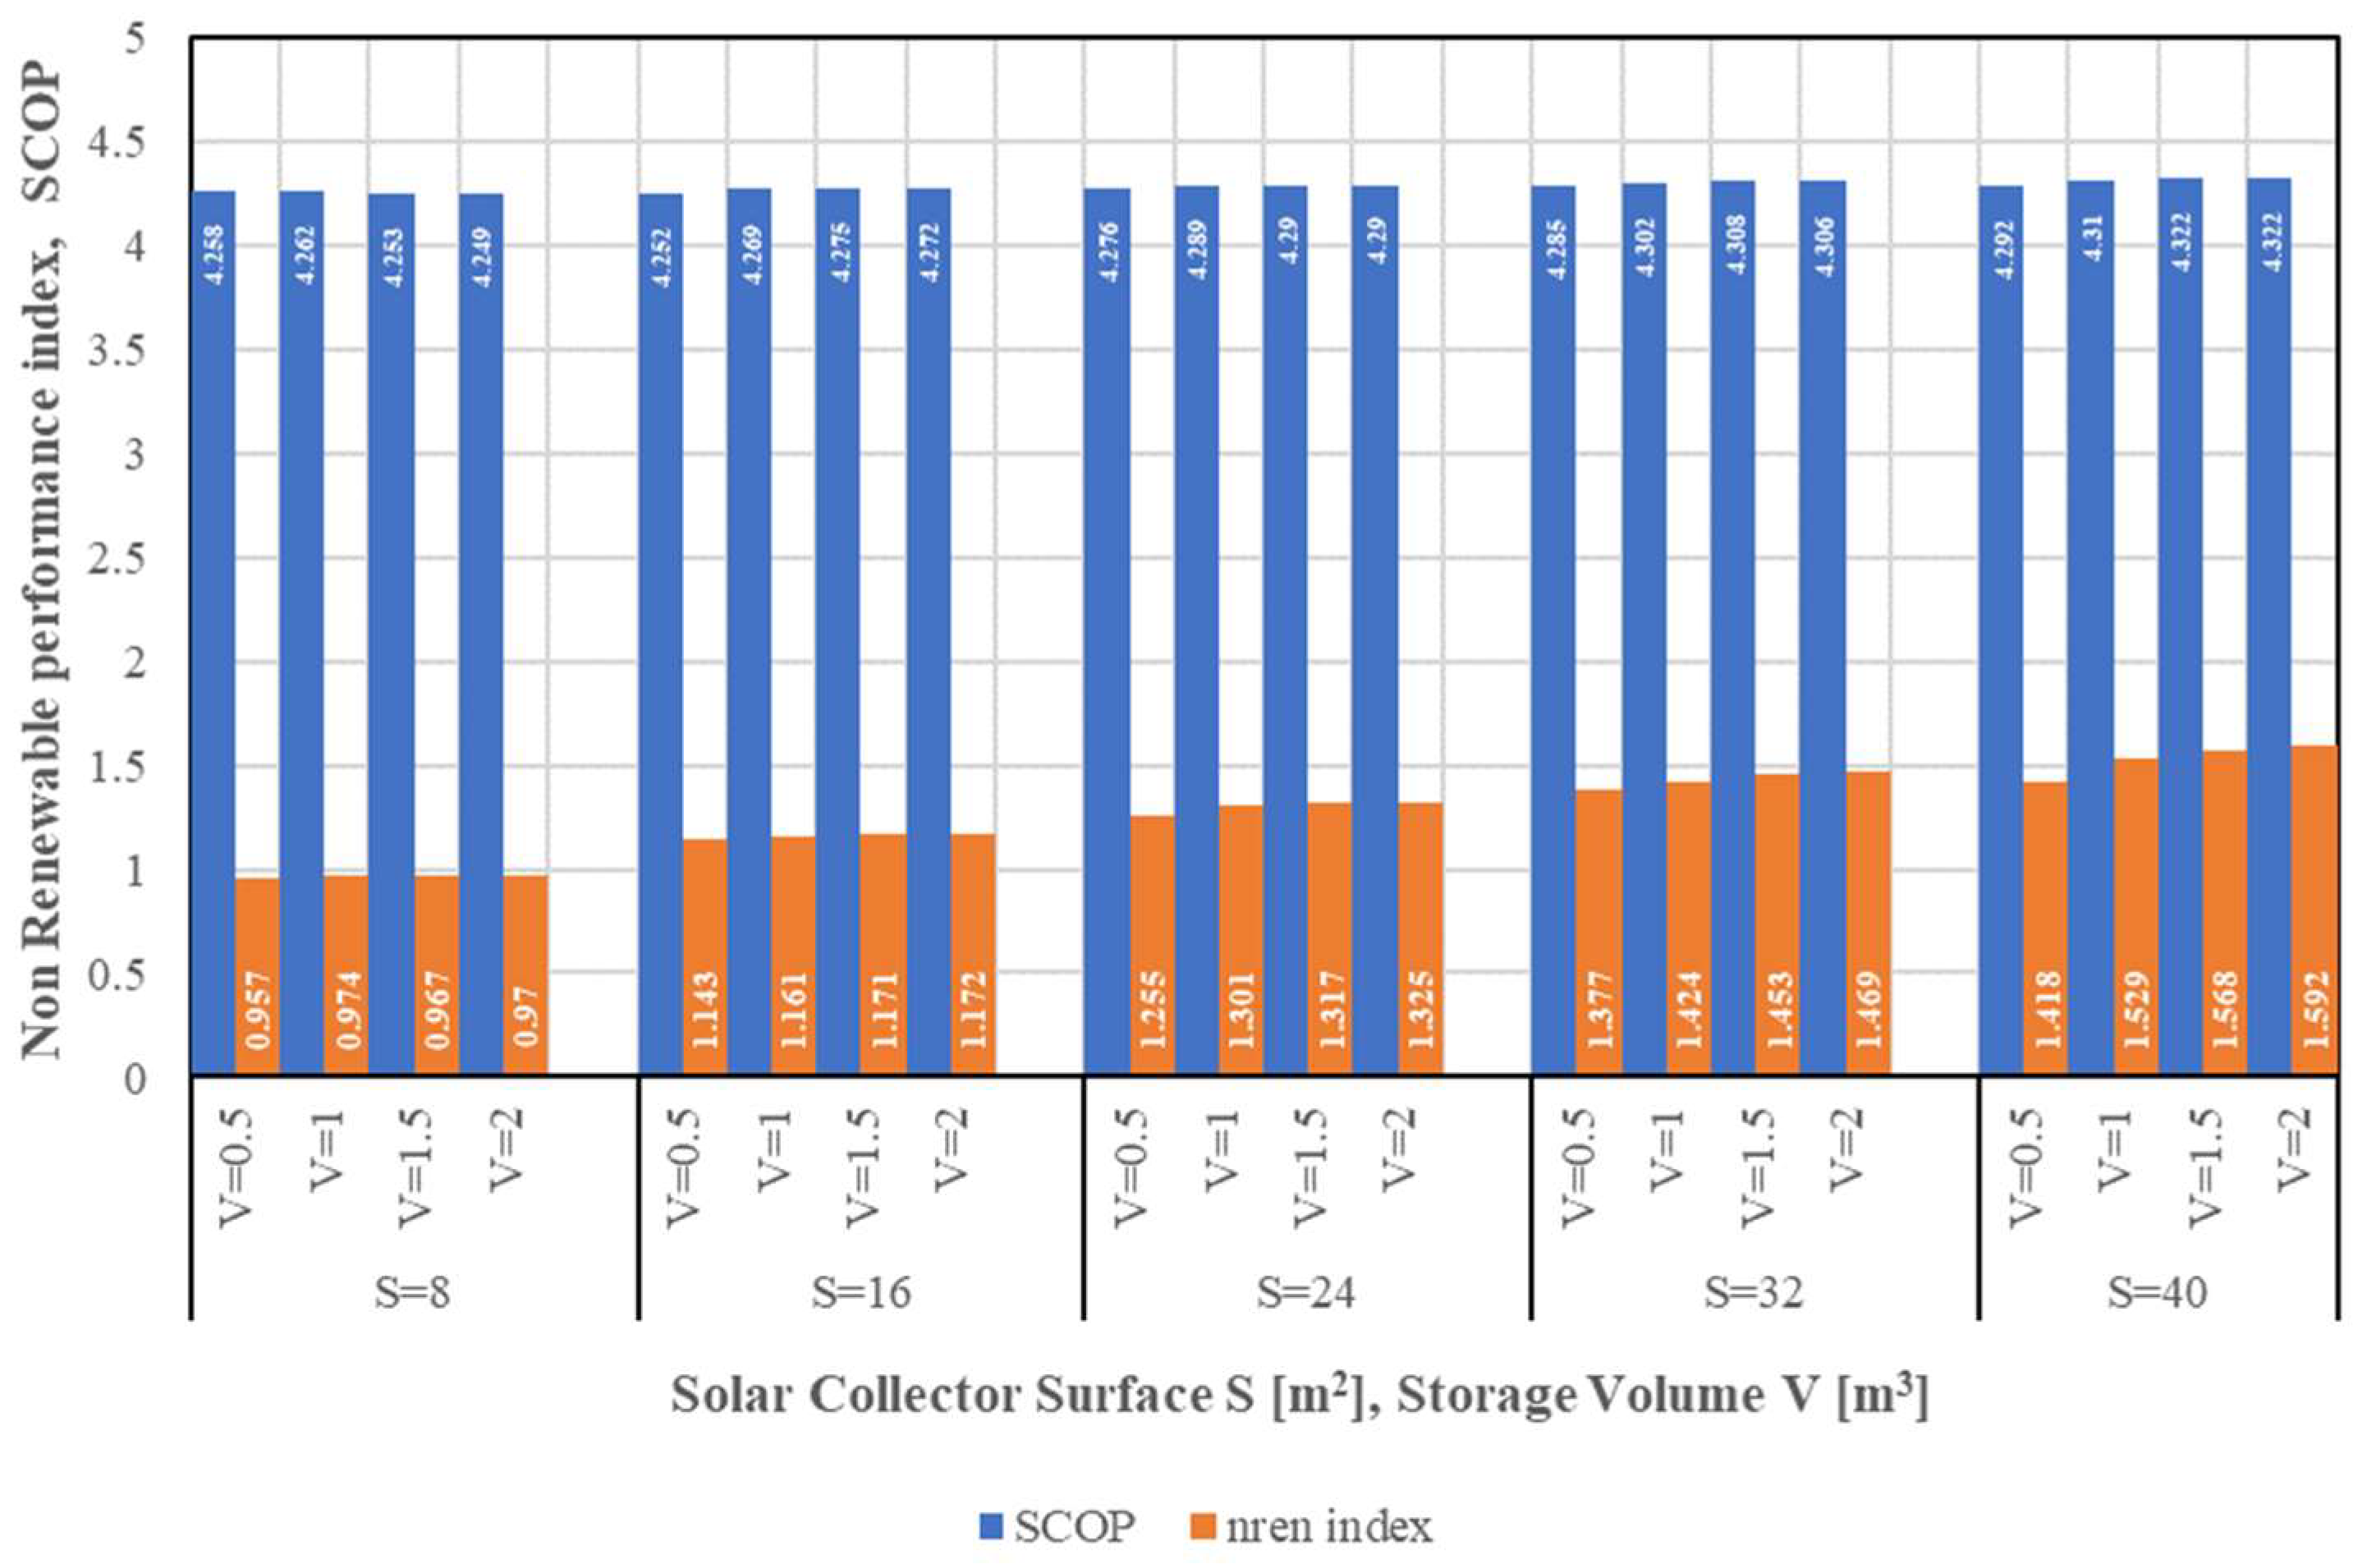
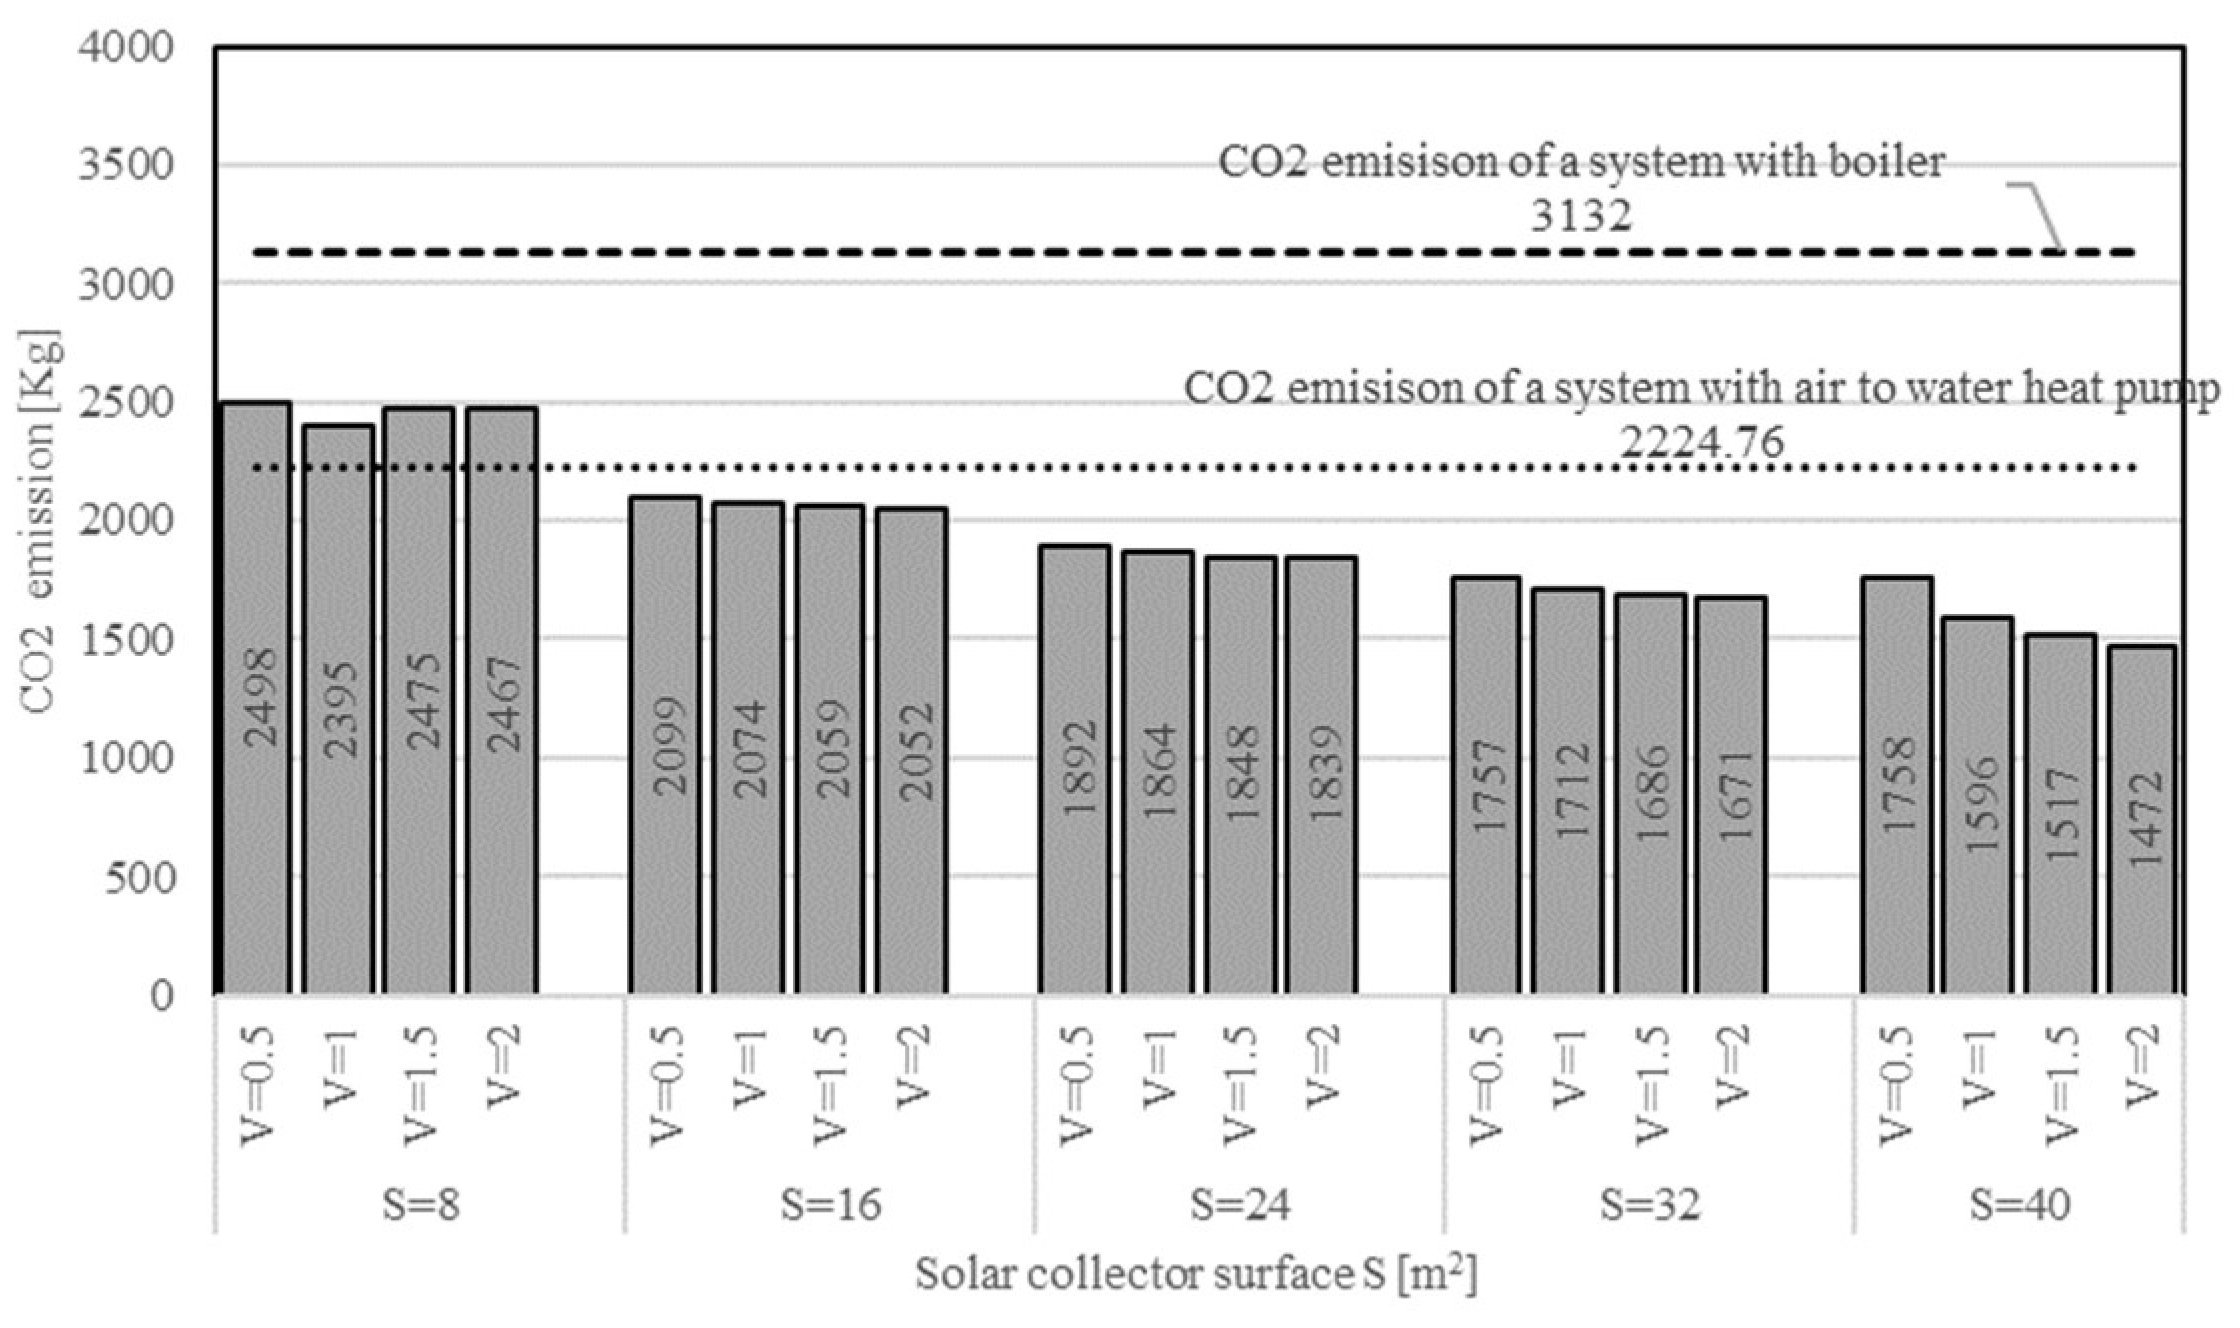
3. Results
- the heating demand covered directly by the system without the intervention of the auxiliary generator, as a function of the collecting surface and solar tank volume;
- the seasonal non-renewable performance index, defined as the ratio between the primary energy supplied to the building and the energy absorbed from the external environment;
- the share of the renewable energy employed for covering the heating demand;
- the CO2 emission level.
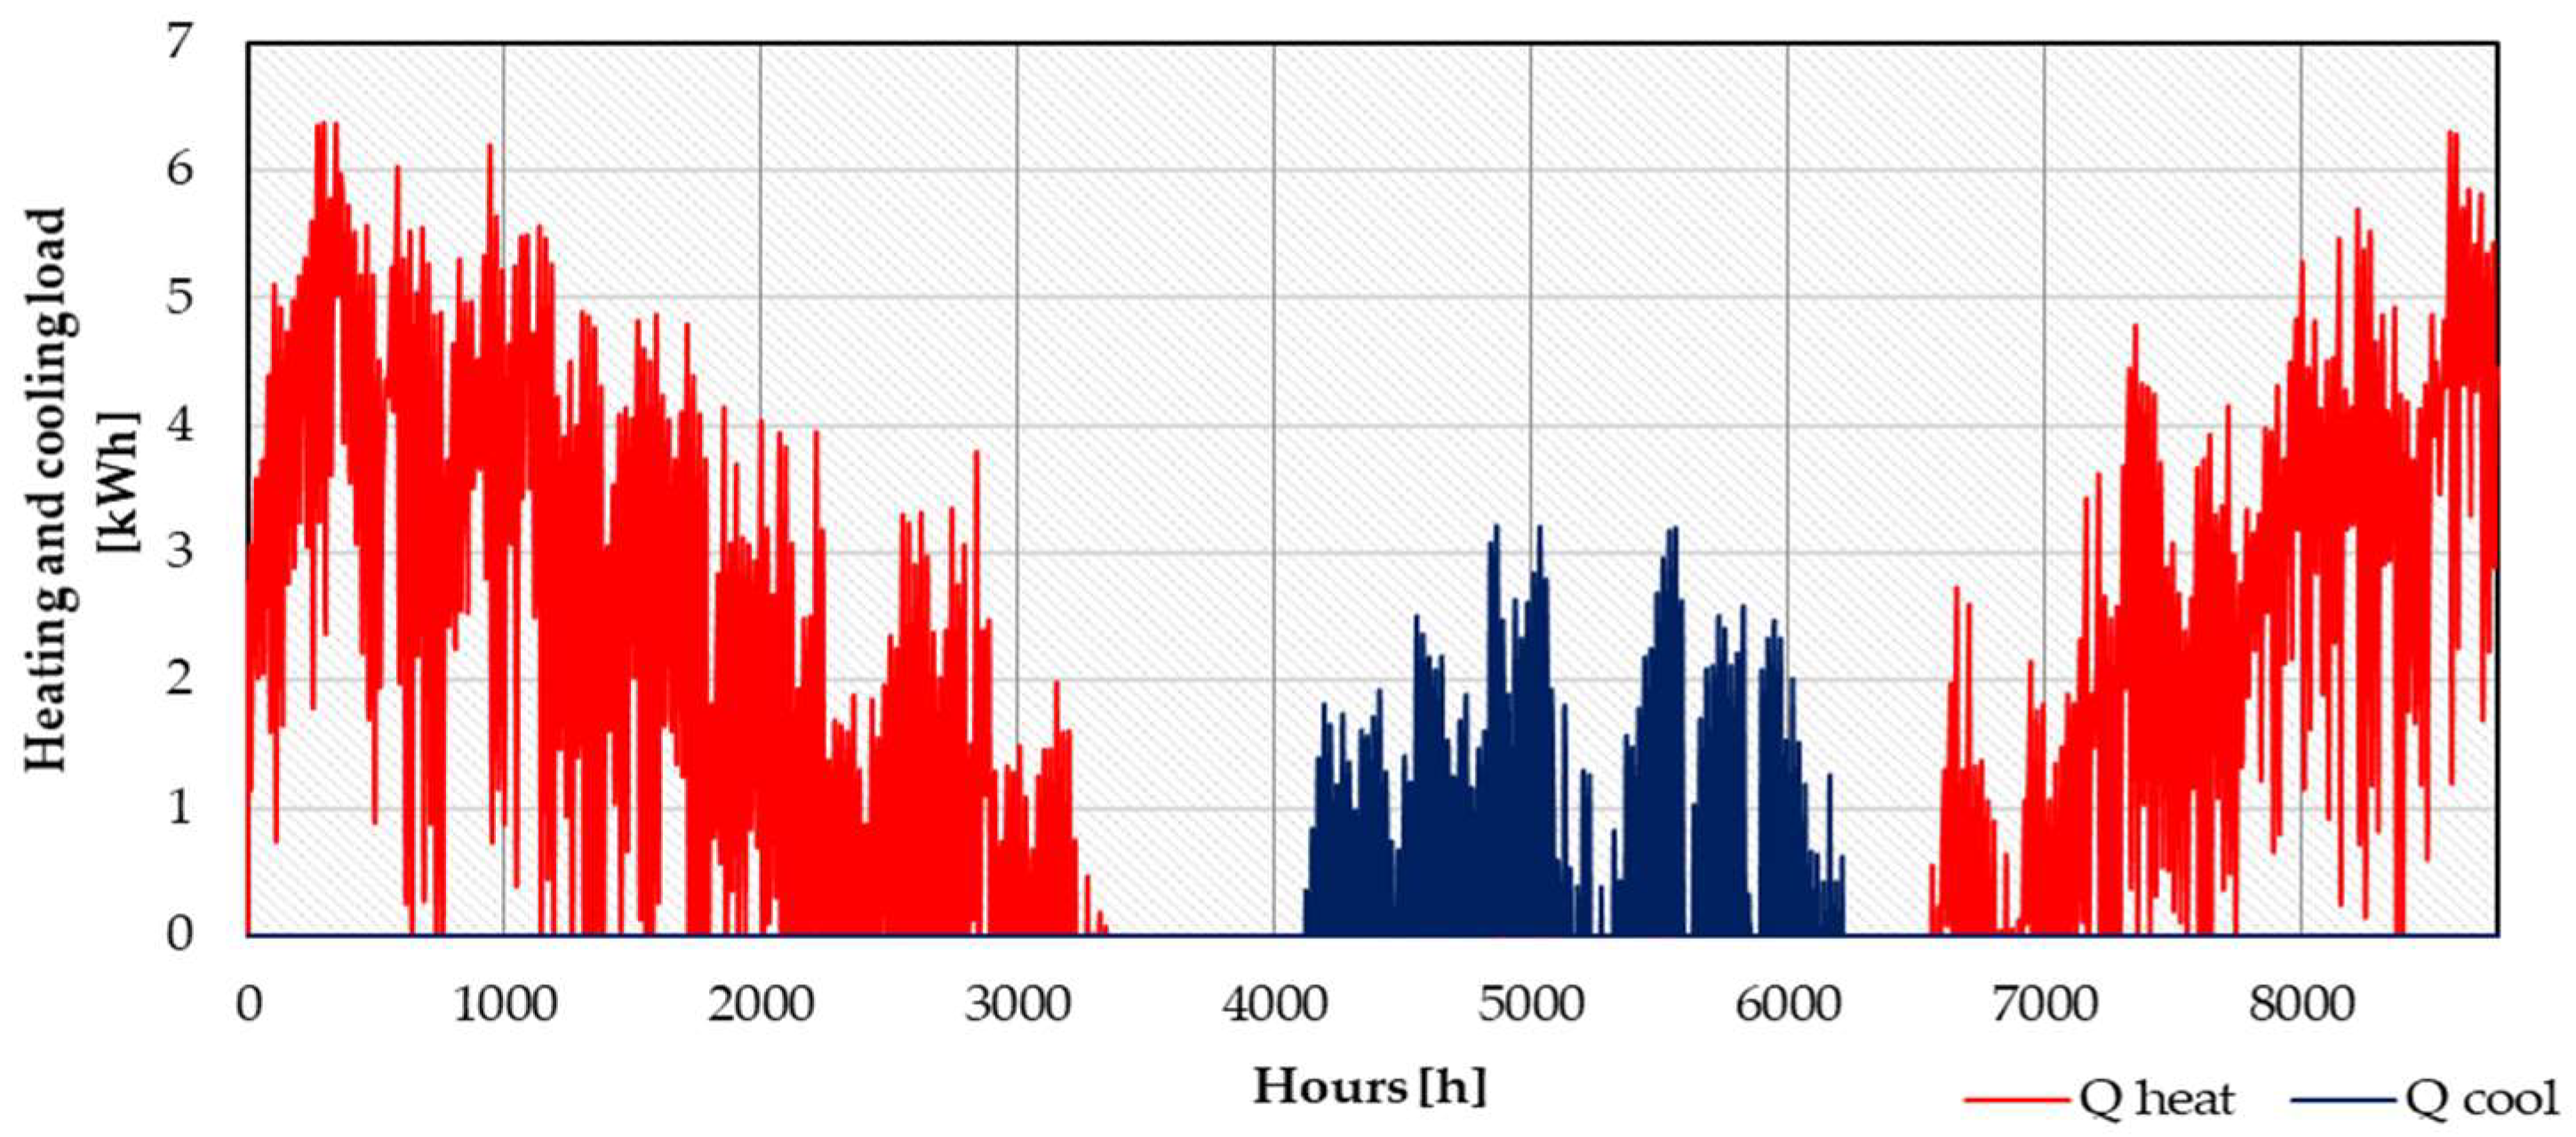
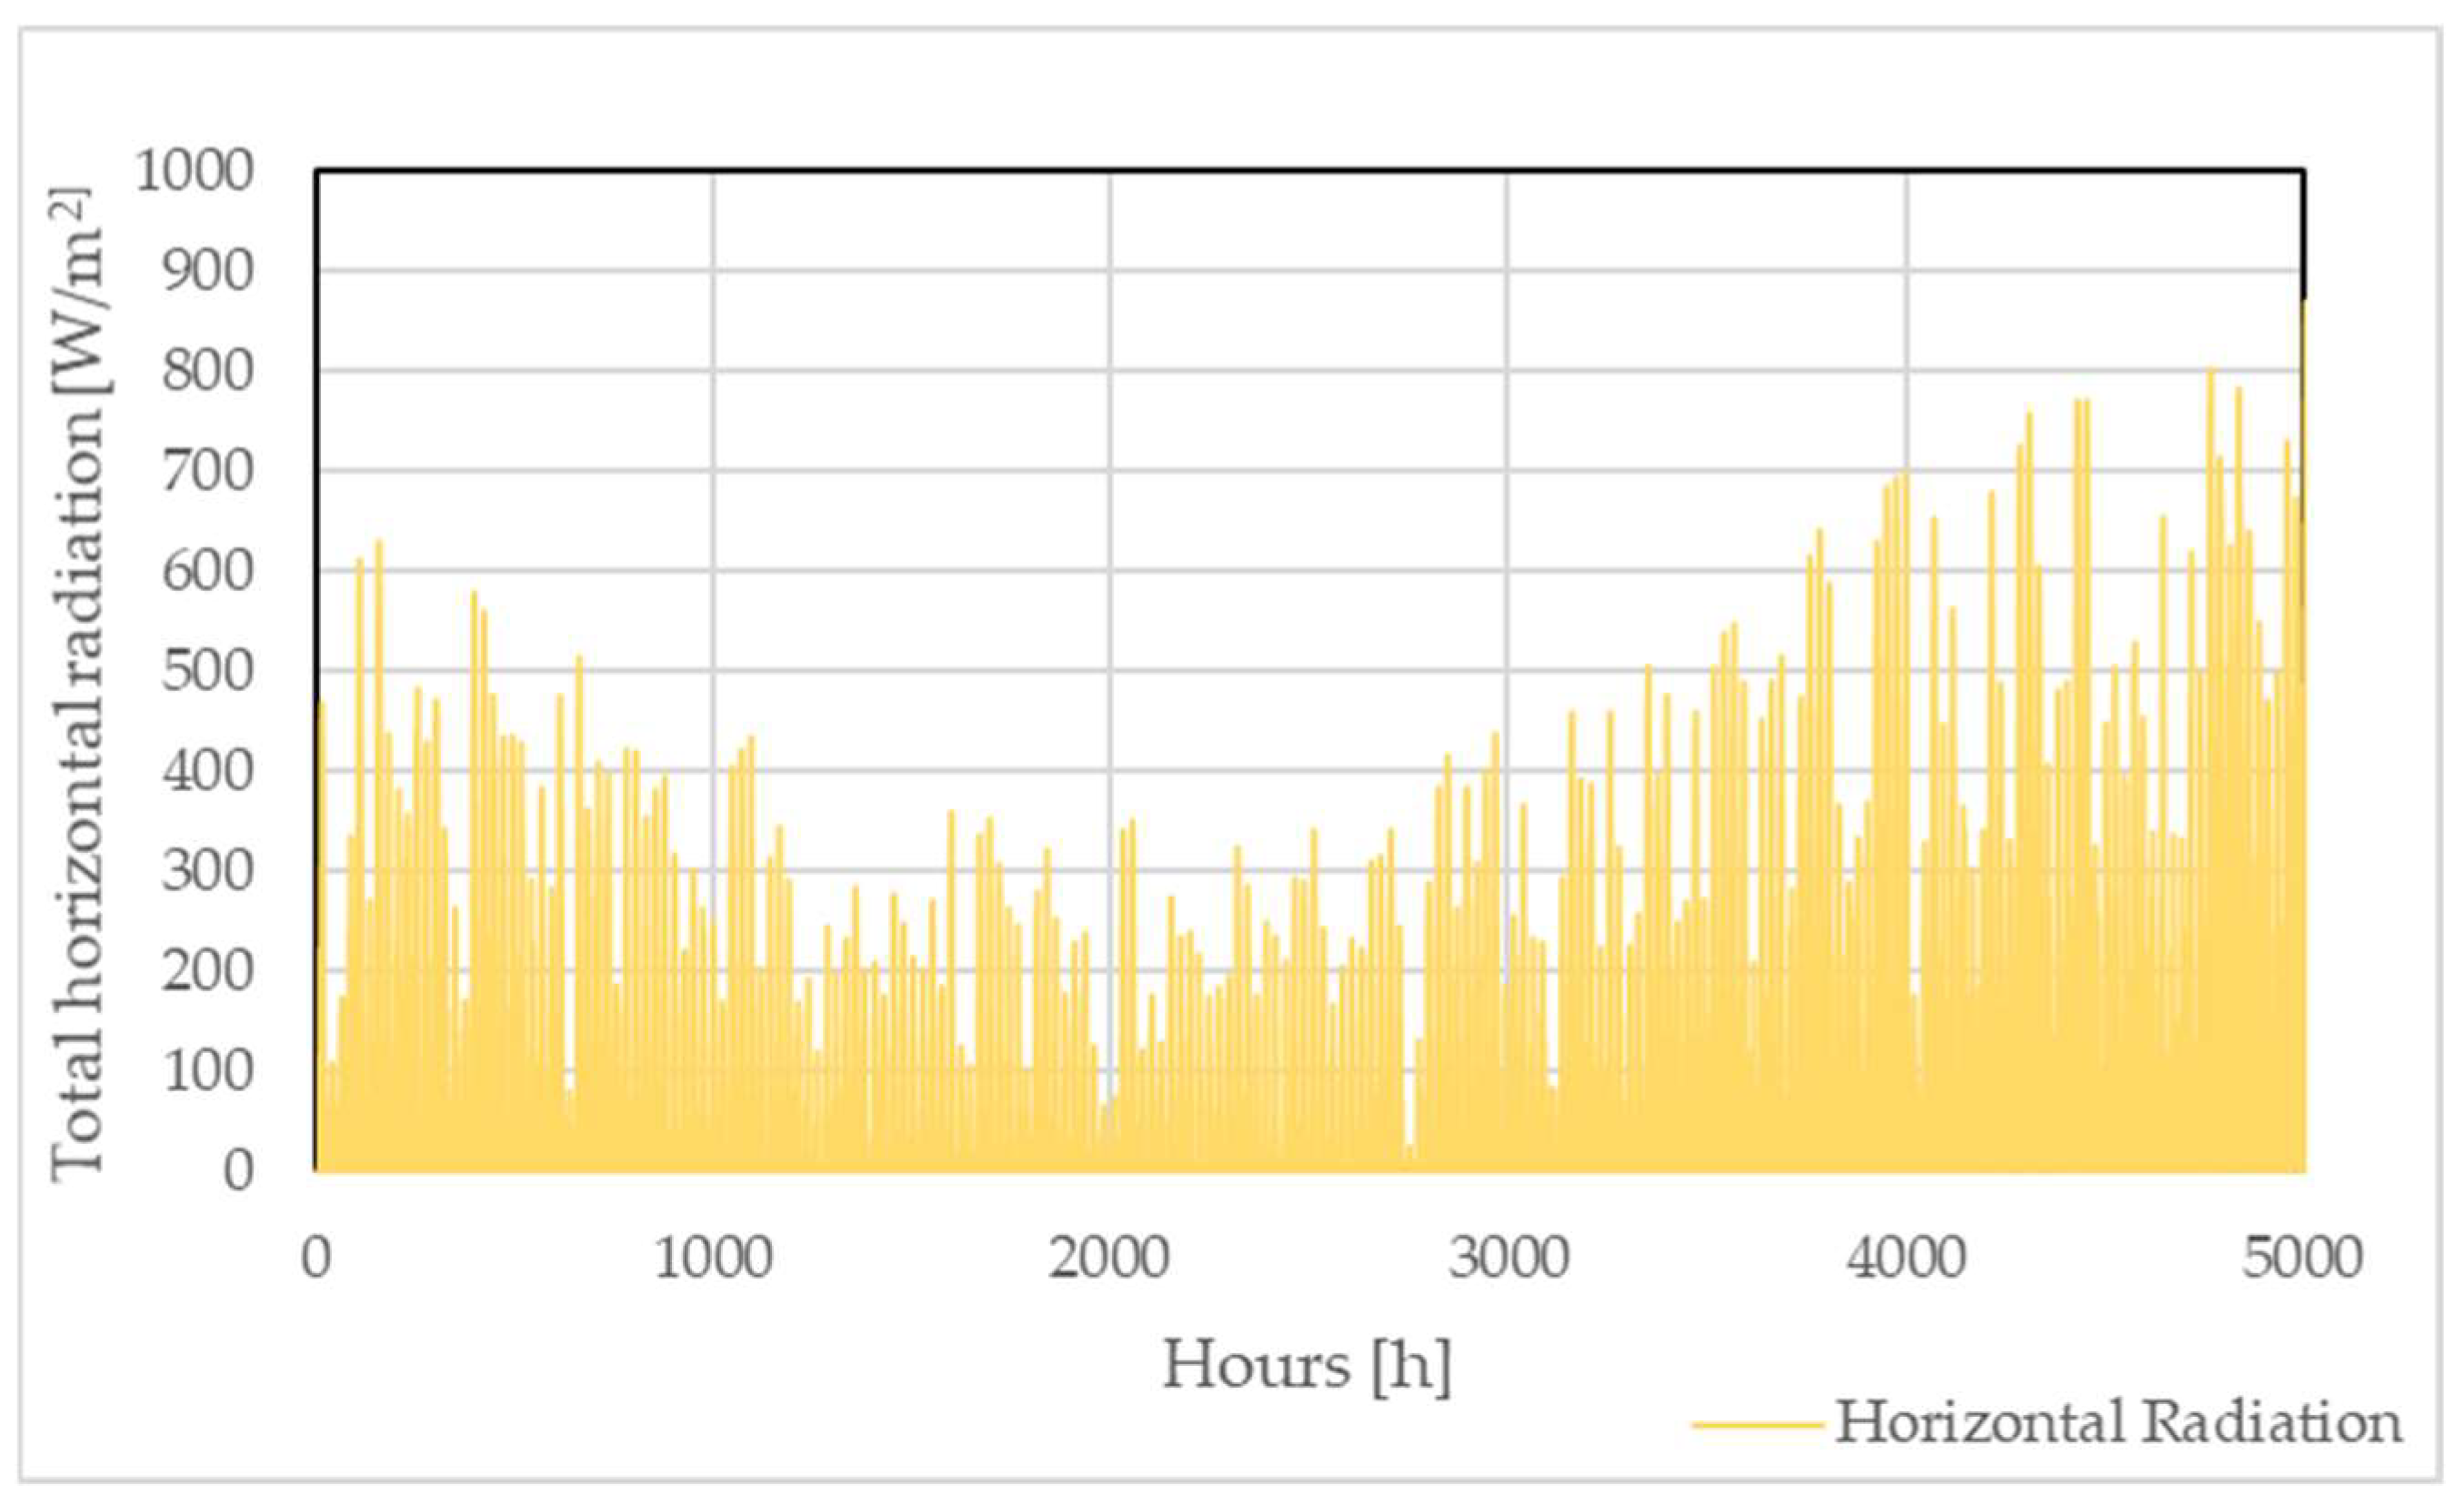
3.1. Calculation of the Heating Needs of the Reference Building in the Considered Climate
3.2. System Operational Description
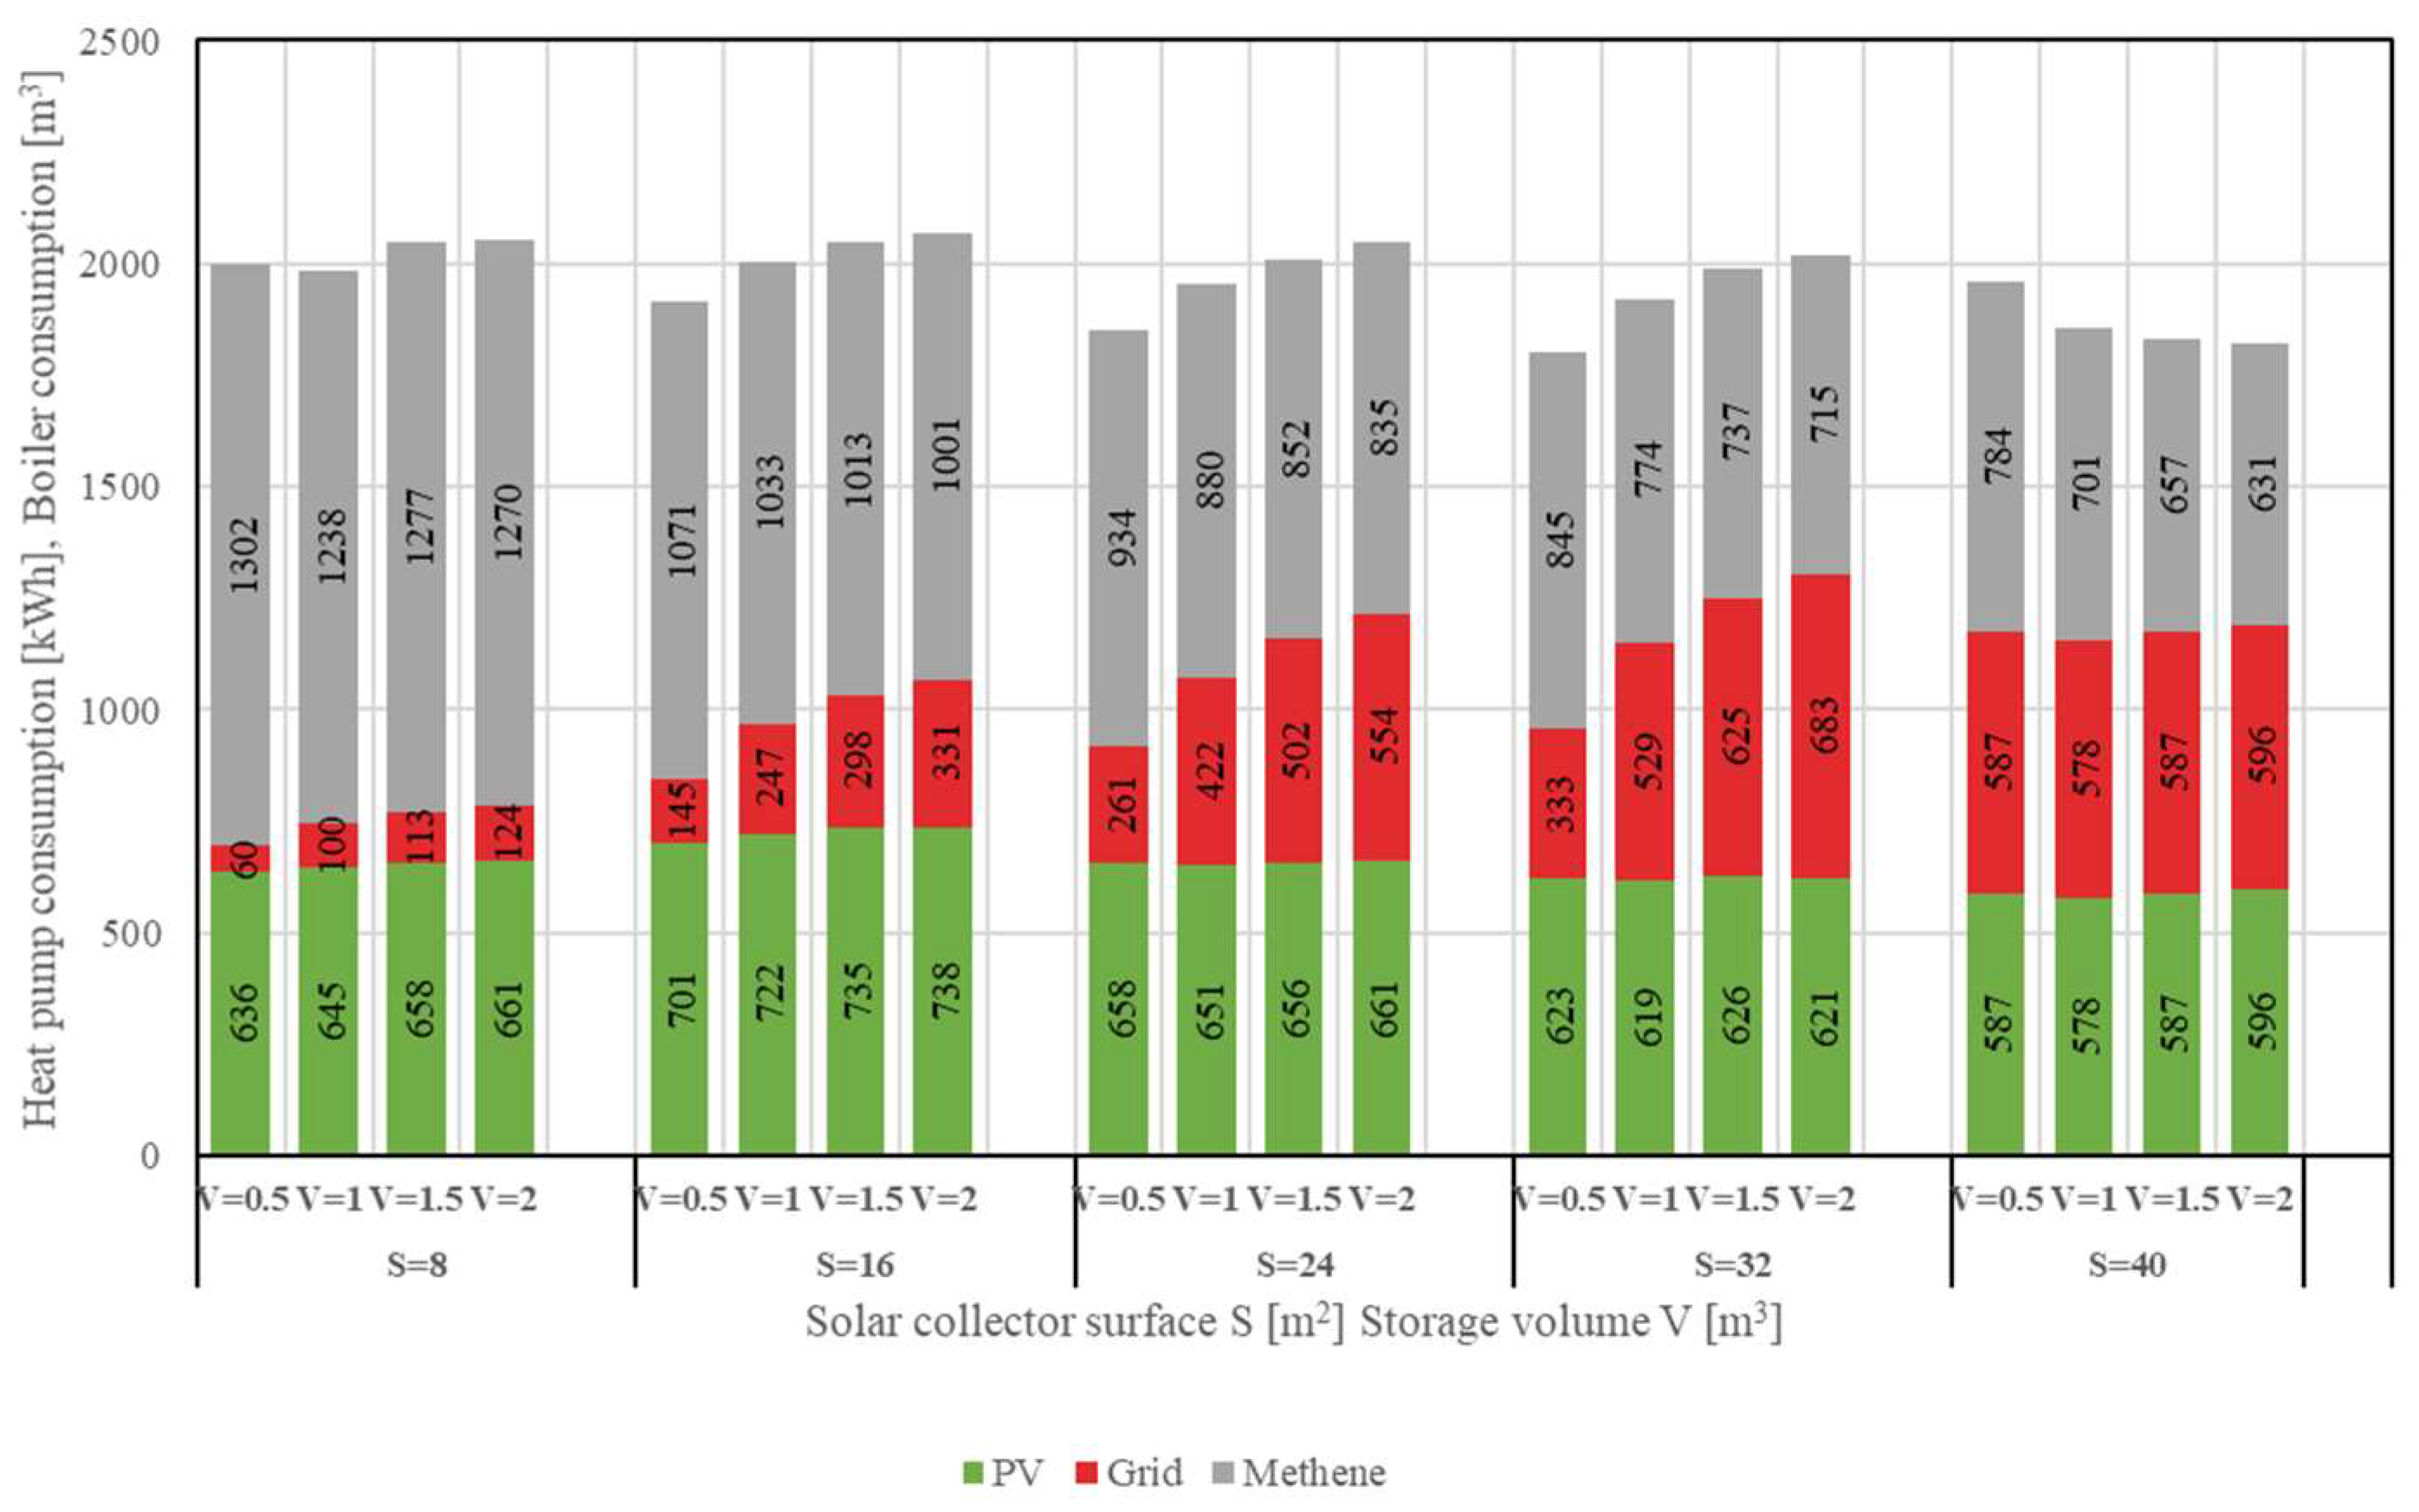
3.3. Electric Energy Demand and CO2 Emission
4. Conclusions
Author Contributions
Funding
Conflicts of Interest
References
- IEA. Data and Statistics. Available online: https://www.iea.org/data-and-statistics (accessed on 15 June 2021).
- Bruno, R.; Arcuri, N.; Carpino, C. The passive house in Mediterranean area: Parametric analysis and dynamic simulation of the thermal behavior of an innovative prototype. Energy Procedia 2015, 82, 533–539. [Google Scholar] [CrossRef] [Green Version]
- IEA. Tracking Buildings 2020; IEA: Paris, France, 2020. [Google Scholar]
- Arcuri, N.; Bruno, R.; Carpino, C. PV driven heat pumps for the electric demand-side management: Experimental results of a demonstrative plant. In Proceedings of the 2018 IEEE International Conference on Environment and Electrical Engineering and 2018 IEEE Industrial and Commercial Power Systems Europe (EEEIC/I&CPS Europe), Palermo, Italy, 12–15 June 2018; IEEE: Piscataway, NJ, USA, 2018; pp. 1–6. [Google Scholar] [CrossRef]
- Arcuri, N.; Bruno, R.; Bevilacqua, P.; Carpino, C. Strategies for the reduction of electricity consumptions in heat pumps: The role of the thermal inertia in buildings equipped with radiant systems. In Proceedings of the BS2019, Rome, Italy, 2–4 September 2019; pp. 1724–1731. [Google Scholar] [CrossRef]
- Fan, Y.; Zhao, X.; Han, Z.; Li, J.; Badiei, A.; Golizadeh, Y.; Liu, Z. Scientific and technological progress and future perspectives of the solar assisted heat pump ( SAHP ) system. Energy 2023, 229, 120719. [Google Scholar] [CrossRef]
- Liang, C.; Zhang, X.; Li, X.; Zhu, X. Study on the performance of a solar assisted air source heat pump system for building heating. Energy Build. 2011, 43, 2188–2196. [Google Scholar] [CrossRef]
- Xu, L.; Zhang, Y.; Luo, X. Applicability and comparison of solar-air source heat pump systems between cold and warm regions of plateau by transient simulation and experiment. Build. Simul. 2021, 14, 1697–1708. [Google Scholar] [CrossRef]
- Bakker, M.; Zondag, H.A.; Elswijk, M.J.; Strootman, K.J.; Jong, M.J.M. Performance and costs of a roof-sized PV/thermal array combined with a ground coupled heat pump. Sol. Energy 2005, 78, 331–339. [Google Scholar] [CrossRef]
- Charters, W.W.S.; Chaichana, C. Solar heat pump systems for domestic hot water. Sol. Energy 2002, 73, 169–175. [Google Scholar]
- Banister, C.J.; Collins, M.R. Development and performance of a dual tank solar-assisted heat pump system. Appl. Energy 2015, 149, 125–132. [Google Scholar] [CrossRef]
- Pinamonti, M.; Beausoleil-Morrison, I.; Prada, A.; Baggio, P. Water-to-water heat pump integration in a solar seasonal storage system for space heating and domestic hot water production of a single-family house in a cold climate. Sol. Energy 2021, 213, 300–311. [Google Scholar] [CrossRef]
- Buker, M.S.; Riffat, S.B. Solar assisted heat pump systems for low temperature water heating applications: A systematic review. Renew. Sustain. Energy Rev. 2016, 55, 399–413. [Google Scholar] [CrossRef]
- Emmi, G.; Zarrella, A.; Carli, M. De A heat pump coupled with photovoltaic thermal hybrid solar collectors: A case study of a multi-source energy system. Energy Convers. Manag. 2017, 151, 386–399. [Google Scholar] [CrossRef]
- Liu, Z.; Wang, Q.; Wu, D.; Zhang, Y.; Yin, H.; Yu, H.; Jin, G. Operating performance of a solar / air-dual source heat pump system under various refrigerant fl ow rates and distributions. Appl. Therm. Eng. 2020, 178, 115631. [Google Scholar] [CrossRef]
- Italian Interministerial Decree 26th June 2015: Application of Calculation Methods for Energy Performance and Definition of Minimum Building Requirements Italian Interministerial Decree 26th June 2015: Application of Calculation Methods for Energy Performance and Definition of Minimum Building Requirements. Off. Gazzette Ital. Repub. n°39 15th July 2015 2015, 1–8. Available online: https://www.mise.gov.it/images/stories/normativa/DM_requisiti_minimi.pdf (accessed on 13 January 2023).
- Peel, M.C.; Finlayson, B.L.; McMahon, T.A. Updated world map of the Köppen-Geiger climate classification. Hydrol. Earth Syst. Sci. 2007, 11, 1633–1644. [Google Scholar] [CrossRef] [Green Version]
- UNI/TS 11300–1; Building Energy Performance–Part 1: Evaluation of the Energy Need for Space Heating and Cooling. Ente Nazionale Italiano di Unificazione (UNI): Milan, Italy, 2014. (In Italian)
- CTI-Italian Thermotechincal Committee. Available online: https://www.cti2000.it/ (accessed on 13 July 2021).
- Bruno, R.; Bevilacqua, P.; Arcuri, N. Assessing cooling energy demands with the EN ISO 52016-1 quasi-steady approach in the Mediterranean area. J. Build. Eng. 2019, 24, 100740. [Google Scholar] [CrossRef]
- Bevilacqua, P.; Perrella, S.; Bruno, R.; Arcuri, N. An accurate thermal model for the PV electric generation prediction: Long-term validation in different climatic conditions. Renew. Energy 2021, 163, 1092–1112. [Google Scholar] [CrossRef]
- UNI/TS 11300–4; Building Energy Performance–Part 4: Use of Renewable Energies and Other Generation Methods for Winter Air Conditioning and for the Production of Domestic Hot Water. Ente Nazionale Italiano di Unificazione (UNI): Milan, Italy, 2016. (In Italian)
- Bevilacqua, P.; Perrella, S.; Cirone, D.; Bruno, R.; Arcuri, N. Efficiency improvement of photovoltaic modules via back surface cooling. Energies 2021, 14, 895. [Google Scholar] [CrossRef]
- Pinamonti, M.; Prada, A.; Baggio, P. Rule-based control strategy to increase photovoltaic self-consumption of a modulating heat pump using water storages and building mass activation. Energies 2020, 13, 6282. [Google Scholar] [CrossRef]
- Bevilacqua, P.; Bruno, R.; Rollo, A.; Ferraro, V. A novel thermal model for PV panels with back surface spray cooling. Energy 2022, 255, 124401. [Google Scholar] [CrossRef]
- Solar Energy Laboratory, University of Wisconsin-Madison. User Manual: TRNSYS 18 a TRaN Sient SYstem Simulation Program; TRNSYS Library, Volume 4 Mathematical Reference; Solar Energy Laboratory, University of Wisconsin-Madison: Madison, WI, USA, 2016. [Google Scholar]
- Bruno, R.; Nicoletti, F.; Cuconati, G.; Perrella, S.; Cirone, D. Performance indexes of an air-water heat pump versus the capacity ratio: Analysis by means of experimental data. Energies 2020, 13, 3391. [Google Scholar] [CrossRef]
- Diefenbach, N.; Loga, T.; Dascalaki, E.; Balaras, C.; Šijanec Zavrl, M.; Rakušček, A.; Corrado, V.; Corgnati, S.P.; Ballarini, I.; Renders, N.; et al. Application of Building Typologies for Modelling the Energy Balance of the Residential Building Stock; Institut Wohnen und Umwelt GmbH: Darmstadt, Germany, 2012; ISBN 9783941140233. [Google Scholar]
- Latõšov, E.; Volkova, A.; Siirde, A.; Kurnitski, J.; Thalfeldt, M. Primary energy factor for district heating networks in European Union member states. Energy Procedia 2020, 116, 69–77. [Google Scholar] [CrossRef]


| External Vertical Wall (U = 0.239 W/m2 K) | ||||
|---|---|---|---|---|
| Material | Thickness [cm] | Density [kg/m3] | Specific Heat [J/kg K] | Thermal Conductivity [W/mK] |
| Plaster | 2 | 1400 | 1000 | 0.700 |
| Bricks | 30 | 850 | 1000 | 0.182 * |
| Insulation | 8 | 70 | 1030 | 0.035 |
| Skim Coat | 2 | 1400 | 360 | 0.470 |
| Plaster | 1 | 1400 | 1000 | 0.700 |
| Solar Tank | Secondary Tank | |
|---|---|---|
| Heat transfer fluid | Water | Water |
| Specific heat capacity | 4.182 kJ/kg K | 4.182 kJ/kg K |
| Fluid density | 992 Kg/m3 | 992 Kg/m3 |
| Thermal conductivity of the fluid | 0.62 W/m K | 0.62 W/m K |
| Max storage temperature | 80 °C | 80 °C |
| Tank volume | parametric | 0.5 m3 |
| Tank height | 1 m | 1 m |
| Number of tank nodes | 5 | 5 |
| Top loss coefficient | 0.923 W/m2 K | 0.923 W/m2 K |
| Bottom loss coefficient | 0.923 W/m2 K | 0.923 W/m2 K |
| Edge loss coefficient | 0.923 W/m2 K | 0.923 W/m2 K |
| Heat Pump | |
|---|---|
| Type | Water-to-Water |
| Rated Heating Capacity | 7.93 kW |
| Rated COP | 3.78 |
| Evaporator water flow rate | 1722 l/h |
| Condenser water flow rate | 1369 l/h |
| Photovoltaic Panels Feature | |
|---|---|
| Panel type | Polycrystalline silicon |
| Area | 1.627 m2 |
| Nominal Power | 280 W |
| Panels number | 22 |
| Voltage at max power | 31 V |
| Current at max power | 9.07 A |
| Short-circuit current | 9.76 A |
| Open circuit voltage | 38 V |
| Temperature coefficient of Isc | −0.31%/°C |
| Temperature coefficient of Voc | 0.05%/°C |
| NOCT | 45 °C |
| Nominal efficiency | 0.15 |
| Energy Carrier | PEF,nren | PEF,ren | PEF,tot | kgCO2eq/kWh |
|---|---|---|---|---|
| Natural gas | 1.05 | 0 | 1.05 | 0.21 |
| Electricity energy from the grid | 1.95 | 0.47 | 2.42 | 0.46 |
| Electricity from PV | 0.00 | 1.00 | 1.00 | 0.00 |
| Thermal solar collector | 0.00 | 1.00 | 1.00 | 0.00 |
| S (m2) | V = 0.5 m3 | V = 1 m3 | V = 1.5 m3 | V = 2 m3 | ||||
|---|---|---|---|---|---|---|---|---|
| kWhele | kWhgas | kWhele | kWhgas | kWhele | kWhgas | kWhele | kWhgas | |
| 8 | 695 | 11,765 | 746 | 11,616 | 771 | 11,538 | 785 | 11,483 |
| 16 | 846 | 9676 | 969 | 9333 | 1033 | 9156 | 1069 | 9048 |
| 24 | 919 | 8443 | 1074 | 7951 | 1158 | 7695 | 1216 | 7550 |
| 32 | 956 | 7636 | 1148 | 6996 | 1252 | 6660 | 1304 | 6467 |
| 40 | 983 | 7084 | 1172 | 6331 | 1294 | 5938 | 1369 | 5705 |
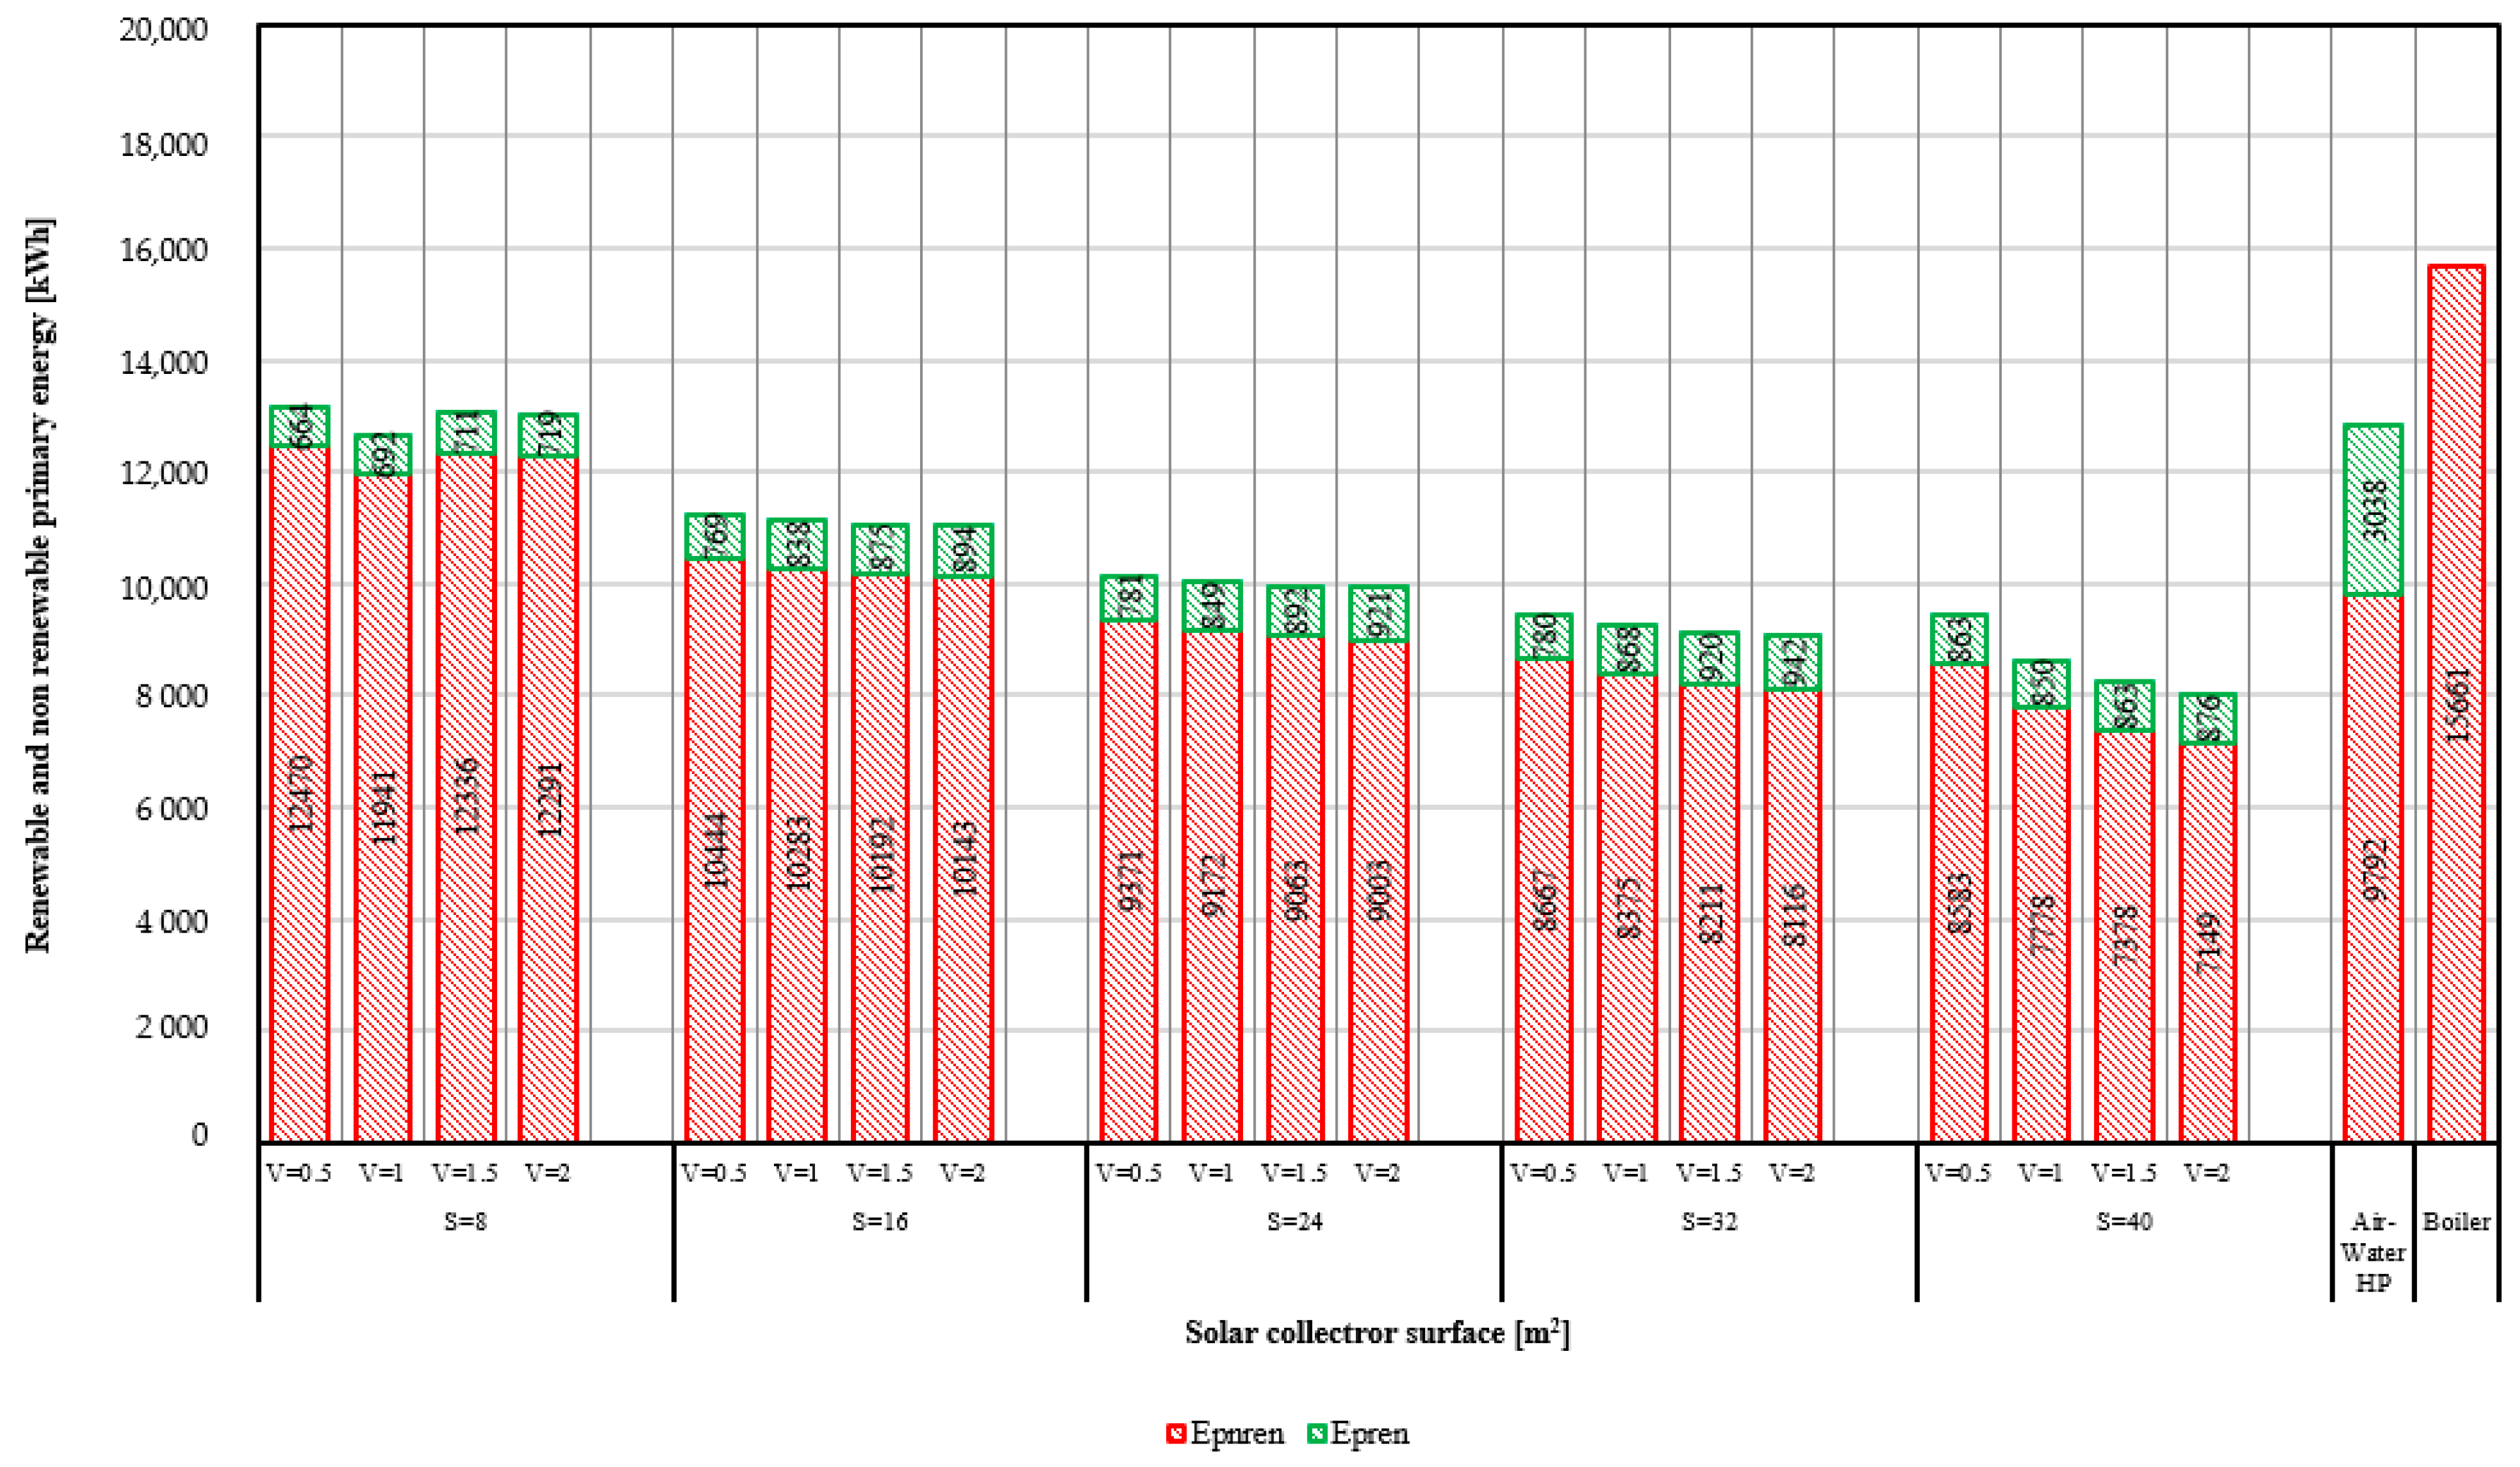
| S (m2) | V = 0.5 m3 | V = 1 m3 | V = 1.5 m3 | V = 2 m3 | ||||
|---|---|---|---|---|---|---|---|---|
| Epren [kWh] | Epnren [kWh] | Epren [kWh] | Epnren [kWh] | Epren [kWh] | Epnren [kWh] | Epren [kWh] | Epnren [kWh] | |
| 8 | 664 | 12,470 | 692 | 11,941 | 771 | 12,336 | 720 | 12,292 |
| 16 | 769 | 10,445 | 839 | 10,282 | 875 | 10,192 | 893 | 10,143 |
| 24 | 780 | 9371 | 850 | 9173 | 891 | 9063 | 921 | 9003 |
| 32 | 780 | 8867 | 867 | 8377 | 919 | 8211 | 942 | 8116 |
| 40 | 863 | 8210 | 850 | 7811 | 863 | 8116 | 877 | 7149 |
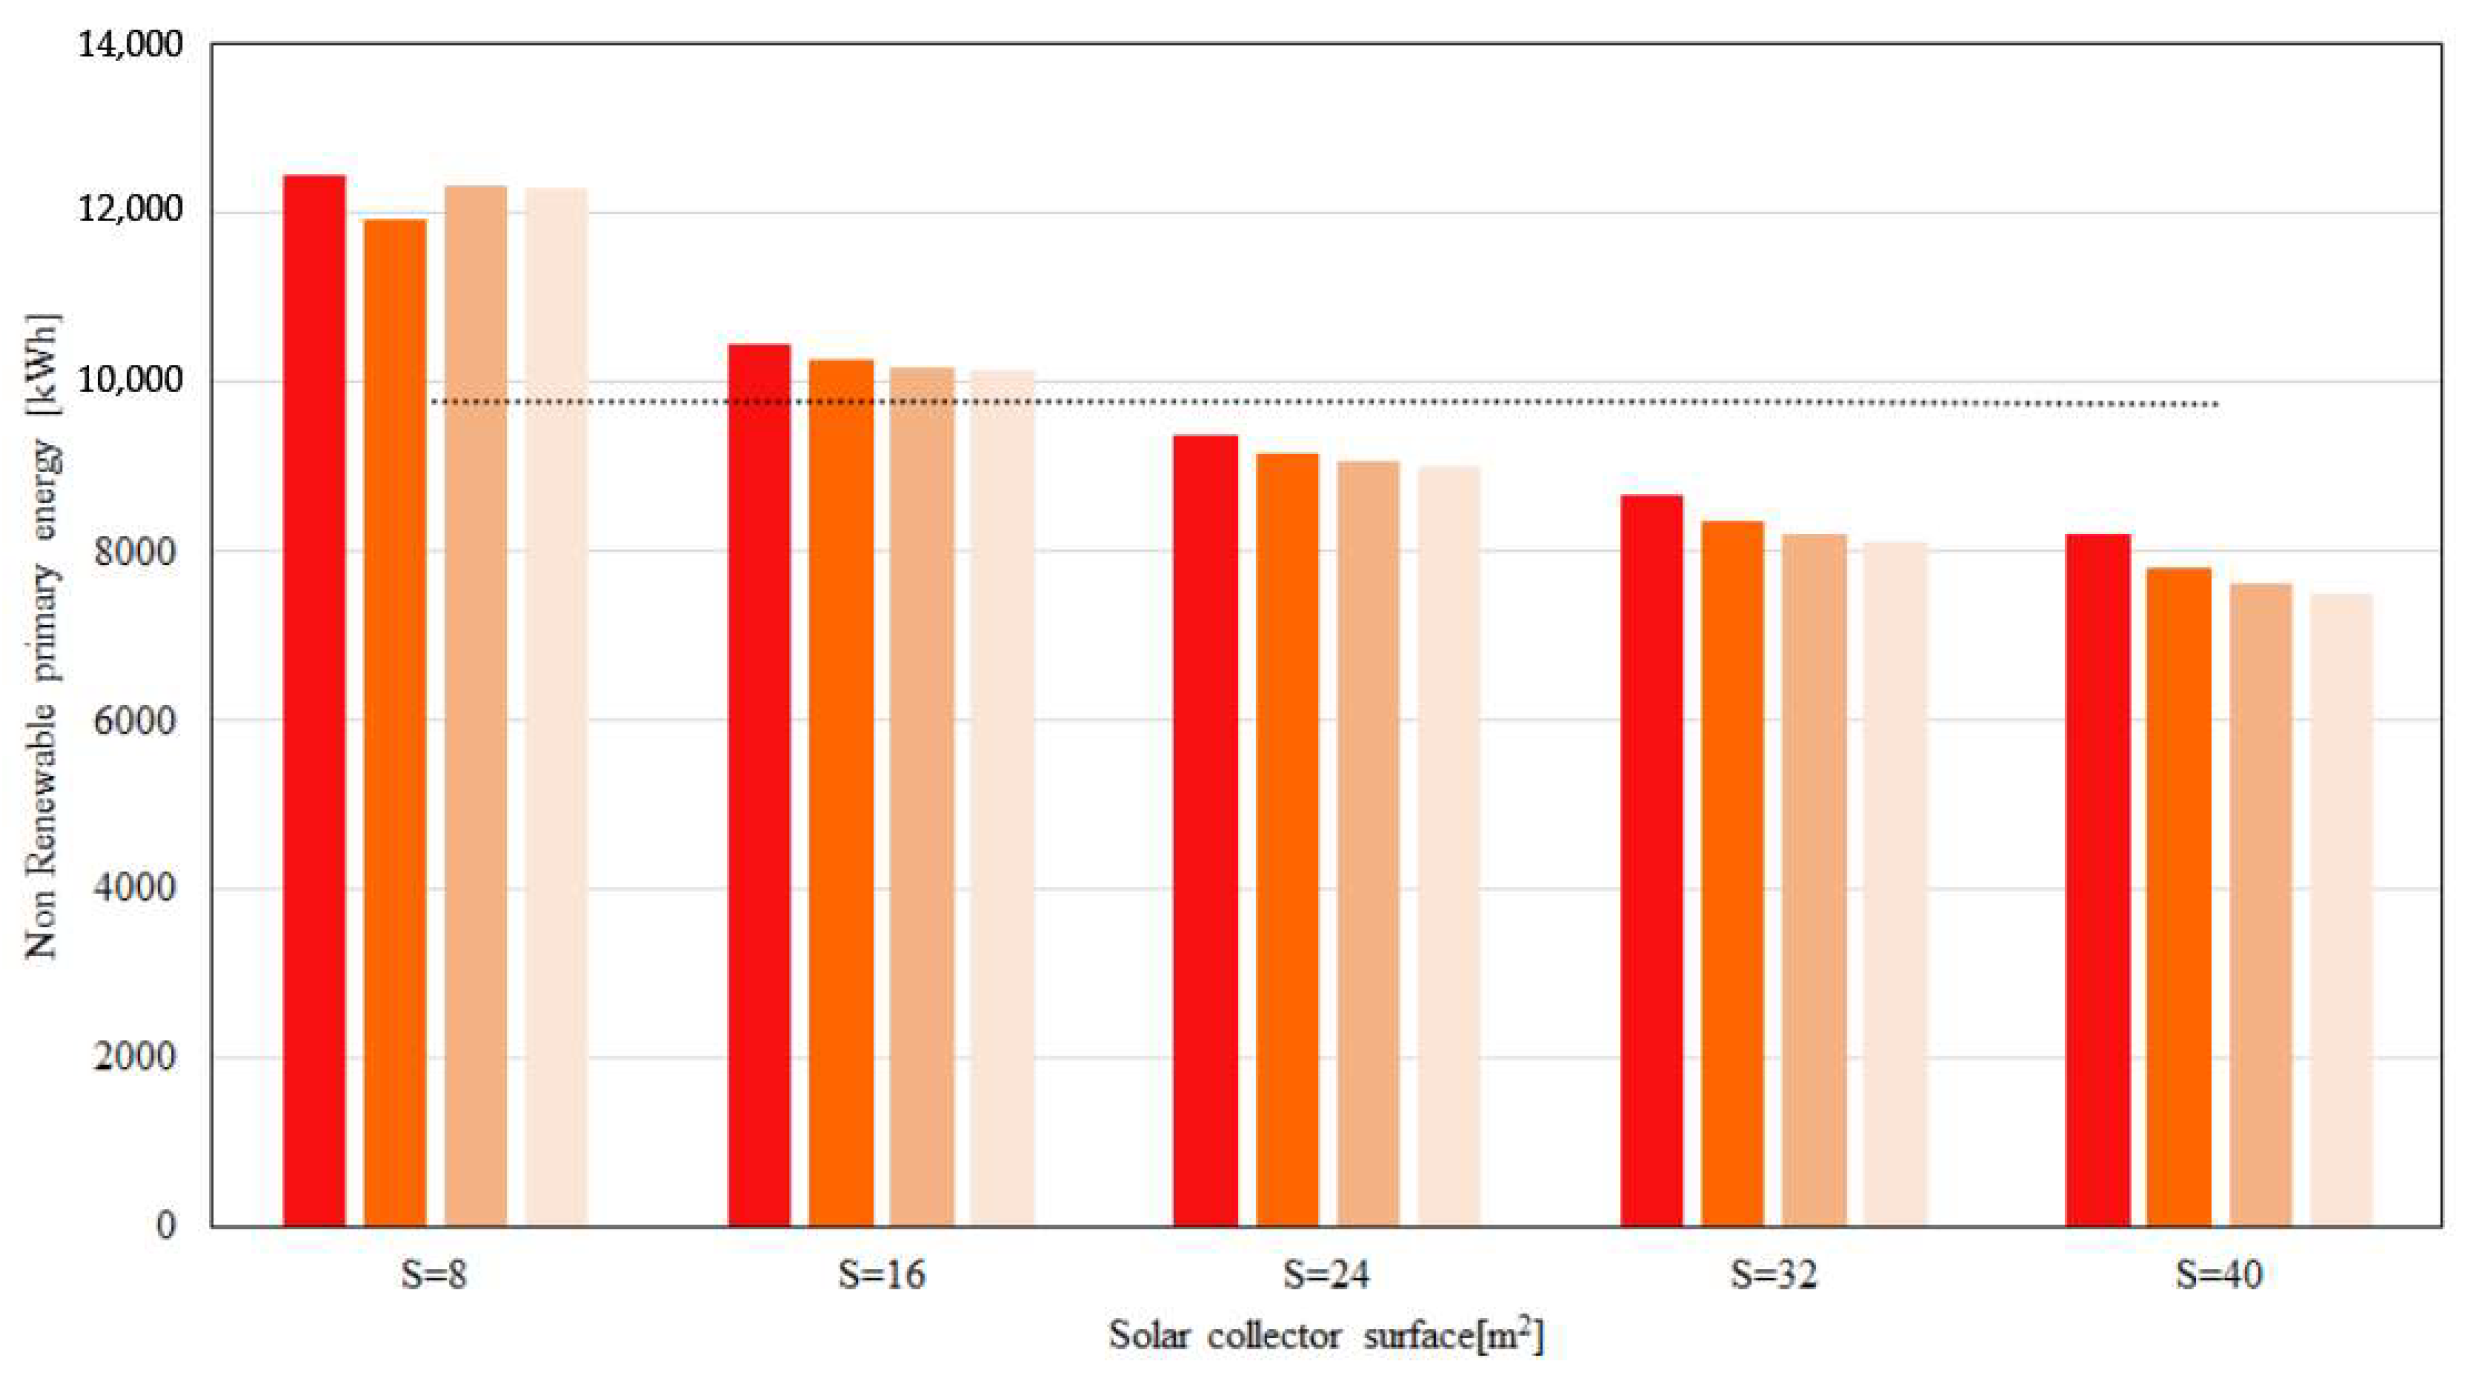
| S (m2) | Epnren [kWh] | |||
|---|---|---|---|---|
| V = 0.5 m3 | V = 1 m3 | V = 1.5 m3 | V = 2 m3 | |
| 8 | 12,470 | 11,941 | 12,336 | 12,292 |
| 16 | 10,445 | 10,282 | 10,192 | 10,143 |
| 24 | 9371 | 9173 | 9173 | 9003 |
| 32 | 8867 | 8377 | 8377 | 8116 |
| 40 | 8210 | 7811 | 7811 | 7496 |
| Air-to-Water Heat Pump | 9791.7 | |||
| Boiler | 15,661 | |||
| V = 0.5 m3 | V = 1 m3 | V = 1.5 m3 | V = 2 m3 | |||||
|---|---|---|---|---|---|---|---|---|
| S (m2) | System 1 | System 2 | System 1 | System 2 | System 1 | System 2 | System 1 | System 2 |
| 8 | 27.35% | −20.38% | 21.95% | −23.75% | 25.98% | −21.23% | 25.53% | −21.51% |
| 16 | 6.67% | −33.31% | 5.01% | −34.35% | 4.09% | −34.92% | 3.59% | −35.23% |
| 24 | −4.30% | −40.16% | −6.32% | −41.43% | −7.45% | −42.14% | −8.05% | −42.51% |
| 32 | −9.44% | −43.38% | −14.45% | −46.51% | −16.14% | −47.57% | −17.11% | −48.18% |
| 40 | −12.34% | −45.20% | −20.57% | −50.34% | −24.65% | −52.89% | −26.99% | −54.35% |
Disclaimer/Publisher’s Note: The statements, opinions and data contained in all publications are solely those of the individual author(s) and contributor(s) and not of MDPI and/or the editor(s). MDPI and/or the editor(s) disclaim responsibility for any injury to people or property resulting from any ideas, methods, instructions or products referred to in the content. |
© 2023 by the authors. Licensee MDPI, Basel, Switzerland. This article is an open access article distributed under the terms and conditions of the Creative Commons Attribution (CC BY) license (https://creativecommons.org/licenses/by/4.0/).
Share and Cite
Perrella, S.; Bruno, R.; Bevilacqua, P.; Cirone, D.; Arcuri, N. Energy Evaluations of a New Plant Configuration for Solar-Assisted Heat Pumps in Cold Climates. Sustainability 2023, 15, 1663. https://0-doi-org.brum.beds.ac.uk/10.3390/su15021663
Perrella S, Bruno R, Bevilacqua P, Cirone D, Arcuri N. Energy Evaluations of a New Plant Configuration for Solar-Assisted Heat Pumps in Cold Climates. Sustainability. 2023; 15(2):1663. https://0-doi-org.brum.beds.ac.uk/10.3390/su15021663
Chicago/Turabian StylePerrella, Stefania, Roberto Bruno, Piero Bevilacqua, Daniela Cirone, and Natale Arcuri. 2023. "Energy Evaluations of a New Plant Configuration for Solar-Assisted Heat Pumps in Cold Climates" Sustainability 15, no. 2: 1663. https://0-doi-org.brum.beds.ac.uk/10.3390/su15021663