1. Introduction
Watercourses are a foundational part of many cities, as they have promoted cultural and economic development [
1]. Yet, they can also represent a significant threat for citizens, agriculture, tourism, productive activities, ecosystems, biodiversity, and environmental and archaeological heritage [
2]. This is especially true in the recent years characterized by climate change with an increasing frequency of extreme weather events. Floods are hydrogeological instability phenomena that have increased in frequency because of land consumption and climate change and that increasingly affect areas rich in watercourses, such as Italian territory, as highlighted by the National Research Council (CNR) with the Research Institute for Hydrogeological Protection (ISPRI) [
3]. The risk related to floods can be conceived as consisting of four interconnected factors, namely hazard, vulnerability, exposure, and risk [
4]. Notably, the outcome of the first three factors will affect the latter. While structural prevention measures have an impact on hazards, non-structural measures, such as training, impact the adaptive and coping capacity of the population, influencing the residual risk. In this picture, the ability of citizens to promptly recognize and react to the first signs of upcoming inundation is of paramount importance not only to save lives but also to protect the urban environment and local businesses and ensure sustainability.
Virtual reality (VR) is a known valuable tool for delivering learning experiences about high-risk situations, e.g., during a fire [
5,
6]. More specifically, VR environments can be purposefully designed to enable users to practice correct behaviors in safe simulated emergency situations, aiming to equip them with the knowledge and resources needed to implement effective coping strategies when they will face actual high-risk environments. Virtual training has also been considered a solution in contexts where traditional face-to-face meetings are not possible, such as during the COVID-19 confinement [
7]. Furthermore, the increasing availability and affordability of VR headsets have made VR experiences accessible to the wider public [
8]. However, there is still a lack of in-depth research on what kind of content should be included to effectively convey factual and behavioral knowledge. Furthermore, previous research has neglected the impact that the preliminary stage of learning how to operate the environment, namely the training phase, has on users’ ability to focus on the actual contents during the virtual simulation.
To address the gaps outlined above, the present study had a twofold aim. Firstly, it was meant to assess the educational impact of the VR experience by combining both self-report and objective data. Secondly, we aimed to measure the impact that three training experiences, differing in the level of contextualization and interaction, have on the ability of users to comprehend and retain the knowledge conveyed during the VR experience.
1.1. Virtual Reality Emergency Training
VR technology has been successfully used for educational purposes in the emergency field, such as teaching the correct procedures to implement in risky situations, usually through immersive serious games [
9,
10]. Various studies have explored the potential of VR for simulating different types of emergencies, including earthquakes [
11,
12], wildfires [
13,
14], and military or terrorist attacks [
15]. Recently, the increased frequency and intensity of extreme meteorological events have led researchers to also investigate VR for the prevention of typhoons [
16] and floods [
17,
18,
19]. In particular, concerning floods, previous works have addressed different aspects. For example, Fujimi and Fujimura [
19] proposed a VR application focused on the promotion of efficient decisions during evacuation. They observed that users react to environmental and social cues in the virtual environment. Differently, Mol and colleagues [
18] used virtual reality to increase risk perception, coping evaluation, negative emotions, and harm reduction behavior through a simulated flood experience. D’Amico and colleagues [
17] developed a non-immersive experience for flood emergency training, showing a significant increase in self-efficacy and safety knowledge after the VR experience. Besides being scarce, previous studies on the use of VR for addressing the risks related to river floods failed to consider important psychological factors, e.g., cognitive load, that impact users’ ability to effectively comprehend and retain the content.
1.2. Psychological Factors Involved in the Learning Experience in VR
When designing and developing an immersive virtual reality (IVR) experience—whether it involves a computer automatic virtual environment (CAVE) or head-mounted displays (HMDs)—meant to deliver educational content, focusing on the realism of the digital environment is not enough to make it effective. Indeed, there are several psychological factors that need to be carefully considered to make it successful. Mikropoulos and Natsis [
20] identified immersion and presence as key factors, where the former refers to a quantifiable characteristic of the VR system that encompasses the objective level of sensory fidelity, while the latter is the user’s psychological response within the VR system [
21,
22]. Thanks to immersion and interaction, VR educational environments can be more engaging compared to traditional ones. In particular, immersion isolates the user from distractions, while interaction enables active learning [
12].
Additionally, it is crucial to distinguish between two types of knowledge transmission: practical learning and skill acquisition and conceptual learning [
23]. The former refers to what are appropriate and inappropriate behaviors during a flood, while the latter includes understanding the alert indicators of an upcoming flood.
A further key factor to consider is the users’ proficiency at navigating and interacting with the virtual environment. Previous research suggests that, in some cases, the negative learning outcomes may be due to a lack of expertise with the commands for controlling the environment [
24]. Moreover, while IVR can increase motivation, it can also put a strain on cognitive load, thus hindering learning outcomes [
25]. Specifically, four factors mainly impact cognitive load in IVR experiences, some of which can be improved through experience design [
26]. Of these, two cannot be manipulated through experience design, namely individual differences and the user’s previous experience. However, the other two, namely task formulation and environment design, can be addressed. In particular, the design factors of an immersive virtual reality environment that affect the cognitive load concern the number of visual components, the environmental realism and fidelity, the learning and information presentation methodologies, but also the design of the training experience meant to teach the user how to interact with the environment [
27]. According to some authors, the training experience, namely the tutorial, can be the ideal tool to address the novelty effect generated by the use of new and relatively unfamiliar technologies such as head-mounted displays [
28]. In this context, novelty refers to the experience and/or information that individuals perceive as unexpected, surprising, and new [
29]. While the novelty effect can have positive consequences, such as increasing motivation and perceived usability [
30], it can also generate disorientation and fuel extraneous cognitive load [
28]. The latter arises from extraneous processes that do not directly contribute to learning, often driven by inadequate instruction design and the presence of distractions. Finally, germane load is the one relevant to the material to be learned [
31,
32].
Further research has highlighted how the possibility of learning interactions in the physical world can have positive effects when these interactions are simple [
33]. On the other hand, IVR seems to support situated learning that occurs in contexts similar to those in which what has been learned is subsequently applied [
34].
Therefore, the actual impact of tutorials on the learning experience made in IVR is still unclear. In order to tackle this ambiguity, in the present work, three different tutorials have been created, each differing in a single characteristic in order to investigate how the levels of contextualization and interaction experienced by the user during the training phase, namely in the tutorial, have on the learning experience.
2. Materials and Methods
2.1. Safer Water Simulation
The scenario features a riverside town developed based on a series of co-design activities presented in a previous work [
35] and a preliminary evaluation of the first prototype version by experts.
The virtual environment was developed using the Unity graphics engine (release 2020 LTS) and the software Blender (version 3.0 LTS) for 3D modeling. The target device for implementing the experience was the Virtual Reality headset Meta Quest 2 (Qualcomm Snapdragon XR2, RAM 6 GB LPDDR4X, storage 128–256 GB, display RGB LCD 1832 × 1920 per eye, 60–120 Hz, 6DoF, Touch controllers).
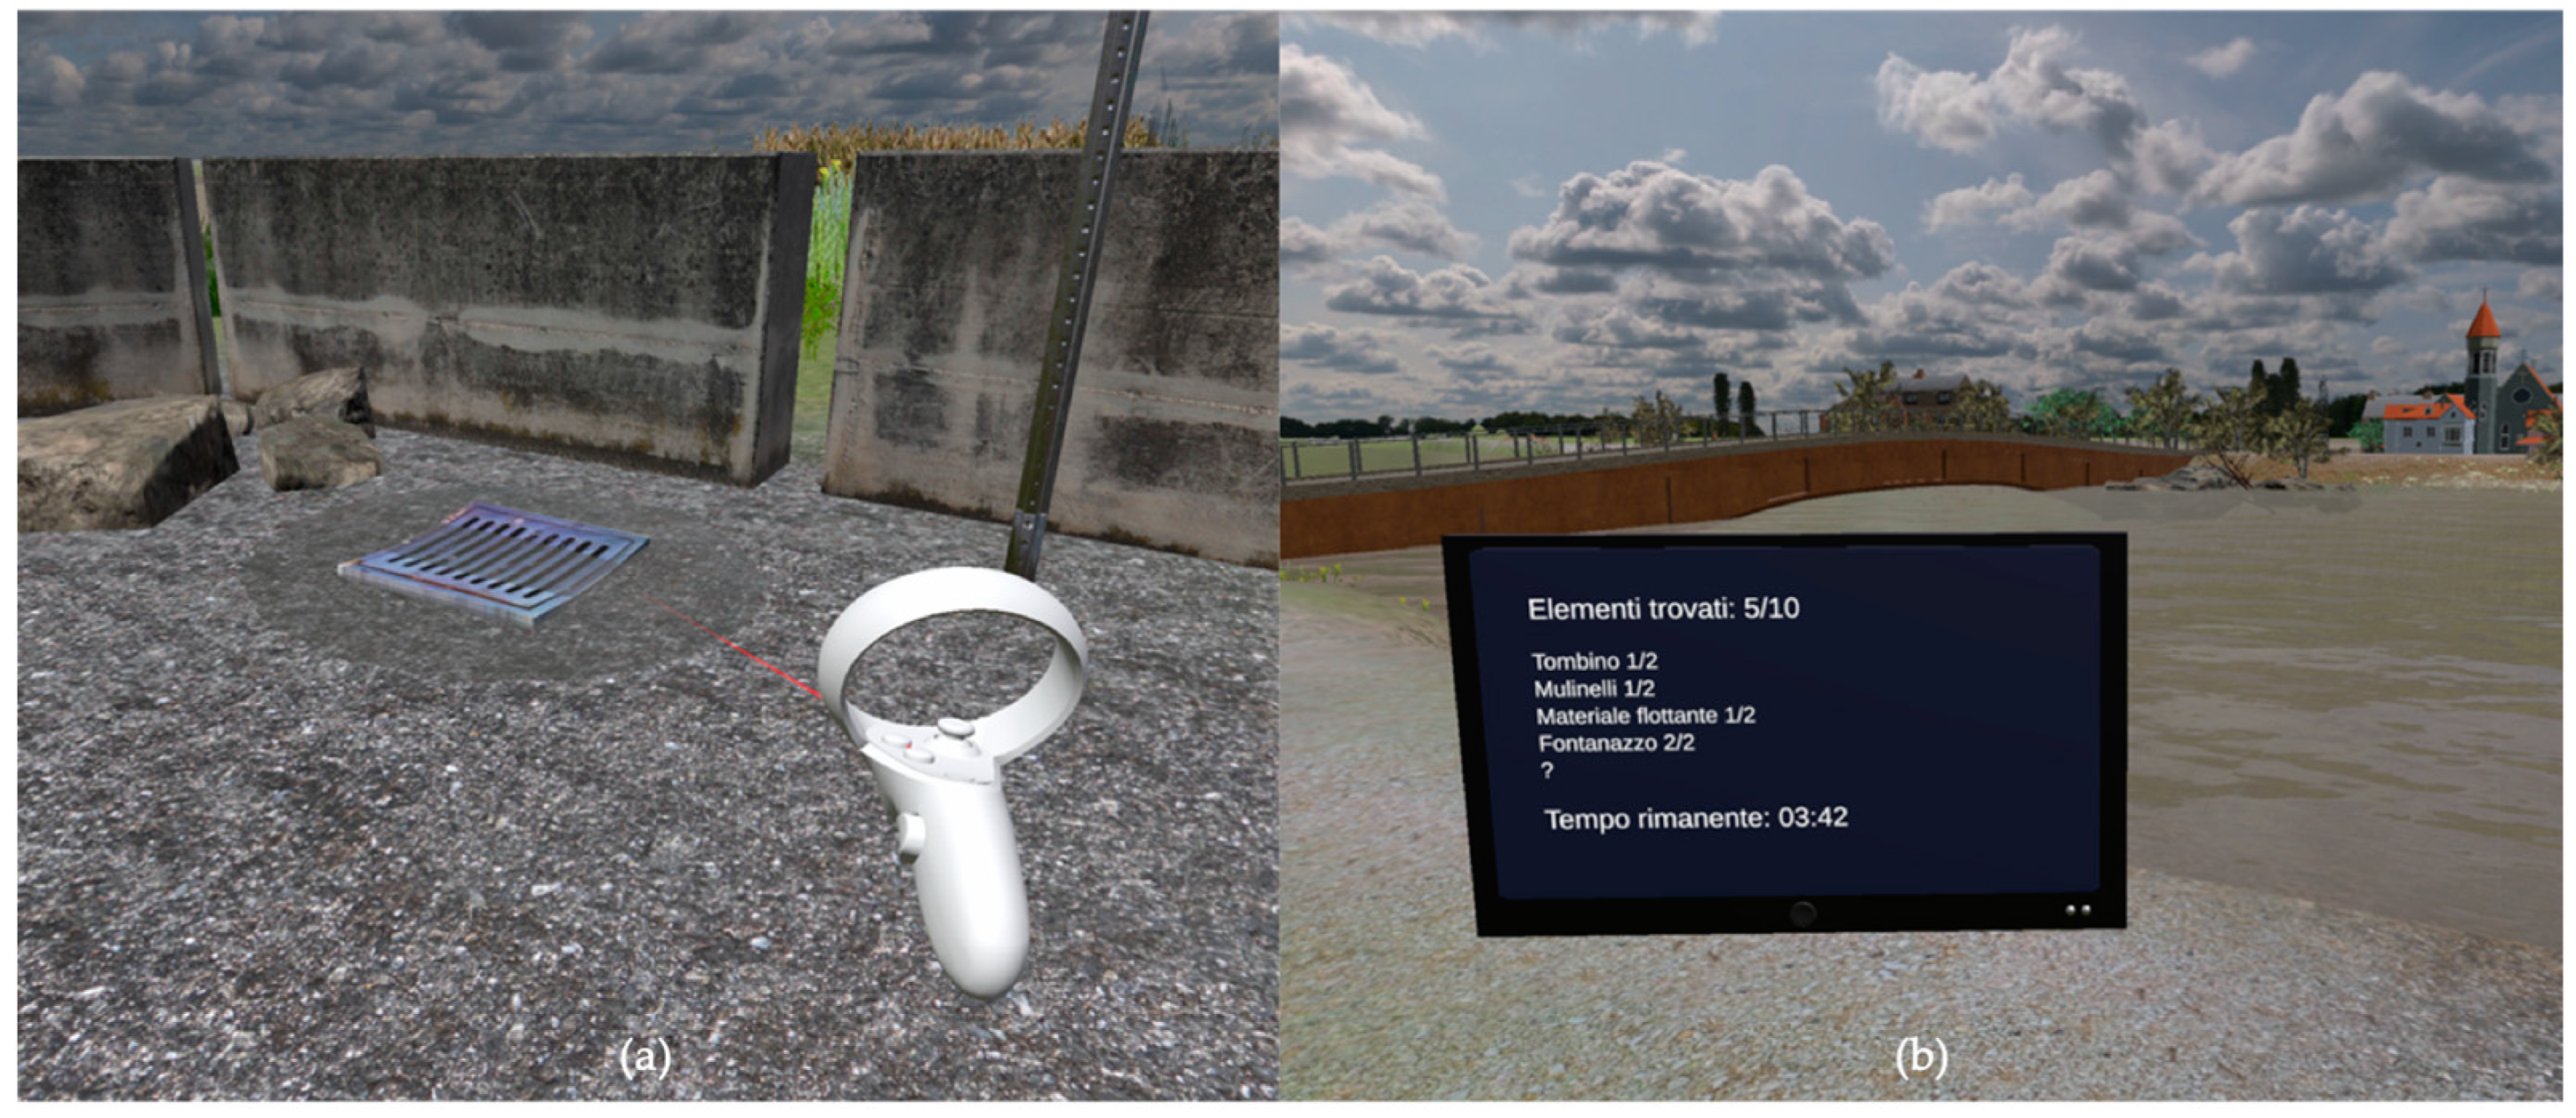
The user impersonates a member of the Civil Protection who has been called to carry out an inspection and understand if it is necessary to declare a state of emergency. The experience spans two time domains: one prior to the river embankment failure and the other following this event. These two different phases are characterized by specific tasks. In the first phase of the experience, the user receives a virtual phone call from a colleague who urges him to look around and report the presence of any danger indicators near the embankment within 5 min.
As represented in
Figure 1, 10 target stimuli (danger indicators) have been positioned near the embankment, belonging to 5 main categories.
The user has a virtual tablet displaying hidden categories with question marks. The name of each category is revealed as the participant selects the flood danger indicators located near the embankment, providing the number of missing indicators. Additionally, a timer shows the user the remaining time for the inspection (
Figure 2).
This exploratory phase ends when the user has identified and selected all of the danger indicators or at the end of the 5 min allocated to this phase. In both cases, the colleague would start a new phone call, introducing a new task, that is, to reach a position indicated on the virtual tablet where other colleagues from the Civil Protection would arrive to secure the area (
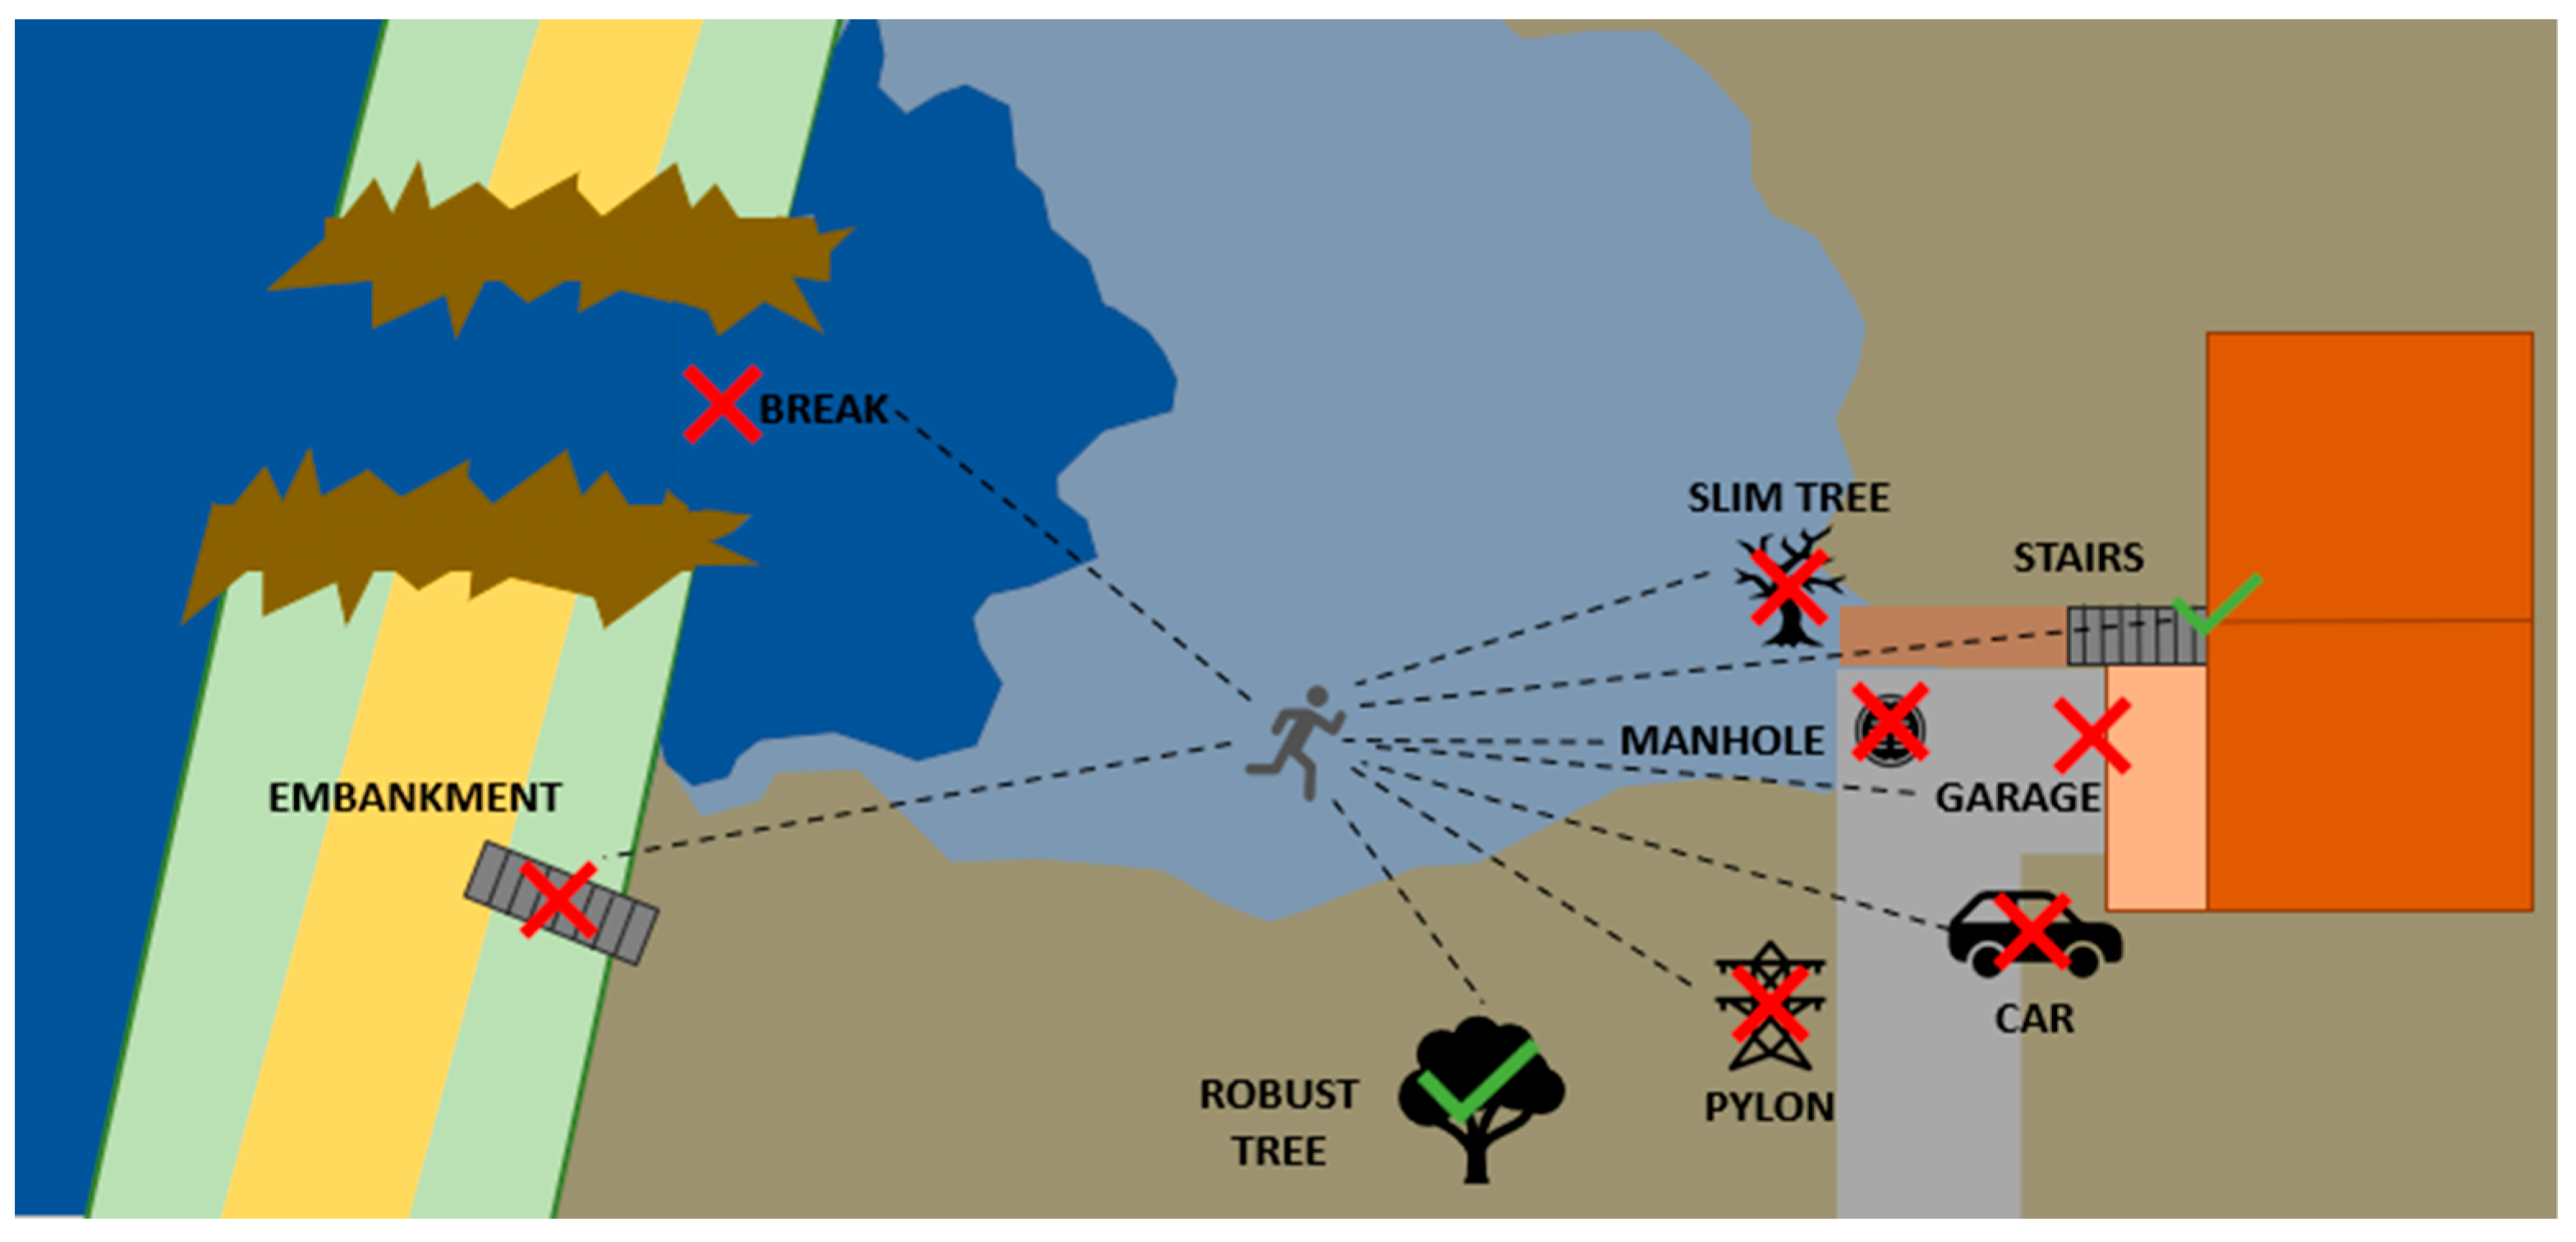
Figure 2). The point indicated on the map is located near the river, and once the participant has reached it, the river embankment breaks, introducing the user to the final phase of the experience: escaping from the flood to a safe place. This time, the task is introduced by the sound of shouts from a distance urging them to save themselves. At this point, the user has to run away and reach a safe place; there are different possibilities of success and failure in the area, as represented in
Figure 3.
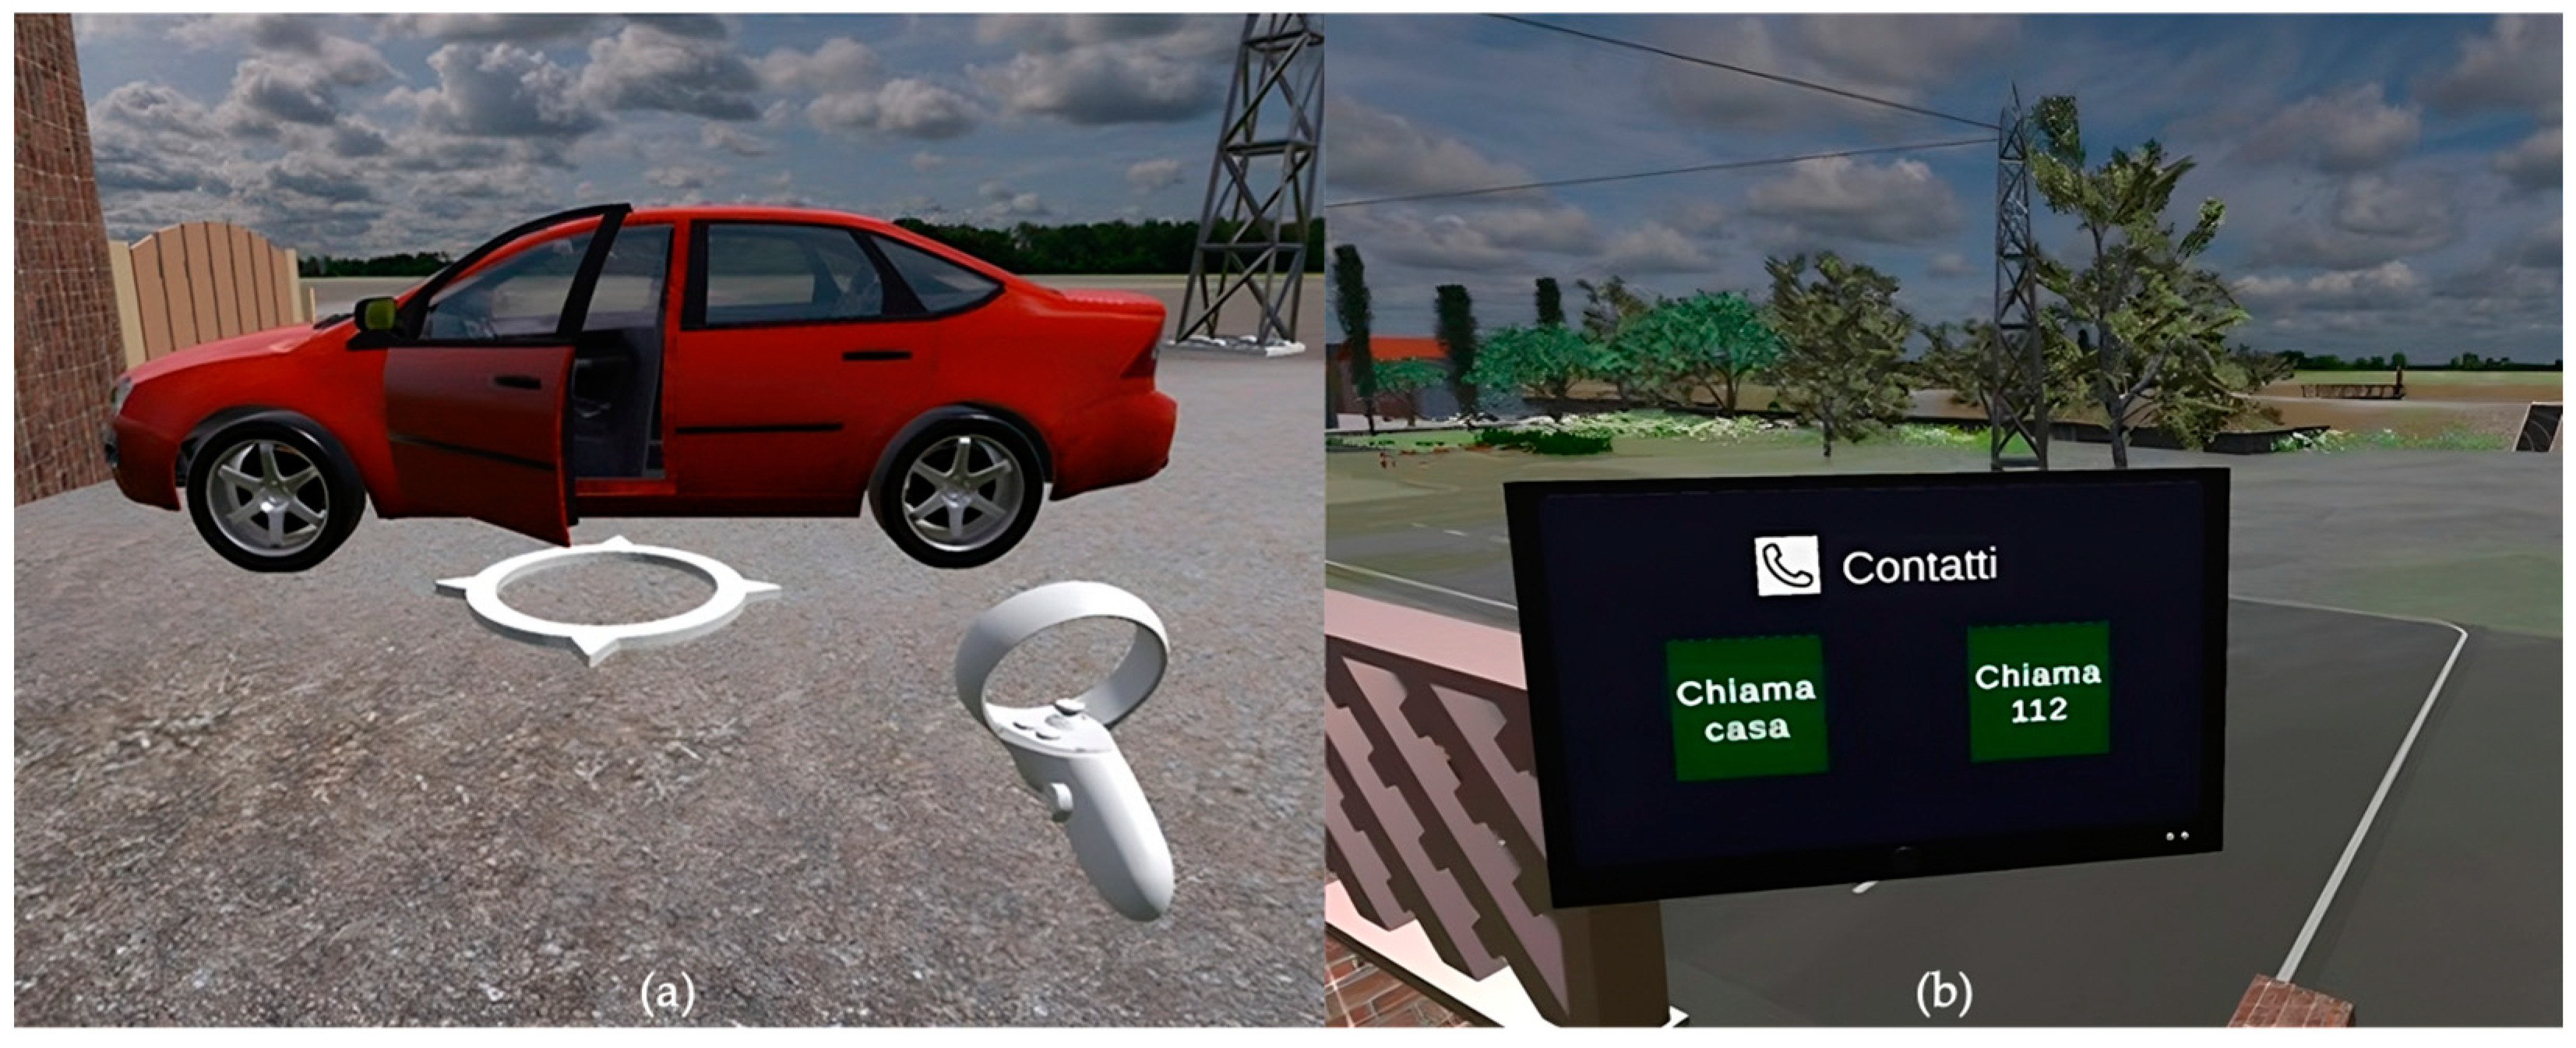
If the user fails to reach a safe location or performs a dangerous action, they receive feedback explaining the negative consequences of their actions and the second phase of the experience is restarted automatically. After the user has reached a safe spot, different options to make a phone call would appear on the virtual tablet (
Figure 4), making them choose to either contact their family members or the emergency services. Only the correct choice of calling the emergency services would make the experience end. If the participant chose to call their family, a recorded voice would reply telling them that the telephone line was overloaded and they had to retry.
At this point, the user receives feedback on their performance. In particular, the danger indicators found, the number of wrong choices in the escape phase, and the time taken to complete the experience are provided.
The Tutorials Presented in Safer Water
The training phase is crucial for teaching people how to interact with the virtual environment; therefore, a tutorial was included before the experience began [
36]. More specifically, the tutorial aimed to familiarize the user with the commands of the controllers, so that once the actual experience began, the user could focus on the learning content. The tutorial consisted of four distinct sections, one for each of the interaction types that participants needed to learn: (i) horizontal movement (teleportation [
37]); (ii) vertical movement (teleportation pointing the controller upward); (iii) object selection in the environment (ray casting and the right-hand controller trigger); and (iv) help functionality, that is, a command that participants could use to recall all the interactions.
Within the tutorial, tooltips were provided to teach the interactions, which are textual instructions anchored to the right-hand controller [
36]. After the tutorial, a brief test assessing their level of proficiency with the learned commands was performed.
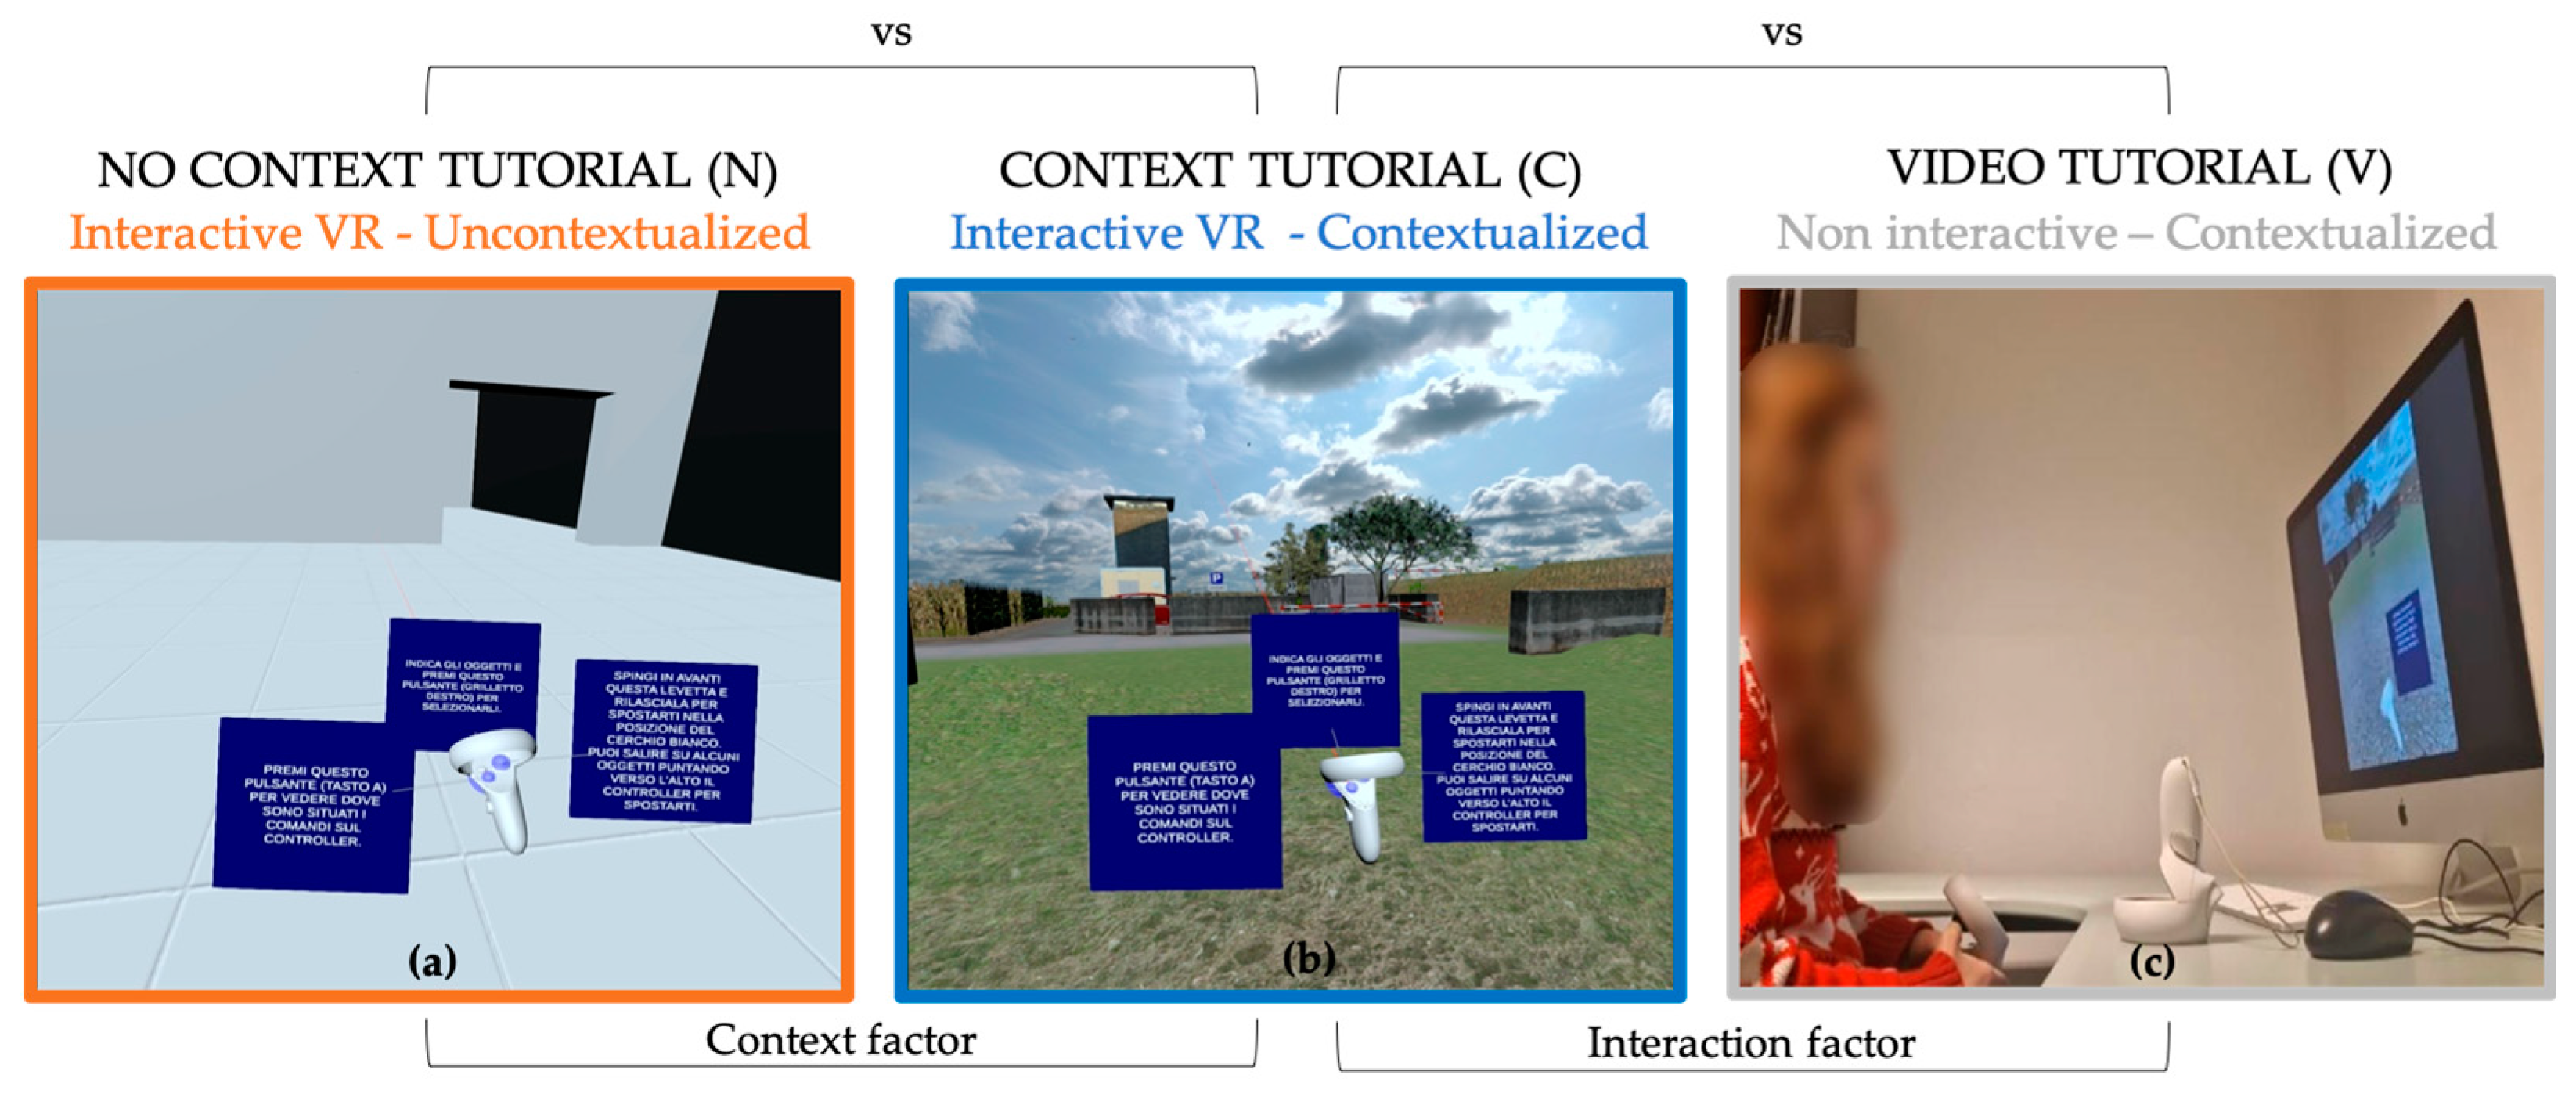
As mentioned above, research on how to design and implement tutorials in the context of VR simulation to teach safe behaviors is still scarce. To investigate the role of contextualization and interaction, three different tutorials were developed (
Figure 5), each differing in the level of contextualization and interaction.
The first tutorial, labeled as No context, is characterized by a low level of contextualization and a high level of interactivity. In particular, it features a plain setting, which comprises four grey rooms featuring geometric elements, and it lacks any natural element that may refer to the fluvial or alluvial context. Moreover, in this tutorial, the user can directly interact with the environment by using the controllers. The second tutorial, labeled as the Context tutorial, features a high level of contextualization and a high level of interactivity. Indeed, it is set in the Safer Water river context, and it features natural and realistic elements. Also in this case, the user can directly interact by using the controllers. Finally, the third tutorial, labeled as Video tutorial, has a low level of contextualization and a low level of interactivity. In this case, the participant watched a video that was set in the Safer Water river context and that showed the correct execution of the commands (with a duration of 2 min and 20 s). The user was given the controllers only to identify the placements of the buttons, as they were not connected to the video.
2.2. The Experimental Design
The study followed a between-participant experimental design. Two variables related to tutorial design are manipulated: contextualization (contextualized vs. uncontextualized) and interactivity (interactive VR vs. non-interactive). From the combination of the above-mentioned factors, we obtain the three experimental conditions illustrated in
Figure 5 that refer to the three tutorials described in the previous section: No context (N), Context (C), and Video (V) tutorials.
2.3. Self-Report Data
A social-demographic questionnaire was devised to collect background data (e.g., profession, education level) and information regarding people previous experience with VR and training in flood emergencies.
To evaluate the training effectiveness in facilitating learning, participants’ knowledge of flood emergencies was assessed through a questionnaire administered at three-time points: before the virtual training (T1), immediately after (T2), and 15 days post virtual training (T3). The questionnaire covered conceptual and practical learning aspects [
23]) and was developed ad hoc, including two open questions on conceptual learning (e.g., “What are the main indicators of flood warning status?”) and five open questions on practical learning (e.g., “what are the correct behaviors to adopt during an outdoor disaster flood?”). The scores were calculated for a total of 30 points, based on a scoring scheme approved by two independent judges. Moreover, at the time-tree points, data on perceived preparedness (3 items adapted from Wisniewski and colleagues [
38]) and attitudes towards flooding emergencies (2 items adapted from Nofal and colleagues [
39]) were collected (7-point Likert scale).
Additionally, a series of other data related to the immersive virtual reality experience was collected. The learnability of virtual simulation commands was assessed with 7 items: 3 adapted from the command subscale of the Player Experience of Need Satisfaction (PENS) scale [
36,
37,
38,
39,
40] and 4 created ad hoc to understand whether they needed more information, training, and external help to understand command functionality [
41] and how quickly they learned these commands (7-point Likert scale).
Cognitive load was measured through an adapted version of the Multidimensional Cognitive Load Scale for Virtual Environments (MCLSVE) by Andersen and Makransky [
42] that allowed the investigation of intrinsic load (3 items), germane load (4 items), and extraneous load subdimensions related to the instructions (3 items), the interaction with the environment (4 items) and its complexity (4 items) with a 7-point Likert scale. User experience was evaluated by the User Experience Questionnaire (UEQ) [
43]. It consists of 26 items composed of seven dimensions related to the pragmatic and hedonic qualities of virtual experience. The items have the form of a semantic differential (i.e., each item is represented by two terms with opposite meanings placed at the extremes of a 7-point scale). Moreover, an adapted version of the Presence Questionnaire (PQ) developed by Witmer and colleagues was administered to assess the sense of presence [
44]. It comprised 27 items (2 items about haptic feedback were removed).
The employed questionnaires, which were adapted to the specific context from their standardized version and translated into Italian for data collection purposes, underwent reliability assessment using Cronbach’s alpha. The obtained results have been included in the
Appendix A (
Table A1 and
Table A2).
2.4. Behavioral Data
The users’ behaviors during the experience were recorded through a tracking script embedded in the software. The program manager script divided the experience into 5 phases: tutorial, searching for danger indicators, moving to the breach zone, embankment breach and escaping, and the final phase (including the call choice). Scripts recorded the exact moment that each phase began and recorded the main events and the moment they occurred (based on seconds elapsed from the start of the experience). Specifically, the following data were recorded: execution times of the different sections and interactions performed, the selection of each danger indicator, and the location chosen by the user to escape.
In the last phase, if an incorrect target was chosen, and a new attempt was made, the moment the simulation restarted from the embankment breaking was recorded; if the correct target was chosen, the moment the user calls home or emergency services was recorded. In addition, the execution times of the command test were recorded, which allowed us to highlight the effectiveness of the different types of tutorials once they were completed.
2.5. Procedure
On the evaluation day, each participant was given an information note and an informed consent form, which had to be read, understood, and signed before proceeding with the experimental session. The experimental session started with filling out a socio-demographic questionnaire and a questionnaire concerning the assessment of basic knowledge in the field of flooding. Then, the participant was shown a video through the 360 viewer that introduced the material on fluvial emergencies necessary to carry out the Safer Water simulation. During the familiarization phase of Safer Water, researchers provided participants with one of the different tutorials. Moreover, a short test of learned commands was performed at the end of this phase to ensure participants’ understanding of the whole control system. Subsequently, the designed immersive virtual reality experience began. At the end of the immersive virtual reality experience, the participant filled out a series of questionnaires assessing the learnability of the controls, knowledge learned, user experience, sense of presence, and cognitive load. All questionnaires were administered through the use of the Qualtrics platform (
https://www.qualtrics.com/, accessed on 14 September 2023).
The total duration of the study was about one hour. The experiment has been approved by the local Ethical Committee. The steps described are synthesized in the figure below (
Figure 6).
2.6. Participants
The study included 93 participants (
n = 31 for each group; F = 44), aged between 18 and 30 years (M age = 24.39, SD = 3.03). The recruitment criteria required participants to be right-handed, as the virtual environment used in the experiment was designed for right-handed users. The age range was also limited to 18–30 years (emerging adulthood; [
45]) to control the effect of cohort affiliation on the collected data. In addition, participants were not required to have experienced a flood, worked in the civil defense or fire department, or participated in training events related to river emergencies. Furthermore, participants with prior experience in flood-related emergencies were excluded due to sensitivity. Additionally, we did not involve users already familiar with HMDs to assess the learnability of the experience commands. This criterion was important to ensure that the virtual experience was usable and effective, even for first-time users. The data were collected to balance the gender distribution in different experimental conditions. Furthermore, homogeneity was verified across the three groups regarding prior knowledge of floods and frequency of video game use after the data collection. Participants were volunteers recruited by word of mouth and by posting flyers at various university premises.
3. Results
The following are the analyses and results of the self-report and behavioral data collected. A series of Shapiro–Wilk tests were conducted to check the normality assumption in the data. The tests showed a non-normal distribution, so nonparametric analyses were performed.
3.1. Subjective and Objective Learnability
To assess the effects of manipulating the two independent variables (interactivity and contextualization) on command learnability, comparisons were conducted concerning user performance on the command test and responses from the perceived learnability questionnaire.
Effect of context. A comparison of performance in the test of learned commands between C and N conditions was performed using the Mann–Whitney tests (BH correction). With regard to the test completion time, there were no significant differences (W = 599, p = 0.84) related to the familiarization context (M(C) = 4.83 s, SD(C) = 4.08, Mdn(C) = 3.17 s; M(N) = 5.60 s, SD(N) = 5.69 s, Mdn(N) = 3.60 s). Both types of tutorials appear to be effective; in fact, the median number of errors is <1 for both (M(C) = 0.52; MdnC = 0; M(N) = 0.19; Mdn(N) = 0). Nevertheless, a significant difference emerges (W = 353.5, p = 0.028) in favor of the N condition (M(N) = 0.19, Mdn(N) = 0) compared to the C one (M(C) = 0.52, MdnC = 0). Regarding the learnability perceived by the participants, no significant differences emerged (W = 599, p = 0.10). In both conditions, high scores were given to familiarization with the commands (M(C) = 5.47, SD(C) = 0.81, Mdn(C) = 5.57; M(N) = 5.79, SD(N) = 1.05, Mdn(N) = 6.14).
Effect of interaction. A comparison was made between the performance inherent in the command test in the familiarization condition with (C) and without (V) interaction with the environment through Mann–Whitney tests (BH correction). Regarding performance, it was found that in condition E (M(V) = 5.18 s; Mdn(V) = 5.61), participants took longer to perform the test than in condition C (M(C) = 4.83 s; Mdn(C) = 3.17) (W = 747, p < 0.001). Despite the overall number of errors made being close to zero, the two tutorials did not appear to be equally effective in preventing errors during the test (W = 648, p = 0.012). In fact, the median number of errors is <1 in condition C (M(C) = 0.52; Mdn(C) = 0), whereas in condition V, it is =1 (M(V) = 1.74; Mdn(V) = 1). The overall perceived learnability score also showed a significant difference in favor of the Context tutorial compared to the Video one (M(V) = 4.89, Mdn(V) = 4.86, M(C) = 5.47, Mdn(C) = 5.57, W = 327.5, p = 0.032). In particular, learning the commands was perceived as less easy (W = 335.5, p = 0.035), and the need for practice to familiarize oneself with the commands was also perceived as greater (W = 287, p = 0.006) in condition V than in condition C.
3.2. Learning about Flood Emergencies
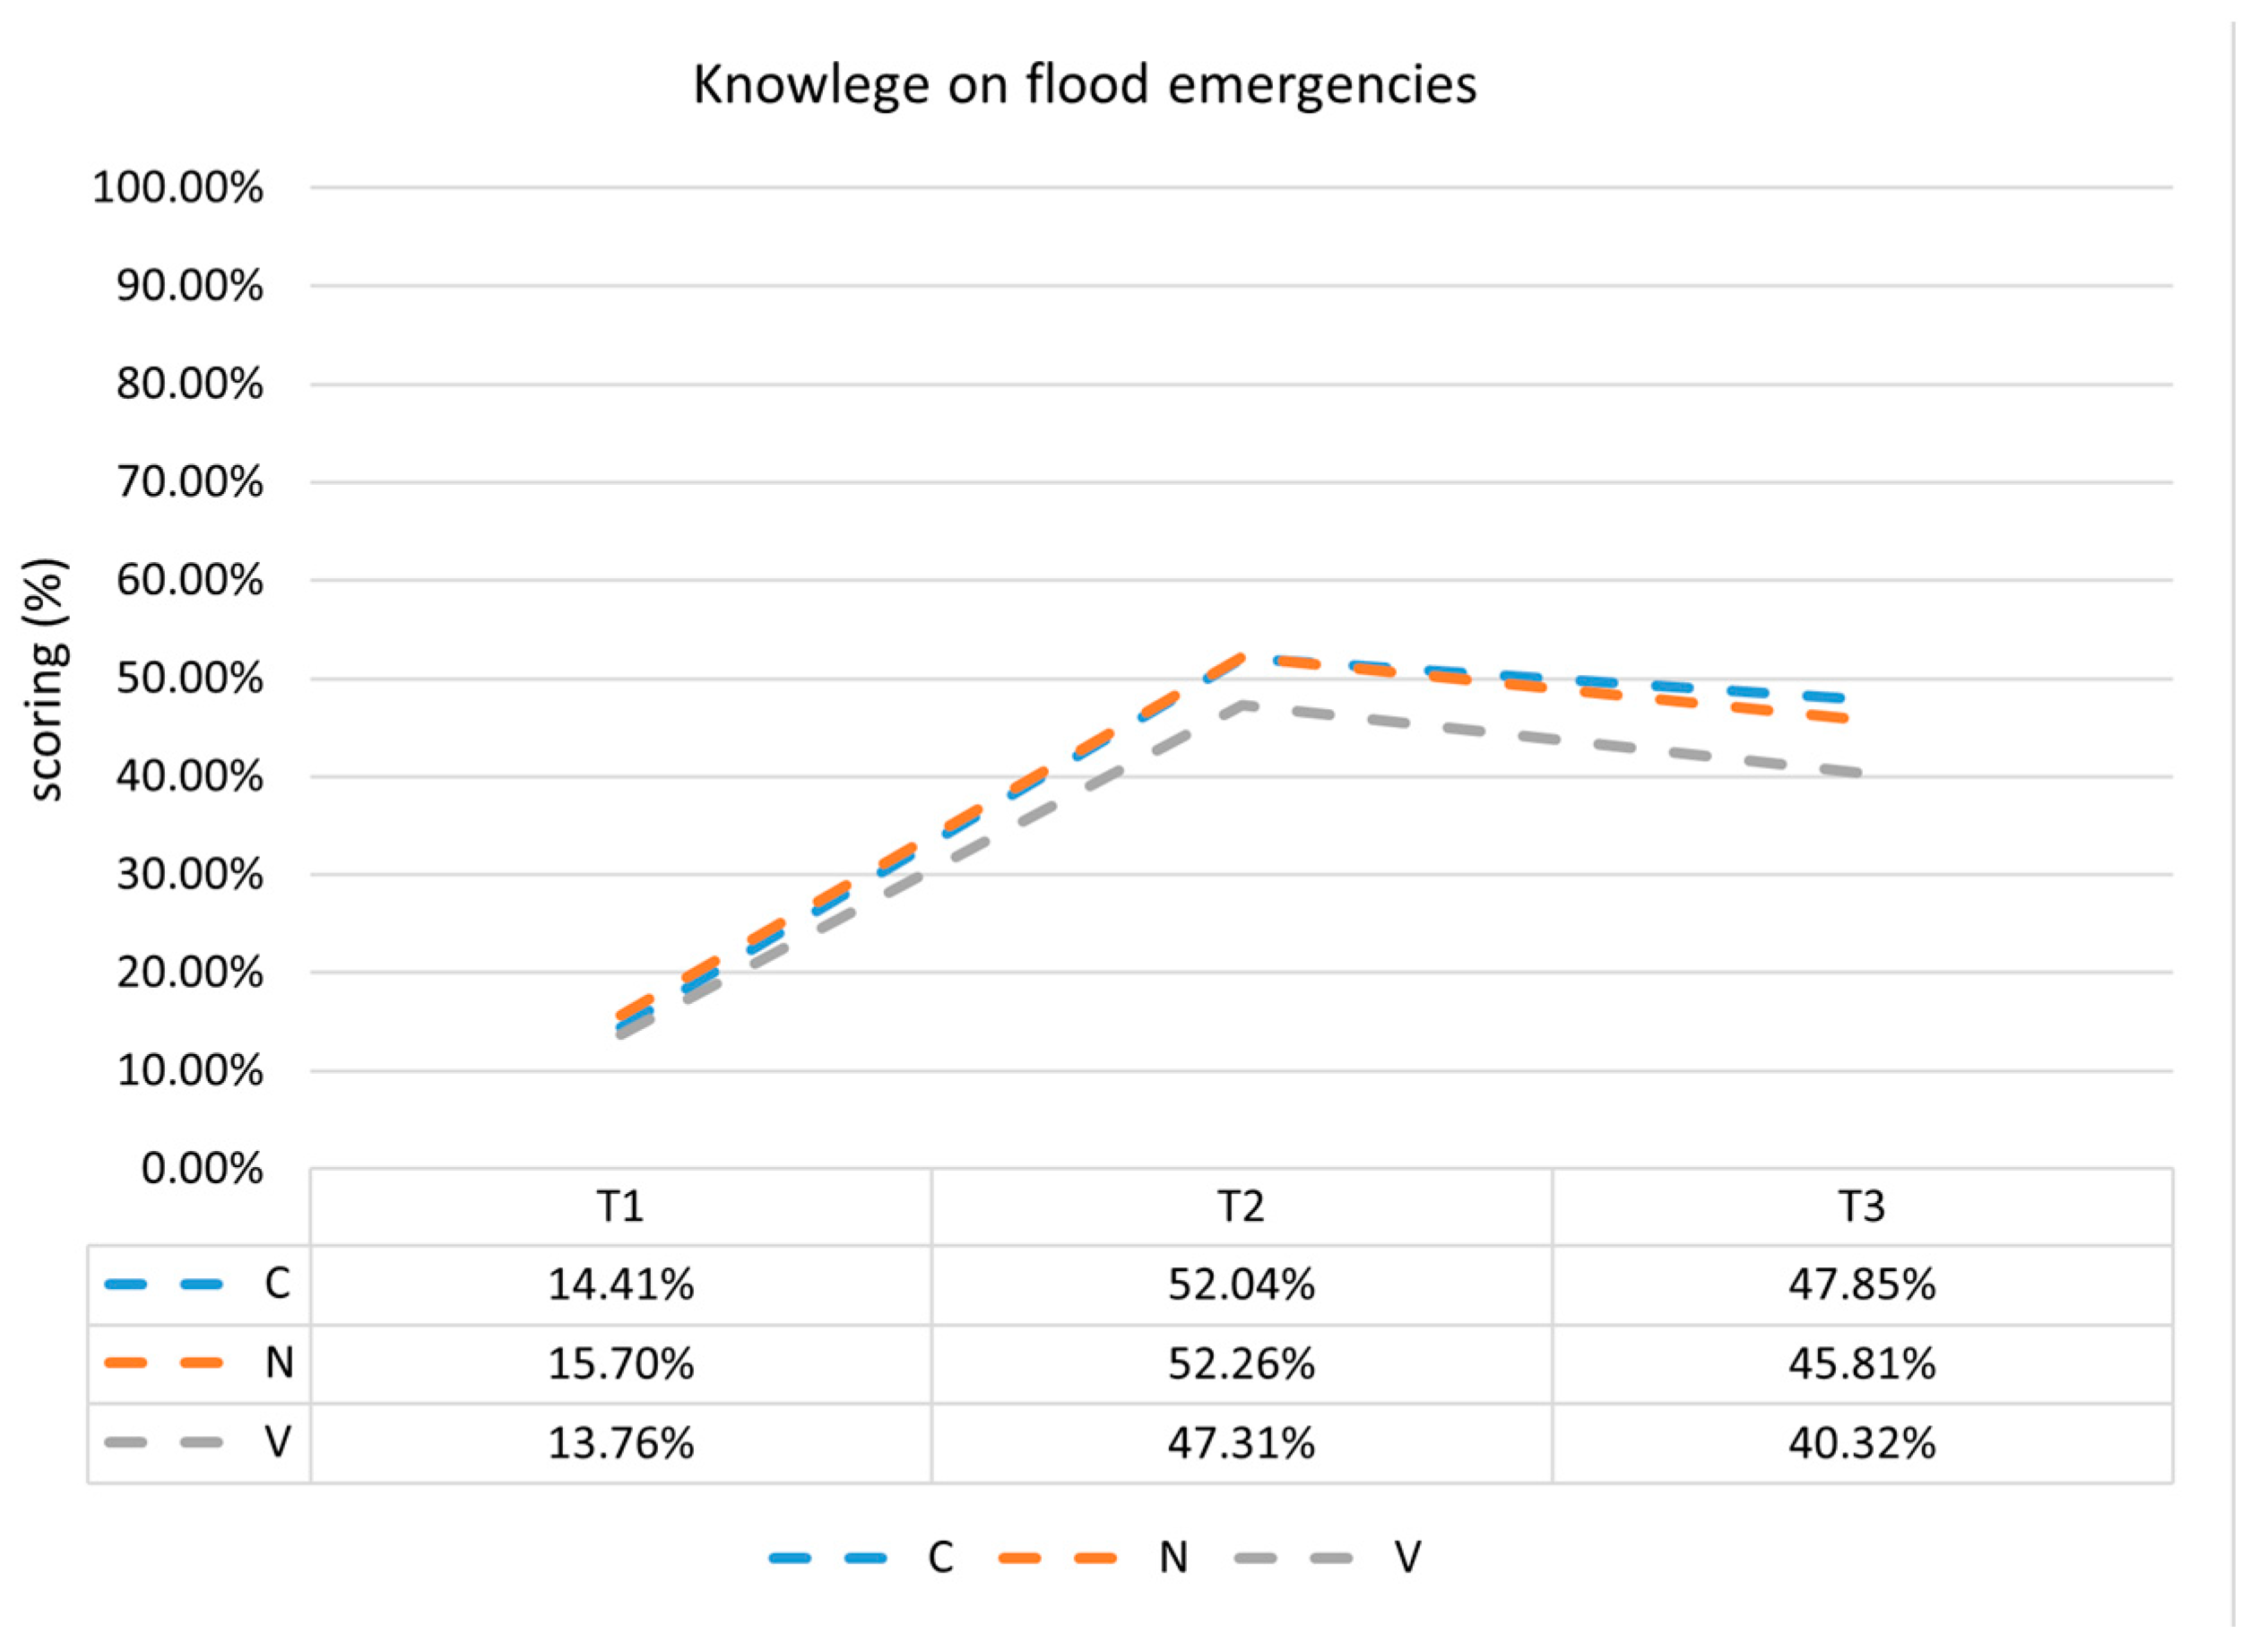
The graph below (
Figure 7) represents the percentage scores on the learning questionnaire on flood emergencies in the three experimental conditions. In general, it can be seen that in all conditions, the training had a positive impact on the flood-related knowledge possessed by the participants prior to participating in the study, although after a period of 15 days, the percentage score shows a slight decline.
To assess differences between conditions in the acquired knowledge on educational contents, the deltas of the scores obtained between T1 and T2, between T2 and T3, and between T3 and T1 were calculated. Then, a series of Kruskal–Wallis tests were performed to compare the learning differences of T2–T1, T3–T2, and T3–T1 between the three experimental conditions. The results showed no significant differences (χ
2 = 1.66,
p = 0.43) between the three experimental conditions concerning the increase in knowledge after the training (T2–T1). A similar result (χ
2 = 0.74,
p = 0.70) was obtained about the level of knowledge maintained 15 days after the training (T3–T2). In contrast, with regard to the difference between knowledge measured after 15 days and before the training (T3–T1), the results of the analyses showed a statistically significant difference between the conditions (χ
2 = 6.53,
p = 0.04). Consequently, a series of post hoc Wilcoxon tests for paired samples (with BH correction [
46]) were conducted to further the analysis. These showed that participants who had completed the Context tutorial (M(C) = 10.03, SD(C) = 3.31, Mdn(C) = 10) achieved better actual learning than those who had used the Video tutorial (M(V) = 7.97, SD(V) = 3.57, MdnV(V) = 8; χ
2 = 6.53,
p = 0.048). Descriptive data on percentages highlighted that participants who used the Context tutorial increased their total knowledge score by a percentage of 33.44%. In comparison, those who used the Video tutorial increased their knowledge by 26.56%.
3.3. Perceived Preparedness and Attitudes towards Flood Emergencies
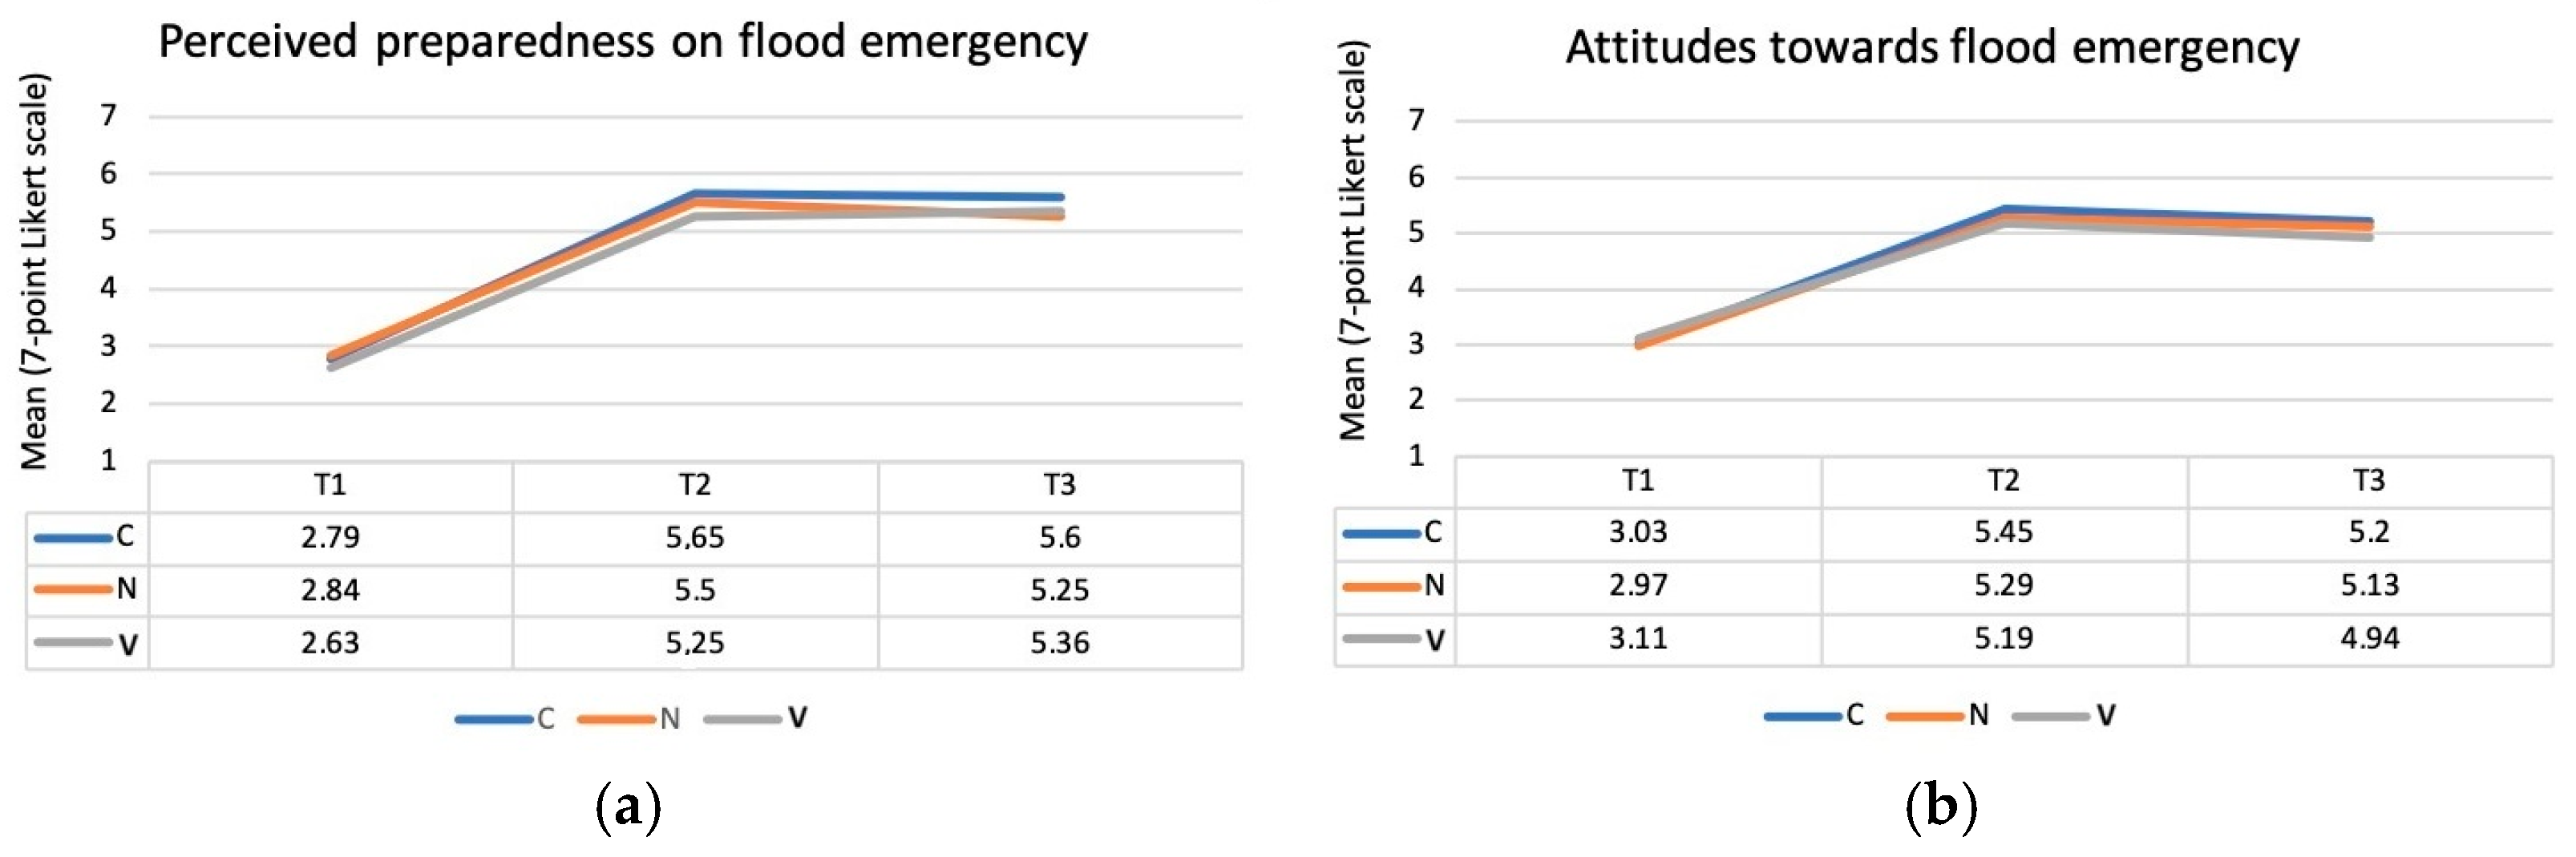
The graphs below (
Figure 8a,b) represent the mean scores on the perceived preparedness and attitudes towards flood emergencies questionnaire in the three experimental conditions. In general, it can be seen that the training increases the perceived preparedness and attitudes towards flood emergencies.
As in this case, deltas were calculated to investigate if there were differences in time between experimental conditions. A series of Kruskall–Wallis tests showed no statistically significant differences between the conditions.
3.4. Cognitive Load and Sense of Presence
To assess the effects of manipulating the two independent variables (interaction and contextualization) on cognitive load, comparisons were conducted concerning the intrinsic, extraneous, and germane load (MCLSVE); (
Table 1).
Effect of context. We compared the C condition with the N condition through a series of Mann–Whitney tests (BH correction). With regard to the intrinsic load, there were no significant differences (W = 435.5, p = 0.77) related to the contextualization. The same results emerged for extraneous load (W = 502, p = 0.33) and for germane load (W = 333, p = 0.06).
Effect of interaction. We compared condition C with condition V through a series of Mann–Whitney tests (BH correction). With regard to the intrinsic load, there were no significant differences related to the level of interaction (W = 460, p = 0.77). The same results emerged for extraneous load (W = 549, p = 0.33). On the other hand, participants who had the possibility to interact with the virtual environment during the tutorial reported a greater germane load than participants who learned commands outside of the virtual environment (W = 269, p = 0.050).
The same analyses were also conducted for the sense of presence (PQ); (
Table 2). Mann–Whitney tests revealed the absence of an effect related to the interaction context (C vs. N) or interaction (C vs. V) during the familiarization phase on the sense of presence linked to the virtual experience as shown in Table below.
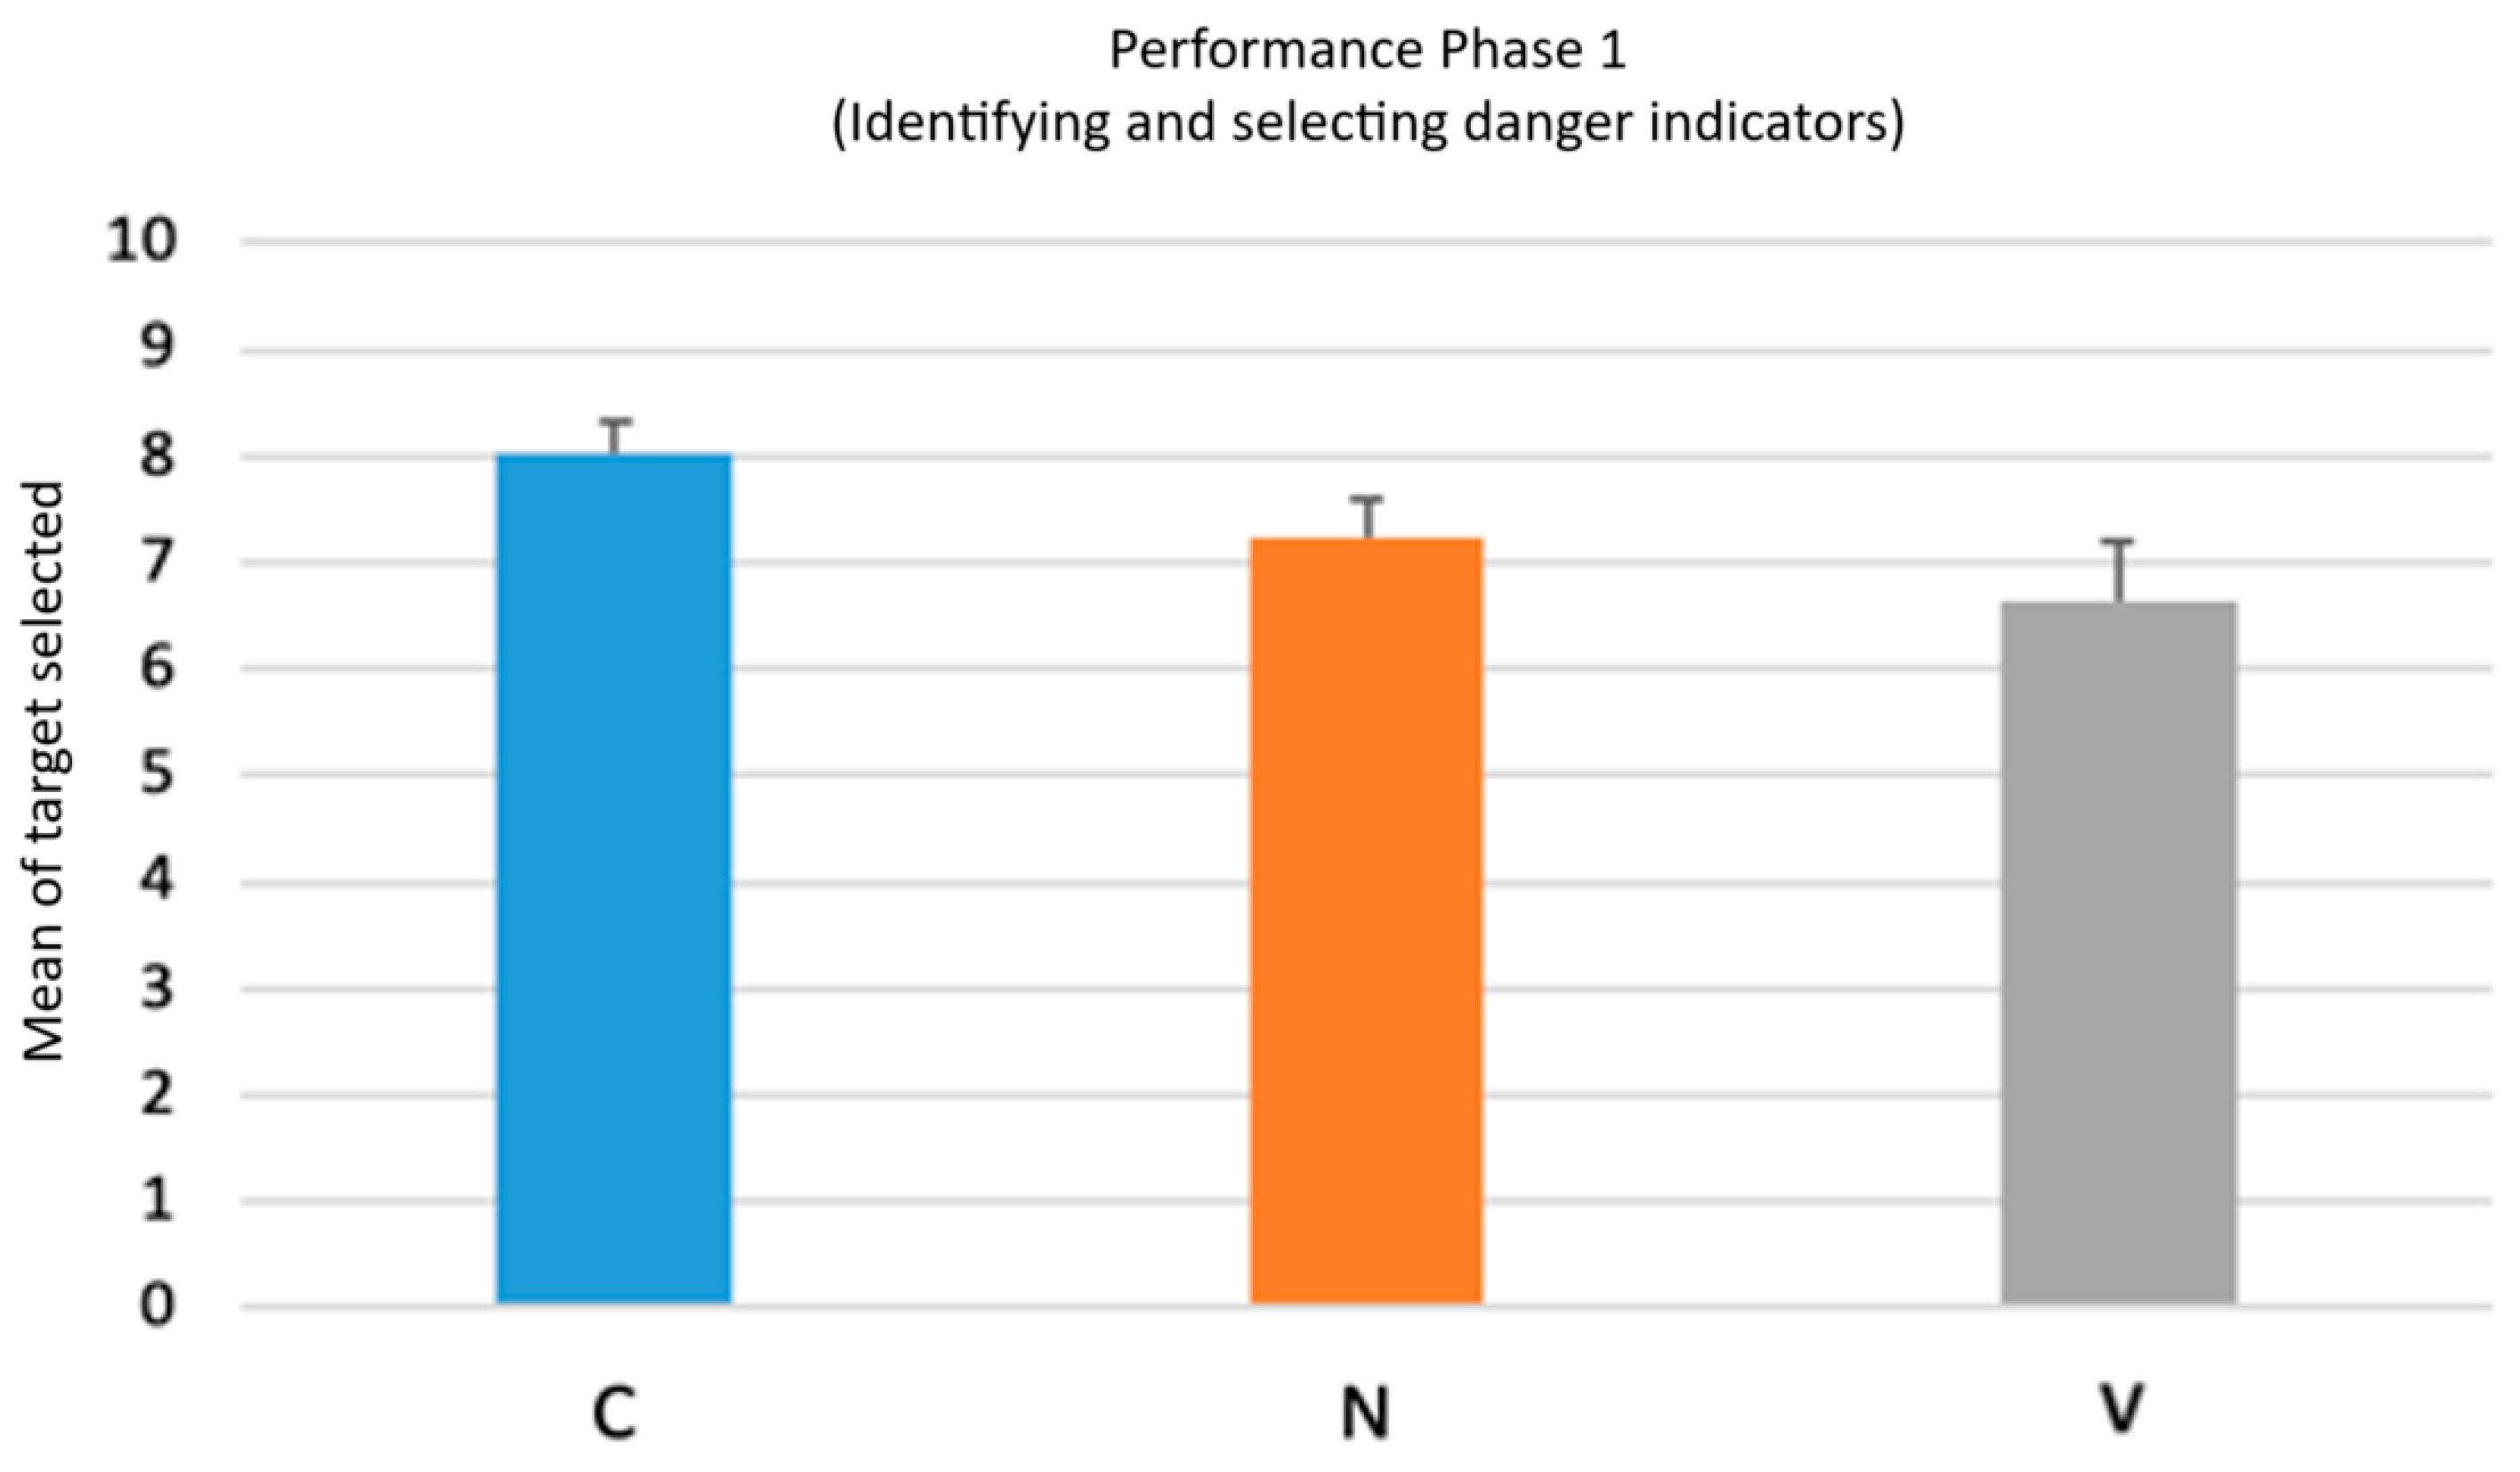
3.5. Performance
As regards the first phase of the training, namely identifying and selecting of danger indicators, behavioral data relating to the number of targets selected were collected (maximum score 10/10). A Kruskal–Wallis test was conducted to assess differences among the various conditions in identifying and selecting danger indicators. The results did not show statistically significant differences between the conditions (χ
2 = 3.19,
p = 0.20). It is highlighted that the number of indicators selected is high in the C condition (M(C) = 8.03, SD(C) = 0.29), N condition (M(N) = 7.23, SD(N) = 0.38), and V condition (M(V) = 6.65, SD(V) = 0.54); (
Figure 9).
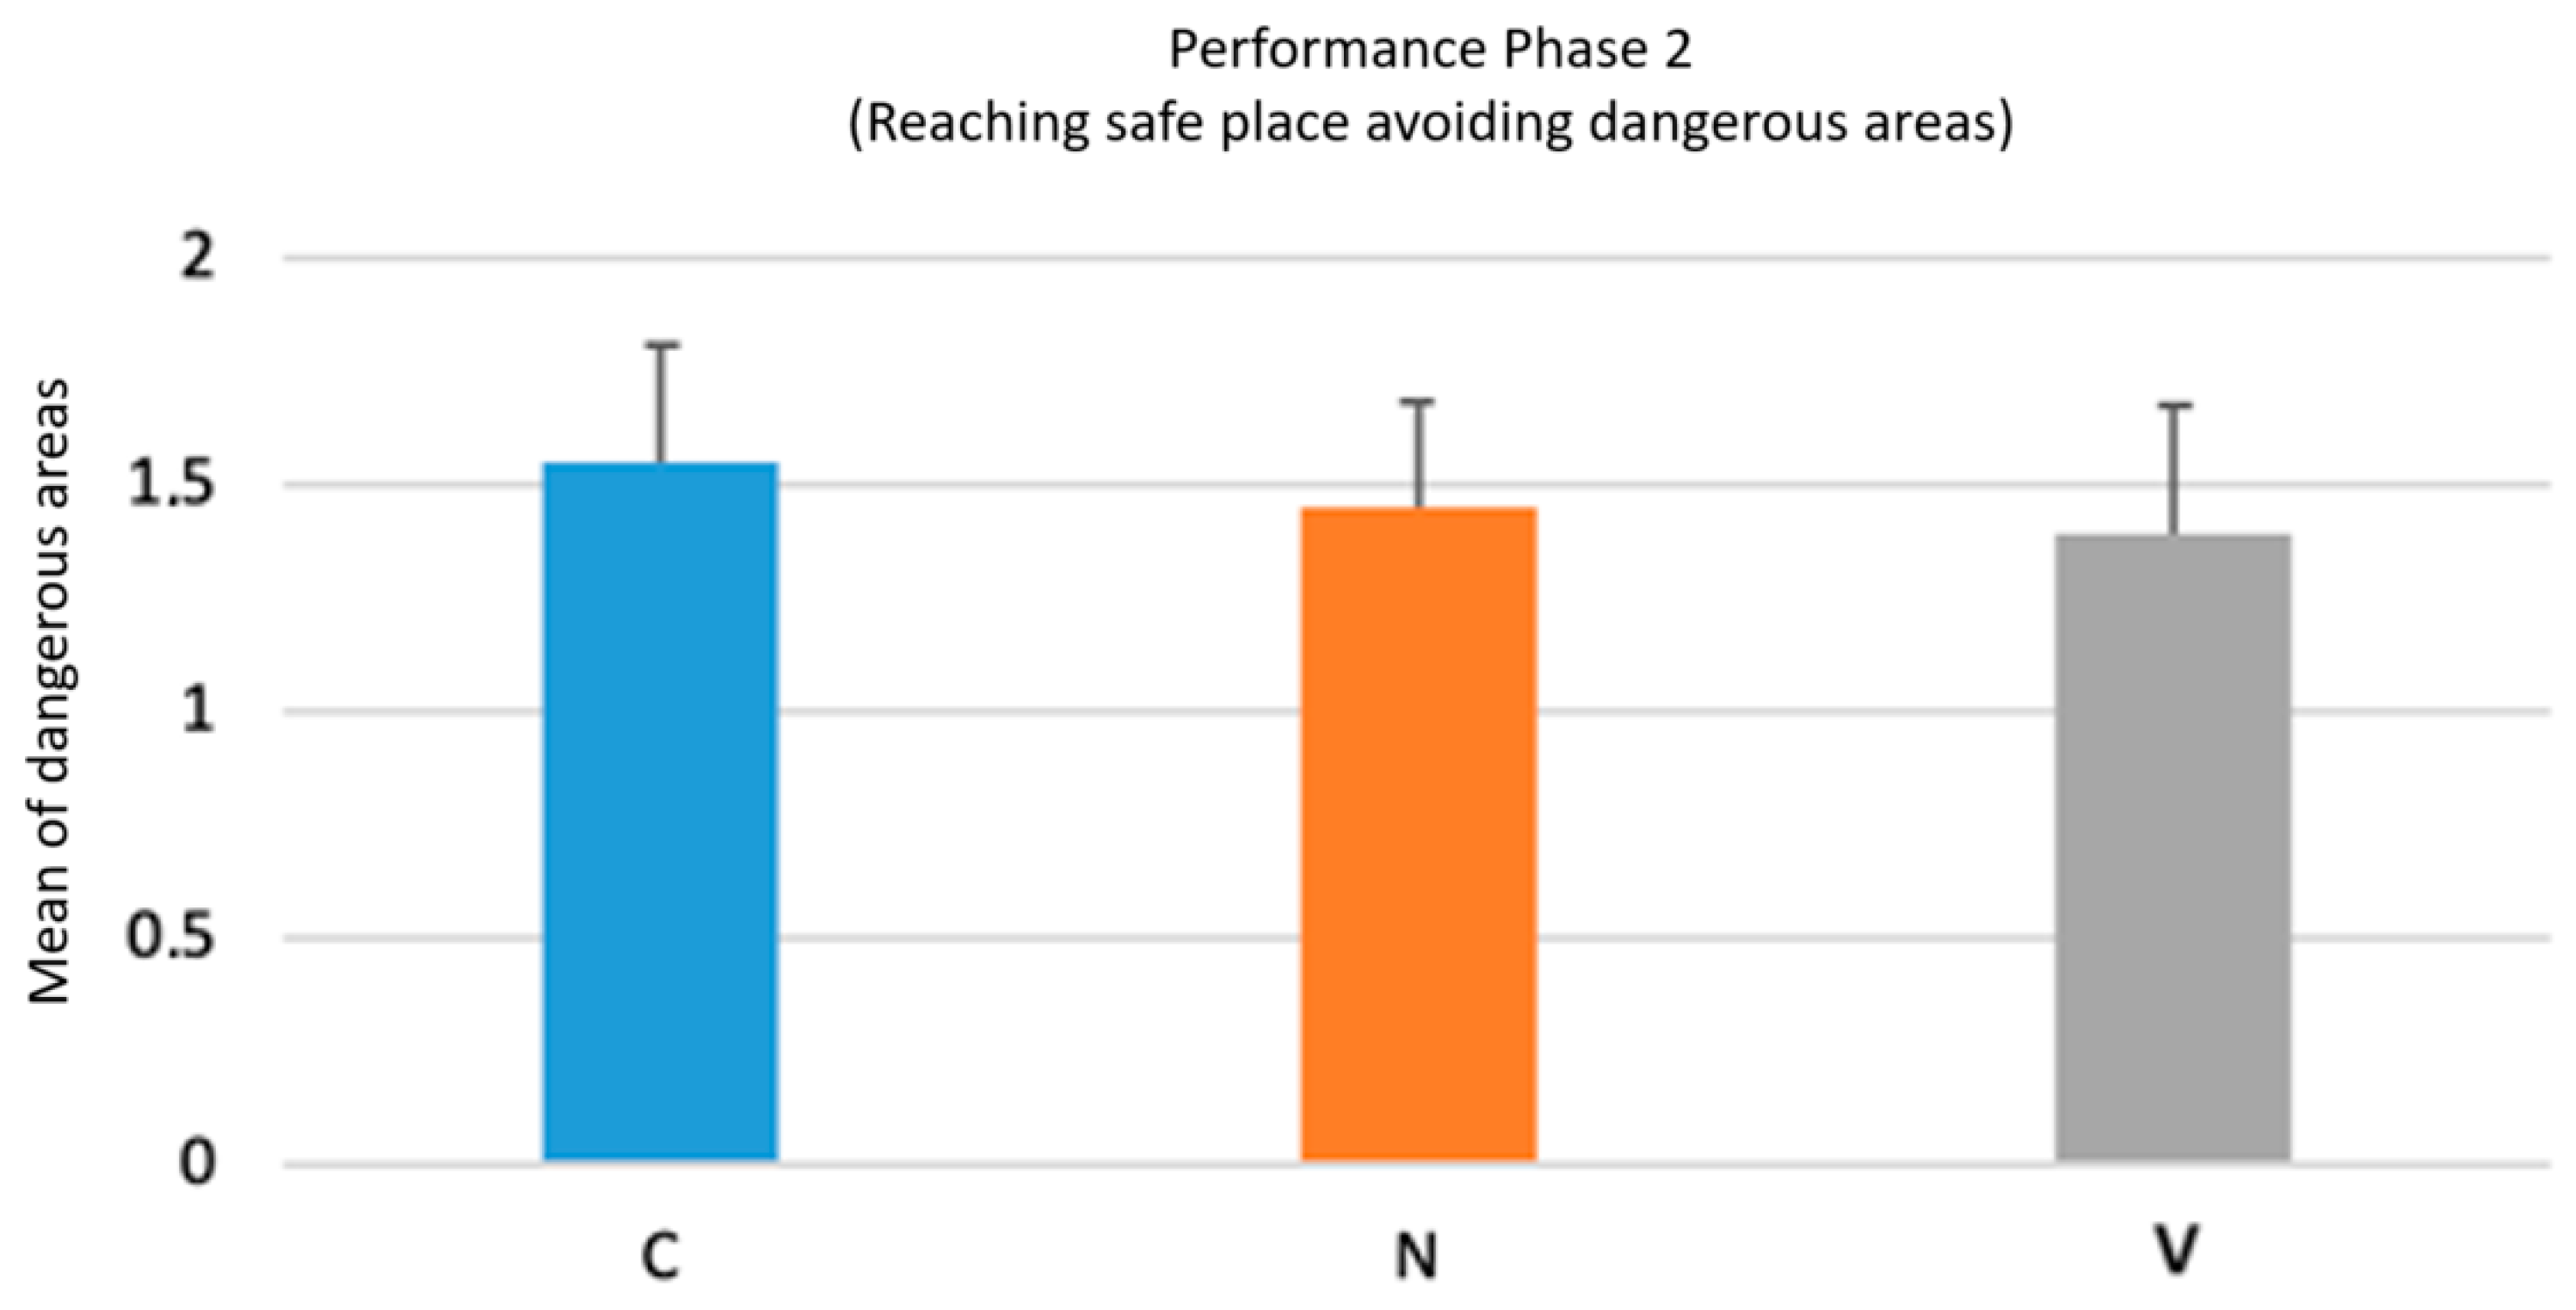
Furthermore, a comparison between the conditions was conducted to assess if there were differences in reaching a safe location while avoiding hazardous areas. The Kruskal–Wallis test showed no difference (χ
2 = 0.52,
p = 0.77). Indeed, users did not make a high number of incorrect attempts before reaching a safe location with C (M(C) = 1.54, SD(C) = 0.26), N (M(N) = 1.45, SD(N) = 0.23) and V (M(V) = 1.39, SD(V) = 0.29); (
Figure 10) trainings.
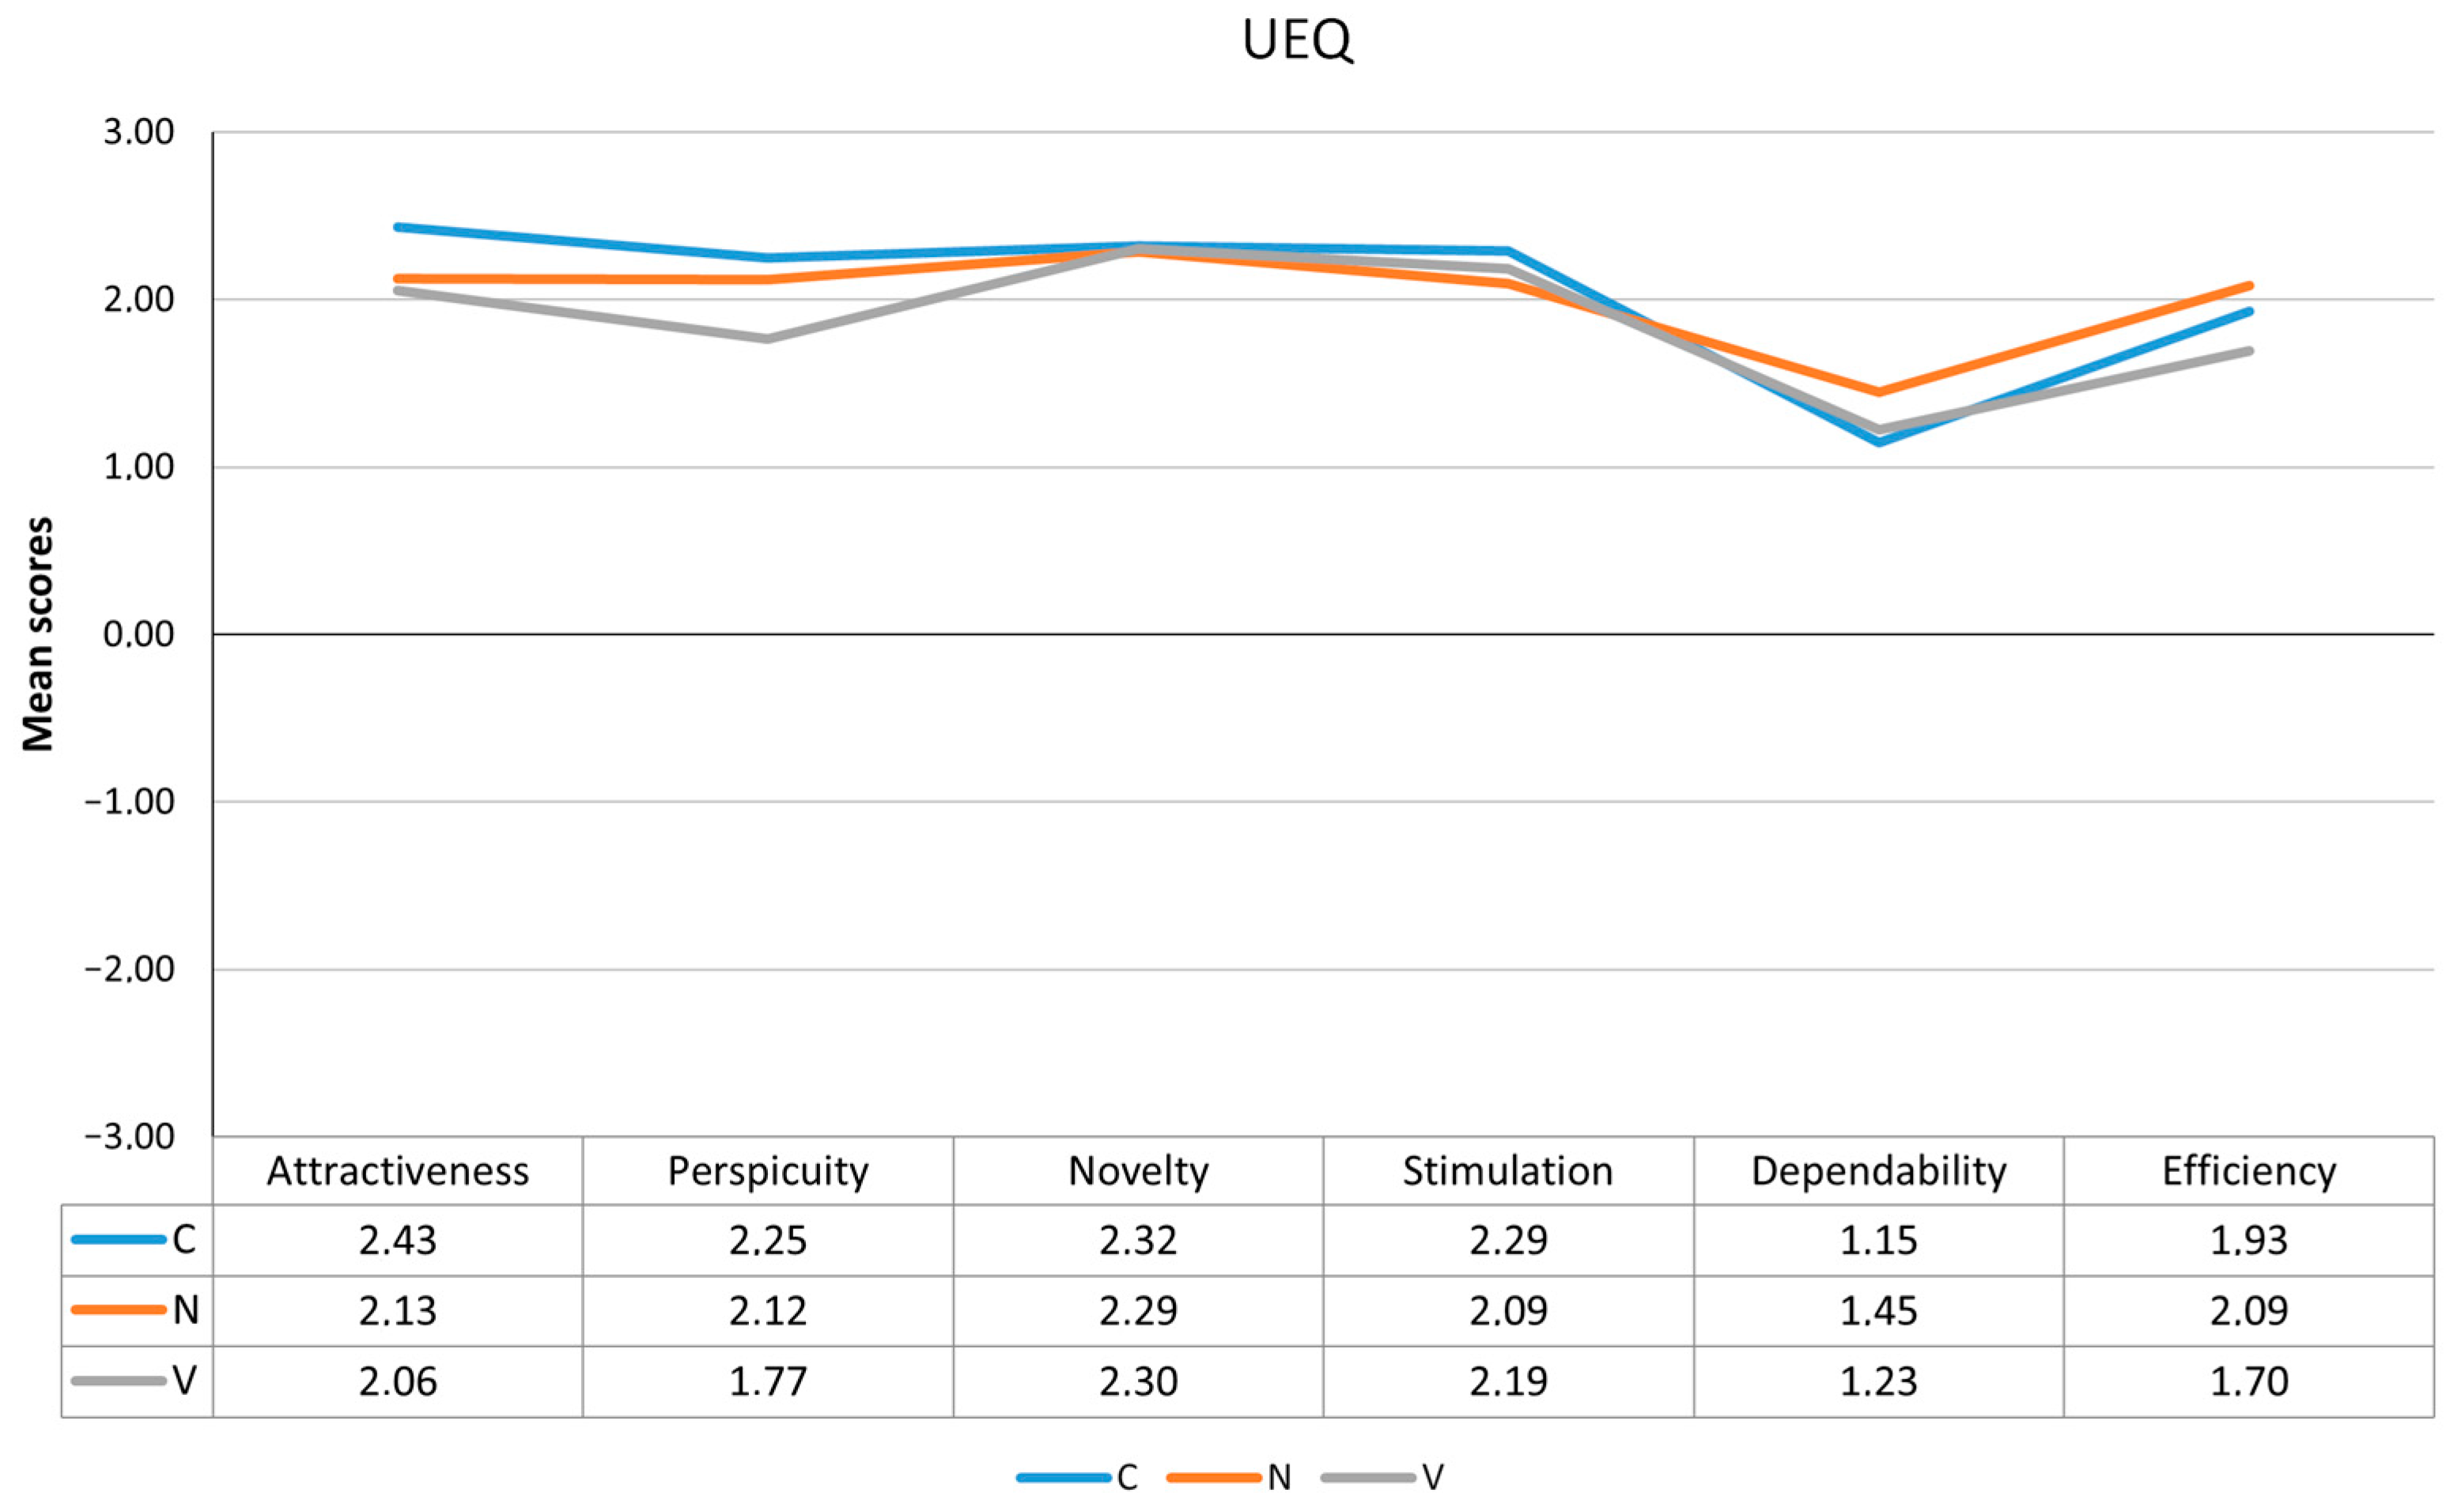
3.6. User Experience
Regarding the user’s experience with immersive virtual training, participants were asked to express their opinions through a UEQ. Participants in all three groups rated the experience positively in each of the five dimensions evaluated (i.e., attractiveness, perspicuity, novelty, stimulation, dependability, and efficiency), as shown in
Figure 11.
4. Discussion
The purpose of the present study was to evaluate the effectiveness of the VR simulation “Safer Water” for river flood emergencies, comparing three tutorials differing in their level of contextualization and interaction.
The results highlighted that participants in all groups improved their short-term level of knowledge both related to factual contents, i.e., the information related to the signals of an upcoming flood, and to the behavioral ones, that is, the behaviors to be undertaken when the emergency outbreaks. Notably, this improvement is also retained 15 days after the experience, thereby suggesting the long-term value of the experience. While the short- and long-term knowledge improvement emerged in all three groups, the participants using the Context tutorial showed a higher retention rate as compared to the Video tutorial group. This finding possibly suggests a facilitation effect due to the fact that participants in the Context tutorial group were already familiar with both the environment and the commands and could focus more on the information delivered during the experience. The different tutorials also had an impact on the type of cognitive load experienced by participants. While no differences between the experimental conditions emerged for the level of both the intrinsic and extraneous load, participants who trained using the Context tutorial reported higher scores in germane load, which facilitates learning [
31,
32]. Besides showing the effectiveness of the IVR experience, this finding also provides indications for the design of future IVR environments that are meant to boost the learning process, thereby extending previous research that had neglected the familiarization phase [
36].
Furthermore, regardless of the tutorial type, the experience helped the users to build awareness about the flood risk and to gain an adequate perceived preparation against these kinds of emergencies. Both aspects are crucial to effectively convey the idea of the concrete danger that is linked to the events that occur during emergencies [
47,
48] and to make the citizen more aware of the environment around them. Moreover, the extent to which citizens perceive themselves prepared is of paramount importance, as it promotes the prompt adoption of correct behaviors when the emergency occurs. In this perspective, virtual reality can be seen as a sustainable and persuasive medium that can clearly show the cause–effect link of given behaviors, thereby raising users’ consciousness [
49].
Notably, users reported that they solved the tasks easily and that they felt in control of the environment, thereby indicating that the level of usability was satisfactory and did not interfere with the learning process. The behavioral data highlighted how the users in all groups were able to identify an alert situation; in fact, they identified the majority of the danger indicators. However, it is worth mentioning that users were not always able to take shelter on the first attempt. This may be due to the fact that this situation involved a higher level of emotional arousal because of the sudden embankment break from which the users had to escape [
10]. Additionally, it emphasizes the importance of having the opportunity to practice life-saving behaviors in relatively low-stress conditions until they are fully internalized. The evaluation of hedonic qualities that have been reported in the UX questionnaire showed how the simulation has been experienced positively; in fact, participants in all groups found it innovative, creative, interesting, and motivating. Additionally, from users’ opinions emerged high levels of sense of presence in terms of sensory fidelity and interface quality, but realism and immersion have also been reported. The Safer Water experience was designed and implemented to be easily accessible even for naive users, including individuals with limited digital literacy and with little knowledge about floods. While the user plays the role of a Civil Protection volunteer, the simulation is not meant to burden them with the tasks and responsibilities related to rescuing other individuals. As such, the unfolding of the events is purposefully kept rather simple, e.g., there is no logistic coordination involved, to allow the user to focus on the contents to be learned. The positive outcomes of the evaluation also endorse the effectiveness of the co-design approach adopted for designing and implementing the experience [
35]. This finding indicates that these kinds of experiences should be planned and designed with the joint contribution of experts from various disciplines, including psychology, HCI, hydrology, hydraulics, and the continuous involvement of stakeholders, e.g., civil protection. In particular, while simulations hold potential, they may not fully replicate the complexity of real-world scenarios [
50]. Safer Water is tailored for training citizens in recognizing potential risks and ensuring their safety. It is not geared towards security and rescue personnel, but instead emphasizes crucial aspects for citizen preparedness and attitudes toward floods, without causing sensory and cognitive overload [
26].
Despite being insightful, the present work has some limitations that need to be acknowledged. Firstly, in the current version, “Safer Water” fully unfolds outdoors, thereby failing to address the behaviors to be undertaken when a flood emergency outbreaks and citizens are indoors. Future studies should investigate this aspect, designing virtual simulations that help citizens adopt safe behaviors during a flood emergency, even inside their homes. A further methodological limitation pertains to the fact that the retention questionnaire was administered only once, two weeks after the experience, thereby failing to assess the extent to which participants could remember the correct information after a longer period of time, e.g., after six months from the experience.
Moreover, the sample involved citizens who were actually dwelling in areas at risk of floods, but they were all young adults. While this led to homogenous data, it also leaves unanswered questions regarding the effectiveness of the IVR experience for citizens with a wider age-span. Therefore, future studies should be conducted to investigate the effectiveness of “Safer Water”, also with older adults and adolescents. Indeed, the Safer Water experience is meant to be used by municipal administration in high-risk areas in the context of prevention and awareness campaigns as a support tool for the operators. As such, it is supposed to address all the citizens living in hydrogeological risk areas, regardless of their digital skills, in the perspective of social, economic, and environmental sustainability. Furthermore, simulation can offer a valuable contribution to school educational programs for students aged 13 and older (
https://www.oculus.com/safety-center/, accessed on 14 September 2023) by raising awareness and providing the opportunity to practice correct behavior.
Safer Water scenarios were partially based on a river area in northern Italy known to be subject to frequent floods. However, these scenarios are flexible and can be transposed to comparable areas with akin topographical and geographical traits, with adjustments tailored to specific needs. This includes consideration for cultural aspects such as language and designated emergency contact numbers.
Taken together, our findings support the value of VR technology for creating engaging and sustainable training experiences that enable the “learning-by-doing” in risk-free conditions, thereby maximizing the likelihood of content retention. Moreover, the present work contributes by providing important indications on the design of tutorials for making users familiar with the environment in an effortless way and on ensuring a proficient and mindful subsequent interaction with the experience that will allow them to fully focus on the contents.

 ,
, 


