1. Introduction
In contemporary urban planning, the integration of digital technologies and artificial intelligence (AI)-driven engines has become pivotal for collecting, analyzing, and monitoring urban infrastructure data to foster healthier environments [
1,
2,
3]. A critical aspect of measuring healthy urban parameters for inhabitants is the presence of urban green space (UGS) and natural outdoor environments [
4,
5]. These spaces have a substantial impact on the well-being of residents, and AI technologies can play a crucial role in determining their proximity, accessibility, quantity, and quality. However, in places where access to open data is limited and urban infrastructure is insufficient or poor, as in informal settlements of the urban Global South, this process could be challenging and inaccurate.
In Latin America, disparities in UGS are closely linked to socioeconomic status [
6], with low-income and peripheral neighborhoods often lacking in quality [
7,
8]. The outbreak of the COVID-19 pandemic further exacerbated existing disparities in health, social, and economic outcomes, particularly within micro-level localities of major cities in this region [
9,
10]. Informal settlements in Latin America are predominantly vulnerable, experiencing higher mortality rates and increased instances of psychological and social disorders among their inhabitants [
11]. Along with the lack of policies and effective urban design strategies in these often conflict-ridden areas, there has arisen an increasing debate over strategies for bringing basic healthy spaces [
12] and equipment for mental and physical health to these localities [
13].
To address these challenges and to offer a more comprehensive perspective on peripheral and low-income neighborhoods with limited open data access and insufficient infrastructure, this study provides a physical analysis of a set of existing-conditions factors—UGS, public spaces, roads, and points of interest (POI)—for two peripheral neighborhoods of Quito, Ecuador: Toctiuco and La Bota (
Figure 1). These two neighborhoods have been the site of an ongoing public space and community-design engagement research project that one of the authors has developed since 2019. In public spaces studies, it is important to consider a range of socio-spatial factors to arrive at optimal public space configuration. These factors may include economic aspects, social dynamics, labor relations and organization, neighborly relationships, population diversity, and land use activity, among others [
14,
15,
16]. However, in this paper we have narrowed our attention to the consideration of physical infrastructure alone in order to demonstrate a novel methodological approach. Specifically, this narrowing of focus is intended to reveal a methodology that combines AI methods with the analysis of informal neighborhoods in the Global South utilizing geospatial and network analysis techniques to develop an index of proximity, accessibility, quantity, and quality for these spaces. The broader purpose of this methodology is to make visible a network of potential healthy environment criteria that may be useful in future, more comprehensive research that also includes social and cultural aspects of public space alongside physical infrastructure for urban areas of the Global South such as these.
We used a combination of neighborhood scale representation methods using the Google Places API and Microsoft’s Planetary Computer as well as spatial indexing tools. By employing cutting-edge technologies for data collection and analysis, our study aims to contribute to the location and enhancement of public spaces to achieve healthy conditions and potentially inform policymakers, urban planners, and scholars in their efforts to create more inclusive and sustainable urban environments for peripheral and low-income neighborhoods.
In structure, this paper provides, first, a brief introduction to the two study neighborhoods. Second, in data and methods, we present our mode of approach to spatial data collection, geospatial layer information, and referent studies. Third, we identify, collect, and analyze data on spatial amenities and characteristics of the two case studies by using different open-source platforms. Fourth, we discuss the data collected and highlight key findings related to UGS, public spaces, roads, and POIs, and present the resulting values. Finally, we present conclusions of the methodological approach to spatial data collection.
Brief Approach to La Bota and Toctiuco
La Bota neighborhood is located on the northeast side of Quito, named for its “boot” shape as seen from above. It has a low natural slope at its center but is surrounded by steep slopes along its perimeter. La Bota comprises an area of 5895 ha. and, according to the most recent projections, a population of nearly 13,000 inhabitants, whose main income is commerce and services [
17]. During the 1970s and 1980s, an oil boom across the country and the concomitant intensification of industry and urban construction drove a wave of rural-to-urban migration into Ecuador’s main cities [
18]. Confronting this challenge, between 1974 and 1976, a team of professors and students of the Faculty of Architecture and Urbanism at the Central University of Ecuador was to design an urban and architectural plan for two new neighborhoods,
Comité del Pueblo and
La Bota, out of what was formerly a private estate,
Hacienda Eloísa. This study, “Towards a Popular Urbanism” (
Hacia un Urbanismo Popular), configured the new neighborhoods as modular, with lots measuring 9 × 21 m (189 m
2) and blocks comprising either 12 or 16 lots. The design further organized these blocks into “cells”, corresponding to six aggregated blocks (84 lots), two of which were dedicated to essential neighborhood infrastructure. Moreover, the design organized these cells into “zones” or “cell ensembles”, each of which gathered four cells—336 lots each—of which eight were dedicated to essential infrastructures [
19]. Despite this intricate plan, the dedicated urban infrastructure never achieved its intended function owing to a lack of oversight in both management and construction from the local government.
Toctiuco, whose name means “corn flower”, is a neighborhood traditionally inhabited by low-income socio-economic groups. It is located in the west side of Quito, on the slopes of the Pichincha mountain chain. The lowest point considered in our study has an altitude of 2950 m.a.s.l.; the highest, meanwhile, rises to 3300 m.a.s.l. The latter offers a wide view of the city and its valley but also maintains, on average, a temperature 4 °C lower than the city center below [
20]. The neighborhood has a population of 40,000, according to the last projection studies from 2022 [
21]. Its origin dates from 1954, when, similar to La Bota albeit decades earlier, rural and largely Indigenous populations migrated from the countryside to the urban center of Quito. Given the severe lack of housing in the city at the time, especially for poor new arrivals, many of these migrants “invaded” officially privately-held land [
18]. What became the present-day Toctiuco neighborhood was then a
hacienda owned by the
Hermanos Mercedarios religious order [
22]. As in La Bota, the configuration of Toctiuco was influenced by rural-to-urban migration to Quito, especially by that of the later oil boom of the 1970s. This phenomenon directly changed the morphology of this and other urban centers across Ecuador as people established their dwellings little by little in an informal and unplanned manner, much of which has remained this way [
23,
24].
2. Data and Methods
In order to make visible and provide spatial evidence of the current adverse conditions people endure every day due to the lack of adequate urban infrastructure in informal neighborhoods of the Global South, it is useful to analyze the open data network and the succeeding cartographies produced from such information. This paper draws on recent advances in the field of geospatial information for urban areas at a neighborhood scale and applies it to Toctiuco and La Bota.
In the face of the many urgent and critical changes taking place in Global Southern cities, an increasing interest in measuring and quantifying critical aspects of urban infrastructure has grown. Toward this end, this article follows and measures the WHO key parameters that contribute to healthy urban environments: access to green spaces, hospitals, efficient mobility infrastructure, connectivity with neighboring communities being among the most important [
13]. The intention is to develop a more comprehensive spatial understanding of these kinds of urban areas to reach minimum healthy cities parameters. To this end, we employed a combination of representation and spatial analysis techniques in the face of the limitation of open access information.
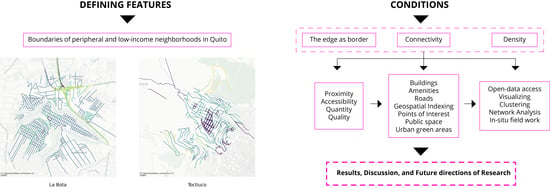
Data for this article include a range of geographic information types: sociodemographic data, amenities, road information, buildings, and spatial indexing. In combining this range of geographic datasets, we present a methodology (
Figure 2) for the study of healthy cities criteria in peripheral and deprived neighborhoods of Global Southern cities, where more typical open-data access is frequently limited.
The methodology begins by delimiting the study area, using the neighborhoods’ boundaries and population data found in the shape file of the 2010 National Census (INEC). (The last official Census in Ecuador was carried out in 2010. However, there are official projections by INEC (National Institute of Statistics and the Censuses, from its Spanish initials) produced in these years. We used the 2022 population projection.). With these boundaries so defined, we then correlated this study area with data from a set of available open-data sources. Four sources specifically helped to understand the urban dynamics of the study area: the Microsoft Planetary Computer API, the Google Places API, the Overpass API, and the H3 API. In addition to the use of available open-data sources, our approach drew upon open-source technologies, namely Python, to connect between application programming interfaces (API) and to manage data downloads in each layer. It is necessary to have previously configured the program with respect to geospatial analysis libraries, data management, access credentials (for APIs) and data visualization.
Further, by utilizing satellite imagery, we extracted polygon data corresponding to the estimated footprint of structures located within the designated study area. This data layer is derived from the building footprints dataset available via the Microsoft Planetary Computer API. This dataset is generated by a pre-trained artificial intelligence model that is designed to delineate building footprints based on rooftop imagery. The model is trained using historical satellite imagery spanning from 2014 to 2021, which ensures a more comprehensive and accurate representation of building footprints than any single-year snapshot. The remarkable precision and reliability of this dataset is also noteworthy in its evaluation metrics. For instance, in South America—the region most pertinent to our study—the building footprints dataset boasts a precision of 95.4% and a recall of 78.0% [
25]. This high level of precision reinforces the credibility of the data source for our research objectives and the viability of extending its use in similar peripheral territories in the country or region.
By utilizing the Google Places API, we can access a wide range of amenities and services available in a specific area, which provides valuable information regarding geo-locational coordinates, use-type categories, and physical status. Utilizing Google Places offers several distinct advantages over OpenStreetMap (OSM), particularly in terms of updates and comprehensive coverage. Google Places is known for its frequent updates, ensuring that the data remain current and reflective of real-world changes [
26]. This timely responsiveness is crucial for studies that require up-to-date information, as in urban planning. Additionally, Google Places boasts extensive coverage, capturing vast amounts of data across various regions of the world, both urban and rural. In contrast, OSM, while valuable in its own right, often lags in its updates and may not be as exhaustive in its coverage, especially in certain remote or less-populated areas.
Moreover, the Overpass API played a pivotal role in our data collection process, particularly when it came to understanding urban mobility and infrastructure nuances. Through this API, we could acquire a wealth of information pertaining to internal circulation within urban spaces. It allowed us to differentiate structures based on their specific use type or roadways by their condition, ranging from main thoroughfares to minor streets [
27]. Such detailed data is particularly serviceable when assessing the infrastructural dynamics of urban environments and their potential implications for accessibility and movement. Finally, it is imperative to have a systematic and standardized method of comparison and aggregation. This is where the H3 API came into play. The H3 API provides a global spatial indexing system, ensuring that data from disparate sources or of varied natures can be homogenized for comparison purposes (Data obtained from h3geo.org. (2023). H3 Documentation. Retrieved from
https://h3geo.org/docs (accessed on 12 February 2023)). Utilizing such a system allowed for a consistent analytical framework, enabling us to compare spatial data across different scales (Data obtained from h3geo.org. (n.d.). H3 Documentation, Resolutions. Retrieved from
https://h3geo.org/docs/core-library/restable (accessed on 12 February 2023)) and regions with confidence and precision.
With the data collected, we undertook a thorough cleaning and formatting process to ensure compatibility and uniformity among all information layers. With this prepared dataset, we were able to seamlessly create analyses, develop machine learning or deep learning models, and apply geospatial algorithms effectively. This streamlined approach enhances reproducibility, empowering us to derive valuable insights on peripheral neighborhoods where accurate or current information is not available. While this digital representation provided a spatial approach to the respective case studies, it is crucial to understand the underlying social realities that shape them daily. For that purpose, we first created a list of potential data sources that could be analyzed as part of further qualitative research (
Table 1):
With the data in place, we could analyze it effectively and provide a framework to be applied by using the methods presented below.
2.1. Overlay Method
Overlay method is a fundamental operation in geographic information systems (GIS) that allows the integration of multiple spatial datasets to produce a new output map. This process involves superimposing multiple layers of data to identify relationships, interactions, or coincidences between them [
28]. For instance, by overlaying a dataset of points of interest (POIs) with road networks, one can deduce patterns of accessibility or proximity to essential services within an urban setting. Similarly, intersecting building polygons with an H3 grid can be useful for segmenting urban structures into standardized spatial units for comparative analyses. There are primary types of overlay operations, such as “intersect”, “union”, and “identity”. The “intersect” operation identifies areas where all input layers overlap, the “union” operation combines all features and attributes of the input layers, and the “identity” operation retains features from an input layer and adds attributes from an overlaying layer.
The accuracy and reliability of overlay analysis depends largely on the quality and resolution of the input data. It is also essential to ensure that all datasets involved in the overlay are formatted in the same coordinate system and have consistent attributes for meaningful results.
2.2. Network Analysis Method
To understand the spatial context of points of interest (POIs) and their potential impact on analytical model development, we employed a network analysis approach, which contrasts from a spatial clustering approach that groups data points based on similarity [
29,
30]. Our network analysis delves into the relationships and interconnectivities between POIs, offering insights into the spatial distribution and relationships among amenities.
The foundational step involved calculating distances between all pairs of POIs using their geographic coordinates. This was achieved through the geodesic distance formula, based on the law of cosines for spherical triangles:
where:
▪ lat1 and lat2 are the latitudes of the two points in radians;
▪ lon1 and lon2 are the longitudes of the two points in radians;
▪ Δlat is the difference between the latitudes (lat2 − lat1);
▪ Δlon is the difference between the longitudes (lon2 − lon1);
▪ R is the radius of the Earth (e.g., in meters or kilometers);
▪ d is the geodesic distance between the two points in the unit of measurement used for the Earth’s radius.
In processing the distance information, we targeted the ten nearest POIs for each individual point. Distances between each pair of POIs within a specific category were computed, resulting in a sorted array of indices based on proximity. The subsequent array captured proximity-based connections among the amenities. The culmination of this step was the creation of an adjacency matrix, which is a binary representation of the connections between POIs. This matrix was the blueprint from which we derived a graph composed of nodes (POIs) and edges (connections), encapsulating the relationships and interactions within the dataset [
31].
3. Results
3.1. Data Collection
3.1.1. Amenities
In order to obtain a more detailed context for La Bota and Toctiuco, we gathered information related to services and POIs throughout these two locations for their relevance. We initially used Open Street Maps (OSM), a collaborative open-source project that creates and provides free geospatial data. Anyone can contribute to OSM by adding, editing, and updating geographic information map [
32]. The OSM community is responsible for maintaining and improving the data, resulting in a detailed and up-to-date geospatial dataset. OSM allows free access to its data and is based on the Open Database License (ODbL). This API provides data on points of interest (POIs) such as parks, schools, green areas, stores, hospitals, and bus stops. However, we found that OSM had limited mapped data in these two neighborhoods.
Given the limited data available via OSM, we resorted to using the Google Places API to supplement further data. This is a paid service provided by Google through its API, which allows developers to access information about places and POIs, albeit with a limited number of free queries. To obtain POI data using Python, we first acquired an API key from Google Cloud Console to then send requests to the API endpoint using Python library “requests”, which allows HTTP requests to be sent to the web API. These requests include the API key and the desired location, either by latitude/longitude coordinates or by the name of the place. The API responds with a JSON object containing information about the POIs at the requested location. This information is then parsed using a “JSON” library to extract the necessary data, such as the name, address, and type of each POI. The collected data provided an idea of the available services in La Bota and Toctiuco. This series of API requests was carried out using 1 km and 2 km radius perimeters. It was found that the 2 km radius permitted the identification of a greater number and typologies of POIs.
Following our approach to data collection, we included the relevance of public spaces toward designing and/or implementing healthy neighborhoods based on Setha Low’s “Why Public Space Matters” [
33]. Low identifies six factors that demonstrate how public space contributes to a healthful neighborhood:
▪ Social justice and democratic practices;
▪ Health and well-being;
▪ Play and leisure;
▪ Informal economy and social capital;
▪ Environmental and ecological sustainability;
▪ Cultural identity and attachment to place,
In order to incorporate the core principles identified by Low, and thereby to enhance the depth of our research, we conducted an extensive data collection effort relevant to each of these factors. We collected data on a wide range of amenities, including restaurants, ATMs, banks, bars, beauty salons, bicycle stores, book stores, bus stations, cafes, car repairs, car washes, cemeteries, churches, city halls, cycling routes, dentists, doctors, farmland, fire stations, forests, funeral homes, gardens, gas stations, gyms, graveyards, hospitals, green spaces, laundries, libraries, liquor stores, local government offices, night clubs, parks, parking lots, playgrounds, pet stores, pitches, pharmacies, physiotherapists, police stations, post offices, schools, shopping malls, ramps, spas, stairs, stadiums, stores, supermarkets, taxi stands, transit stations, universities, and veterinarians. As Low demonstrates, these spaces are vital for socialization, learning, and play, and serve as infrastructure for inclusivity [
34], which can be considered in a future work that combines social and cultural aspects of public space.
To better organize and represent the POI data, we adopted a framework of categories from the World Health Organization’s “Healthy Cities Effective Approach to a Rapidly Changing World” [
13]. This framework includes three tiers: structuring categories, subcategories, and types (
Table 2):
Together, these amenities deliver an informatic portrait of the services available, their total number, and the proximity they have in our case studies (
Figure 3). In Toctiuco we identified 745 amenities and in La Bota 786 amenities (
Table 3), with the following variables: business status, geometry, icon, icon background color, URL, name, opening hours, place ID, rating, reference, scope, types, user ratings total, vicinity, photos, and plus code.
In both neighborhoods, the predominant category of POIs was “local economy”, with approximately 500 POIs in La Bota and 400 POIs in Toctiuco. This analysis indicates the presence of numerous small businesses such as stores, hairdressers, and restaurants. At the same time, it reveals the significant presence of local businesses and enterprises owned by residents, meaning that the local economy relies heavily on small establishments owned by the local population.
We present a series of bar plots (
Figure 4), part of an exploratory data analysis (EDA), that showcase the distribution of points of interest (POI) data. These visualizations categorize POIs both by neighborhood and by specific category and subcategory. Such a structured representation ensures clarity and provides an insightful preliminary overview, setting the stage for subsequent detailed analyses. It becomes evident that the two neighborhoods share a congruous distribution of POIs. Both areas exhibit a pronounced absence in the categories of natural environment and governmental establishments.
3.1.2. Roads, Connectivity, and Accessibility
The condition of primary and secondary streets in La Bota and Toctiuco makes visible the accessibility and connectivity both within the respective neighborhoods and in their connection to surrounding areas, with a special focus on the quality of streets needed to reach UGS within each neighborhood. This analysis reveals information on the availability of public transportation, pedestrian and cycling infrastructure, and road conditions for the local population. To access this data, we used the Overpass API, which contains the following variables: type, geometry, alt name, highway, and name (
Figure 5). The variable “highway” provides information on the type of road, which can be categorized as residential, service, footway, unclassified, track, path, or pedestrian.
In
Figure 6, Toctiuco contains a greater variety of road types, yet they do not connect within the neighborhood although they do make connections with the surrounding area. Footways, used by pedestrians, are well connected in the most defined blocks (rectangular shapes). Within the natural and built border, the shape of blocks is more irregular as they follow the geography of gorges and slopes. In this area, connection and accessibility are low and difficult, showing the presence of many unpaved roads, which also cause a physical segregation between the inhabitants and the urban environment.
In La Bota (
Figure 7), most of the study area is covered by paved roads used by cars. Sidewalks are narrow or nonexistent on many streets, making it very difficult for inhabitants to walk within the neighborhood. Here, connectivity is well covered in the neighborhood, but accessibility is low or null.
3.1.3. Building Footprints
An important part of this analysis is to understand how La Bota and Toctiuco are shaped by the urban fabric and population density. We did this by contrasting the open data access with reality. For that purpose, we used the last official census in Ecuador from 2010, which shows specific data about building footprints in neighborhoods, but also used the 2022 population projection, from which we could extract an approximation of density, housing, and population. It must be noted that this data is not precise, and indeed the unavailability of accurate and up-to-date census data is a recurrent problem in Ecuadorian cities.
We used the Microsoft Planetary Computer API, which retrieves precise building geometries. The building footprints are 2D contours, and we examined them in both neighborhoods. These footprints can be used to create detailed cartographies of urban areas, to estimate population density, and to track changes in urbanization over time. First, the connection to the Microsoft Planetary Computer API was established by using the corresponding connection string. Then, a request was made to access the layer of building footprints in Ecuador. We verified that the date with better data quality was “Ecuador_2022-07-06”, as opposed to the latest version of the API. Once the data was obtained, the GeoParquet file was ready for processing, and the analysis corroborated the number of partitions and columns in the dataset, which was important to access the bounding box of the continental territory of Ecuador. To complete the preparation of the necessary data, the shapefiles corresponding to the neighborhoods were prepared for a spatial intersection made between the obtained “GeoDataFrame” and the mentioned shapefiles, allowing analysis and extraction of the relevant information. The results for La Bota estimated 1234 buildings and for Toctiuco, 1007 (
Figure 8).
3.1.4. Hexagonal Hierarchical Geospatial Indexing System (H3)
The hexagonal hierarchical geospatial indexing system (H3) is a method of indexing and organizing geographic data based on a hexagonal grid. This indexing system is designed to efficiently store, query, or aggregate geospatial data at various scales and resolutions. It also organizes data into nested levels of increasing granularity. Each level of the hierarchy is presented by a different hexagonal grid, with finer grids nested within coarser grids. Through this organization, H3 can efficiently aggregate data at different levels of detail, from a global view to individual city blocks. The ability to represent geographic data at multiple scales without losing precision or detail helps to indicate more specific geographic data for an area.
In this analysis, we integrated the H3 system for geospatial data analysis of the two neighborhoods (see
Figure 9). It is important to emphasize that our use of the H3 system was not for spatial clustering. Instead, we employed it as a standardized method to aggregate and compare spatial information consistently across study areas. Thanks to the structured spatial indexing of H3, we achieved a consistent evaluation of the data at different scales and regions. For this study, we opted for a resolution of 10, which is equivalent to an area of 15,047.502 m
2, or approximately 1.5 urban blocks. This resolution is the main parameter of our analysis and ensures both the accuracy and relevance of our results.
3.2. Overlay Analysis
3.2.1. Hexagonal Hierarchical Geospatial Indexing System (H3) with POIs
In this study, we conducted a comprehensive analysis by leveraging the overlay method and employing H3 geo-indexing with points of interest (POIs). The primary objective of this analysis was to quantify the number of POIs within each hexagonal region, and to categorize them based on their respective categories or subcategories. To visualize this data cartographically (
Figure 10), we used contrasting colors to better understand the connections and spatial representations, and then we identified areas with the highest concentration of amenities and gained insights into the types of facilities present.
This approach allows more effective assessment of the spatial distribution and density of amenities across the study area. Using H3 geo-indexing offers a hierarchical hexagonal grid system; we organized and indexed the POIs based on their precise geographic locations within each hexagon.
By conducting this analysis and visualizing the results cartographically, we identified hotspots with high concentrations of specific types of amenities. The color-coded cartography allows one to discern areas where particular categories or subcategories of POIs are more prevalent. For example,
Figure 11 represents areas with higher concentration of amenities within the corresponding hexagons. This information offers insights into the spatial patterns of amenity distribution and highlights areas with an abundance of specific facilities.
Furthermore, by expanding the scope of our analysis to encompass neighboring areas, we assessed the relative deficiencies in amenities. By comparing the concentration of POIs in different hexagons and their surrounding regions, we could identify areas with relatively lower numbers of amenities. As a result, we uncovered potential deficiencies in access to specific facilities like UGS in the given case study neighborhoods. This information can be of great significance for urban planners, policymakers, designers, and local authorities as they work toward enhancing the quality of urban conditions and ensuring equitable access to essential amenities for residents.
3.2.2. Hexagonal Hierarchical Geospatial Indexing System (H3) with Roads
In a continuation of our spatial study, we integrated the H3 system with road data from the Overpass API. This extension aimed to evaluate road infrastructure quality and determine area accessibility. The Overpass dataset offers nuanced information on road categories, delineating between high-speed corridors, pedestrian paths, one-way streets, and more. Using the H3 hexagonal grid system, we investigated the interplay between distinct road infrastructures within each hexagonal region. Road categories provide context on the condition and role of various thoroughfares. For instance, high-speed roads indicate primary transport corridors, while pedestrian paths underscore pedestrian-centric regions that advocate walkability. One-way streets, on the other hand, define areas with a unidirectional traffic flow, often at slower speeds.
Analyzing the intersection of H3 hexagons with road data provided clarity on infrastructure quality and overall accessibility for each region, as depicted in
Figure 12. Regions overlapping with major roads likely have better transportation links and easier access to amenities, while those overlapping with pedestrian paths emphasize areas designed for walking. While it may be difficult to identify green spaces using only open data, our analysis of neighborhoods reveals that pedestrian walkways are the predominant method of accessing these spaces. By combining information with our layered spatial analysis, we can determine new insights into the connection between road infrastructure and green spaces, which is crucial for guiding urban planning and public space development decisions toward healthy cities in low-income neighborhoods.
3.2.3. Hexagonal Hierarchical Geospatial Indexing System (H3) with MSPC Building Footprints
When intersecting the H3 system with the Microsoft Planetary Computer building footprints layer, we could assess the density and overcrowding in La Bota and Toctiuco, quantifying the number of buildings within each cell (
Figure 13).
We additionally identified areas with a higher concentration of buildings within a limited space, and it showed that these areas may experience higher population density and potential challenges related to overcrowded zones (
Figure 14).
3.3. Network Analysis
As previously elaborated, using the adjacency matrix—a binary representation of the connections between POIs—we crafted a graph that encapsulated the intricate web of relationships and interactions within our dataset. This graph is made up of nodes (representing the POIs) and edges that define their relationships. Diving into the visualization of this network, it becomes evident how these relationships and the proximity between health-related amenities intertwine. Each node (or POI) stands as a distinct point on the graph, with edges offering a vivid representation of their interrelations. The depth of this visual information aids in pinpointing areas with a higher concentration of health services, subsequently shedding light on the accessibility of these services.
An in-depth examination of the “local economy” amenities within our neighborhoods yielded insightful observations (
Figure 15). For instance, it is evident that while dense areas exhibit significant concentrations of these amenities, a considerable number nevertheless lie outside the immediate neighborhoods. This distribution pattern appears to indicate that residents often venture outside their local vicinity to access diverse “local economy” amenities. Such trends accentuate the importance of enhancing local availability and accessibility of vital amenities to support community self-sufficiency.
A key metric of our network analysis is the calculation of the average degree of each node. This metric provides a quantitative measure of the average number of connections (or relationships) that a specific node (or POI) maintains within the graph. A node’s average degree offers insights into how interconnected or isolated a given POI might be within and around a given area. In the context of Toctiuco, the node average degree of “local economy” stands at 12.56. This suggests that, on average, each point of interest in the “local economy” category is directly connected to approximately 12 other such points. However, a significant observation from our analysis is that most of these connections lead outside the neighborhood area. This finding holds critical importance because it suggests that while there might be a plethora of amenities, their spatial distribution is not localized within neighborhood boundaries. Such a distribution pattern could potentially impact residents’ ease of access to vital services and might necessitate travel outside their immediate locality to avail themselves of certain amenities. This not only has implications for daily convenience but also hints at possible urban planning and infrastructural imbalances within the neighborhood.
The observed pattern, where many amenities are primarily located outside the neighborhood, underscores the importance of understanding not just the mere presence of these amenities, but also their spatial distribution and ease of accessibility. As further illustrated in
Figure 16, a substantial number of nodes and their connections across various categories lie outside the immediate neighborhoods. This finding amplifies the need for urban planning strategies to prioritize local accessibility, ensuring that residents can access a diverse range of amenities without venturing far. A focused approach on the internal development of amenities would guide neighborhoods toward greater self-sufficiency and inclusivity, spotlighting potential areas to foster as healthy urban spaces.
4. Findings and Discussion
4.1. Cross-Layer Analysis and Data Visualization in Peripheral Neighborhoods
With the increasing use of big data and AI tools for urban design, the availability of geospatial data often seems almost universally complete, accurate, and accessible. However, in informal settlements and peripheral areas in Global Southern cities, where conditions are volatile and rapidly changing, this is far from the case. Geospatial analysis in these areas demands verifiable data access, often requiring in situ verification. Moreover, the painstaking task of classifying information and categories for data collection and geospatial analysis demands expertise in urban design, community engagement, and a profound understanding of the areas under study. This situation underscores the challenges that urban planners, designers, and policymakers face in terms of significantly higher time consumption [
3,
35] compared to places where open data are more accessible and accurate. Hence, one of the most critical aspects of urban planning processes is ensuring more efficient access to open data, which can facilitate geospatial analysis in places that urgently require urban intervention and infrastructure, like the low-income, informal, and peripheral neighborhoods precisely where existing geospatial data is often lacking.
By integrating diverse datasets and employing cross-layer analysis and data visualization, we obtained valuable insights into patterns of amenity distribution, road infrastructure, and building density. Our methodologies were standardized as they systematically harnessed open data from APIs for a specific study area, with aggregation and comparison methods rendering them replicable across a range of cities and countries. This standardization demonstrates the effectiveness of this methodology in highlighting a neighborhood’s infrastructure concerning road networks, public spaces, UGS, and potential deficiencies in essential services. Additionally, network analysis emerges as a promising tool for understanding the relationships and connectivity between amenities, which can offer new possibilities for urban planning and healthier city development.
4.2. Connections toward Urban Health Spaces
This study employs an adjacency matrix to construct a network graph representing points of interest (POIs) and their relationships within a dataset. This graph reveals the intricate connections among health-related amenities and highlights areas with concentrated health services. We identified that analyzing the “local economy” variable in both neighborhoods, Toctiuco and La Bota, offered valuable insights into how inhabitants depend on this amenity and also how they are placed in the areas, which are centralized. This situation leads to an overview of infrastructure, activities, and people being displaced and segregated. The node analysis suggests that there is a substantial interconnection, but most of these connections extend beyond the neighborhood. This situation emphasizes the importance of providing spatial distribution and accessibility.
This finding underscores the necessity of urban planning strategies that prioritize local accessibility and inclusivity. It encourages the development of internal amenities to enhance self-sufficiency within neighborhoods while also identifying potential areas for creating healthy urban spaces. This research emphasizes the need to consider not only the presence of amenities but also their distribution to promote healthier, more connected cities, especially in disadvantaged areas.
4.3. Insights and Study Limitations
The specifics of the examination in the neighborhoods of Toctiuco and La Bota in Quito revealed a discernible scarcity of points of interest within a two-kilometer radius. This scarcity underscored exclusionary dynamics that compel residents to venture beyond their own communities into neighboring districts for daily necessities. Additionally, the accessibility scenario emerged as a notable deficiency, with significant inadequacies in green space accessibility posing a significant challenge. Analysis of building polygons revealed prevalent overcrowding, a common plight in marginalized neighborhoods. Comparatively, reviewing similar initiatives such as “15-min cities” projects in Mexico and Nanjing, China [
36,
37] showcased a narrower analytical lens. Our methodology transcends this limitation by amalgamating diverse data sources and methodologies, striving to unravel the dynamics and determinants of healthy public spaces beyond point-based analysis to a more comprehensive network analysis.
However, our endeavor faced several limitations. Constraints such as API data download quotas, storage capacities, and budgetary confines curtailed our scope. The limited scale of our study, confined to two neighborhoods in Quito, may not reflect the broader urban dynamics of other Latin American urban areas. The vulnerability and predominance of these kinds of places [
38] pose significant challenges. Yet, the increasing emergence of digital tools in planning practices demonstrates that urban planners and practitioners can efficiently make use of the technology [
35], including our presented methodology. This conceit further guides our future research prospects, aiming to dissect a still greater range of urban complexities.
5. Conclusions
In this paper, we addressed the challenge of data acquisition in two peripheral neighborhoods of Quito, Ecuador: La Bota and Toctiuco. Both neighborhoods share similar physical and demographic conditions, such as being surrounded by confining natural topographies—in the case of La Bota by gullies and in Toctiuco by mountain slopes—and similar economic profiles as low-income and peripheral areas. Despite their green space amenities, the quality and accessibility of UGS remains poor, an important limiting factor for urban health. Likewise, they share similar experiences with restricted access to public transportation and therefore connection to the urban center. Our decision to approach these specific neighborhoods is because one of the authors has worked with these communities as part of a community-design engagement research project since 2019, which has provided grounded insight and closer knowledge of the population and urban dynamics. Hence, the findings of this research can be used in future work when approaching similar urban areas, especially those in cities of Latin America.
We recognize the importance of public space access to healthy cities; studies of public spaces include social and cultural factors in order to determine how people use and occupy these spaces, and these aspects are highly valued, especially in informal and deprived neighborhoods of Latin America. To this end, this paper creates models to make visible physical information where access to open data is restricted, limited in availability, and/or not up to date. The proposed methodology for the collection of open data can also be used in combination with social and cultural methods in forthcoming research, which envisions its use in combination with machine learning and spatial data science models.
To this extent, we localize and analyze networks of UGS, public space, roads, and POIs as a physical urban infrastructure that gives information for reaching healthy city parameters. We developed a multi-source methodology to obtain as much information as possible from a combination of geographic data sources, which are then correlated with on-the-ground fieldwork. Our methodology utilizes open spatial data sources, including H3 geo-indexing, OpenStreetMap (OSM), and Microsoft Planetary Computer’s building footprint layer, and official sources like census data to propose a comprehensive approach for identifying places that could serve as healthy areas for these types of neighborhoods. Simultaneously, we conducted quality assurance work in sit, to validate the accuracy, reality, and coherence of the Google Places API and OSM road data. During these visits, we engaged with residents to gather firsthand insights on the neighborhood’s reality. We observed the current conditions of accessibility, how people interacted in public spaces, and economic activities developed in shops and sidewalks. These interactions enriched our understanding of the studied areas.
When considering the unique challenges faced in these contested urban contexts, we seek to develop more informed urban design strategies to address the specific needs of these communities by improving the existent infrastructure and network of UGS, roads, POIs, and public space, promoting accessibility, well-being, and social equity. However, it is important to keep in mind that reality can change rapidly and affect the data provided. It should be noted that this analysis is based on information collected at the time of the study, and it is possible that current data and conditions may differ due to possible changes and updates, as well as the way people use and occupy urban infrastructure.
In forthcoming research, we envision integrating additional data layers alongside the application of artificial intelligence and machine learning models. Utilizing machine learning algorithms, such as neural networks or decision trees, could provide deeper insights into urban (in)formality patterns and socio-economic dynamics for the application of urban health parameters. Our methodology, having systematically aggregated diverse, open-source data, sets a robust foundation for these AI-driven analyses. The foresight in data preparation and engineering carried out in this study significantly eases the implementation of advanced AI and machine learning models, essentially streamlining the data preprocessing phase, which is often a time-consuming process in AI model deployment. This approach, enriched further by AI-driven insights, nurtures a more inclusive urban development paradigm, showcasing the potential to fundamentally transform urban planning practice.
This research establishes a methodology that can be further developed in several ways related to advanced models for urban studies in low-income and peripheral neighborhoods of Global Southern cities. Utilizing the comprehensive datasets from this study and spatial analysis with machine learning techniques, this methodology may provide deeper insights into the physical urban infrastructure of public space. This research can generate interactive visualizations that could democratize data access, and an open data platform could broaden the impact of this work by enabling independent analyses and applications. Lastly, comparative studies could be conducted to identify factors contributing to urban health across different cities or regions, providing valuable insights for urban planning, design, and management.


