


The Effect of Clearing Diseased Wood on the Soil’s Physicochemical Properties in Black Pine Forests


1
College of Geography and Environment, Shandong Normal University, Jinan 250358, China
2
School of Economics and Management, Zhejiang Sci-Tech University, Hangzhou 310018, China
*
Author to whom correspondence should be addressed.
Sustainability 2023, 15(22), 15980; https://0-doi-org.brum.beds.ac.uk/10.3390/su152215980
Submission received: 20 September 2023
/
Revised: 22 October 2023
/
Accepted: 14 November 2023
/
Published: 15 November 2023
(This article belongs to the Special Issue Sustainable Forest Management and Natural Hazards Prevention)
Abstract
:Clearing diseased wood is a common measure used to reduce the continued spread of pine wilt disease and prevent infecting other pines. However, the impact of clearing diseased wood on the physicochemical properties of the soil is still unclear. To elucidate this matter, we conducted a series of soil experiments and observations in Changdao, mainly focused on uncut black pine, cut black pine, and the inter-forest zone. The results showed the following. (1) The soil beneath the forest underwent a transition towards the characteristics of forest and grassland after clearing diseased wood, which indicated a potential shift in the ecosystem’s structure and function. (2) Clearing diseased wood led to an increase in the soil pH of 0.15, indicating that it facilitated the recovery of acidic soil. (3) The clearing of diseased wood can coarsen the soil’s texture. Moreover, it effectively reduced the surface soil temperature (0–20 cm) in summer by 1.52 °C, as well as significantly decreasing the surface (0–20 cm) soil moisture in spring and summer by 1.3% and 2.43%, respectively. (4) Clearing diseased wood clearing can effectively modify the content of essential nutrients in the soil. It reduced the available nitrogen by 26.86 mg·kg−1, increased the available phosphorus by 0.57 mg·kg−1, and decreased the available potassium by 1.68 mg·kg−1. Meanwhile, clearing diseased wood exacerbated soil salinization and increased the soil’s salt content by 0.70 g·kg−1. The findings of this study provide scientific solutions for the sustainable ecological development of black pine forests in Changdao.
1. Introduction
Pine wilt disease (PWD) is an epidemic caused by Bursaphelenchus xylophilus [1]. This disease occurs when large numbers of B. xylophilus multiply and parasitize black pine trees, and it spreads to surrounding trees through Monochamus salternatus and other insects [2,3]. These damage the cellular tissue surrounding the resin ducts of the pine trees, hindering the transport of water and nutrients, which ultimately leads to drought-induced mortality in black pine trees [4]. PWD occurs in multiple countries of the world, but it is especially severe in Japan, South Korea, and China in Asia, with strong diffusion and destructiveness [3,4,5,6,7]. Various countries and regions have exhibited multiple strategies for addressing and mitigating this issue, which can be roughly summarized into three aspects: controlling pine wood nematodes (PWN), controlling the vector insects, and improving the pines’ resistance. These strategies mainly include physical, chemical, and biological control. Specific measures include monitoring by remote sensing, introducing natural enemies, controlling the pines’ density, removing infected wood, and spraying chemical insecticides for PWN [8,9]. Among them, the removal of infected wood is the most common measure and is one of the reasons for deforestation [10]. Black pines affected by or dead from PWD are cut down and incinerated to reduce the continued spread of PWD and to prevent the infection of other black pines [3,8].
However, pine forests also play a crucial role in conserving water sources and regulating the climate. Additionally, forests also allow for the accumulation of phenolic acids and other active substances [11]. Therefore, forest degradation and deforestation can significantly alter the physical, chemical, and biological characteristics of the soil, including the soil’s quality and vegetation types [12,13]. Studies have shown that after the logging of poplar plantations, soil bulk density and pH decrease significantly, while the total nitrogen, phosphorus, and potassium content in the soil increase significantly. And the nitrogen content in the field also decreases [13]. Generally, deforestation has no impact on the total organic carbon (TOC) of the soil, but it increases the fragility of the soil’s structure [14,15]. In other words, the land’s features undergo irreversible changes [16,17,18]. Meanwhile, deforestation not only alters the physical, chemical, and biological characteristics of the soil but also reduces their interrelationships [19,20,21]. Additionally, deforestation changes the thickness of the litter [22,23]. This is because after deforestation, the canopy stops shedding leaves, and the lower layer of dead branches and fallen leaves stops accumulating. However, the decomposition of the litter continues with the help of soil organisms and microorganisms, causing the forest floor to become thinner after deforestation. Conversely, the forest floor in an unlogged area is thicker compared with the logged area [22,23]. Therefore, several studies have also suggested that the decomposition or coverage of dead branches, leaf litter, and the amount of grass and shrub cover have an impact on the soil’s physicochemical properties such as soil temperature, moisture, nutrients, pH, etc. [24]. For example, soil pH decreases with the quantity of litter [25,26]. The concentration of nutrients such as nitrogen (N) in the litter removal plots was lower than that in control plots [27,28,29,30]. In addition, forest litter plays a role in heat preservation and water retention [31,32,33]. The average soil temperature of untreated litter is 0.58 °C higher than that of normally treated litter [34]. Additionally, the presence of the layer of dead branches and leaves also reduces the intensity of soil water evaporation [35,36,37]. Therefore, the clearing of diseased wood could directly or indirectly affect the physicochemical properties of forest soil, coupled with reduced debris.
Current research on PWD mainly focuses on the patterns of occurrence, mechanism, and the monitoring and control of PWN [38,39]. Although the removal of infected wood directly cuts off the aboveground parts of the pine trees, few scholars have studied the changes in the soil’s physicochemical properties brought about by the cleaning of diseased wood, such as soil pH, salinity, nutrients, temperature, moisture, and texture under pine forests. Therefore, we conducted a study in a black pine forest to explore the differences in the soil’s physicochemical properties before and after the removal of infected wood. This research aimed to enhance our understanding of how clearing diseased wood affects the soil’s physicochemical properties, and to provide scientific basis for the management and restoration of diseased pine forests.
2. Materials and Methods
2.1. Study Area
Changdao (37.92° N, 120.73° E) is located in the northernmost part of Shandong Province. It consists of 151 islands strung across the Bohai Strait. It has a warm temperate monsoon climate with an average annual temperature of 11.0–12.0 °C and an average annual precipitation of 537 mm. The most important soil types in the black pine forests are brown soil (57.2%), cinnamon soils (41.8%), and some fluvo–aquic soils (1%) [40]. Vegetation on the islands primarily consists of Pinus thunbergii, Platycladus orientalis, and P. densiflora forests, resulting in vegetation coverage of 72.6%. P. thunbergii, also known as black pine, is an important component of Changdao’s forest ecosystem. The majority of black pines on Changdao were planted by humans in the 1960s, making it an artificial black pine forest. Additionally, these pine trees are coeval [40]. According to field investigations in the black pine forests of Changdao, the main cause of death in black pines is PWD [41,42,43]. In the early 1990s, Changdao became the earliest and only endemic area of PWD in North China [6]. With climate change, particularly the increase in temperature, the environmental conditions on Changdao are becoming more and more conducive to the spread of PWD [2,44].
2.2. Experimental Manipulation and Design
2.2.1. Sample Design
In this study, 8–10 uncut black pines (U-BP), 8–10 cut black pines (C-BP), and 8–10 inter-forest zones (IF-Z) were selected as the soil sampling points in the black pine forest of Changdao in July, with three replicates per sample. These three types of soil sample were analyzed to determinate the soil’s physicochemical properties such as soil pH, available nutrients (nitrogen, potassium, and phosphorus), salinity, and texture (clay, silt, and sand).
2.2.2. Meteorological Observation
To enable long-term monitoring of soil moisture and the temperature in Changdao black pine forest during the growing season (March to October), a micro-meteorological monitoring station was established in areas where black pine forests were widely distributed. We selected representative U-BP and C-BP trees in terms of height, size, and growth as the research objects. Soil moisture and temperature sensors were buried at depths of 10 cm and 50 cm below the soil surface to monitor the moisture and temperature of the surface soil (0–20 cm) and deep soil (40–60 cm).
2.2.3. The Soil’s Physicochemical Properties
(1) Soil pH: After drying the soil samples, 5 g of soil that passed through a 1 mm sieve was weighed into a centrifuge tube. Then 12.5 mL of ultrapure water was added to the tube. The centrifuge tube was tightly closed and shaken until the water and soil were thoroughly mixed. After the sample had rested for half an hour, a pH meter was used to measure the pH of the turbid liquid in the upper part of the tube and the results were recorded.
(2) Soil texture: An air-dried soil sample was placed in a 50 mL beaker, then 10 mL of a 10% hydrogen peroxide solution was added to remove organic matter from the soil sample. The beaker was heated in a water bath until no further bubbles were produced. Subsequently, 10 mL of a 10% hydrochloric acid solution was added and left to stand for 2 h to remove calcium from the soil sample. Distilled water was added to the beaker and left to stand for 12 h. The supernatant was then removed, and this washing process was repeated approximately four times until the solution became neutral, with the aim of removing excess acid. Thirty minutes before the sample was taken, 10 mL of 0.5 mol·L−1 sodium hexametaphosphate solution was added and shaken using an ultrasonic shaker. Finally, the percentage of sand, silt, and clay in the soil was determined using a laser particle size analyzer (Mastersizer 3000, Malvern Panalytical Inc., Westborough, MA, USA) [45,46]. The soil particle size distribution of the collected samples was divided into three categories: clay (≤2 μm), silt (2–50 μm), and sand (50–1000 μm). The volume content of each particle size was plotted on a graph, with particle size on the x-axis and volume content on the y-axis. This resulted in a particle size distribution map, from which the fractal dimension was calculated to determine the texture type of the soil [47,48,49]
where R is the particle size, Rn is the n-level particle in the particle size partition, V(r < Rn) is the percentage of the soil particle volume with a particle size less than Rn, Vn is the total volume percentage of all particle levels in the soil, and Rmax is the average maximum particle size of soil particles.
(3) Available nitrogen (A-N): Available nitrogen refers to the nitrogen that can be directly used for the growth of black pine. It was determined using the diffusion dish method [50,51]. The soil sample (2 g) was evenly spread in the outer chamber of the diffusion dish. Then a boric acid solution containing indicators (2 mL) was added to the inner chamber. The dish was covered with frosted glass, and a slit was exposed by rotating the dish. Next, 2 mL of 2 mol·L−1 NaOH solution was quickly added to the outer chamber of the dish, which was then tightly covered and fixed with a rubber band. The samples were incubated in an incubator at 40 °C for 24 h. After that, the dish was taken out, and the amount of ammonia absorbed by the boric acid solution in the dish was titrated with a 0.01 mol·L−1 HCl standard solution. The volume of the acid standard solution used was recorded, and blank titrations were performed and recorded along with the experimental results. The equation for calculating the available nitrogen is as follows
where c represents the concentration of the standard solution (mol·L−1), V represents the volume of the standard solution used in titration of the sample (mL), V0 represents the volume of the standard solution used in the blank titration (mL), 14.0 represents the molar mass of nitrogen atoms (g·mol−1), m represents the sample mass (g), and 103 represents the conversion factor.
(4) Available phosphorus (A-P): Available phosphorus refers to the phosphorus that can be directly used by P. thunbergii for growth. It was determined using an AA3 continuous flow analyzer. First, 2.5 g of an air-dried soil sample (after passing through a 1 mm sieve) was weighed into a 150 mL triangular flask. Then, 50 mL of 0.5 g·mol−1 NaHCO3 solution and 1 spoon of phosphorus-free activated carbon were added. The cork was tighten, and the flask was shaken for 30 min at a constant temperature of 25 °C on a shaker. Immediately afterwards, the mixture was filtered with phosphorus-free filter paper and measured using a continuous flow analyzer, and the experimental results were recorded [52].
where ρ represents the mass concentration measured by the instrument (µg·mL−1), V represents the fixed volume (mL), ts is the multiplier, m is the mass of air-dried soil, k is the coefficient for converting air-dried soil into dry soil mass, and 103 converts µg to mg.
(5) Available potassium (A-K): Soil-available potassium refers to the exchangeable potassium and water-soluble potassium in the soil which can be directly absorbed and utilized by crops. The determination of available potassium in this study was carried out using an atomic absorption spectrophotometer. To determine A-K, 5 g of air-dried soil samples that had been sieved with a 1 mm sieve was weighed into a 150 mL triangular flask. Then 50 mL of a 1 mol·L−1 ammonium acetate solution was added, and the flask was shaken for 30 min at a temperature of 15–25 °C. The mixture was filtered with qualitative filter paper, and the filtrate was measured using an atomic absorption spectrophotometer flame photometer. A blank test was performed simultaneously [50,52], and the experimental results were recorded.
where V represents the volume of the extractant in mL, and m represents the mass of the drying soil sample in g.
(6) Soil salinity: For this, 10 g of an air-dried soil sample, sieved through a 1 mm sieve, was placed into a 50 mL centrifuge tube. Then 50 mL of distilled water with the CO2 removed was added. The mixture was shaken well and centrifuged at a speed of 4000 r·min−1 for 8 min. After centrifugation, the supernatant was collected. 40 mL of the supernatant was pipetted and heated in a water bath until nearly dry. Then it was baked at 105 °C in an oven until a constant weight was achieved to calculate the total water-soluble salt content. The total amount of water-soluble salts ρ (g·kg−1) in the sample was calculated using the following formula [53,54]
where m represents the mass of the air-dried sample, measured in grams (g), with a test quantity of 50 g; m1 represents the drying mass of the evaporation dish and salt, measured in grams (g); m0 represents the drying mass of the evaporation dish, measured in grams (g); and D represents the fractional multiple, calculated as 250/20–50.
2.3. Data Analysis
Statistical analysis of soil pH, soil particle size, soil moisture, soil temperature, soil nutrients, soil salinity, and other data was performed using SPSS 24.0 (IBM Corporation, Armonk, NY, USA, 2016) and Origin 2023 (originLab Corporation, Northampton, MA, USA, 2023). This analysis used descriptive statistics, ANOVA, and principal component analysis (PCA). All statistical analyses were conducted at a 95% confidence level (p = 0.05). All figures in the text were produced using Origin 2023.
3. Results
3.1. Soil pH
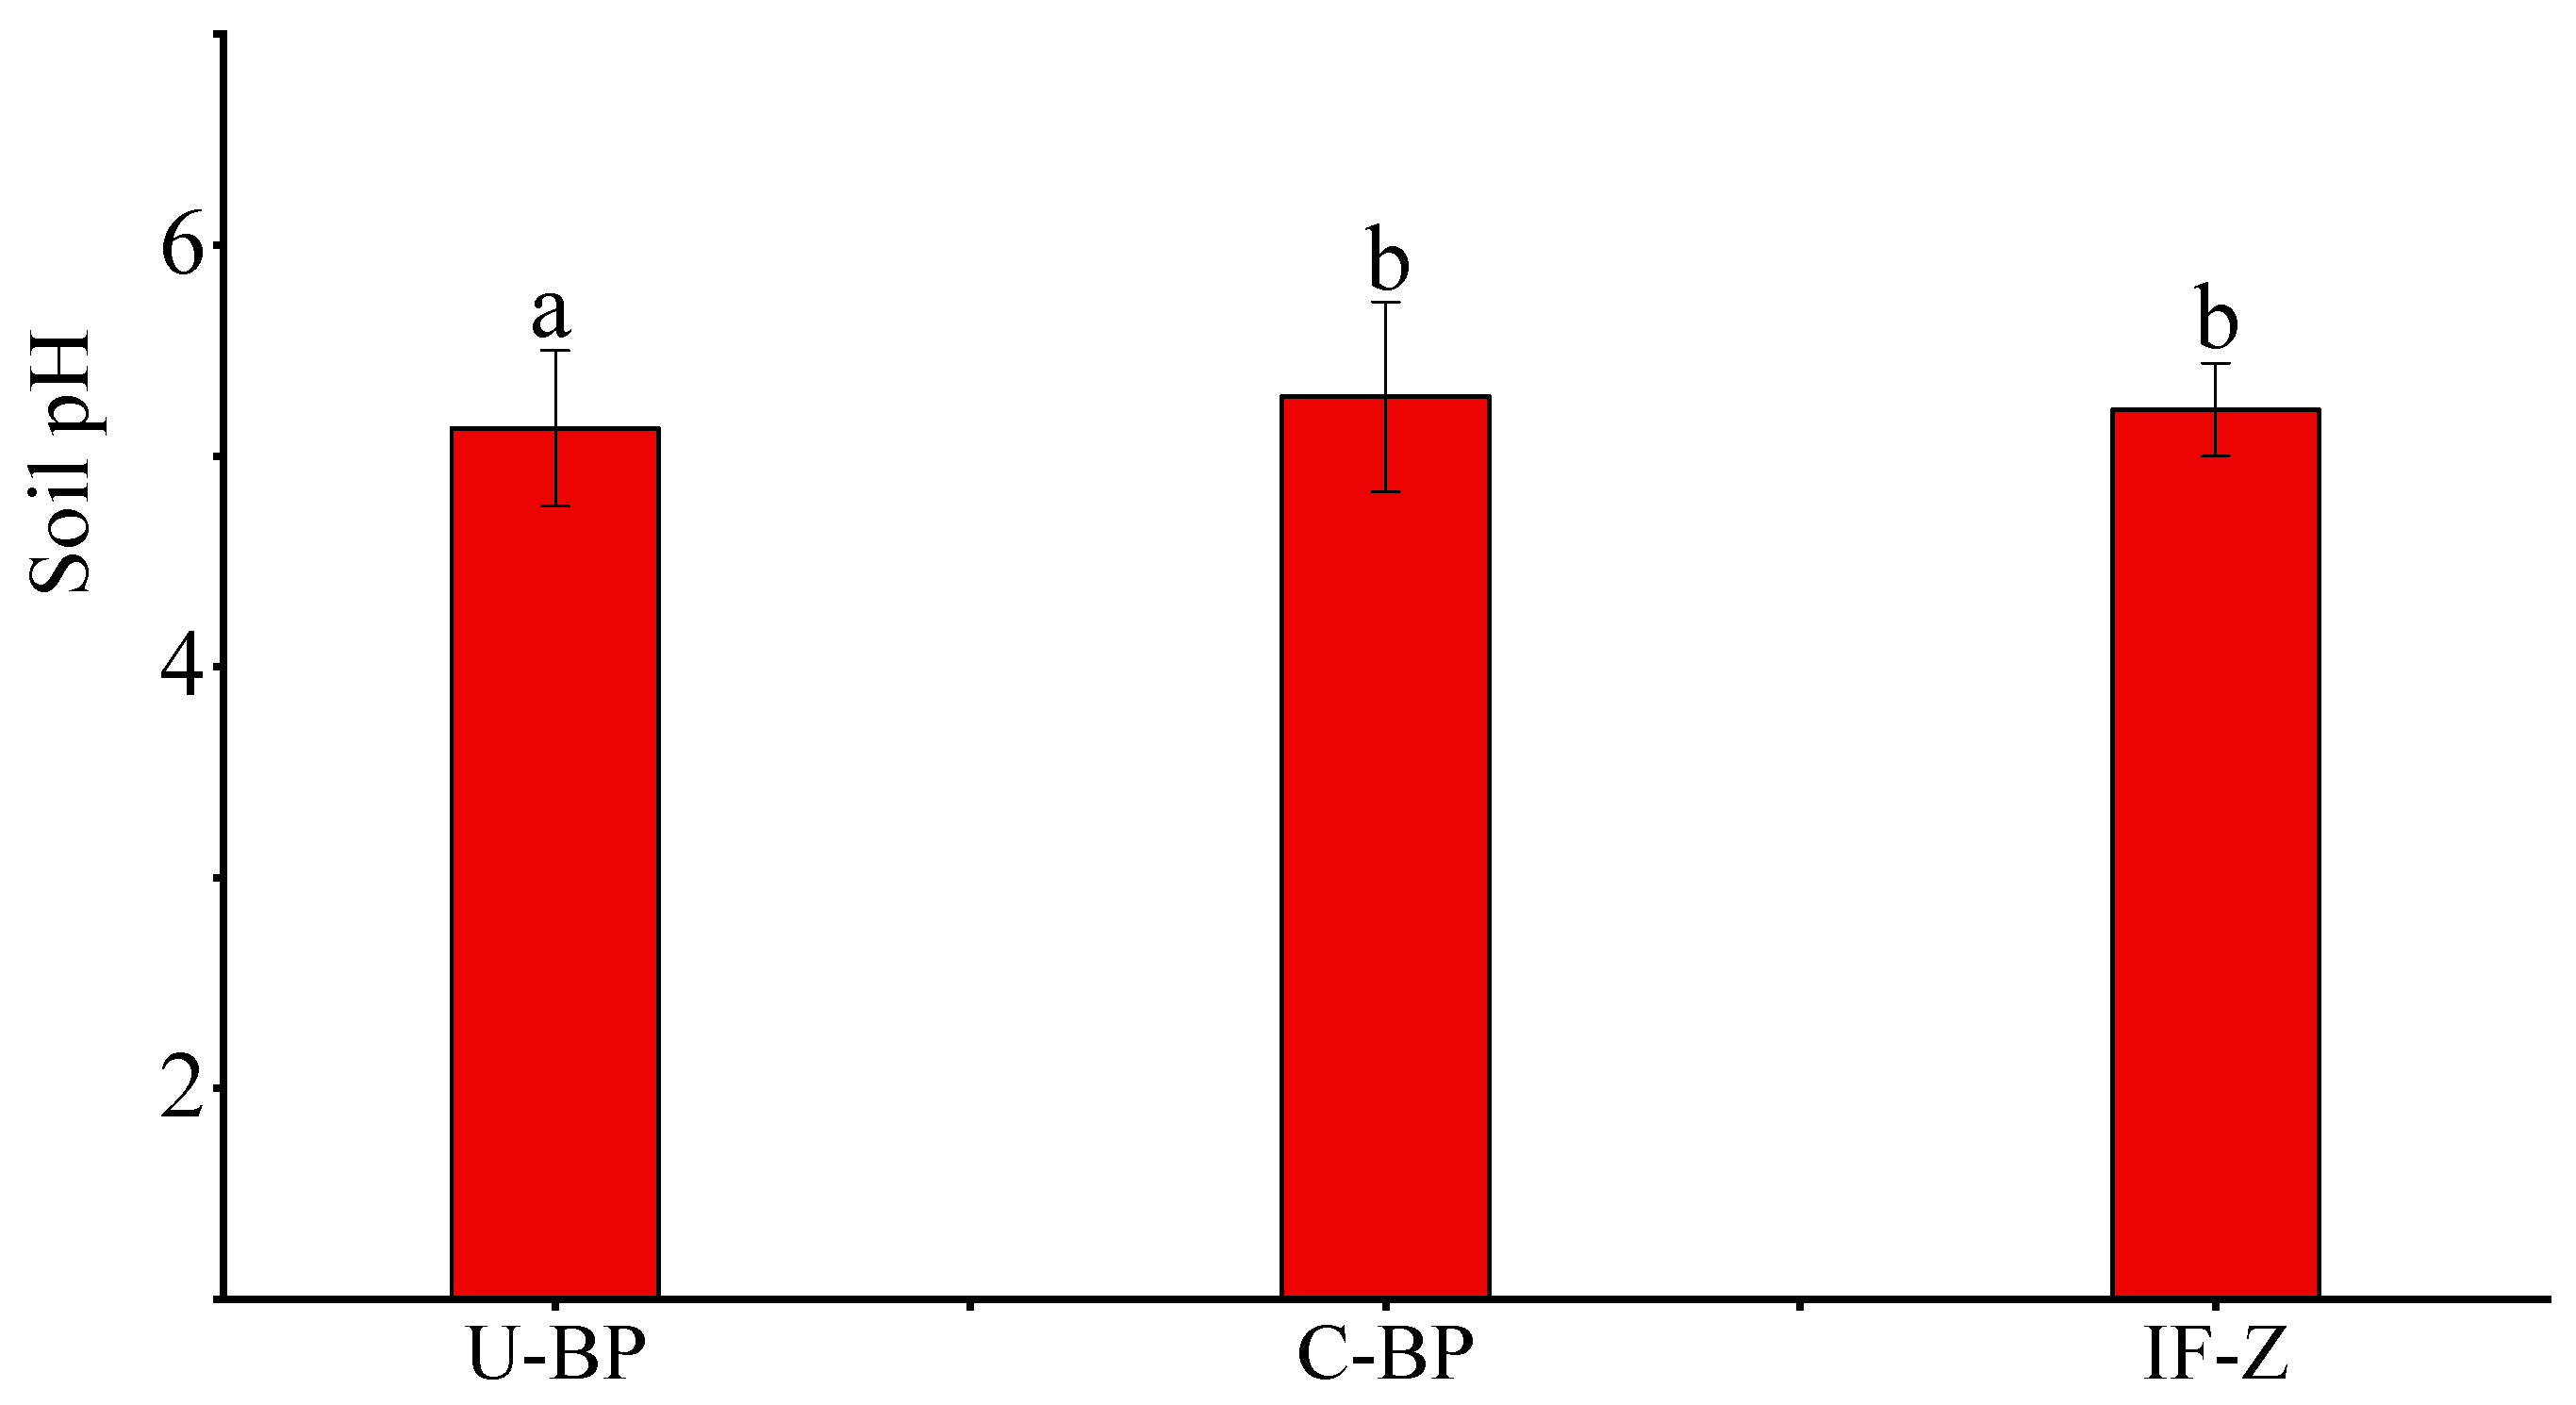
The determination of pH and the statistical results (Figure 1) showed that the soil pH under U-BP ranged from 4.41 to 6.05, and the average pH was 5.13 ± 0.37. The soil pH under C-BP ranged from 4.69 to 6.31, with an average pH of 5.28 ± 0.45, which was 0.15 different from U-BP. The average soil pH in grassy irrigated areas planted in non-black pine forest was approximately 5.24 ± 0.22. The results of ANOVA showed that there was no significant difference (p > 0.05) in soil pH between C-BP and IF-Z. These findings revealed the following: (1) Soil pH in black pine forests (BP) tended to be acidic, and (2) the soil pH of C-BP and IF-Z was similar, suggesting that the environmental conditions of these two areas may be similar.
3.2. Soil Particle Size Distribution and Fractal Dimension
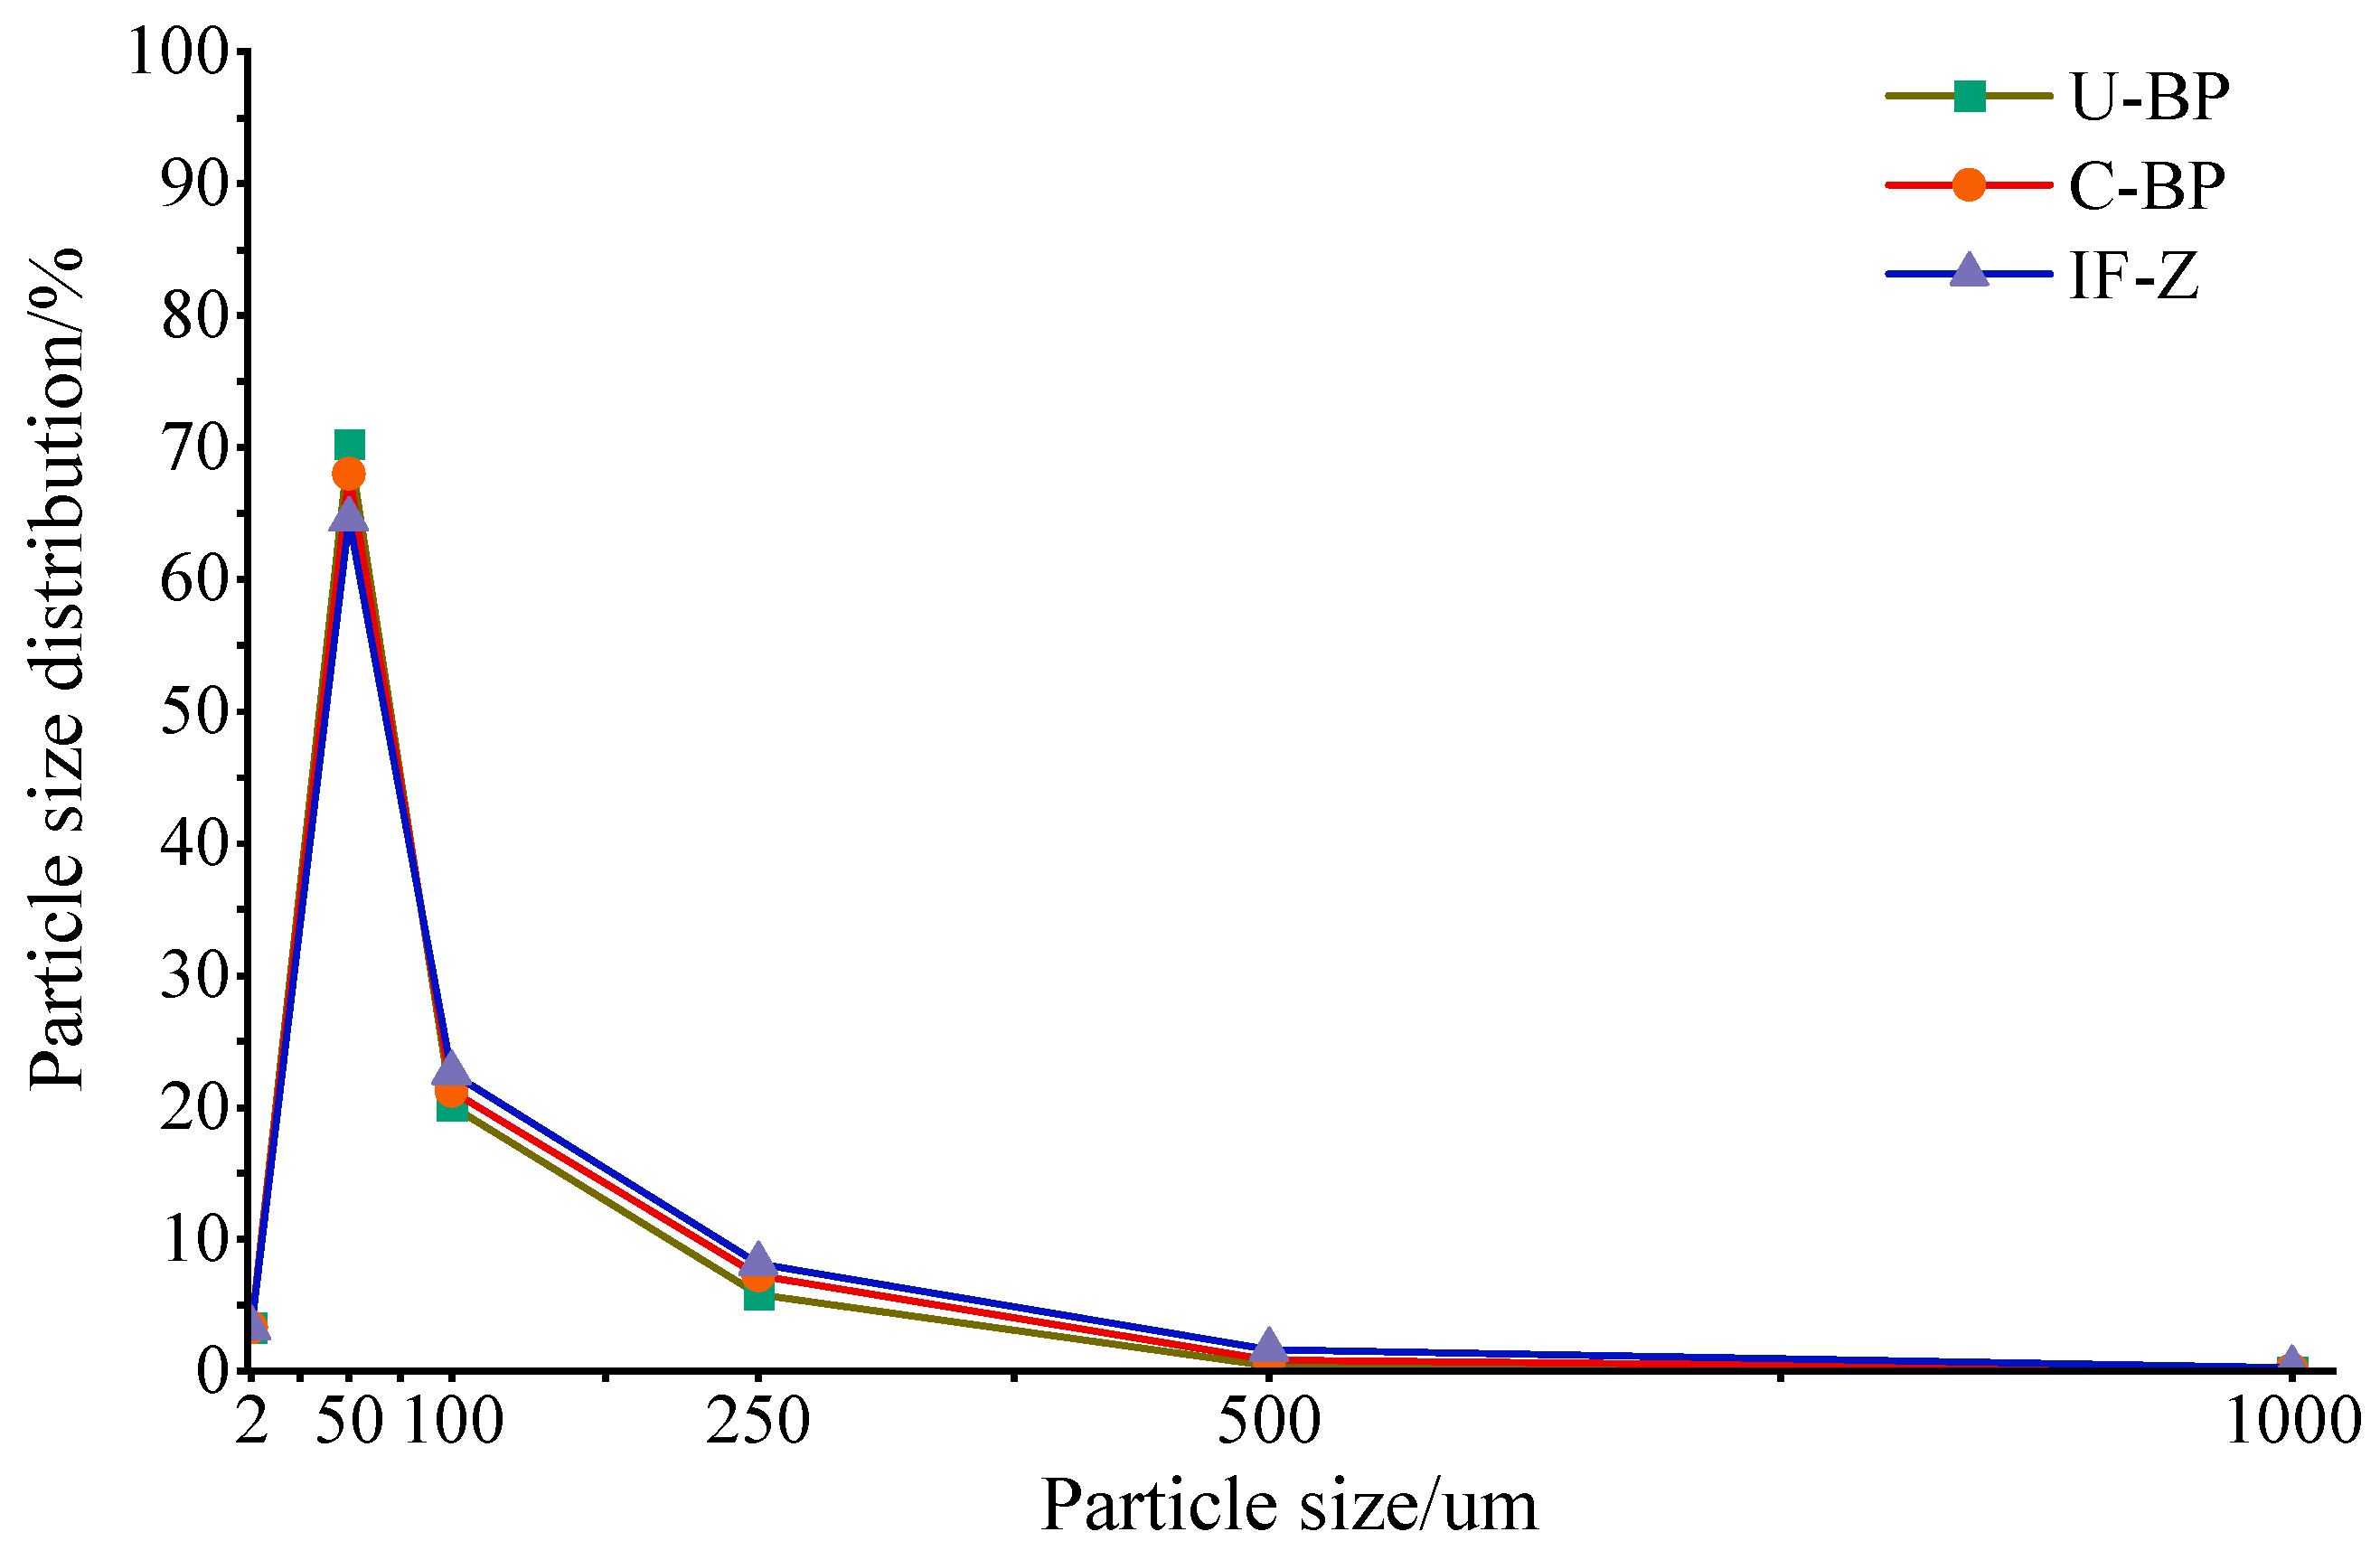
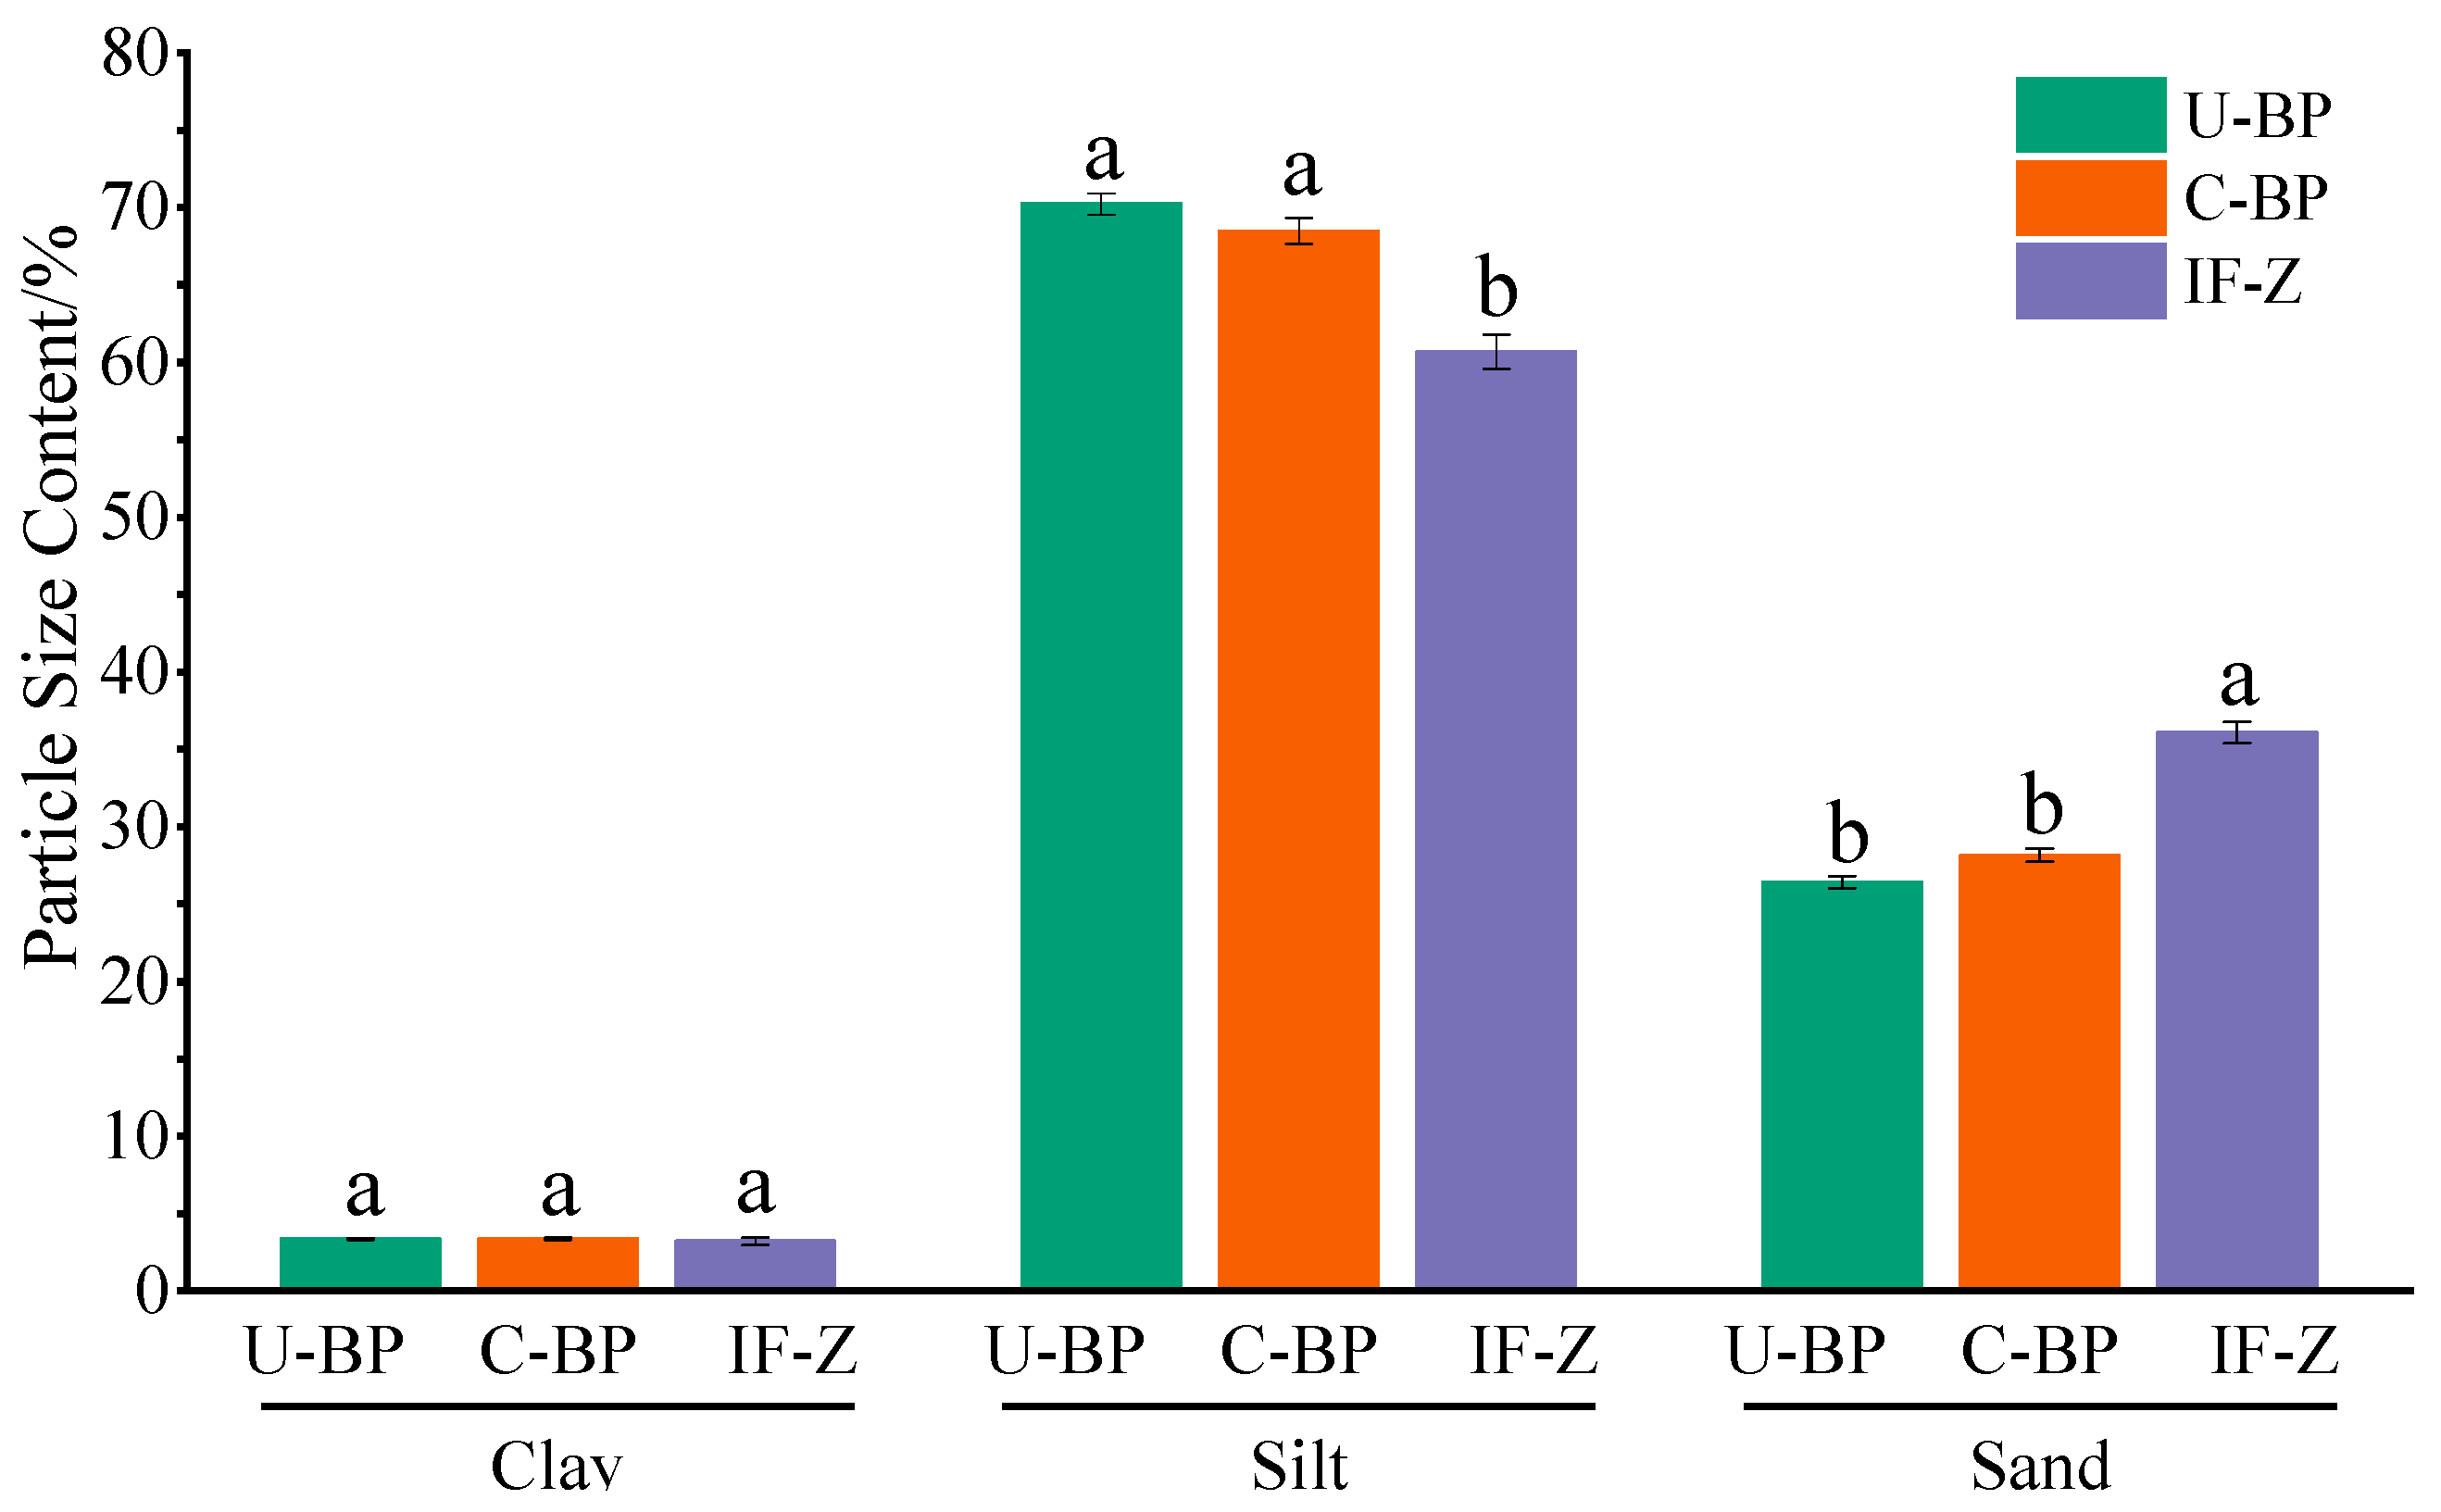
The content of clay under C-BP was greater than that of soil under U-BP and IF-Z. Additionally, the clay content under U-BP was higher than that of IF-Z (Figure 2 and Figure 3). However, there was no significant difference in clay content among the three environments (LSD, p > 0.05). The characteristics of the silt content differed from that of clay. The soil silt content of IF-Z was lower than that of U-BP and C-BP (Figure 2 and Figure 3). The characteristics of the sand content (including very fine, fine, medium, and coarse sand) revealed that the soil sand content under U-BP and C-BP was lower than that of IF-Z (Figure 2 and Figure 3). The ANOVA showed that there was no significant difference between the first two, but both were significantly lower than the soil silt content of IF-Z. This trend was opposite to the characteristics of clay and silt.
According to the soil texture triangle, the soil texture type under U-BP was loamy sand, while the soil texture type under C-BP was similar to that of IF-Z, both classified as sandy loam. The difference lay in the higher silt content of sandy loam soil compared with loamy sandy soil, and the lower sand content, suggesting that the planting of P. thunbergii might affect the type of soil texture in the local environment. The fractal dimension of the soil particle size distribution under U-BP, C-BP, and IF-Z revealed that the fractal dimension under IF-Z was greater than that under C-BP, which, in turn, was greater than that under U-BP (Table 1). These findings were opposite to the characteristics of clay and silt content but were consistent with the characteristics of the sand content, which was recognized. The fractal dimension was directly proportional to the content of clay or silt, and inversely proportional to the content of sand. This implies that the fractal dimensions of the U-BP, C-BP, and IF-Z plots did not accurately reflect the soil’s characteristics.
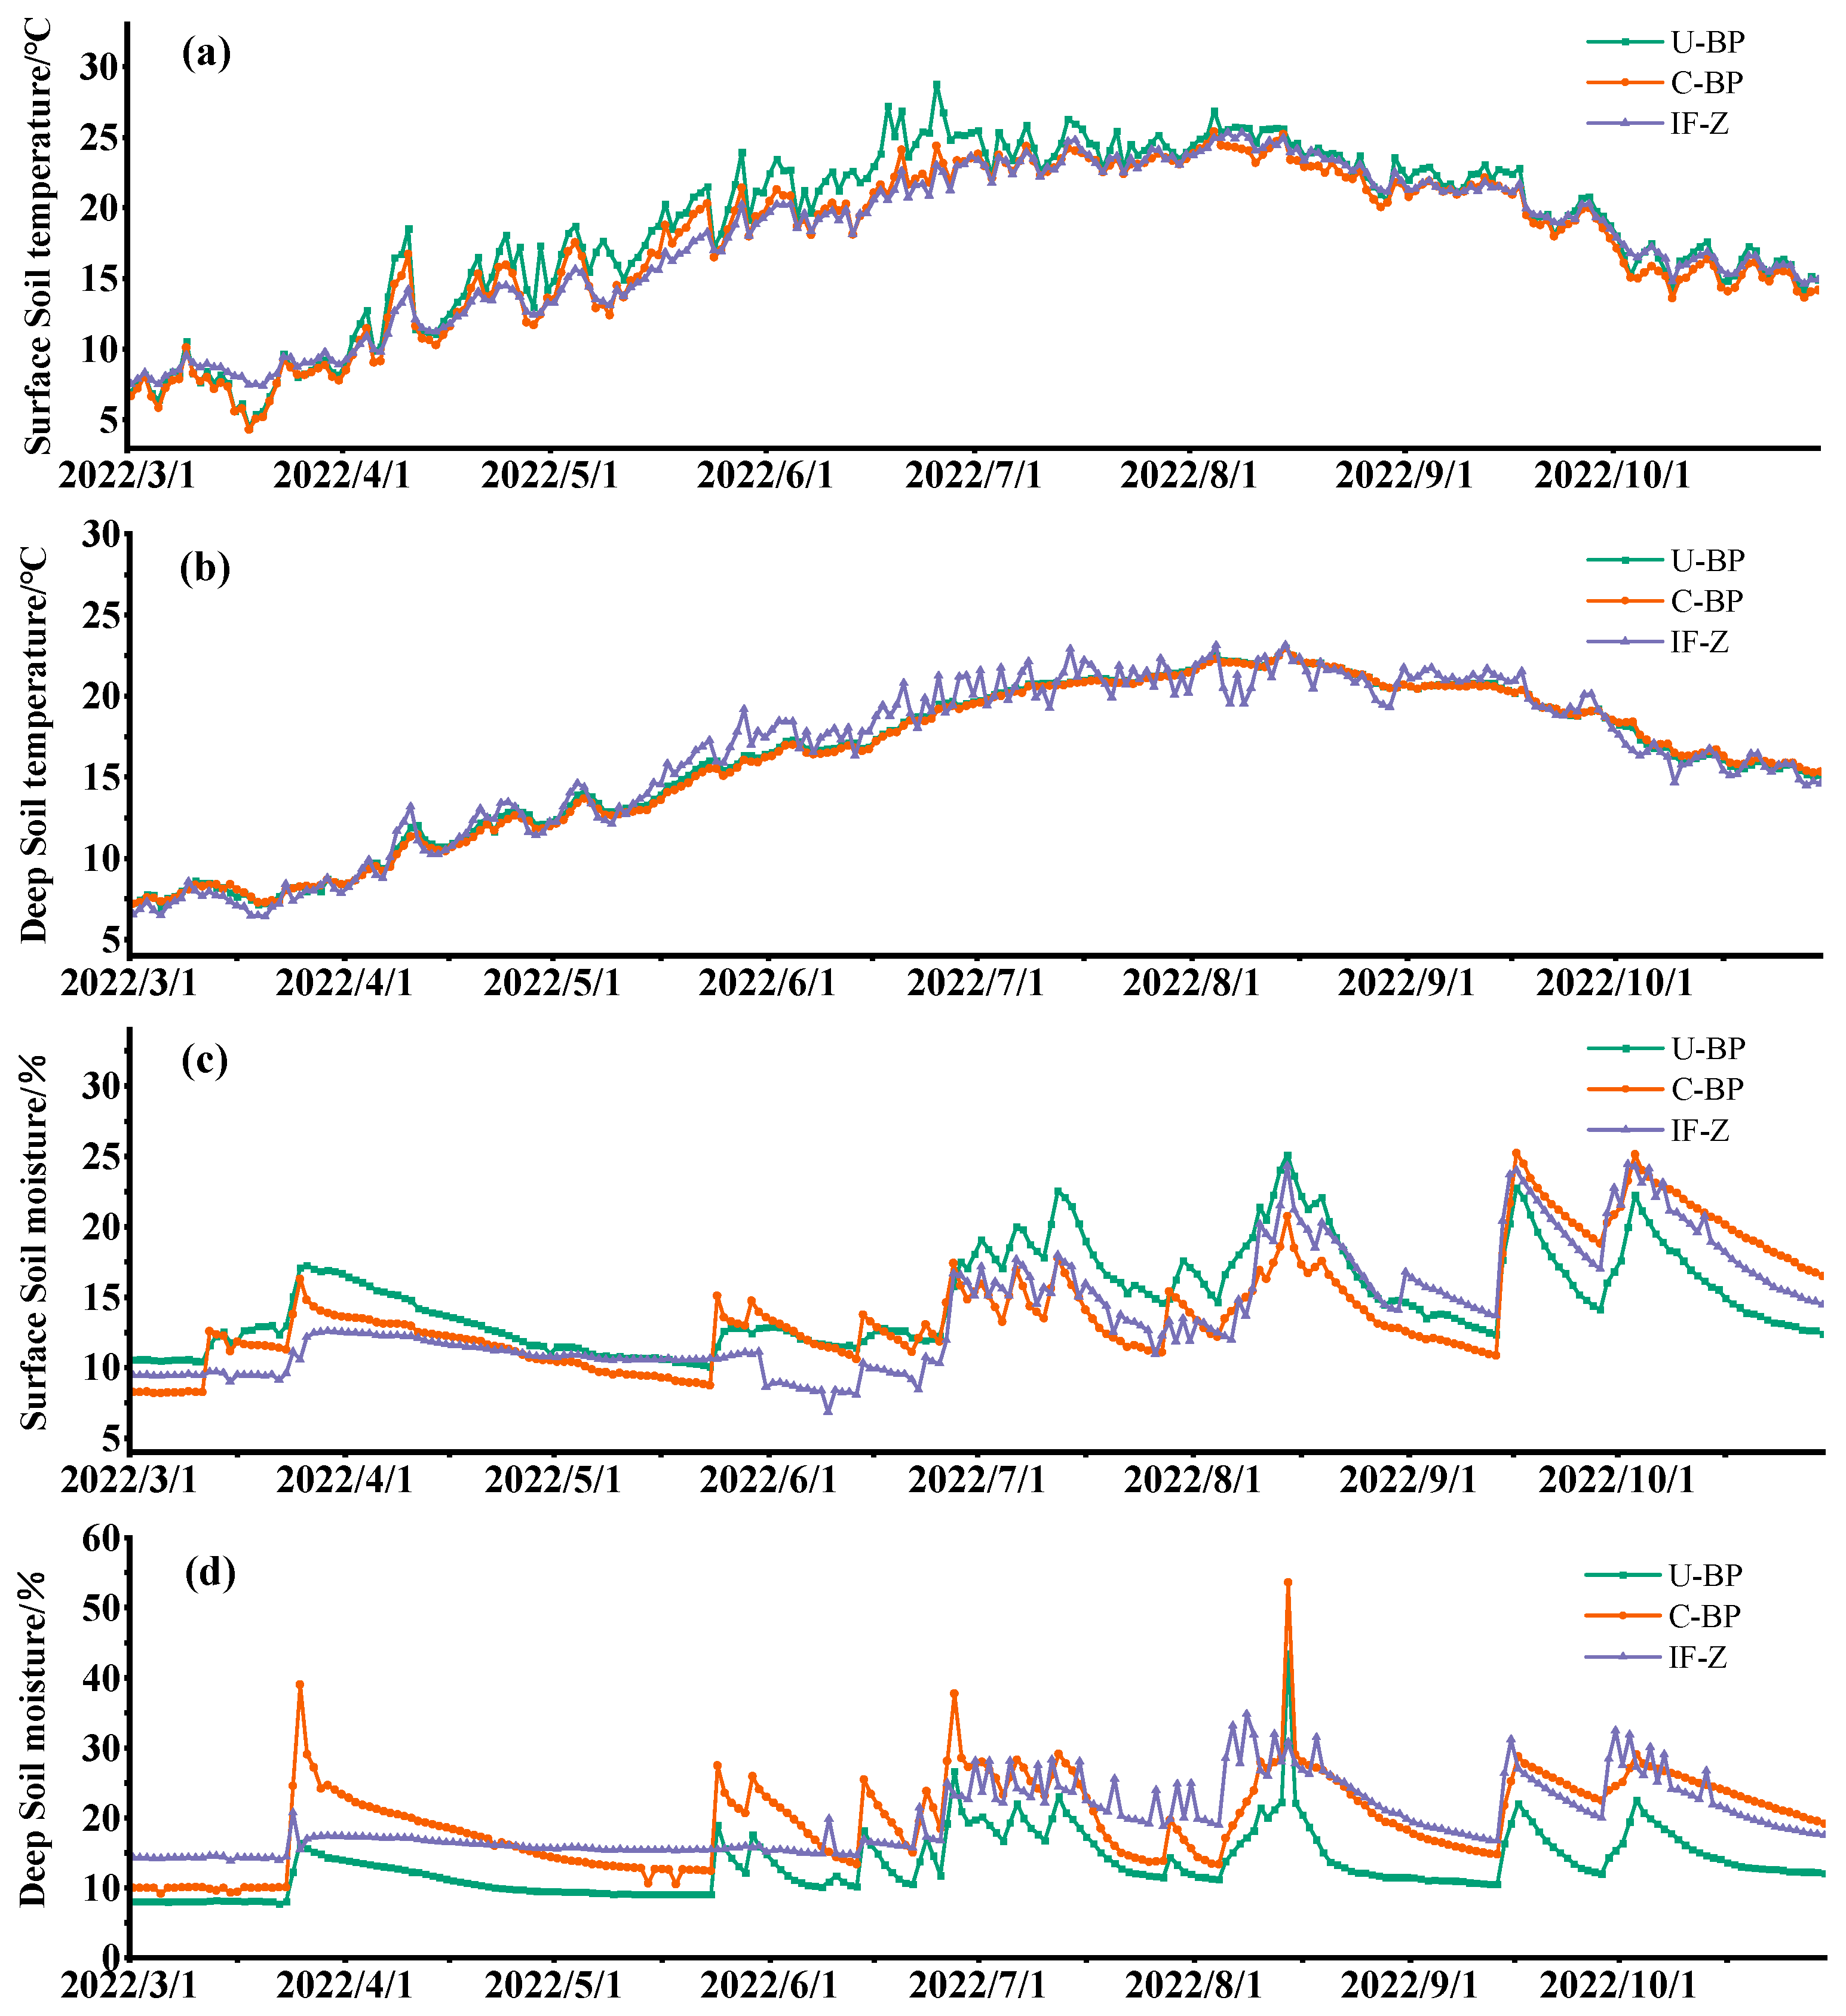
3.3. Dynamics of Soil Temperature
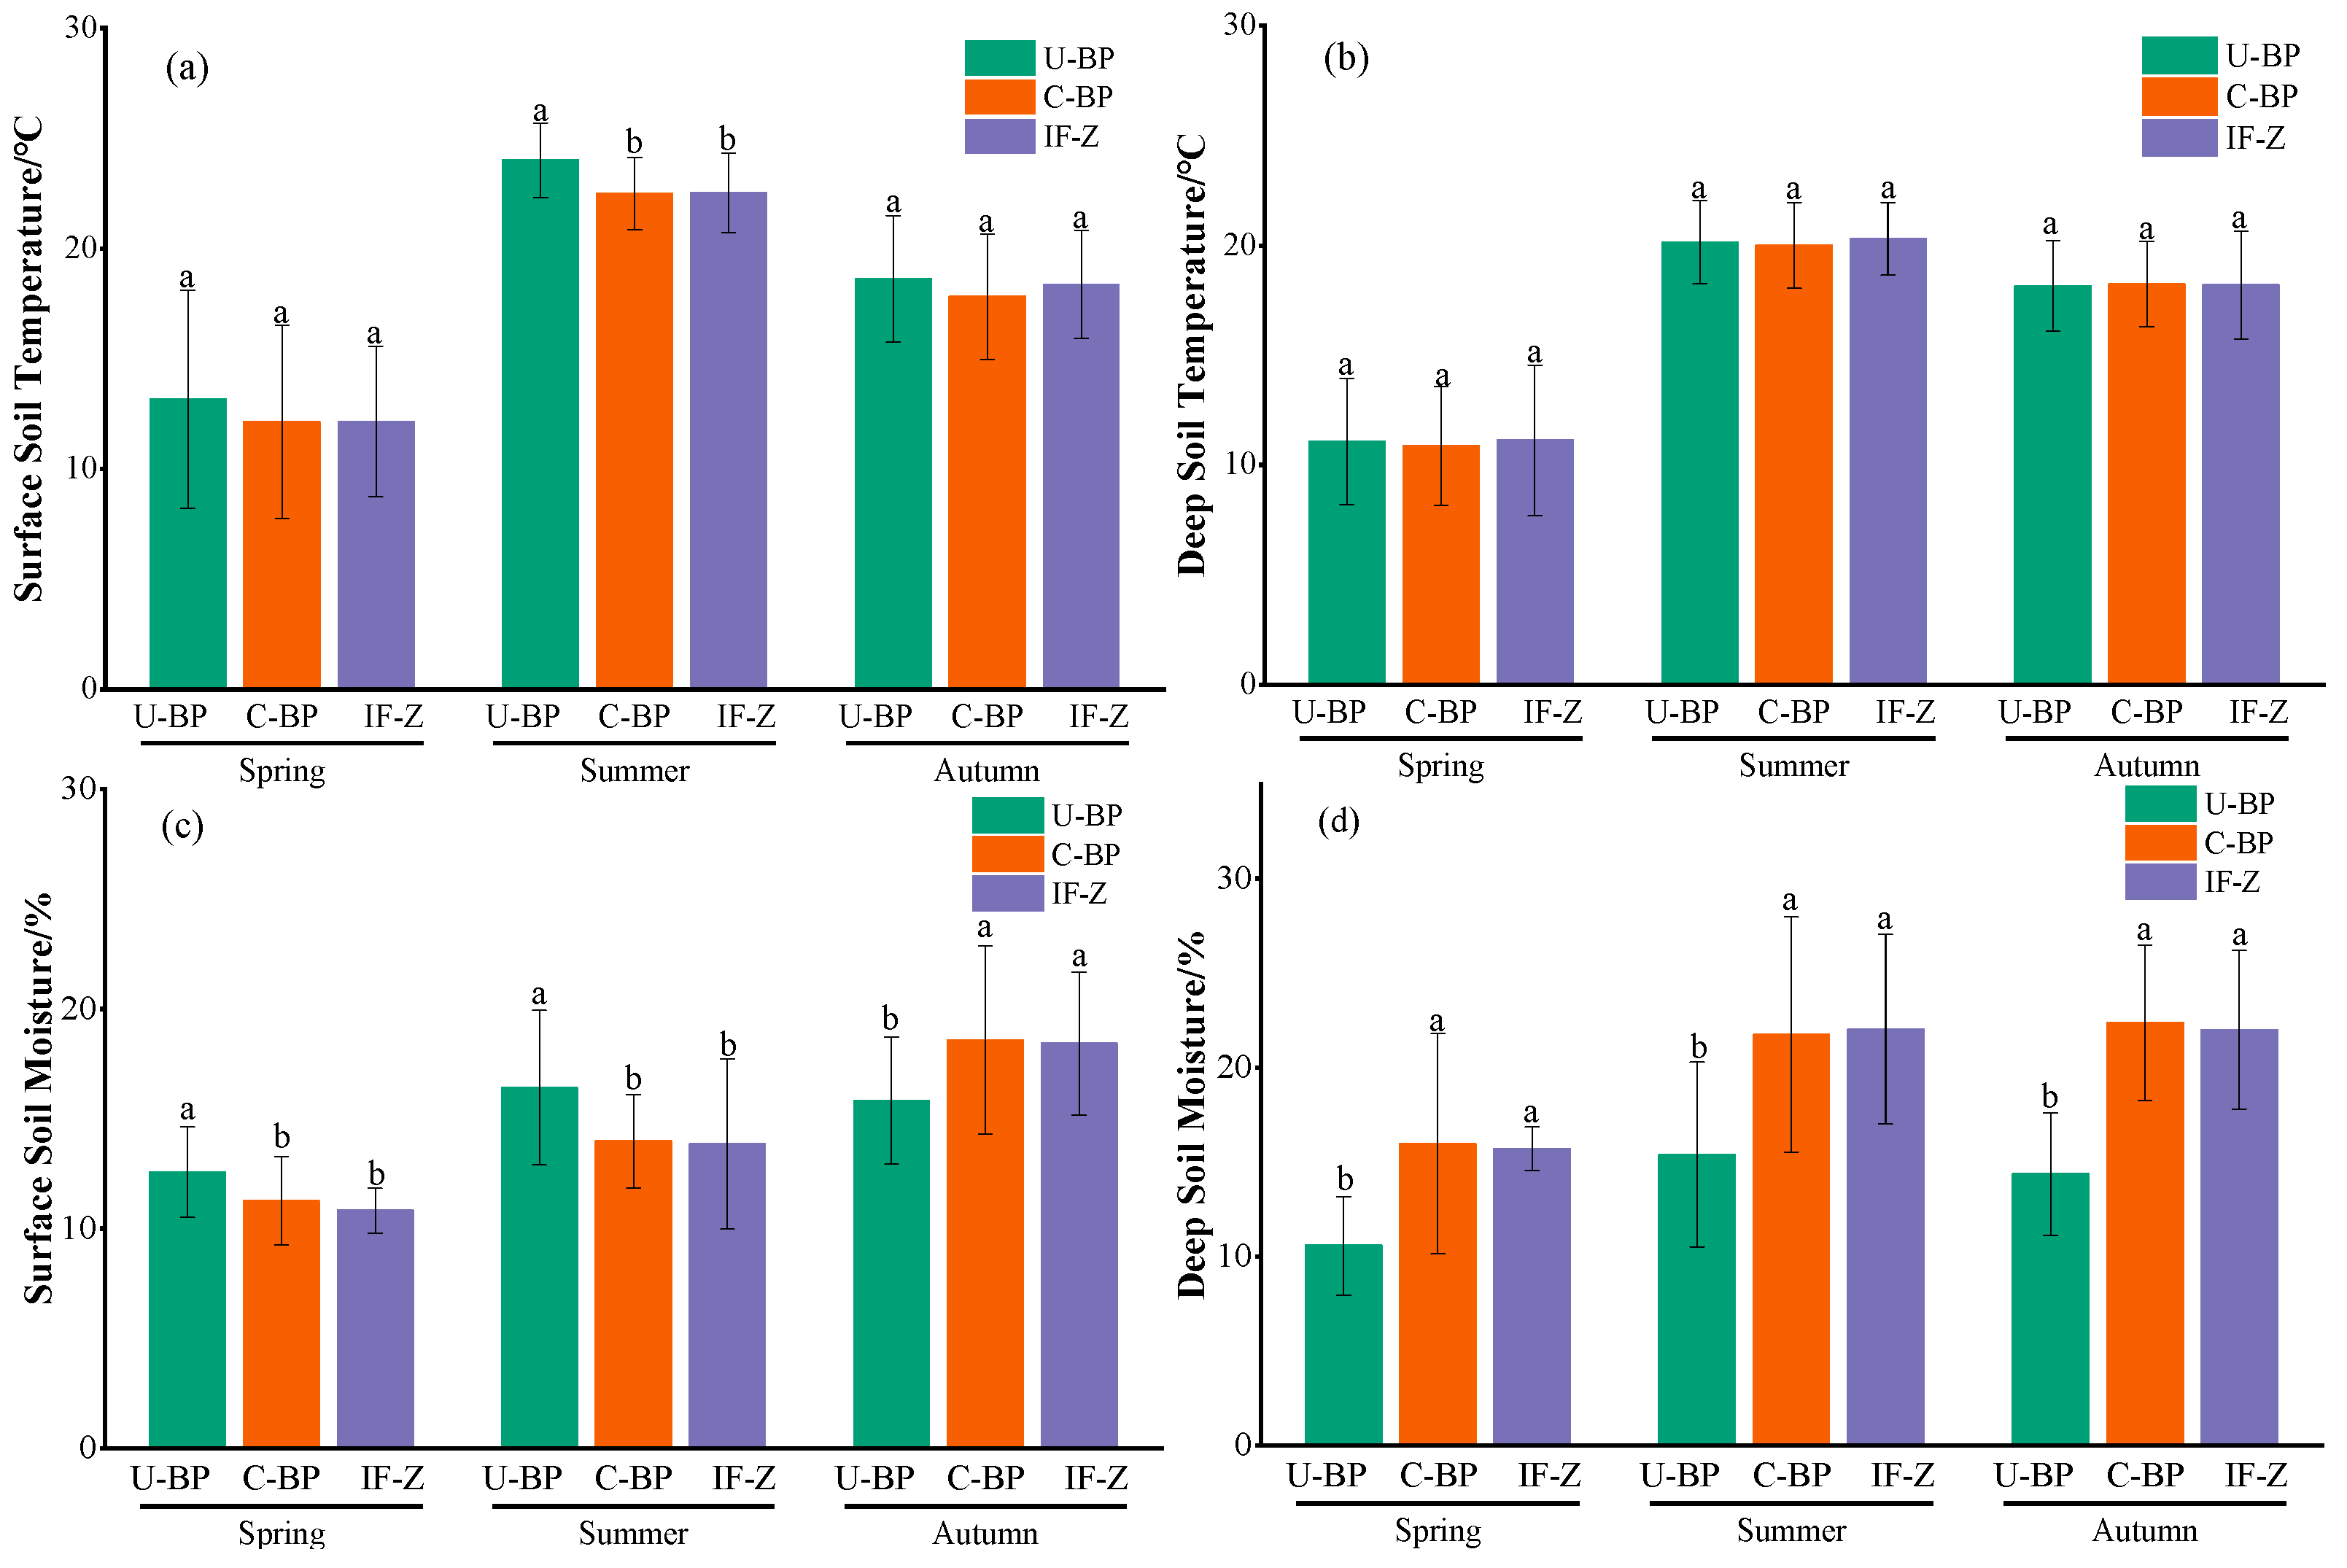
Monitoring the dynamics of temperature from March to October using the micro-weather station revealed that the surface and shallow soil temperatures under U-BP, C-BP, and IF-Z were highest in July and August, and lowest in March (Figure 4a,b). When we divided the entire growing season into different seasons (Figure 5a), the surface soil temperatures at 0–20 cm under U-BP in spring, summer, and autumn were 13.17 ± 4.94, 24.01 ± 1.69, and 18.63 ± 2.88 °C, respectively. The surface soil temperatures under C-BP in spring, summer, and autumn were 12.12 ± 4.38, 22.49 ± 1.64, and 17.82 ± 2.85 °C, respectively. The soil temperatures in IF-Z in spring, summer, and autumn were 12.15 ± 3.41, 22.53 ± 1.81, and 18.37 ± 2.46 °C, respectively. It can be observed that during spring, the soil temperature was ranked as U-BP > IF-Z > C-BP. This pattern remained consistent in summer and autumn. Additionally, the ANOVA results showed no significant difference in soil temperature between U-BP, C-BP, and IF-Z during spring and autumn. However, in summer, the soil temperature of U-BP was significantly higher than that of C-BP and IF-Z by 1.52 and 1.48 °C, respectively, while there was no significant difference in soil temperature between C-BP and IF-Z.
Similarly, for the deep soil layer at 40–60 cm (Figure 5b), the soil temperatures of U-BP in spring, summer, and autumn were 11.08 ± 2.88, 20.14 ± 1.90, and 18.15 ± 2.06 °C, respectively. The soil temperatures of C-BP in spring, summer, and autumn were 10.87 ± 2.72, 20.00 ± 1.95, and 18.23 ± 1.94 °C, respectively. The soil temperatures of IF-Z in spring, summer, and autumn were 11.13 ± 3.42, 20.30 ± 1.65, and 18.19 ± 2.46 °C, respectively. It can be seen that in spring and summer, the soil temperature was ranked as IF-Z > U-BP > C-BP. However, in autumn, the patterns of deep soil temperature differed from the patterns of shallow soil temperatures, with C-BP > IF-Z > U-BP. Similarly, the results of ANOVA showed no significant difference in the deep soil temperature among U-BP, C-BP, and IF-Z during spring, summer, and autumn.
3.4. Dynamics of Soil Moisture
The results of monitoring the dynamics of water from March to October using the micro-weather stations showed that the maximum soil moisture content under U-BP, C-BP, and IF-Z occurred from August to September, while the lowest values were observed in March (Figure 4c,d). When we divided the entire growing season into different seasons (Figure 5c), the soil moisture content in the surface soil layer of 0–20 cm under U-BP in spring, summer, and autumn was 12.56 ± 2.05%, 16.40 ± 3.52%, and 15.82 ± 2.89%, respectively. The soil moisture content under C-BP in spring, summer, and autumn was 11.26 ± 2.02%, 13.97 ± 2.13%, and 18.57 ± 4.28%, respectively. The soil moisture content under IF-Z was 10.81 ± 1.02%, 13.83 ± 3.88%, and 18.41 ± 3.26%, respectively. It can be observed that in spring and summer, the soil moisture content was ranked as U-BP > C-BP > IF-Z, while in autumn, the soil moisture content was ranked as C-BP > IF-Z > U-BP. Additionally, the results of ANOVA showed that the shallow soil moisture of U-BP was significantly higher than that of C-BP and IF-Z in spring by 1.3% and 1.75%, respectively, and in summer by 2.43% and 2.57%, respectively, while there was no significant difference in soil moisture between C-BP and IF-Z. In autumn, the shallow soil moisture of U-BP was significantly lower than that of C-BP and IF-Z by 2.75% and 2.59%, respectively, and there was no significant difference in soil moisture between C-BP and IF-Z.
Similarly, for the deep soil at 40–60 cm (Figure 5d), the soil moisture content of U-BP in spring, summer, and autumn was 10.56 ± 2.61%, 15.39 ± 4.88%, and 14.36 ± 3.25%, respectively. The soil moisture content of C-BP in spring, summer, and autumn was 15.95 ± 5.83%, 21.74 ± 6.22%, and 22.35 ± 4.10%, respectively. The soil moisture content of IF-Z was 15.69 ± 1.15%, 22.01 ± 5.02%, and 21.98 ± 4.19%, respectively. It can be seen that in spring and autumn, the deep soil moisture content was ranked as C-BP > IF-Z > U-BP, while in summer, the deep soil moisture content was ranked as IF-Z > C-BP > U-BP, which differed from the spatial pattern observed in the shallow soil moisture content. The results of ANOVA showed that the deep soil moisture of U-BP was significantly lower than that of C-BP and IF-Z in spring by 5.39% and 5.13%, in summer by 6.35% and 6.62%, and in autumn by 7.99% and 7.62%, respectively, while there was no significant difference in soil moisture between C-BP and IF-Z.
3.5. Soil Nutrients
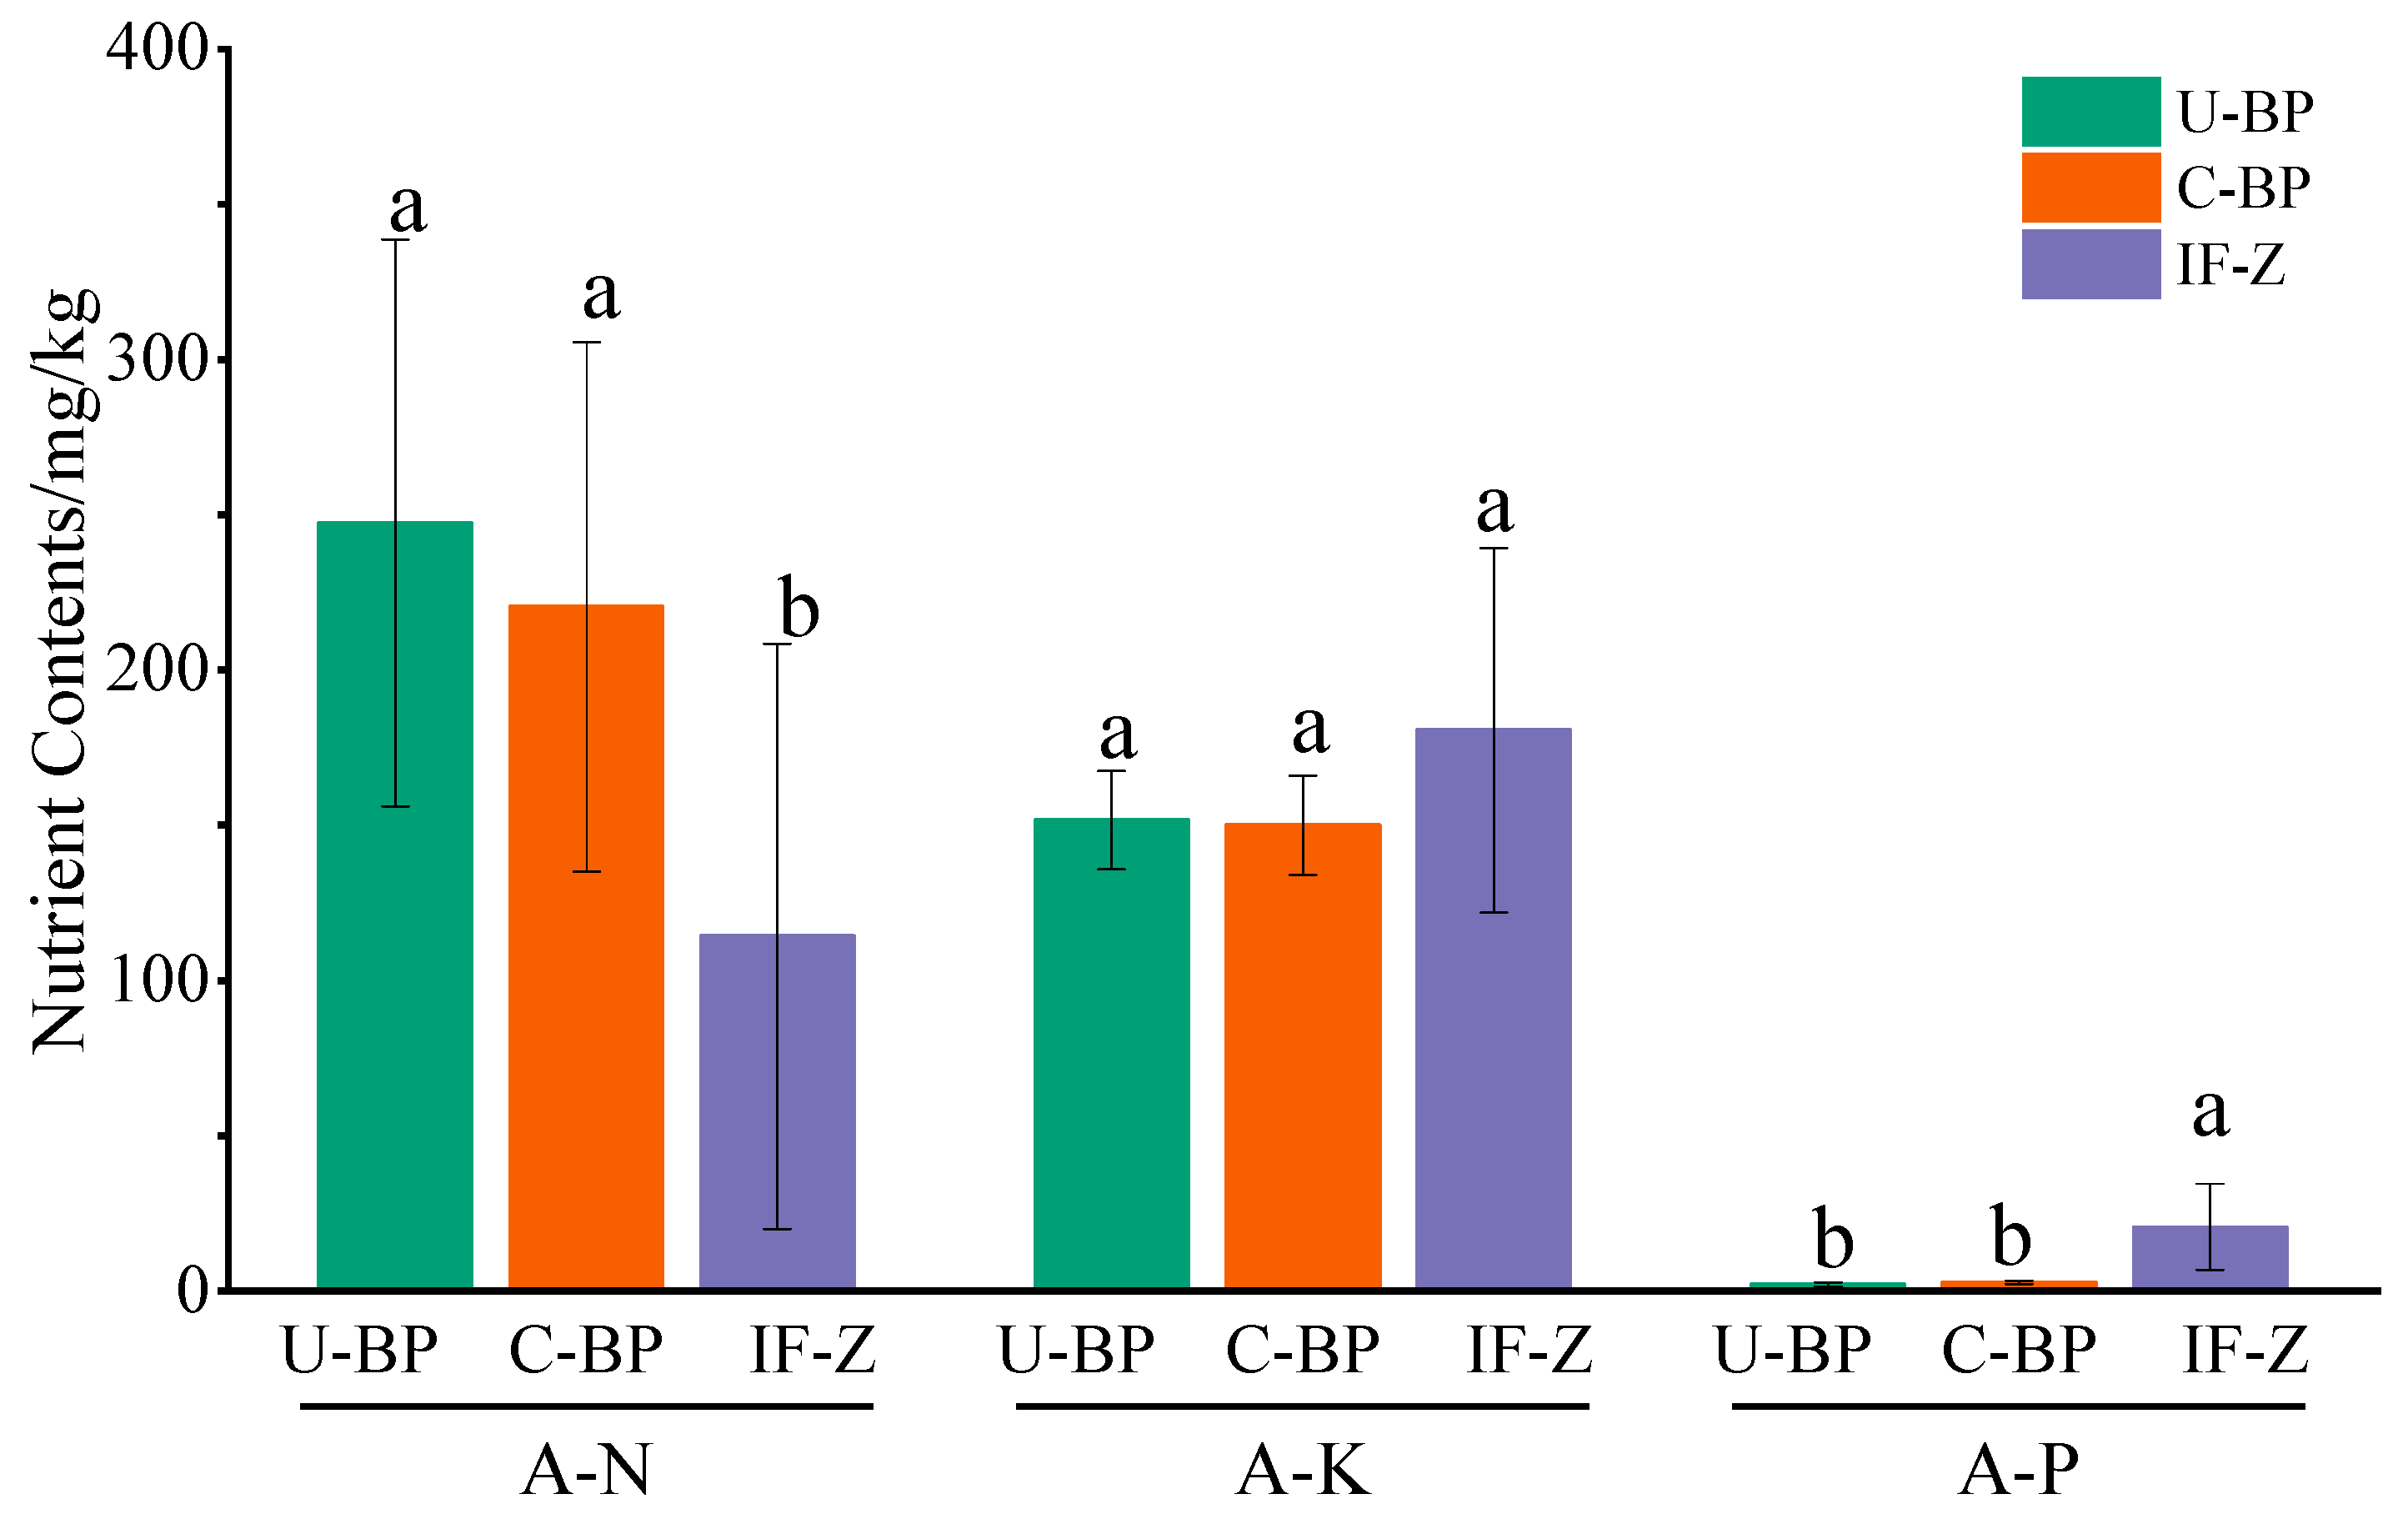
For A-N, the content for U-BP, C-BP, and IF-Z was 247.26 ± 91.19, 220.40 ± 85.27, and 114.31 ± 94.17 mg·kg−1, respectively. The results of ANOVA showed that there was no significant difference in the soil A-N content between U-BP and C-BP, although they differed by 26.86 mg·kg−1, and both were significantly higher than that of IF-Z (Figure 6). On the other hand, the results for A-P showed the opposite trend. The A-P content for U-BP, C-BP, and IF-Z was 2.29 ± 0.71, 2.86 ± 0.52, and 20.67 ± 13.87 mg·kg−1, respectively. There was no significant difference in soil A-P content between U-BP and C-BP, but they differed by 0.57 mg·kg−1, and both were significantly lower than that of IF-Z. The characteristics of A-K content differed from those of A-N and A-P. The A-K content in soil under U-BP, C-BP, and IF-Z were 151.73 ± 15.89, 150.05 ± 15.94, and 180.53 ± 58.59 mg·kg−1, respectively, with no significant difference among the three.
3.6. Soil Salinity
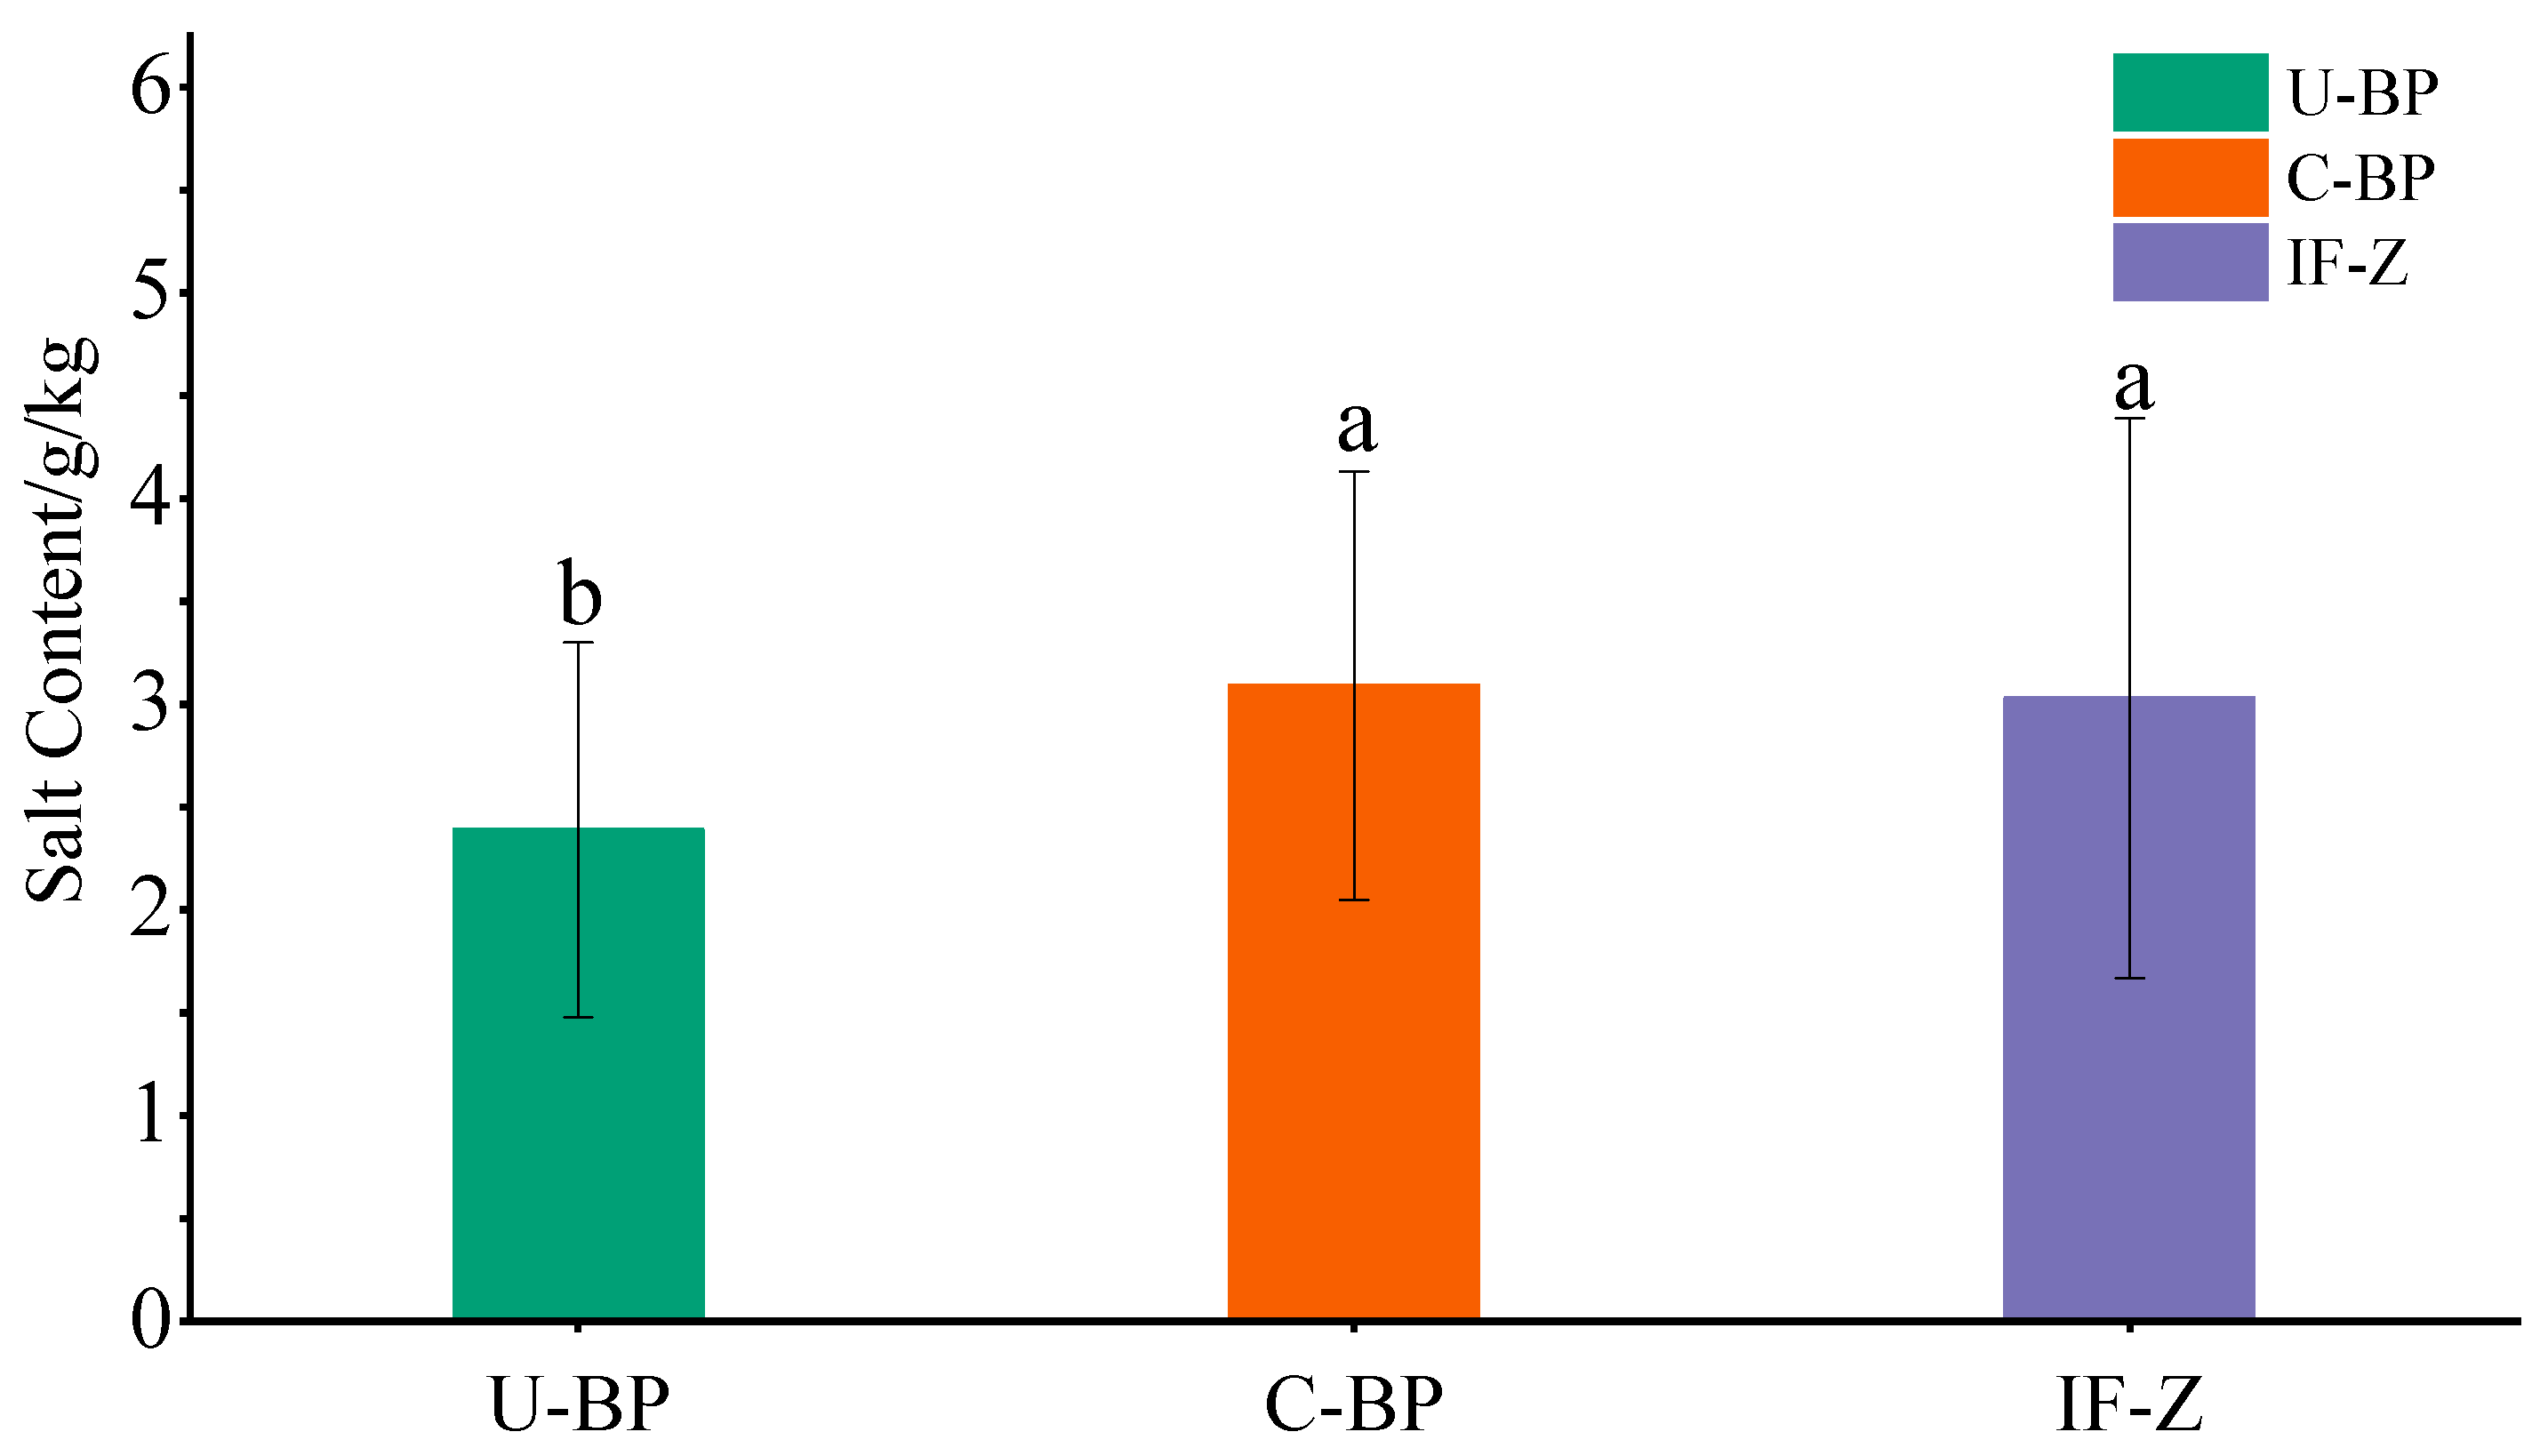
The results of experiments to determine the salt content and ANOVA showed that there was no significant difference in the soil salinity between C-BP and IF-Z (Figure 7). The salinity of IF-Z, C-BP, and U-BP was 3.03 ± 1.36, 3.09 ± 1.04, and 2.39 ± 0.91 g·kg−1, respectively, indicating a moderate level of salinization. However, both were significantly higher than that of U-BP by 0.7 and 0.64 g·kg−1, respectively. The levels of soil salinization under IF-Z and C-BP were slightly higher compared with U-BP.
3.7. Similarity Analysis of the Sample Sites Based on Soil Properties
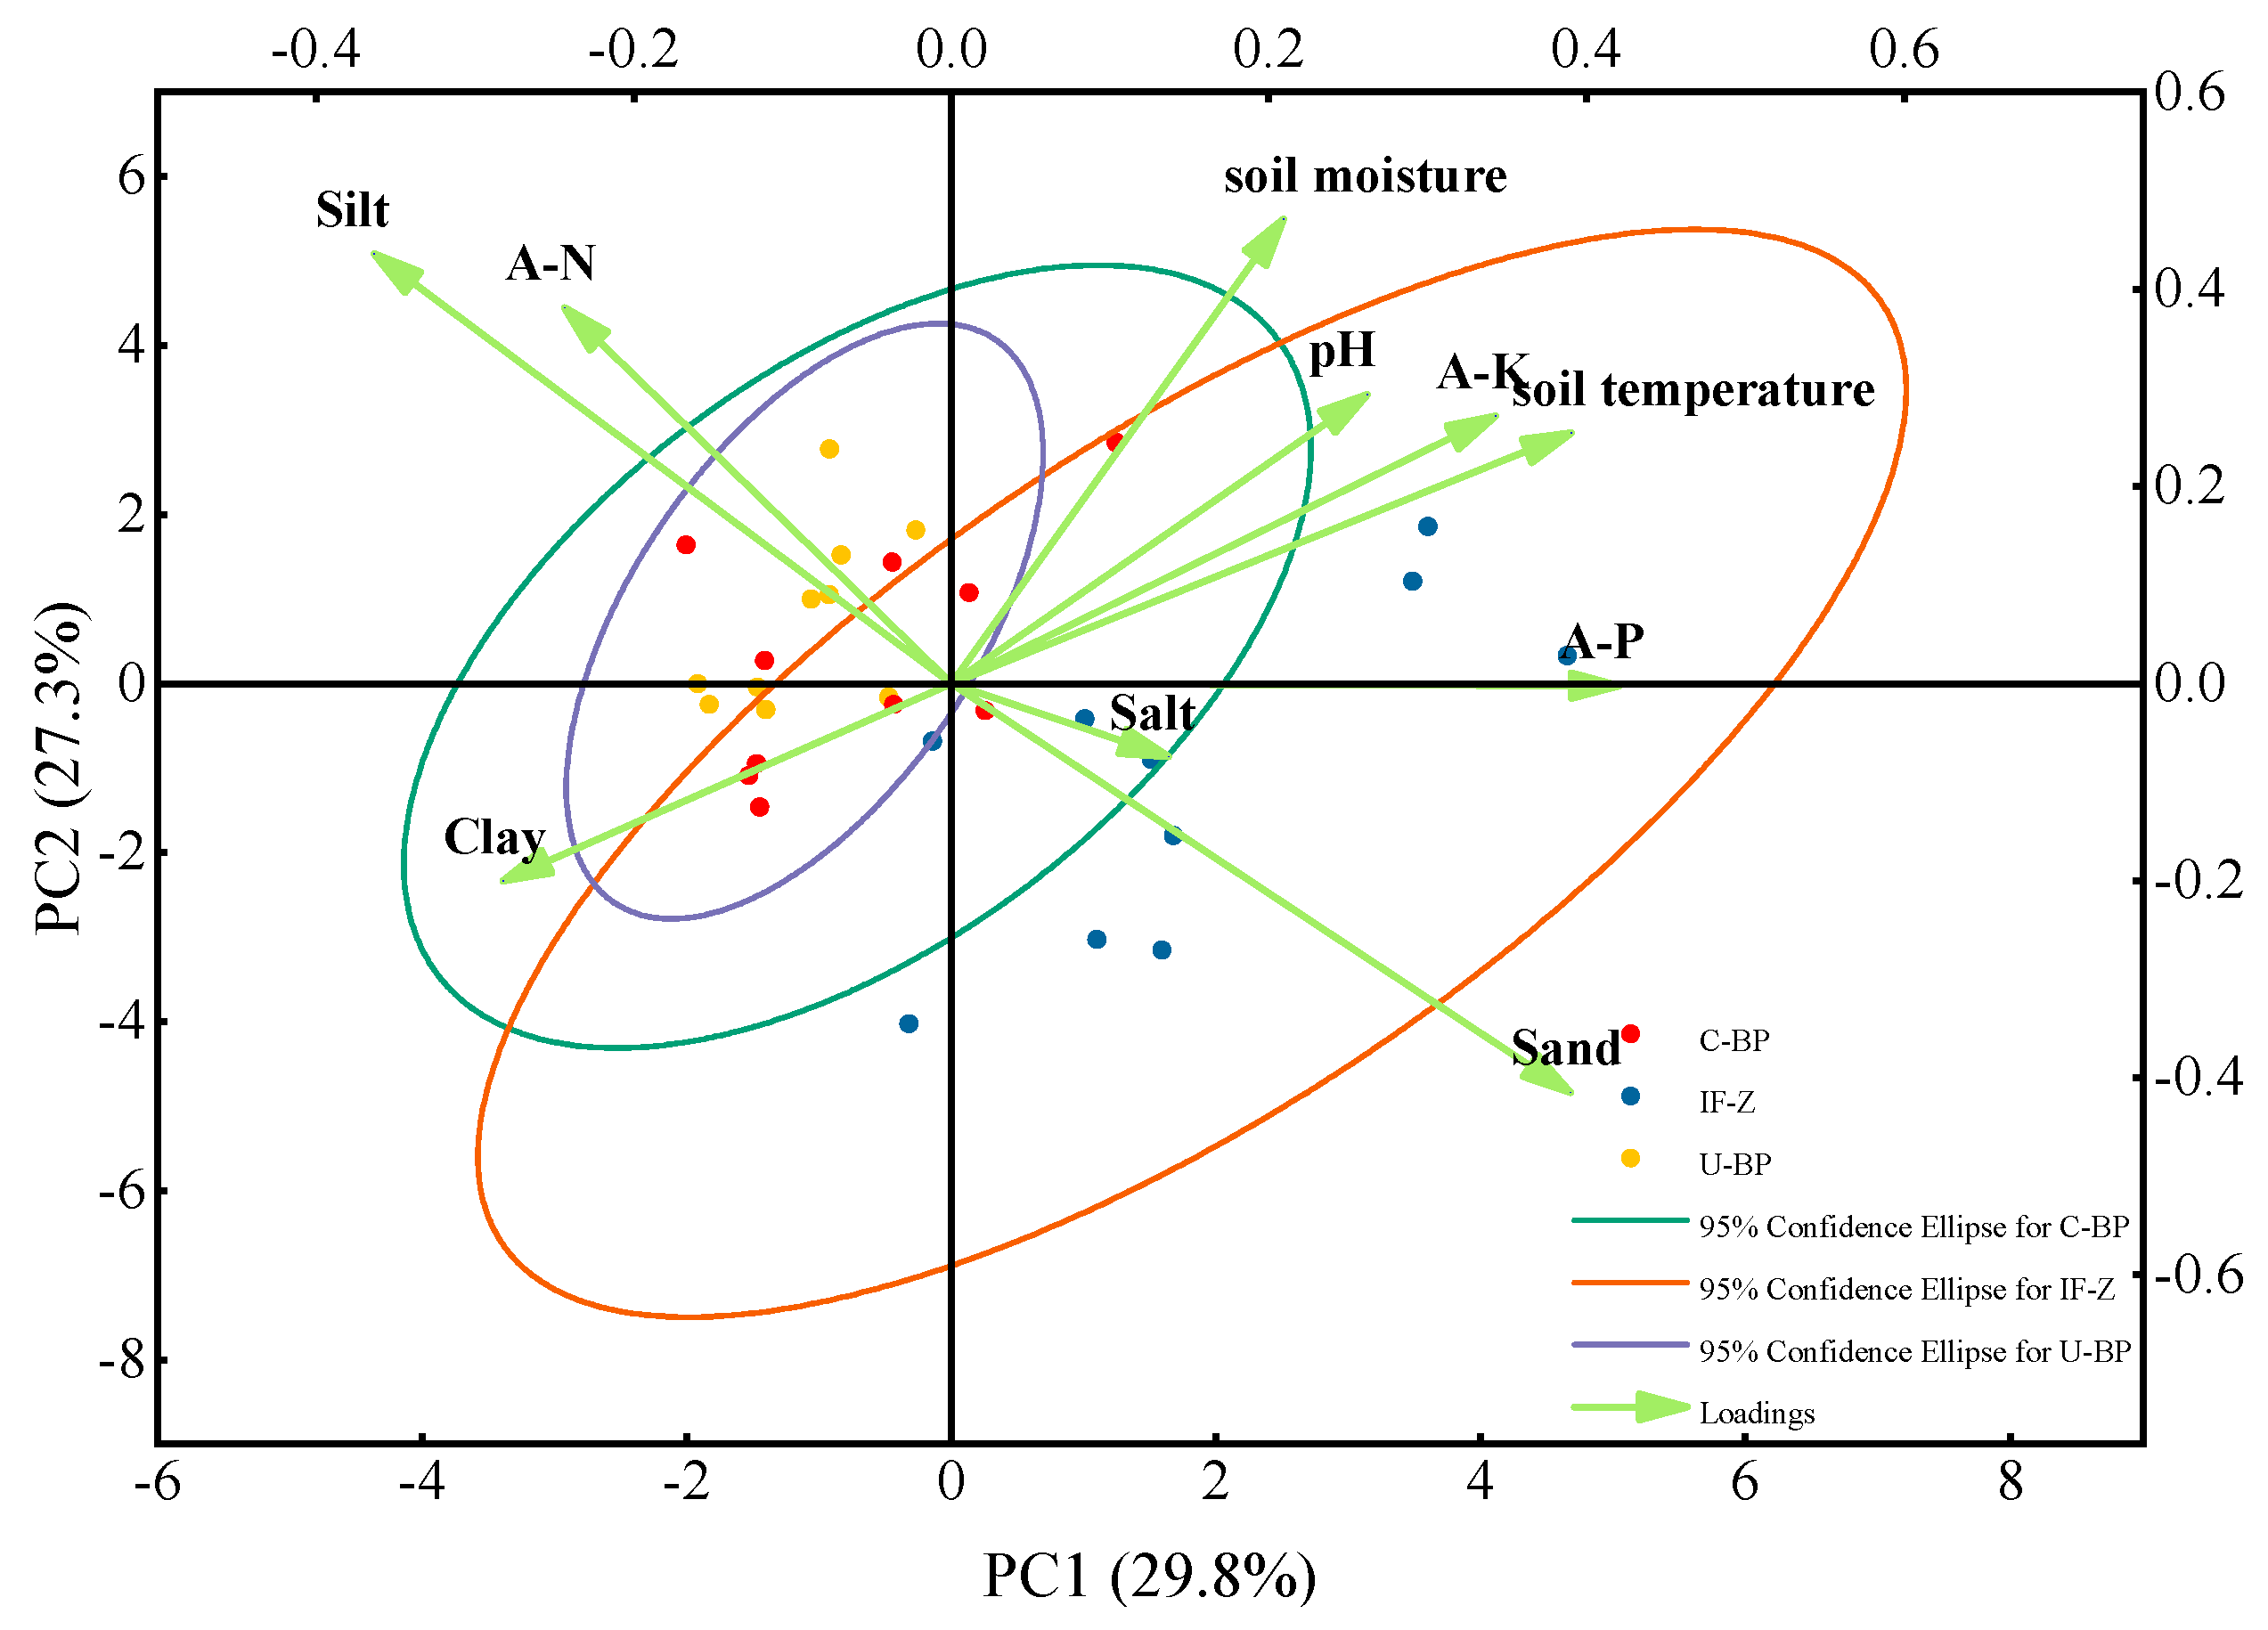
The effects of infected wood removal on the soil’s physicochemical properties were analyzed using principal component analysis (PCA) based on data from the three plots. The analysis considered soil temperature, soil moisture, pH, particle size distribution (clay, silt, sand), nutrient content (A-N, A-K, A-P), and salinity (Figure 8). The PCA ranking plot showed the relative distance between the sampling points, representing the similarity of the samples [55]. PC1 and PC2, established through PCA analysis, represent two theoretical variables. The percentages in parentheses indicate the interpretation rate of the soil’s physicochemical properties for each theoretical axis. PC1, accounting for 29.8% of the interpretation rate, determined the soil temperature and the horizontal distribution characteristics of the physicochemical properties. PC2, mainly influenced by soil moisture, accounted for 27.3% of the interpretation rate, representing the vertical distribution characteristics of the physicochemical properties. The distribution of the U-BP samples was the most concentrated, indicating higher similarity among the samples. On the other hand, the IF-Z samples showed a more scattered distribution, indicating greater differences among the sampling points. The overlap between U-BP and C-BP samples was higher, suggesting greater similarity between these two samples. Moreover, the similarity between IF-Z and C-BP was significantly greater than that between IF-Z and U-BP, indicating that the soil physicochemical properties of C-BP were closer to those of IF-Z than to those of U-BP.
4. Discussion
4.1. Response of Soil pH to the Removal of Diseased P. thunbergii Wood
The change in soil pH is influenced by various factors, including climate, land use change, nitrogen fertilizer use, atmospheric nitrogen deposition, and litter decomposition [56]. However, in the case of Changdao’s black pine forests, the main factors affecting change in soil pH are atmospheric precipitation and litter cover. It has been observed that the accumulation of litter under U-BP and C-BP is inconsistent, and its decomposition affects the pH of the soil. The soil pH under U-BP in black pine forests is lower than the soil pH under C-BP and IF-Z. This is because the accumulation of the soil surface layer under U-BP is thicker due to the presence of a thicker leaf litter cover, resulting in higher soil acidity during decomposition [57]. On the other hand, C-BP and IF-Z have thinner deciduous layers, leading to less decomposition of humus and release of organic acids. Additionally, the roots of pine trees can secrete acidic substances, further reducing the pH [40,58]. Therefore, after the removal of diseased black pine wood, the soil pH was relatively increased due to the thinner leaf litter layer.
4.2. Changes in Soil Texture after the Removal of Diseased Wood
Soil texture, which refers to the distribution of particle sizes (clay, silt, sand) in the soil, is mainly determined by factors such as land use, soil moisture content, and environmental conditions [45,46,47]. In the case of Changdao’s black pine forests, the soil texture under U-BP is loamy sand, while the soil texture under C-BP and IF-Z is sandy loam. The difference in the texture conditions among the three plots is due to the microenvironment formed later on. Studies have shown that grassland has a higher content of organic matter compared with woodland, resulting in a higher presence of soil animals and microorganisms. These soil animals and microorganisms contribute to soil crushing, digging, and decomposition. In the case of U-BP, the thicker deciduous layer led to almost no grass and shrub cover, while C-BP and IF-Z had thinner deciduous layers and more soil animals and microorganisms. This difference in soil conditions affects soil crushing and burrowing [28,59]. Additionally, the growth of grass and shrubs, and the presence of microorganisms and soil animals change the characteristics of the soil’s particle size distribution, thereby altering the soil’s texture.
4.3. Effects of Wood Clearing on Soil Temperature and Moisture
Soil temperature plays a crucial role in plant growth, and extreme temperatures can negatively impact the soil microorganisms’ activity and plant growth. In this study, the surface soil temperature under C-BP and IF-Z was lower than that under U-BP, while the deep soil temperature showed no significant difference. The litter layer covering the surface soil effectively maintains a relatively constant soil temperature in black pine forests [31,33]. The presence of thicker litter under U-BP and thinner litter under C-BP and IF-Z led to notable temperature differences in the bottom soil covered by litter. Moreover, soil temperature generally decreases with depth, and the atmospheric environment has less influence on soil temperature at a certain depth, resulting in relatively stable temperatures [60,61].
After the removal of infected trees, the accumulation of new dead branches and leaves on the soil surface is reduced or absent. This allows new herbaceous plants or woody shrub vegetation to grow, creating a different soil surface environment compared with U-BP. The roots of green plants under C-BP and IF-Z were shallow and utilize more surface water, whereas the topsoil under U-BP consisted mostly of dead branches and leaves, with minimal water used by grass and shrubs. As a result, the water content in the bottom soil of U-BP was lower than that in C-BP and IF-Z. Similarly, the deep soils in U-BP are mainly utilized by deeper-rooted black pine trees, while grass and shrub plants under C-BP and IF-Z utilize less of the deep soil moisture. Therefore, the deep soil moisture content in C-BP and IF-Z was higher than that in U-BP. Additionally, the presence of a dead leaf layer effectively retains water in the forest soil, thereby increasing the relative water content during dry weather conditions [62,63,64]. Therefore, the removal of diseased black pine wood can effectively alter the soil temperature and moisture by changing the environmental conditions such as dead branches, deciduous layers, and grass and shrub cover.
4.4. Effects of Clearing Diseased Wood on Soil Nutrients and Salinity
The A-N content in U-BP soil was higher than that in C-BP and IF-Z, while the A-P and A-K content in U-BP soil was lower. This is because the process of decomposition of forest litter is a way for the forest to return nutrients to the soil. During decomposition, nitrogen is enriched in the soil due to the fixation effect of microorganisms. On the other hand, the contents of potassium and phosphorus generally decrease during the decomposition of dead branches and leaves due to soil leaching [33,60,65]. The accumulation of dead branches and leaves on the soil surface under U-BP results in more nitrogen being accumulated in the soil, while potassium and phosphorus are lost through leaching. In contrast, C-BP and IF-Z have fewer dead branches and leaves on the soil surface, resulting in less accumulation of nitrogen and leaching of potassium and phosphorus [29,66]. Therefore, the removal of diseased black pine wood can change the availability of nutrients in the soil by affecting the litter layer of dead branches.
Vegetation cover has been observed to reduce soil salinity compared with bare ground. This is because vegetation improves the soil’s fertility, enhances the soil’s structure, and reduces surface water evaporation, which inhibits the accumulation of salt [67]. In addition, the salt concentration in the soil is influenced by soil moisture. Higher soil moisture leads to a lower salt concentration [68,69]. Since the moisture content of the topsoil under U-BP was higher than that of C-BP and IF-Z, the soil salt content under U-BP was lower. Therefore, the presence of black pine trees may reduce soil salinity.
4.5. The Direction of Succession of the Forests after Clearing Diseased Wood
The highest similarity was found among U-BP samples, while the lowest similarity was observed among IF-Z samples. In comparison with U-BP, the soil properties of C-BP were more similar to those of IF-Z. This suggests that U-BP was subject to less environmental disturbance compared with C-BP and IF-Z. Additionally, this also indicated that C-BP is developing in the direction of IF-Z. Research has shown that clear-felled forests tend to undergo succession towards sparse low grassland, and the differences between the topsoil and subsoil become smaller. Furthermore, over time, abandoned pastures may develop into secondary forests. This means that the soil on the forest floor may also undergo succession quietly after the clearing of diseased wood [70,71]. And the process of succession from bare land to grassland results in soil compaction [72,73], which is consistent with the fact that the soil salinity of C-BP was higher than that of U-BP. In other words, the forest after the clearing of diseased wood is undergoing succession towards inter-forest grassland, which is also a form of secondary succession [74]. In this process, total soil carbon and organic matter play a crucial role in improving the soil’s quality and promoting the regeneration of soil and vegetation. In arid environments, the logging of native vegetation has a significant capacity for soil degradation, leading to soil desertification and preventing its regeneration [75,76].
5. Conclusions
After the removal of infected P. thunbergii wood, the growth of grass and shrubs, microorganisms, and soil animals effectively altered the characteristics of soil particle size and volume distribution, leading to an increase in sand content, consequently affecting the soil’s texture. The thickness of the litter layer decreased after the removal of infected wood, which effectively reduced the heat retention capacity and surface soil moisture content of the topsoil, contrasting with the shallow layer. Moreover, the soil pH after the removal of diseased wood gradually approached the soil pH of the non-black pine grassy irrigated areas, indicating an improvement in soil pH after removal of the diseased wood. Simultaneously, the removal of diseased black pine wood can effectively change the availability of nutrients in the soil and exacerbate soil salinization in the black pine forest. Across all the physicochemical properties studied in the three plots, the physicochemical properties of the IF-Z plot aligned more closely with those of the C-BP plot, indicating that the forest after clearing diseased wood was undergoing succession towards inter-forest grassland. These results contribute to the scientific understanding of ecological restoration and sustainable management practices in black pine forests. Meanwhile, the outcomes of this research have practical implications for the development of effective strategies to mitigate the negative impacts of pine wilt disease and promote the long-term ecological sustainability of black pine forests in Changdao.
Author Contributions
Y.F. and C.W. conceived the idea and designed the experiments; C.W., Z.W., J.F. and Z.L. performed the field investigation; C.W., Y.F. and C.T. analyzed the results and wrote the paper. All authors have read and agreed to the published version of the manuscript.
Funding
This work was supported by the National Natural Science Foundation of China (grant number 42001021), the National Social Science Foundation of China (grant number 21BTQ047), the Natural Science Foundation of Shandong Province (grant number ZR2020QD005), the Humanities and Social Sciences Fund of Ministry of Education of China (grant number 17YJCZH039), the China Postdoctoral Science Foundation (grant number 2019M662427), and the Science Foundation of Zhejiang Sci-Tech University (ZSTU) (grant number 22092034-Y).
Institutional Review Board Statement
Not applicable.
Informed Consent Statement
Not applicable.
Data Availability Statement
Data are contained within the article.
Conflicts of Interest
The authors declare that they have no conflict of interest. This article does not contain any studies with human participants or animals performed by any of the authors. The funders had no role in the design of the study; in the collection, analyses, or interpretation of data; in the writing of the manuscript; or in the decision to publish the results.
References
- Xu, Q.; Zhang, X.; Li, J.; Ren, J.; Ren, L.; Luo, Y. Pine Wilt Disease in Northeast and Northwest China: A Comprehensive Risk Review. Forests 2023, 14, 174. [Google Scholar] [CrossRef]
- Li, Z.; Tao, J.; Zong, S. Cold Tolerance in Pinewood Nematode Bursaphelenchus xylophilus Promoted Multiple Invasion Events in Mid-Temperate Zone of China. Forests 2022, 13, 1100. [Google Scholar] [CrossRef]
- Dou, G.; Yan, D.-H. Research Progress on Biocontrol of Pine Wilt Disease by Microorganisms. Forests 2022, 13, 1047. [Google Scholar] [CrossRef]
- Martini, X.; Hughes, M.A.; Conover, D.; Smith, J. Use of Semiochemicals for the Management of the Redbay Ambrosia Beetle. Insects 2020, 11, 796. [Google Scholar] [CrossRef] [PubMed]
- Xu, X.-L.; Wu, X.-Q.; Ye, J.-R.; Huang, L. Molecular characterization and functional analysis of three pathogenesis-related cytochrome P450 genes from Bursaphelenchus xylophilus (Tylenchida: Aphelenchoidoidea). Int. J. Mol. Sci. 2015, 16, 5216–5234. [Google Scholar] [CrossRef] [PubMed]
- Zhao, B.G.; Futai, K.; Sutherland, J.R.; Takeuchi, Y. Pine Wilt Disease; Springer: Tokyo, Japan, 2008. [Google Scholar] [CrossRef]
- Vicente, C.S.L.; Soares, M.; Faria, J.M.S.; Ramos, A.P.; Inácio, M.L. Insights into the Role of Fungi in Pine Wilt Disease. J. Fungi 2021, 7, 780. [Google Scholar] [CrossRef]
- Kim, B.-N.; Kim, J.H.; Ahn, J.-Y.; Kim, S.; Cho, B.-K.; Kim, Y.-H.; Min, J. A short review of the pinewood nematode, Bursaphelenchus xylophilus. Toxicol. Environ. Health Sci. 2020, 12, 297–304. [Google Scholar] [CrossRef]
- Pires, D.; Vicente, C.S.L.; Inácio, M.L.; Mota, M. The Potential of Esteya spp. for the Biocontrol of the Pinewood Nematode, Bursaphelenchus Xylophilus. Microorganisms 2022, 10, 168. [Google Scholar] [CrossRef]
- Holuša, J.; Hlásny, T.; Modlinger, R.; Lukášová, K.; Kula, E. Felled trap trees as the traditional method for bark beetle control: Can the trapping performance be increased? For. Ecol. Manag. 2017, 404, 165–173. [Google Scholar] [CrossRef]
- Lim, C.-H.; Choi, Y.; Kim, M.; Jeon, S.W.; Lee, W.-K. Impact of Deforestation on Agro-Environmental Variables in Cropland. North Korea. Sustainability 2017, 9, 1354. [Google Scholar] [CrossRef]
- Rannestad, M.M.; Gessesse, T.A. Deforestation and Subsequent Cultivation of Nutrient Poor Soils of Miombo Woodlands of Tanzania: Long Term Effect on Maize Yield and Soil Nutrients. Sustainability 2020, 12, 4113. [Google Scholar] [CrossRef]
- Wang, B.; Wang, G.; Myo, S.T.Z.; Li, Y.; Xu, C.; Lin, Z.; Qian, Z.; Tang, L. Deforestation for Agriculture Temporarily Improved Soil Quality and Soil Organic Carbon Stocks. Forests 2022, 13, 228. [Google Scholar] [CrossRef]
- Junior, C.R.P.; Pereira, M.G.; Filho, J.D.S.O.; Beutler, S.J. Can topography affect the restoration of soil properties after deforestation in a semiarid ecosystem? J. Arid. Environ. 2019, 162, 45–52. [Google Scholar] [CrossRef]
- Durrer, A.; Margenot, A.J.; Silva, L.C.R.; Bohannan, B.J.M.; Nusslein, K.; van Haren, J.; Andreote, F.D.; Parikh, S.J.; Rodrigues, J.L.M. Beyond total carbon: Conversion of amazon forest to pasture alters indicators of soil C cycling. Biogeochemistry 2021, 152, 179–194. [Google Scholar] [CrossRef]
- Lemos, L.N.; Pedrinho, A.; de Vasconcelos, A.T.R.; Tsai, S.M.; Mendes, L.W. Amazon deforestation enriches antibiotic resistance genes. Soil Biol. Biochem. 2021, 153, 108110. [Google Scholar] [CrossRef]
- Alexander, S.P. What Drives Deforestation in the Brazilian Amazon? J. Environ. Econ. Manag. 1999, 37, 26–43. [Google Scholar] [CrossRef]
- Mueller, R.C.; Paula, F.S.; Mirza, B.S.; Rodrigues, J.L.; Nüsslein, K.; Bohannan, B.J. Links between plant and fungal communities across a deforestation chronosequence in the Amazon rainforest. ISME J. 2014, 8, 1548–1550. [Google Scholar] [CrossRef]
- Nourbakhsh, F. Decoupling of soil biological properties by deforestation. Agric. Ecosyst. Environ. 2007, 121, 435–438. [Google Scholar] [CrossRef]
- Zhang, Q.; Wang, Z.; Yao, Y.; Kong, W.; Zhao, Z.; Shao, M.; Wei, X. Effects of slope morphology and position on soil nutrients after deforestation in the hilly loess region of China. Agric. Ecosyst. Environ. 2021, 321, 107615. [Google Scholar] [CrossRef]
- Fujisaki, K.; Perrin, A.-S.; Garric, B.; Balesdent, J.; Brossard, M. Soil organic carbon changes after deforestation and agrosystem establishment in Amazonia: An assessment by diachronic approach. Agric. Ecosyst. Environ. 2017, 245, 63–73. [Google Scholar] [CrossRef]
- Chernov, T.I.; Zhelezova, A.D.; Tkhakakhova, A.K.; Ksenofontova, N.A.; Zverev, A.O.; Tiunov, A.V. Soil microbiome, organic matter content and microbial abundance in forest and forest-derived land cover in Cat Tien National Park (Vietnam). Appl. Soil Ecol. 2021, 165, 103957. [Google Scholar] [CrossRef]
- Klanderud, K.; Mbolatiana, H.Z.H.; Vololomboahangy, M.N.; Radimbison, M.A.; Roger, E.; Totland, Ø.; Rajeriarison, C. Recovery of plant species richness and composition after slash-and-burn agriculture in a tropical rainforest in Madagascar. Biodivers. Conserv. 2010, 19, 187–204. [Google Scholar] [CrossRef]
- Getaneh, S.; Honnay, O.; Desie, E.; Helsen, K.; Couck, L.; Shibru, S.; Muys, B. Impact of tree litter identity, litter diversity and habitat quality on litter decomposition rates in tropical moist evergreen forest. For. Ecosyst. 2022, 9, 100023. [Google Scholar] [CrossRef]
- Miao, R.; Ma, J.; Liu, Y.; Liu, Y.; Yang, Z.; Guo, M. Variability of Aboveground Litter Inputs Alters Soil Carbon and Nitrogen in a Coniferous–Broadleaf Mixed Forest of Central China. Forests 2019, 10, 188. [Google Scholar] [CrossRef]
- Alfaro, F.D.; Manzano, M.; Marquet, P.A.; Gaxiola, A. Microbial communities in soil chronosequences with distinct parent material: The effect of soil pH and litter quality. J. Ecol. 2017, 105, 1709–1722. [Google Scholar] [CrossRef]
- Peng, Y.; Li, Y.-J.; Song, S.-Y.; Chen, Y.-Q.; Chen, G.-T.; Tu, L.-H. Nitrogen addition slows litter decomposition accompanied by accelerated manganese release: A five-year experiment in a subtropical evergreen broadleaf forest. Soil Biol. Biochem. 2022, 165, 108511. [Google Scholar] [CrossRef]
- Luan, J.; Li, S.; Wang, Y.; Ding, L.; Cai, C.; Liu, S. Decomposition of diverse litter mixtures affected by drought depends on nitrogen and soil fauna in a bamboo forest. Soil Biol. Biochem. 2022, 173, 108783. [Google Scholar] [CrossRef]
- Tie, L.; Hu, J.; Peñuelas, J.; Sardans, J.; Wei, S.; Liu, X.; Zhou, S.; Huang, C. The amounts and ratio of nitrogen and phosphorus addition drive the rate of litter decomposition in a subtropical forest. Sci. Total Environ. 2022, 833, 155163. [Google Scholar] [CrossRef]
- Rodtassana, C.; Tanner, E.V.J. Litter removal in a tropical rain forest reduces fine root biomass and production but litter addition has few effects. Ecology 2018, 99, 735–742. [Google Scholar] [CrossRef] [PubMed]
- Li, R.; Zhang, Y.; Yu, D.; Wang, Y.; Zhao, X.; Zhang, R.; Zhang, W.; Wang, Q.; Xu, M.; Chen, L.; et al. The decomposition of green leaf litter is less temperature sensitive than that of senescent leaf litter: An incubation study. Geoderma 2021, 381, 114691. [Google Scholar] [CrossRef]
- Liu, Y.; Tian, H.; Liu, S.; Li, G.; Hu, X. Asymmetric effects between tree and understorey litters on mixed litter decomposition in temperate Quercus variabilis forest. Sci. Total Environ. 2022, 806, 150939. [Google Scholar] [CrossRef] [PubMed]
- Rawlik, K.; Kasprowicz, M.; Nowiński, M.; Jagodziński, A.M. The afterlife of herbaceous plant species: A litter decomposition experiment in a temperate oak-hornbeam forest. For. Ecol. Manag. 2022, 507, 120008. [Google Scholar] [CrossRef]
- Zhang, Y.; Guo, S.; Liu, Q.; Jiang, J. Influence of Soil Moisture on Litter Respiration in the Semiarid Loess Plateau. PLoS ONE 2014, 9, e114558. [Google Scholar] [CrossRef] [PubMed]
- Shi, X.; Du, C.; Guo, X.; Shi, W. Heterogeneity of water-retention capacity of forest and its influencing factors based on meta-analysis in the Beijing-Tianjin-Hebei region. J. Geogr. Sci. 2021, 31, 69–90. [Google Scholar] [CrossRef]
- Kim, T.; Kim, J.; Lee, J.; Kim, H.S.; Park, J.; Im, S. Water Retention Capacity of Leaf Litter According to Field Lysimetry. Forests 2023, 14, 478. [Google Scholar] [CrossRef]
- Li, Q.; Lee, Y.E.; Im, S.J. Characterizing the Interception Capacity of Floor Litter with Rainfall Simulation Experiments. Water 2020, 12, 3145. [Google Scholar] [CrossRef]
- Li, N.; Huo, L.; Zhang, X. Classification of pine wilt disease at different infection stages by diagnostic hyperspectral bands. Ecol. Indic. 2022, 142, 109198. [Google Scholar] [CrossRef]
- Lu, X.; Huang, J.; Li, X.; Fang, G.; Liu, D. The interaction of environmental factors increases the risk of spatiotemporal transmission of pine wilt disease. Ecol. Indic. 2021, 133, 108394. [Google Scholar] [CrossRef]
- Fan, Y.; Liu, L.; Wu, C.; Yu, G.; Wang, Z.; Fan, J.; Tu, C. The Effect of Regulating Soil pH on the Control of Pine Wilt Disease in a Black Pine Forest. Forest 2023, 14, 1583. [Google Scholar] [CrossRef]
- Lee, J.-W.; Nam, I.; Park, J.-H.; Huh, M.-J.; Park, I.-K. Nematicidal activity of (Z)-ligustilide isolated from Angelica tenuissima Nakai root extract against the pine wood nematode Bursaphelenchus xylophilus. J. Asia Pac. Entomol. 2022, 25, 101957. [Google Scholar] [CrossRef]
- Nuruzzaman, M.; Manimekalai, R.; Sharoni, A.M.; Satoh, K.; Kondoh, H.; Ooka, H.; Kikuchi, S. Deep sequencing analyses of pine wood nematode Bursaphelenchus xylophilus microRNAs reveal distinct miRNA expression patterns during the pathological process of pine wilt disease. Gene 2015, 555, 346–356. [Google Scholar] [CrossRef]
- Qin, J.; Wang, B.; Wu, Y.; Lu, Q.; Zhu, H. Identifying Pine Wood Nematode Disease Using UAV Images and Deep Learning Algorithms. Remote Sens. 2021, 13, 162. [Google Scholar] [CrossRef]
- Dale, A.G.; Frank, S.D. Warming and drought combine to increase pest insect fitness on urban trees. PLoS ONE 2017, 12, e0173844. [Google Scholar] [CrossRef] [PubMed]
- Zhang, X.; Zhao, W.; Wang, L.; Liu, Y.; Liu, Y.; Feng, Q. Relationship between soil water content and soil particle size on typical slopes of the Loess Plateau during a drought year. Sci. Total Environ. 2019, 648, 943–954. [Google Scholar] [CrossRef] [PubMed]
- He, Y.; Lv, D. Fractal expression of soil particle-size distribution at the basin scale. Open Geosci. 2022, 14, 70–78. [Google Scholar] [CrossRef]
- Gui, D.; Lei, J.; Zeng, F.; Mu, G.; Zhu, J.; Wang, H.; Zhang, Q. Characterizing variations in soil particle size distribution in oasis farmlands—A case study of the Cele Oasis. Math. Comput. Model. 2010, 51, 1306–1311. [Google Scholar] [CrossRef]
- Fu, X.; Ding, H.; Sheng, Q.; Zhang, Z.; Yin, D.; Chen, F. Fractal Analysis of Particle Distribution and Scale Effect in a Soil–Rock Mixture. Fractal Fract. 2022, 6, 120. [Google Scholar] [CrossRef]
- Zhong, W.; He, N.; Cosgrove, T.; Zhu, Y.J.; Fu, L. Analysis of the correlation between fractal dimension of gravelly soil and debris-flow initiation through in-situ experiments. Appl. Ecol. Environ. Res. 2019, 17, 7573–7589. [Google Scholar] [CrossRef]
- Li, Q.; Lee, Y.E.; Im, S. Effect of Pennisetum giganteum z.x.lin mixed nitrogen-fixing bacterial fertilizer on the growth. quality, soil fertility and bacterial community of Pakchoi (Brassica chinensis L.). PLoS ONE 2020, 15, e0228709. [Google Scholar]
- Cheng, X.; Zhou, T.; Liu, S.; Sun, X.; Zhou, Y.; Xu, L.; Xie, B.; Ying, J.; Shi, Y. Effects of Climate on Variation of Soil Organic Carbon and Alkali-Hydrolyzed Nitrogen in Subtropical Forests: A Case Study of Zhejiang Province, China. Forest 2023, 14, 914. [Google Scholar] [CrossRef]
- Štípek, K.; Vaněk, V.; Száková, J.; Černý, J.; Šilha, J. Temporal variability of available phosphorus, potassium and magnesium in arable soil. Plant Soil Environ. 2004, 50, 547–551. [Google Scholar] [CrossRef]
- Soleimanifard, S.; Hamdami, N. Modelling of the Sorption Isotherms and Determination of the Isosteric Heat of Split Pistachios, Pistachio Kernels and Shells. Czech J. Food Sci. 2018, 36, 268–275. [Google Scholar] [CrossRef]
- Afonso, J.C.; Renata, M.A. Chemical analysis of copper salts manufactured between 1877 and 1995. Quim. Nova 2004, 27, 678–683. [Google Scholar] [CrossRef]
- Gewers, F.L.; Ferreira, G.R.; De Arruda, H.F.; Silva, F.N.; Comin, C.H.; Amancio, D.R.; Costa, L.D.F. Principal Component Analysis: A Natural Approach to Data Exploration. ACM Comput. Surv. 2021, 54, 70. [Google Scholar] [CrossRef]
- Jin, Z.; Luo, D.; Yu, Y.; Yang, S.; Zhang, J.; Cao, G. Soil pH changes in a small catchment on the Chinese Loess Plateau after long-term vegetation rehabilitation. Ecol. Eng. 2022, 175, 106503. [Google Scholar] [CrossRef]
- Tao, J.; Zuo, J.; He, Z.; Wang, Y.; Liu, J.; Liu, W.; Cornelissen, J.H.C. Traits including leaf dry matter content and leaf pH dominate over forest soil pH as drivers of litter decomposition among 60 species. Funct. Ecol. 2019, 33, 1798–1810. [Google Scholar] [CrossRef]
- Rigueiro-Rodríguez, A.; Mosquera-Losada, M.R.; Fernández-Núñez, E. Afforestation of agricultural land with Pinus radiata D. don and Betula alba L. in NW Spain: Effects on soil PH, understorey production and floristic diversity eleven years after establishment. Land Degrad. Dev. 2012, 23, 227–241. [Google Scholar] [CrossRef]
- Mabuhay, J.A.; Nakagoshi, N. Response of soil microbial communities to changes in a forest ecosystem brought about by pine wilt disease. Landsc. Ecol. Eng. 2012, 8, 189–196. [Google Scholar] [CrossRef]
- Liu, X.; Chen, S.; Li, X.; Yang, Z.; Xiong, D.; Xu, C.; Wanek, W.; Yang, Y. Soil warming delays leaf litter decomposition but exerts no effect on litter nutrient release in a subtropical natural forest over 450 days. Geoderma 2022, 427, 116139. [Google Scholar] [CrossRef]
- Li, A.; Fan, Y.; Chen, S.; Song, H.; Lin, C.; Yang, Y. Soil warming did not enhance leaf litter decomposition in two subtropical forests. Soil Biol. Biochem. 2022, 170, 108716. [Google Scholar] [CrossRef]
- Santos, A.F.A.; Carneiro, A.C.P.; Martinez, D.T.; Caldeira, S.F. Eucalyptus Litter Capacity of Stock and Water Retention. Floresta Ambiente 2017, 24, e20150303. [Google Scholar] [CrossRef]
- Xie, J.; Su, D. Water-Holding Characteristics of Litter in Meadow Steppes with Different Years of Fencing in Inner Mongolia, China. Water 2020, 12, 2374. [Google Scholar] [CrossRef]
- Zagyvai-Kiss, K.A.; Kalicz, P.; Szilágyi, J.; Gribovszki, Z. On the specific water holding capacity of litter for three forest ecosystems in the eastern foothills of the Alps. Agric. For. Meteorol. 2019, 278, 107656. [Google Scholar] [CrossRef]
- Wang, Q.-W.; Robson, T.M.; Pieristè, M.; Kenta, T.; Zhou, W.; Kurokawa, H. Canopy structure and phenology modulate the impacts of solar radiation on C and N dynamics during litter decomposition in a temperate forest. Sci. Total Environ. 2022, 820, 153185. [Google Scholar] [CrossRef] [PubMed]
- Gao, J.; Huang, Y.; Zhi, Y.; Yao, J.; Wang, F.; Yang, W.; Han, L.; Lin, D.; He, Q.; Wei, B.; et al. Assessing the impacts of urbanization on stream ecosystem functioning through investigating litter decomposition and nutrient uptake in a forest and a hyper-eutrophic urban stream. Ecol. Indic. 2022, 138, 108859. [Google Scholar] [CrossRef]
- Bazihizina, N.; Veneklaas, E.J.; Barrett-Lennard, E.G.; Colmer, T.D. Hydraulic redistribution: Limitations for plants in saline soils. Plant Cell Environ. 2017, 40, 2437–2446. [Google Scholar] [CrossRef] [PubMed]
- Flowers, T.J.; Colmer, T.D. Salinity tolerance in halophytes. New Phytol. 2008, 179, 945–963. [Google Scholar] [CrossRef]
- Wan, H.; Qi, H.; Shang, S. Estimating soil water and salt contents from field measurements with time domain reflectometry using machine learning algorithms. Agric. Water Manag. 2023, 285, 108364. [Google Scholar] [CrossRef]
- Lu, D.; Moran, E.; Mausel, P. Linking amazonian secondary succcession forest growth to soil properties. Land Degrad. Develop. 2002, 13, 331–343. [Google Scholar] [CrossRef]
- Rasiah, V.; Florentine, S.; Williams, B.; Westbrooke, M. The impact of deforestation and pasture abandonment on soil properties in the wet tropics of Australi. Geoderma 2004, 120, 35–45. [Google Scholar] [CrossRef]
- Brown, D.D.; Curtis, T.; Adams, E.C. Effects of clear-felling versus gradual removal of conifer trees on the survival of understorey plants during the restoration of ancient woodlands. For. Ecol. Manag. 2015, 248, 15–22. [Google Scholar] [CrossRef]
- Veldman, J.W.; Buisson, E.; Durigan, G.; Fernandes, G.W.; Le Stradic, S.; Mahy, G.; Negreiros, D.; Overbeck, G.E.; Veldman, R.G.; Zaloumis, N.P.; et al. Toward an old-growth concept for grasslands, savannas, and woodlands. Front. Ecol. Environ. 2015, 13, 154–162. [Google Scholar] [CrossRef] [PubMed]
- Mottl, O.; Plowman, N.S.; Novotny, V.; Gewa, B.; Rimandai, M.; Klimes, P. Secondary succession has surprisingly low impact on arboreal ant communities in tropical montane rainforest. Ecosphere 2019, 10, e02848. [Google Scholar] [CrossRef]
- Rezende, J.S.; Freire, F.; Filho, J.A.; Freire, M.D.S.; de Almeida, B.G.; Santos, L.C. Impact of deforestation on the soil physical and chemical attributes, and humic fraction of organic matter in dry environments in Brazil. iForest 2021, 15, 465–475. [Google Scholar] [CrossRef]
- Hassler, S.K.; Zimmermann, B.; van Breugel, M.; Hall, J.S.; Elsenbeer, H. Recovery of saturated hydraulic conductivity under secondary succession on former pasture in the humid tropics. For. Ecol. Manag. 2011, 261, 1634–1642. [Google Scholar] [CrossRef]
Figure 1.
Soil pH under U-BP, C-BP, and IF-Z. U-BP stands for uncut black pine; C-BP stands for cut black pine; IF-Z stands for the inter-forest zone. Different letters (a, b) over the columns indicate significant differences among the three groups in terms of soil pH (t-test, p < 0.05).
Figure 1.
Soil pH under U-BP, C-BP, and IF-Z. U-BP stands for uncut black pine; C-BP stands for cut black pine; IF-Z stands for the inter-forest zone. Different letters (a, b) over the columns indicate significant differences among the three groups in terms of soil pH (t-test, p < 0.05).

Figure 2.
Soil particle size distribution of U-BP, C-BP, and IF-Z. U-BP stands for uncut black pine, C-BP stands for cut black pine, and IF-Z stands for the inter-forest zone.
Figure 2.
Soil particle size distribution of U-BP, C-BP, and IF-Z. U-BP stands for uncut black pine, C-BP stands for cut black pine, and IF-Z stands for the inter-forest zone.

Figure 3.
Soil particle size content of U-BP, C-BP, and IF-Z. U-BP stands for uncut black pine, C-BP stands for cut black pine, and IF-Z stands for the inter-forest zone. Different letters (a, b) over the columns indicate significant differences among these groups in terms of the soil particle size content of clay, silt, and sand (t-test, p < 0.05).

Figure 4.
(a) Daily surface soil temperature, (b) daily deep soil temperature, (c) daily surface soil moisture, and (d) daily deep soil moisture. U-BP stands for uncut black pine, C-BP stands for cut black pine, and IF-Z stands for the inter-forest zone.
Figure 4.
(a) Daily surface soil temperature, (b) daily deep soil temperature, (c) daily surface soil moisture, and (d) daily deep soil moisture. U-BP stands for uncut black pine, C-BP stands for cut black pine, and IF-Z stands for the inter-forest zone.

Figure 5.
(a) The surface soil temperature, (b) the deep soil temperature, (c) surface soil moisture, and (d) the deep soil moisture. U-BP stands for uncut black pine, C-BP stands for cut black pine, and IF-Z stands for the inter-forest zone. Different letters (a, b) over the columns indicate significant differences among these groups in terms of surface soil temperature, deep soil temperature, surface soil moisture, and deep soil moisture in spring, summer, and autumn (t-test, p < 0.05).

Figure 6.
Available nutrients for U-BP, C-BP, and IF-Z. U-BP stands for uncut black pine, C-BP stands for cut black pine, and IF-Z stands for the inter-forest zone. A-N represents available nitrogen, A-P represents available phosphorus, and A-K represents available potassium. Different letters (a, b) over the columns indicate significant differences among these groups in terms of the soil nutrient content of A-N, A-P, and A-K (t-test, p < 0.05).

Figure 7.
The salt content of U-BP, C-BP, and IF-Z. U-BP stands for uncut black pine, C-BP stands for cut black pine, and IF-Z stands for the inter-forest zone. Different letters (a, b) over the columns indicate significant differences among these groups in terms of soil salt content (t-test, p < 0.05).

Figure 8.
PCA ranking plot of the samples’ similarity. U−BP stands for uncut black pine, C−BP stands for cut black pine, and IF−Z stands for the inter-forest zone.
Figure 8.
PCA ranking plot of the samples’ similarity. U−BP stands for uncut black pine, C−BP stands for cut black pine, and IF−Z stands for the inter-forest zone.


Table 1.
Particle size content and fractal dimensions of U-BP, C-BP, and IF-Z.
| Soil Sample Type | Soil Texture Type | Particle Size Content (%) | D | |||||
|---|---|---|---|---|---|---|---|---|
| Clay | Silt | Superfine Sand | Fine Sand | Medium Sand | Coarse Sand | |||
| 0–2 μm | 2–50 μm | 50–100 μm | 100–250 μm | 250–500 μm | 500–1000 μm | |||
| U-BP | loamy sand | 3.35 ± 0.08 | 70.25 ± 0.69 | 20.12 ± 0. 68 | 5.84 ± 0.34 | 0.43 ± 0.12 | 0.01 ± 0.00 | 2.42 ± 0.01 |
| C-BP | sandy loam | 3.37 ± 0.09 | 68.48 ± 0.84 | 21.58 ± 0. 82 | 6.12 ± 0.13 | 0.43 ± 0.19 | 0.02 ± 0.01 | 2.47 ± 0.01 |
| IF-Z | sandy loam | 3.21 ± 0.25 | 60.70 ± 1.10 | 23.61 ± 1. 31 | 9.04 ± 0.58 | 2.85 ± 0.65 | 0.59 ± 0.20 | 2.50 ± 0.01 |
Note: U-BP stands for uncut black pine, C-BP stands for cut black pine, IF-Z stands for inter-forest zone.
Disclaimer/Publisher’s Note: The statements, opinions and data contained in all publications are solely those of the individual author(s) and contributor(s) and not of MDPI and/or the editor(s). MDPI and/or the editor(s) disclaim responsibility for any injury to people or property resulting from any ideas, methods, instructions or products referred to in the content. |
© 2023 by the authors. Licensee MDPI, Basel, Switzerland. This article is an open access article distributed under the terms and conditions of the Creative Commons Attribution (CC BY) license (https://creativecommons.org/licenses/by/4.0/).
Share and Cite
MDPI and ACS Style
Wu, C.; Tu, C.; Wang, Z.; Fan, J.; Lv, Z.; Fan, Y. The Effect of Clearing Diseased Wood on the Soil’s Physicochemical Properties in Black Pine Forests. Sustainability 2023, 15, 15980. https://0-doi-org.brum.beds.ac.uk/10.3390/su152215980
AMA Style
Wu C, Tu C, Wang Z, Fan J, Lv Z, Fan Y. The Effect of Clearing Diseased Wood on the Soil’s Physicochemical Properties in Black Pine Forests. Sustainability. 2023; 15(22):15980. https://0-doi-org.brum.beds.ac.uk/10.3390/su152215980
Chicago/Turabian StyleWu, Chuchen, Chengyi Tu, Zhengyu Wang, Jingjing Fan, Zhenglin Lv, and Ying Fan. 2023. "The Effect of Clearing Diseased Wood on the Soil’s Physicochemical Properties in Black Pine Forests" Sustainability 15, no. 22: 15980. https://0-doi-org.brum.beds.ac.uk/10.3390/su152215980
Note that from the first issue of 2016, this journal uses article numbers instead of page numbers. See further details here.