Article

Fiscal Expenditure Efficiency Measurement and Its Convergence Analysis on Aging Undertakings in China: Based on a Global Super-Efficiency Slacks-Based Measure Model

School of Public Administration, Dongbei University of Finance and Economics, Dalian 116025, China
*
Author to whom correspondence should be addressed.
Sustainability 2023, 15(3), 2486; https://0-doi-org.brum.beds.ac.uk/10.3390/su15032486
Submission received: 13 December 2022 / Revised: 9 January 2023 / Accepted: 11 January 2023 / Published: 30 January 2023
(This article belongs to the Topic Sustainability in Aging and Depopulation Societies)

Abstract

:
As the aging of China’s population continues to intensify as well as deepen, and fiscal support continues to increase, improving the efficiency of fiscal expenditure on aging undertakings has become the key to actively responding to the national strategy of sustainable population aging. This paper uses a global super-efficiency slacks-based measure model to measure the efficiency of fiscal expenditure on aging undertakings in China from 2011 to 2020. The results show, firstly, that the efficiency values are generally increasing. The eastern region’s fiscal expenditure efficiency has output deficiencies overall; all western, central, except Anhui, and northeast, except Jilin, provinces have input redundancies and output shortages. Secondly, the relatively effective provinces in terms of aging undertakings are mainly concentrated in the eastern coastal region; the number of effective provinces in the northeast is gradually increasing. Thirdly, excluding the eastern region, the efficiency values for all regions show a convergence trend; when controlling for region-specific influencing factors, the efficiency values of each region will converge to their respective steady-state levels. It is concluded that the trend in the fiscal management of aging undertakings in China is positive, and the levels of fiscal management as well as technology are higher in the east, lower in the west, less stable in the central, and more progressive in the northeast.

1. Introduction

Population aging profoundly impacts the long-term development of a country’s economy and society. Global population aging is continuously increasing. As the world’s most populous country, China has the largest elderly population in the world. By the end of 2021, China’s population of people aged 65 and older reached 201 million, accounting for about 27% of the world’s total population in that age range. In 2000, 2010, and 2020, the proportion of the population aged 65 and older to the total population of China was 7%, 8.87%, and 13.5%, respectively, with an average annual growth rate of 2.7% to 5.2% [1,2,3]. The aging of China’s population is becoming deeper and deeper.
Population size and age structure are important factors affecting social productivity, and China’s increasing proportion of elderly people will affect many aspects of the country’s economy and society, including the labor market, economic development, and the national fiscal system [4]. Zhang and Shi argue that China’s aging population is causing labor shortages and triggering demographic debt [5]. Feng finds that a retirement age system can reduce participation in the older workforce, and delayed retirement can in turn decrease intergenerational care and disadvantage younger generations’ labor supply [6]. At the same time, the decline in the health status of the elderly population will further worsen the labor supply, which is reflected in lower rates of individual participation in work, shorter working hours, and lower employment rates [7,8,9]. Considering that the labor force is an important variable affecting the potential growth rate of the economy, population aging is bound to act on economic development as well. Gordon and Wang find that population aging inhibits economic development in the United States and China [10,11]. Cao et al. find that population aging in China has a positive contribution to high-quality economic development, and this contribution gradually diminishes with deepening population aging [12]. In addition, there is regional heterogeneity between population aging and economic development in China, and economically developed regions are more likely to promote economic growth [13,14].
Population aging has equally profound implications for the national fiscal system. It has been shown that, on the one hand, population aging can inhibit the effectiveness of national fiscal policy. The reason for this is that population aging has increased social security expenditure dramatically, resulting in a sharp increase in the government’s budget deficit; at this point, it becomes difficult to expand government expenditure [15]. In addition, population aging affects personal consumption, investment, and employment, thereby dampening the effects of fiscal policy [16]. On the other hand, population aging affects fiscal sustainability. For example, studies on Australia, Canada, the United States, Europe, and Asia have found that a decline in the working-age population will lead to the shrinking of the government’s tax base [4,17,18], as well as a reduction in total labor supply and GDP, which will reduce government tax revenues [19]. Additionally, population aging will rapidly increase the size and proportion of government expenditure on social security and Medicare, leading to a continued rise in the fiscal deficit and government debt [20,21,22,23].
Actively responding to population aging is an important measure for resolving fiscal risks, improving fiscal sustainability, and enhancing peoples’ well-being. In the context of downward economic pressure, the impact of COVID-19, and deepening population aging, China’s fiscal revenue situation is more severe, and fiscal expenditure in the areas of public healthcare and elderly services is under more pressure. Based on existing research, the countermeasures mainly focus on two aspects: On the one hand, adjusting the tax system and fiscal structure, eliminating unreasonable benefits, raising the retirement age, encouraging the elderly to take up employment [20,22,24,25,26,27,28], increasing the consumption level of the elderly [29], and improving the efficiency of healthcare resources [30]. On the other hand, optimizing the existing fiscal support policies for aging undertakings and the elderly industry, i.e., using fiscal revenue tools, fiscal expenditure tools, and fiscal investment as well as financing tools to precisely support the development of the elderly services industry and social security for the elderly [31,32]; increasing the intensity of fiscal support and optimizing the structure of fiscal investment [33,34]; precisely positioning fiscal subsidies for the supply and demand of elderly services [35,36,37]; adjusting the methods of fiscal subsidies for personal accounts of urban and rural residents’ basic pension insurance [38]; and improving the mechanisms of government purchases of elderly home services [39,40].
Moreover, it is also important to improve the efficiency of fiscal funds in coping with population aging. At present, China’s fiscal funds with which to cope with population aging are mainly invested in elderly social security and elderly services. To ensure the sustainability of fiscal funds for aging, it is necessary to improve the efficiency of fiscal expenditure so that limited fiscal resources can be used more effectively and widely. Academic research on fiscal expenditure efficiency has become more mature, while aging-related research has focused on livelihoods. Studies have found that fiscal expenditure efficiency is generally better in the eastern and central regions of China than in western ones [41,42,43]; social security expenditure efficiency varies significantly between regions [44]; healthcare expenditure efficiency values are generally on the rise [45]; healthcare expenditure efficiency is generally higher in the central, western, and northeastern regions than in eastern ones [46]; and the fiscal expenditure efficiency of basic public services, including education, healthcare, and social security, has a clear trend of convergence within each region [47].
In addition, existing studies have mainly used DEA-CCR and BCC models, the two-stage DEA and DEA–Malmquist models to measure and analyze the supply efficiency of elderly care institutions as well as medical and nursing institutions [48,49,50]; a three-stage DEA model to measure and analyze the efficiency of fiscal expenditure on elderly services [51]; and a Malmquist model as well as robust DEA model to analyze and measure the efficiency of China’s basic pension insurance system [52,53,54]. DEA is called data envelopment analysis, proposed by the United States researchers Charnes et al; this method can be used to measure decision making unit (DMU) efficiency values. The DEA method has two classical models: the CCR model and the BCC model. The first DEA model was jointly created by Charnes, Cooper, and Rhodes [55], and the second DEA model was proposed by Banker, Charnes, and Cooper [56]. It can be seen that most studies on the efficiency of coping with population aging in China have focused on the supply of elderly institutions and the basic pension insurance system, and there is a lack of overall measurement and analysis of the efficiency of using fiscal funds to cope with population aging. In addition, concentration has been on the use of DEA-CCR and BCC models as well as DEA–Malmquist models; however, such models have comparative difficulties in intertemporal efficiency analyses.
In summary, this paper focuses its research theme on improving the efficiency of fiscal funds used to cope with population aging. Furthermore, the active response to population aging is to promote the synergistic development of the aging industry and aging undertakings. Generally speaking, the nature of aging undertakings belongs to governmental action activities of social public management, and the nature of the elderly industry mostly refers to the market economic activities of economic units. Aging undertakings are not only basic guarantees for the development of the elderly industry, but also an important channel through which the government safeguards the basic rights and interests of the elderly, as well as improving inclusive elderly services [57]. Therefore, this paper focuses on measuring and analyzing the efficiency of fiscal expenditure on aging undertakings in China. Moreover, to solve the difficulty of comparing efficiency values during this period, this paper relies on a super-efficiency slacks-based measure (SBM) model as well as global reference technique, and uses a global super-efficiency SBM model to measure the efficiency of fiscal expenditure in aging undertakings [58,59,60], also considering that there may be differences in efficiency within regions or between provinces in China. To address this issue, this paper introduces a convergence analysis method to investigate whether such differences persist. This method, which primarily checks whether differences between economies have decreased over time, has been commonly used in the analysis of the convergence of fiscal expenditure efficiency. This paper mainly measures and analyzes the fiscal expenditure efficiency and its convergence in China’s aging undertakings in order to fill the gap in existing studies on the efficiency of the use of fiscal funds in response to population aging, as well as to improve fiscal sustainability from the perspective of improving efficiency. This study on China not only provides a theoretical and mathematical basis for the formulation and optimization of fiscal policies to actively cope with population aging, but is also an important reference for other countries in the world.

2. Materials and Methods

2.1. Data Envelopment Analysis Method (DEA)

2.1.1. Super-Efficiency SBM Model

The classical models for DEA efficiency assessments are the CCR and BCC models; however, the values of effective DMUs in both traditional CCR and BCC models are 1, which are not able to be compared among multiple effective DMUs [61]. The super-efficiency model overcomes this drawback very well by reordering the effective DMUs, such that they are comparable with each other. The SBM model can solve the problem of the CCR and BCC models not being able to measure all slack variables, and can accurately measure the efficiency level of DMUs. Indeed, in the radial DEA model, the measure of the degree of ineffectiveness only includes the proportion of the equal proportional reduction (increase) of all inputs (outputs). For invalid DMUs, in addition to the equiproportional improvement component, the gap between its current state and the strongly effective target value also includes the slack improvement component, which is not reflected in the efficiency value measurement. Rather, the SBM model incorporates slack variables into inefficient DMU measurements [62]. Therefore, Tone (2002) proposed the super-efficient SBM model, which can solve both the efficiency ranking comparison and efficiency assessment accuracy problems for DMUs [58]. The model assumes that the technical efficiency of n DMUs needs to be measured, denoted as DMUj (j = 1,2, …, n). Each DMU has m inputs, and q outputs, denoted as x i , y r , ( i = 1 , 2 , , m ; r = 1 , 2 , , q ) . At this point, for SBM-efficient DMUK  ( K = 1 , 2 , , n ) , a super-efficient SBM model based on the variable returns to scale (VRS) assumption is given in Equation (1):
min ρ = 1 + 1 m i = 1 m s i x i k 1 1 q r = 1 q s r + y r k s . t . { j = 1 , j k n x j λ j s x k j = 1 , j k n y j λ j + s + y k j = 1 , j k n λ j = 1 λ j , s , s + 0 i = 1 , 2 , , m ; r = 1 , 2 , , q ; j = 1 , 2 , , n ( j k )
where ρ is the technical efficiency value measured based on the assumption of non-orientation; λ j denotes the input and output weights of the jth DMU; s , s + denote slack variables; s i is the input redundancy value of x i ; and s r + is the output deficiency value of y r . At this point, the set of production possibilities consisting of DMUs is as in Equation (2):
s = { ( x , y ) | x j = 1 n x j λ j , y j = 1 n y j λ j , λ 0 }
However, the super-efficiency SBM model mainly measures the relative efficiency of each DMU in a single period, and the efficiency values of each DMU in different periods are not comparable. Considering that this paper uses panel data, using the super-efficiency SBM model to measure efficiency values at this time would present a cross-period comparison challenge.

2.1.2. Global Reference Technique and DMU Cross-Period Evaluation

Panel data DMU intertemporal evaluation is generally found in Malmquist index analyses. At present, based on the adjacency reference, serial reference, fixed reference, window fixed reference, and global reference techniques, the DEA method can define the production frontier by constructing different sets of production possibilities to measure the Malmquist index of DMUs in each period, where the Malmquist indices measured based on the fixed reference, window fixed reference, and global reference techniques are transferable and can achieve interperiod evaluation and comparison among DMUs.
As far as the fixed reference data envelopment analysis method is concerned, the fixed reference technique takes the production possibility set determined by the input and output values of DMUs in a fixed period as the reference set and constructs the optimal production frontier surface to ensure that the frontier is fixed. The common reference set for each period is S f = { ( x j f , y j f ) } , and f is the number of 1—T, along with j = 1,2, …, n. On this basis, the analysis of changes in efficiency and technology is based on the same reference frontier [63]. At this time, the Malmquist index is M f ( x t + 1 , y t + 1 , x t , y t ) = E f ( x t + 1 , y t + 1 ) E f ( x t , y t ) ; however, using a fixed period as a reference set may have the disadvantage of insufficient information exploitation [64].
For the window fixed reference data envelope analysis method, which was first proposed by Charnes and Cooper in 1984, the basic idea is to place multiple-period DMUs in the same window based on a certain width, and the same DMU in the window can be regarded as multiple different DMUs [65]. Asmild et al. applied the window fixed reference data envelopment analysis method to the Malmquist model and used the data contained in the window to construct a reference set as well as determine the production frontier surface [66]. At this time, the Malmquist index is M w f = ( x t + 1 , y t + 1 , x t , y t ) = E w ( f ) ( x t + 1 , y t + 1 ) E w ( f ) ( x t , y t ) , in which the window is mainly determined by the window width (d) and the offset (f); the default window is composed of t and the d−1 periods which are before t, i.e., w ( t ) = { t , t 1 , , t d + 1 } ; in addition, moving the window can be done by setting an offset, f, i.e., w ( t ) = { t + f , t 1 + f , , t d + 1 + f } . The Malmquist index is not only transferable but also cumulative. However, there is ambiguity in the choice of window width, which limits its application. In addition, both the window and the fixed reference data envelopment analysis method have the problem of no feasible solutions for the VRS model.
In terms of the global reference data envelope analysis method, this method can solve the above-mentioned problems. The data envelopment analysis method based on the global reference technique takes the production possibility set formed by the input and output data of all periods containing DMUs, uses it to determine the production frontier surface, evaluates the efficiency of all DMUs under a uniform boundary, and finally obtains the Malmquist index [59]. At this point, the common reference set of DMUs for each period is s g = s 1 s 2 s p = { ( x j 1 , y j 1 ) } { ( x j 2 , y j 2 ) } { ( x j p , y j p ) } , where p is the number of periods, and the Malmquist index is M g ( x t + 1 , y t + 1 , x t , y t ) = E g ( x t + 1 , y t + 1 ) E g ( x t , y t ) . In conclusion, the Malmquist index based on the global reference data envelopment analysis method is transferable and recyclable, and can effectively avoid the problem of no feasible solutions as well as exclude the technical regression situation.

2.1.3. Global Super-Efficiency SBM Model

Based on the above analysis, the global reference technique can be applied to the super-efficiency SBM model. At this point, a global super-efficiency SBM model based on variable scale payments can be constructed for n DMUs with period T. Equation (3) represents the production possibility set that consists of DMUs. Equation (4) represents the global super-efficiency SBM model planning equation if DMUK is SBM-efficient at period t ( t = 1 , 2 , , T ). In conclusion, the global super-efficiency SBM model can solve the problem that the super-efficiency SBM model DMU efficiency values cannot be compared across periods and have no feasible solutions [67,68].
p s = { ( x , y ) | x τ = 1 T j = 1 n x j τ λ j τ , y τ = 1 T j = 1 n y j τ λ j τ , λ 0 }
min ρ g = 1 + 1 m i = 1 m s i k t x i k t 1 1 q r = 1 q s r k t + y r k t s . t . { τ = 1 T j = 1 ( j k   i f   τ = t ) n x j τ λ j τ s k t x k t τ = 1 T j = 1 ( j k   i f   τ = t ) n y j τ λ j τ + s k t + y k t τ = 1 T j = 1 ( j k   i f   τ = t ) n λ j τ = 1 λ j τ , s k t , s k t + 0 i = 1 , 2 , , m ; r = 1 , 2 , , q ; j = 1 , 2 , , n ; τ = 1 , 2 , T
where ρ g denotes the efficiency value, m is the number of input indicators, q is the number of output indicators, and j denotes the number of DMUs. x k t and y k t denote the inputs and outputs of DMUK at period t, while s k t and s k t + denote the slack variables of the inputs and outputs at period t; moreover, s k t and s k t + respectively represent the input redundancy value and the output deficiency value. λ j τ denotes the weights of inputs and outputs of the jth DMU at period τ. p s stands for the production possibility set.

2.2. The Convergence Analysis Method

2.2.1. The σ Convergence

Convergence generally refers to a state to which a certain indicator is gradually being approached in quantity or quality among different economies. In economics, convergence mainly includes σ convergence and β convergence. σ convergence describes a continuous decrease in the dispersion of an indicator between economies as time passes, as well as a tendency for individual differences to decrease. At this point, a σ convergence model can be used to analyze whether there is a convergence trend in the efficiency of fiscal expenditure on aging undertakings in China’s provinces; at this point, the σ convergence model can be expressed by Equation (5).
σ t = i = 1 N ( Y i t Y t ¯ ) 2 N Y t ¯
where Y i t refers to the efficiency of fiscal expenditure on aging undertakings in a province in period t, Y ¯ t denotes the average fiscal expenditure efficiency in all provinces at period t, and N indicates the number of provinces. A larger value of σ t indicates a divergent trend in expenditure efficiency, and vice versa a convergent trend.

2.2.2. The Absolute β Convergence

Absolute β convergence generally refers to the fact that different economies converge to the same steady-state level without considering exogenous influences. It also shows that the economic growth rate is negatively correlated with the initial level of economic development, and the economic growth rate in regions with a high initial level of economic development is slower than that in regions with a low initial level of economic development; as time passes, the economic differences between regions disappear and eventually reach the same steady-state level. Applying absolute β convergence to the analysis of the efficiency of fiscal expenditure on aging undertakings, at this point the absolute β convergence can be expressed by Equation (6):
ln ( Y i , t Y i , t 1 ) = β 0 + β 1 ln Y i , t 1 + ϑ i + η t + ε i t
where Y i , t denotes the efficiency of fiscal expenditure on aging undertakings in province i at time period t, ln ( Y i , t Y i , t 1 ) is the growth rate of the fiscal expenditure efficiency of aging undertakings in the province from period t−1 to t, β1 is the absolute convergence coefficient (when the value is negative and passes the significance test, it shows that there is absolute β convergence in the expenditure efficiency; when β1 passes the significance test as positive, it indicates that the fiscal expenditure efficiency of aging undertakings in each province is diverging), and ϑ t , η t , and ε i t denote the individual effect, time effect, and random disturbance term, respectively.

2.2.3. The Conditional β Convergence

In contrast to absolute β convergence, conditional β convergence assumes that, under the influence of many factors and regional heterogeneity, economies will not all converge to the same steady-state level over time, but will reach their stable growth rates and levels. To this end, conditional β convergence in the efficiency of fiscal expenditure on aging undertakings can be expressed by Equation (7):
ln ( Y i , t Y i , t 1 ) = β 0 1 + β 1 1 ln Y i , t 1 + δ c o n t r o l + ϑ i + η t + ε i t
where β 1 1 is the conditional convergence coefficient. When the value is negative and passes the significance test, it indicates that there is conditional β convergence, and vice versa it diverges. c o n t r o l denotes a set of control variables. δ is the control variable coefficient matrix.

3. Results

3.1. Selection of Input and Output Indicators

Clarifying input and output indicators is the basis and key to assessing the efficiency of fiscal expenditure on aging undertakings. Before the selection of indicators, it is necessary to reasonably define the connotations of aging undertakings. Aging undertakings refer to the non-profit-oriented public service activities that focus on elderly services and elderly social security, implemented or participated in by the government, emphasizing on ensuring the basic living and elderly care needs of senior, low-income, economically disadvantaged, and disabled elderly groups, and supporting the development of elderly services with an inclusive nature. The fiscal input indicators of aging undertakings mainly represent the government’s fiscal expenditure, while the output indicators mainly reflect the development of inclusive elderly services and social security for the elderly.

3.1.1. Input Indicator Selection

The government’s fiscal input funds for aging undertakings are mainly derived from the general public budget and governmental fund budget. For the general public budget, its fiscal subsidies to the basic pension insurance fund, old-age welfare, aging affairs (including aging health and elderly services), and administrative as well as institutional retirement expenditure accounts (collectively referred to as fiscal aged expenditure) are the most intuitive reflections of the fiscal investment in aging undertakings. On the one hand, the expenditure on aging affairs can reflect the fiscal subsidy expenditure on elderly services, including supporting elderly service institutions to provide home community elderly services, providing operation and construction subsidies to private non-profit elderly service institutions, providing construction, repair, and renovation subsidies to public elderly institutions, and covering the work expenses related to aging affairs. On the other hand, fiscal subsidies to the basic pension insurance fund include fiscal subsidies to enterprise employees and urban as well as rural residents, which are an important source of income for the basic pension insurance fund; elderly welfare expenditure, including funding subsidies for the provision of basic old-age service protection in financial difficulties, such as the elderly and disabled people; and expenditure on administrative and public institutions’ retirement, mainly for the retirees of such institutions. The above expenditures can reflect the government’s fiscal investment in social security for the elderly.
As far as governmental fund budgets are concerned, based on policy requirements, no less than 50% of local government social welfare lottery funds have been used to support the development of elderly services in recent years, with a focus on supporting the expansion of the coverage of inclusive elderly services. Based on this, the local government’s fiscal aged expenditure and its 50% portion of social welfare lottery funds (referred to as welfare lottery funds, as below) basically cover the financial funds needed to support the development of elderly services and social security for the elderly, which can be used as an input indicator for the efficiency of fiscal expenditure on aging undertakings.

3.1.2. Output Indicator Selection

This paper mainly relies on the “12th Five-Year Plan” for the development of China’s aging undertakings and the “13th Five-Year Plan” for the development of national aging undertakings and the construction of the elderly care system to determine the output indicators, and also refers to Fan and Wang’s, as well as Zeng and Zhao’s, related studies [69,70]. The indicators include the number of employees in registered elderly institutions, the total number of elderly institutions and facilities, the number of beds per 1000 elderly people, the number of urban workers’ pension insurance participants, the number of urban and rural pension insurance participants, and the per capita pension level, where the number of registered elderly institutions’ employees, the total number of elderly institutions and facilities, and the number of beds per 1000 elderly people can reflect the development of the construction of elderly institutions as well as facilities and the supply of inclusive elderly service resources, the number of urban workers’ pension insurance participants, and the number of urban and rural pension insurance participants. The per capita pension level can reflect the pension insurance participation and distribution, as well as present the current situation of social security for the elderly.

3.1.3. Data Sources

Considering that most provinces did not disclose the fiscal aged expenditure data from 2011 to 2020, this paper obtains them through the way of requesting government information disclosure, while other data are mainly obtained from the “China Statistical Yearbook “, the “China Civil Affairs Statistical Yearbook”, the “China Social Statistical Yearbook”, and the Government Budget and Final Accounts Public Platform The statistical description of the data is shown in Table 1.

3.2. Efficiency Measurement and Analysis

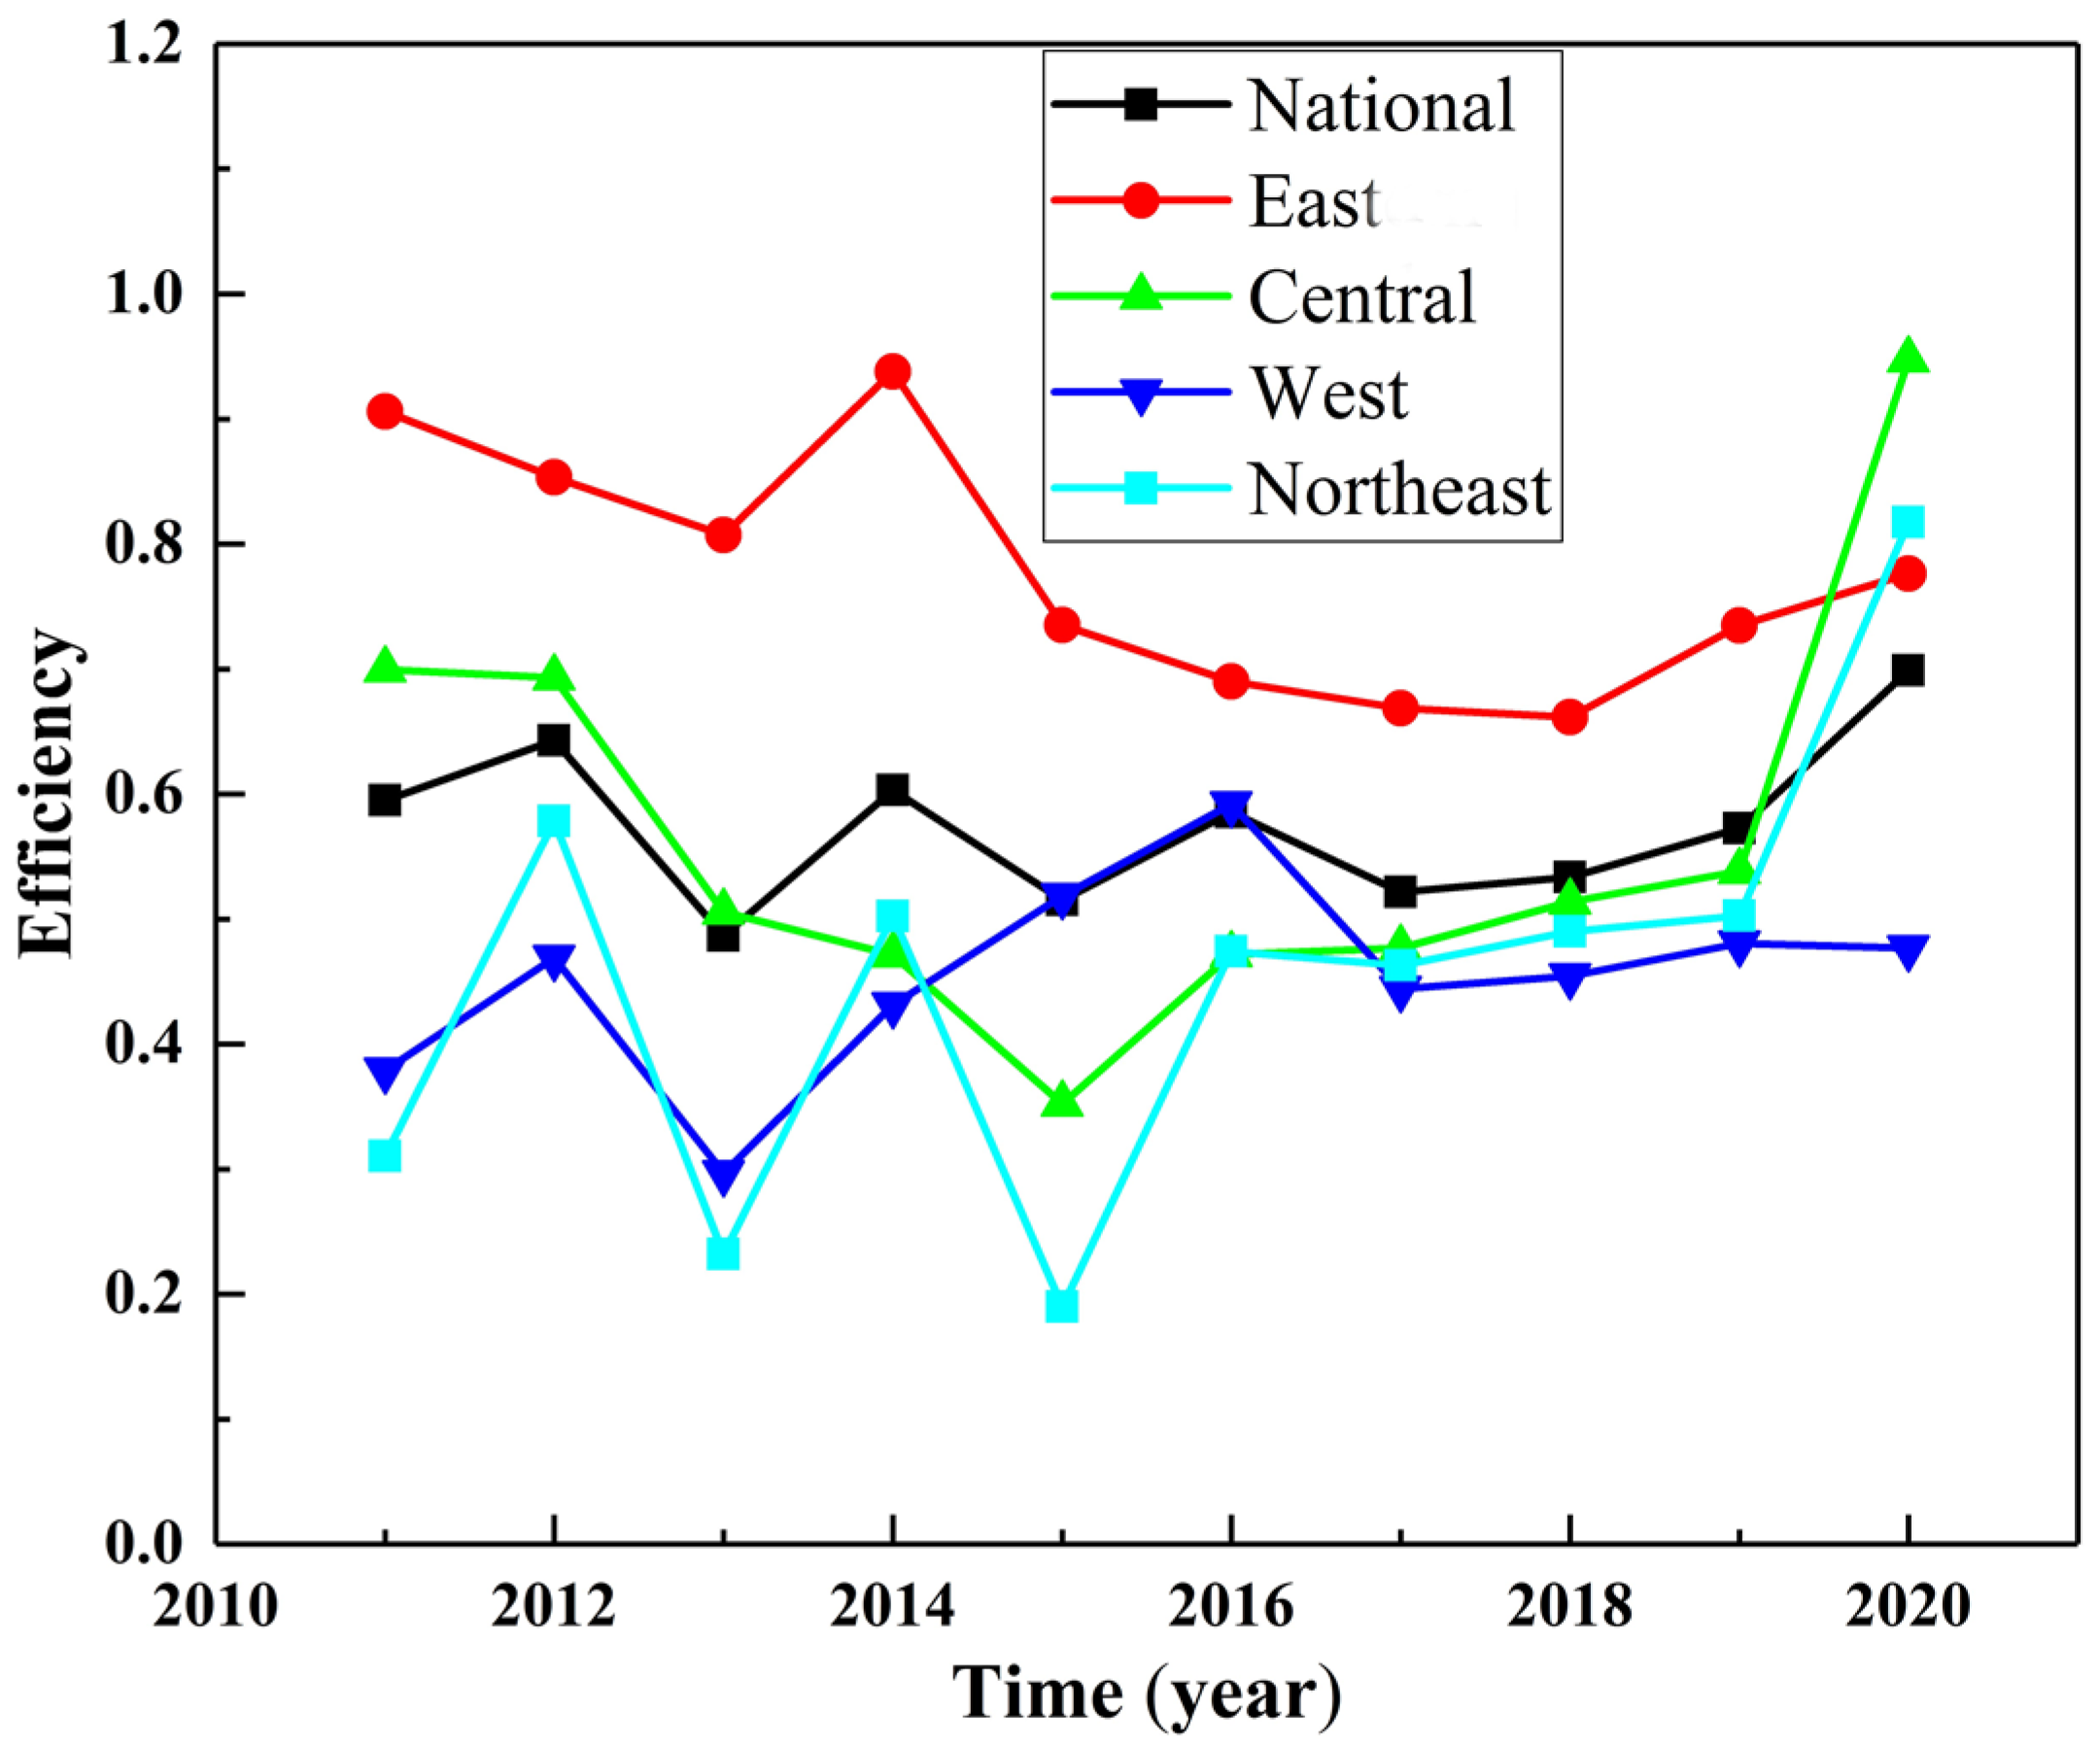
3.2.1. Time Trend Analysis

This paper is based on the global super-efficiency SBM model (Equation (4)), substitutes input and output data (Table 1) into MATLAB2020 software, measures the efficiency of fiscal expenditure on aging undertakings in 26 provinces of China from 2011 to 2020, and summarize them by category.
The time trend of the efficiency of fiscal expenditure on aging undertakings is shown in Figure 1. By region, the efficiency of fiscal expenditure on aging undertakings in the eastern region is generally in a decreasing trend, while it is basically in an increasing state after 2017, in which the average value of efficiency in 2011 is 0.91, higher than that of the central, western, and northeastern regions, as well as the national average; in 2020, the efficiency value drops to 0.78, higher than that of the western region and the national average. The possible reasons for this are, firstly, the fact that the overall efficiency level of fiscal expenditure on aging undertakings in the eastern region is higher than that in other regions, the fiscal management level and technical level of aging undertakings have been improved to a lesser extent, and the growth rate of the efficiency value is much lower than that in other regions, resulting in a relative decrease in the efficiency value of fiscal expenditure in the eastern region. Secondly, the increase in the number of beds per 1,000 elderly people from 2011 to 2020 is similar to the trend in changing efficiency values in the eastern region. The increase in this output indicator decreases annually between 2014 and 2018, after which it increases, suggesting that changes in the number of beds per 1000 elderly may be the key to the impact.
From 2011 to 2020, the efficiency of fiscal expenditure on aging undertakings in the central region shows the evolution of “continuous decrease—continuous increase”, with the lowest efficiency value dropping to 0.35 in 2015 and the highest efficiency value reaching 0.95 in 2020, which is higher than the average level in the east, west, northeast, and the whole country. From 2011 to 2020, the efficiency of fiscal expenditure on aging undertakings in the northeast region shows the evolution of “dynamic fluctuation-continuous improvement”, with the lowest efficiency value dropping to 0.19 in 2015 and the highest efficiency value reaching 0.82 in 2020, which is higher than the average level of the east, west, and the whole country. The overall efficiency in the western region from 2011 to 2020 shows a steady fluctuating upward trend, in which the efficiency value in 2020 is 0.48, which is lower than the average level in the east, central, northeast, and the whole country. By comparing the temporal trends in input and output indicators, it is found that the increase in the number of employees in registered elderly institutions is consistent with the changing trend in the efficiency value in the central region, indicating that the change of this indicator is the main reason for the evolution of the central region; the change of the total number of elderly institutions and facilities is an important influence factor in the northeast and west regions.
At the national level, the efficiency of national fiscal expenditure on aging undertakings has generally been fluctuating and increasing since 2011–2020, with a clear trend of continuous increase after 2016, indicating that both the level and technology of the Chinese government’s fiscal management of aging undertakings have been developing in a good direction in recent years, also indicating that the Chinese government has become more active and proactive in actively addressing the issue of population aging. In addition, combining the time trends of the efficiency of fiscal expenditure on aging undertakings at the regional and national levels, the overall efficiency of fiscal expenditure on aging undertakings showed a downward fluctuation from 2011 to 2015, and basically showed a steady increase after 2016. This phenomenon may be related to the reform of China’s fiscal management system. The years 2011–2015 saw the implementation phase of China’s “12th Five-Year Plan”, which involved the reform of the taxation system, the improvement of the budget management system, and the adjustment of the fiscal relationship between the central and local governments; this round of fiscal reform was basically completed in 2016 with key work and tasks. For this reason, the period before 2016 is in the stage of reform promotion and tackling difficulties, and there may be efficiency losses in the reform process.

3.2.2. Input–Output Redundancy Analysis

From the time trend analysis of the efficiency of fiscal expenditure on aging undertakings, it is clear that the average value of efficiency in the east, central, west, and northeast, as well as national aging undertakings, from 2011 to 2020 has not reached relative efficiency. To this end, input redundancy and output deficiency analyses were conducted to explore efficiency improvement channels. Where input redundancy and output deficiency are expressed as input redundancy rates and output deficiency rates, input redundancy rates = input redundancy value/input and output deficiency rates = output deficiency value/ output, see Table 2.
As far as the eastern region is concerned, Shandong Province is relatively efficient in terms of fiscal expenditure on aging affairs, with no input redundancies or output shortages. Guangdong, Hebei, Jiangsu, and Zhejiang do not have input redundancies; Guangdong has output deficiencies in the number of workers in registered elderly institutions and the total number of elderly institutions and facilities; and Hebei, Jiangsu, and Zhejiang have output deficiencies in terms of per capita pension expenditure or the total number of elderly institutions and facilities. There are no input redundancies in Hainan and Shanghai, but there is a clear output deficit, which is more evident in the number of urban and rural pension insurance participants in addition to the total number of pension institutions and facilities. There are input redundancies in Tianjin’s welfare lottery funds expenditures and there is a shortfall in each output indicator, except for beds per 1000 elderly indicators. In summary, there are no significant input redundancies in the eastern region overall, but there are varying degrees of output deficiencies. At this point, with no change in investment, focusing on increasing the number of urban and rural pension insurance participants as well as the total number of pension institutions and facilities is conducive to improving the efficiency in the eastern region.
In terms of the central region, there are no input redundancies in both the fiscal pension and welfare lottery funds in Anhui Province, and there is a more significant output shortfall in the total number of institutions and facilities for the elderly indicators. There are input redundancies in Henan and Jiangxi only for welfare lottery funds, as well as more obvious input redundancies in Hunan and Shanxi; Hunan, Shanxi, and Jiangxi have obvious output deficits in the total number of institutions and facilities for the elderly and per capita pension expenditure. In summary, all provinces in the central region, except Anhui, should focus on reducing the redundancies in welfare lottery funds or increasing the total number of elderly institutions and facilities, as well as the level of per capita pension spending, to improve the efficiency of fiscal expenditure on aging undertakings.
In terms of the western regions, Guizhou, Inner Mongolia, Ningxia, Qinghai, Xinjiang, and Yunnan only have redundant welfare lottery funds inputs; Guizhou and Yunnan have more obvious output deficiencies in all output indicators, except for the number of urban and rural pension insurance participants, Inner Mongolia has output deficiencies in all output indicators, except for the number of beds per 1000 elderly people, and Ningxia as well as Qinghai both have obvious deficiencies in the number of employees in registered pension institutions in addition to the number of urban and rural pension insurance participants, the total number of pension institutions and facilities, and the output indicator of per capita pension expenditure. Gansu, Guangxi, Shaanxi, and Sichuan have significant input redundancies and output deficiencies, and Sichuan only has significant output deficiencies in the number of registered nursing institution workers, the total number of nursing institutions and facilities, and the per capita pension expenditure output indicators. In summary, the western provinces have different degrees of input redundancies and output shortages. Reducing the redundancies of welfare lottery funds inputs and increasing the number of registered nursing institution workers, the total number of nursing institutions and facilities, and per capita pension expenditure are the keys to improving the efficiency of fiscal expenditure on aging undertakings.
In the northeast region, input redundancies exist in both Heilongjiang and Liaoning, except for Jilin, where there are no redundancies in inputs. Jilin has significant output deficiencies in regard to the issues of the total number of pension institutions as well as facilities and per capita pension expenditure, while Heilongjiang and Liaoning have significant output deficiencies in the output indicators of the number of urban and rural pension insurance participants, the total number of pension institutions and facilities, and per capita pension expenditure, among which the output deficiency of a total number of pension institutions and facilities is more obvious. In summary, except for Jilin Province, Heilongjiang and Liaoning need to reasonably regulate financial investments in old-age and welfare lottery funds while also focusing on expanding the number of urban and rural old-age insurance participants, the total number of old-age institutions and facilities, and per capita pension outputs. At the national level, reducing the redundancies of inputs, especially the redundancies of welfare lottery funds, while increasing the total number of pension institutions as well as facilities and per capita pension outputs, remains the focus of improving the efficiency of fiscal expenditure on aging undertakings.

3.2.3. Spatial and Temporal Distribution Characteristics Analysis

This section examines the spatial and temporal distribution characteristics of the efficiency of fiscal expenditure on aging undertakings in 26 provinces of China in 2011, 2014, 2017, and 2020 using 3-years periods, as shown in Figure 2.
The relatively effective provinces in terms of the efficiency of fiscal expenditure on aging undertakings are mainly concentrated in the eastern coastal region. This result is consistent with the characteristics of the regional distribution of the efficiency of fiscal expenditure on basic public services [47]. In terms of spatial and temporal distributions, in 2011, 2014, 2017, and 2020 the efficiency of fiscal expenditure on aging in Guangdong and Zhejiang is greater than 1, reaching relative effectiveness; Shandong and Jiangsu have efficiency values greater than 1, except for 2017, with efficiency values of 0.98 and 0.96, respectively; and Hebei has efficiency values greater than 1 in all years except for 2011, with an efficiency value of 0.57, basically in relative effectiveness. These results indicate that the fiscal management and technical levels of aging undertakings are higher in the eastern region, especially in Guangdong, Zhejiang, Shandong, Jiangsu, and Hebei, and that the levels of economic development, science and technology, and government governance in this region are generally higher.
The efficiency of fiscal expenditure on aging undertakings in the northeast is gradually increasing in the provinces. In 2011, the efficiency values in the three northeastern provinces were below 0.66; in 2014 and 2017, the efficiency values of fiscal expenditure in Jilin Province were 1.02 and 1.01, which were greater than 1 and reached a relatively efficient state of efficiency; and in 2020, the efficiency values of Heilongjiang and Jilin were 1.02 and 1.01, which both reached a relatively efficient state, and the efficiency value of Liaoning also rose from the first interval to the second interval. The possible reasons for this are that the three northeastern provinces have more seriously aging populations, lower levels of fiscal revenue, and are under greater fiscal pressures. The coexistence of fiscal pressure and the challenges of aging populations has pushed governments to continuously improve the fiscal management and technology of aging undertakings.
There are more effective provinces in the central region than in the western region. In 2020, the efficiency values of the central provinces Anhui, Henan, Jiangxi, and Hunan were 1.03, 1.03, 1.20, and 1.00, respectively, being relatively effective. The efficiency statuses were unstable, and, except in Henan and Shanxi Provinces, the efficiency values of each province varied between being relatively effective and ineffective in other years. In the western provinces of Sichuan and Guizhou, there exists relative effectiveness; Sichuan’s efficiency has improved significantly, with an efficiency value of 0.30 in 2011 and reaching 1.01 in 2020. The possible reasons for this are that Sichuan ranks third in the country in terms of the size and proportion of the elderly population in the “7th Population Census”, it has a large degree of social aging, it is a large province in terms of its population, economy, and resources, with high fiscal pressure, and that it receives the highest amount of transfer payments from the central government each year, driving its efficiency of fiscal expenditure on aging undertakings to continue to improve. The efficiency in Xinjiang, Qinghai, and Inner Mongolia has not undergone significant improvements, and the region’s general level of economic development, relatively poor geographic and climatic conditions, average transportation conditions, and numerous ethnic minorities may limit the improvement of its fiscal expenditure level on aging undertakings.

3.3. Efficiency Convergence Analysis

3.3.1. σ Convergence Test and Analysis

Equation (5) was used as a basis to measure the σ values of the efficiency of fiscal expenditure on aging undertakings from 2011 to 2020; see Figure 3. At the national level, σ values are generally in a state of dynamic fluctuation, but after 2017 σ values keep decreasing and show a basic convergence trend. On a regional level, the σ values in the northeast and central regions show dynamic fluctuations in general, but the σ values keep decreasing after 2017, showing a basic convergence trend in the provinces within the region. The overall σ value in the eastern region increases gradually from 0.26 to 0.48 between 2011 and 2020, which is the lowest value in the “13th Five-Year Plan” period. In the eastern region, the overall σ value gradually increases from 0.26 to 0.48, with a basic dispersion. The σ value in the western region shows a fluctuating decrease with a convergence trend. Combining the time trend of the efficiency of fiscal expenditure on aging undertakings (Figure 1), it can be seen that, except for the eastern region, the efficiency value of fiscal expenditure on aging undertakings in each region gradually tends to be effective, with an overall upward convergence trend.

3.3.2. Absolute β Convergence Test and Analysis

Equation (6) is a panel static model. Estimating this type of model requires a choice between a random effects regression model as well as a fixed effects regression model. Therefore, in this paper, the Hausman test is conducted on the above model, and the test results significantly reject the original hypothesis, indicating that a fixed effects regression model should be selected. In addition, this paper also conducts a joint significance test for time effects, and the test results show that there is a significant time effect in the panel model. In summary, this paper adopts a panel two-way fixed effects regression model and uses Stata 16 software, based on the data of the values of the efficiency of fiscal expenditure on aging undertakings, to regress Equation (6). Table 3 gives the regression results of absolute β convergence for the efficiency of fiscal expenditure on aging undertakings from 2011 to 2020. From the results, it can be seen that the β convergence coefficients at the east, central, west, northeast, and national levels are all significantly negative at a 1% significance level, indicating that absolute β convergence exists in all regions, i.e., the provinces with low levels of efficiency of fiscal expenditure on aging undertakings have larger efficiency growth rates, and the differences in efficiency between provinces gradually decrease and reach the same steady-state level over time.

3.3.3. Conditional β Convergence Test and Analysis

(1) Control variable selection
In this paper, fiscal pressure (FP), economic development level (GDP), population density (PD), urbanization rate (UR), old-age dependency ratio (ADR), real per capita disposable income (PCI), and real per capita transfer payment (RT) are introduced as control variables in the conditional β convergence model. Among them, FP is expressed as (general public budget expenditure−general public budget revenue)/general public budget revenue; the GDP, PCI, and RT are deflated using 2010 as the base period; PD is expressed as the number of people per square kilometer, reflecting the sparseness of the geographical distribution of the population; the ADR expresses the elderly population aged 65 and above/working population, measuring the social consequences of population aging; and the UR expresses the urban population/total population, measuring the level of regional urbanization. The data are mainly derived from the wind database, the “China Statistical Yearbook”, the “China Financial Yearbook”, and various local statistical yearbooks.
(2) Analysis of the results of the conditional β convergence test
In this paper, the Hausman test and the joint significance test of time effects indicate that we should use a panel two-way fixed effects regression model. For this reason, we use Stata 16 software, based on Equation (7), to conduct a regression analysis of the growth rate of the efficiency of fiscal expenditure on aging undertakings in each province of China from 2011 to 2020, as shown in Table 4. After adding the control variables, there is a significant negative correlation between the expenditure efficiency and the growth rate of expenditure efficiency in the east, central, west, northeast, and the whole country at a 1% significance level, which passes the conditional β convergence test, indicating that with other heterogeneous influencing factors the efficiency of fiscal expenditure on aging undertakings both nationally and within each region develops toward their respective steady-state levels, and this result is consistent with the convergence trend of the efficiency of fiscal expenditure on basic public services [47].
In addition, compared to the absolute β convergence coefficient, the absolute values of conditional β convergence coefficients are larger for the national, eastern, central, and western regions, indicating that the efficiency of fiscal expenditure on aging undertakings converges faster after considering heterogeneity as well as control variables, among which the eastern region converges the fastest and the central region converges the slowest. There is significant regional heterogeneity in the factors affecting the convergence of the efficiency of fiscal expenditure on aging undertakings in the national, east, central, west, and northeast regions.
At the national level, FP, GDP, PD, UR, PCI, and RT significantly affect the fiscal expenditure efficiency growth rate at significance levels of 10%, 5%, 1%, 5%, 10%, and 5%, respectively. On the one hand, PD and PCI significantly and negatively affect the growth rate of fiscal expenditure efficiency, indicating that increasing PD and PCI will prevent the efficiency of fiscal expenditure on aging undertakings from converging to a higher steady-state level, but has a facilitating effect on narrowing the fiscal expenditure efficiency between localities. Possible reasons for this are the higher complexity of the implementation of the government’s aging undertakings in regions with a higher PD, a greater density of the elderly population, and the need to face more complex public issues such as elderly care, medical care, and the construction of environmentally friendly cities for the elderly, which makes the development of the government’s aging undertakings more difficult and reduces the rate of improvement in the efficiency of fiscal expenditure, and a greater demand for higher pension levels in regions with a high PCI, which can lead to insufficient outputs. On the other hand, FP, GDP, UR, and RT are positively correlated with the growth rate of the efficiency of fiscal expenditure on aging undertakings, indicating that increasing such influencing factors will promote the fiscal expenditure efficiency to converge to a higher steady-state level, but have a suppressive effect on narrowing the fiscal expenditure efficiency among localities. Possible reasons for this are that local governments with a higher FP have more incentives to improve fiscal expenditure efficiency; higher governance capacity and means of governance in areas with a higher GDP and UR, as well as greater RT, are conducive to the effective exercising of local governments’ responsibility for underwriting, which in turn improves the efficiency of fiscal expenditure on aging undertakings.
By region, control variables such as FP and GDP have significant heterogeneity effects on the efficiency of fiscal expenditure on aging undertakings in the east, central, west, and northeast. Only the UR in the eastern region significantly and positively affects the growth rate of the efficiency of fiscal expenditure on aging undertakings at a 1% significance level, indicating that an increase in UR significantly promotes the efficiency of fiscal expenditure on aging undertakings in the eastern provinces, but has a suppressive effect on the differences in fiscal expenditure efficiency in the provinces within the region. This may be because the urbanization process in the eastern region is the earliest and the government governance level as well as capacity are higher, which is conducive to the improvement of the efficiency of fiscal expenditure on aging undertakings in the region. At the same time, the difference in UR in the eastern region is a contributing factor to the disparity in fiscal expenditure on aging among provinces.
None of the control variables have a significant effect on the efficiency of fiscal expenditure on aging undertakings in the central region. The GDP in the western region significantly and positively affects the efficiency of fiscal expenditure at a 10% significance level, in addition to promoting the convergence of the efficiency of fiscal expenditure on aging undertakings to higher values. It can also greatly increase local government revenue, optimize the structure of fiscal expenditure, and further improve the efficiency of government fiscal expenditure. In addition, the disparity in GDP in the western region is a contributing factor to the disparity in the efficiency of fiscal expenditure on aging undertakings between provinces. The PCI in the northeast region significantly and negatively affects the efficiency of fiscal expenditure on aging undertakings at a 10% significance level, while FP, GDP, PD, and UR significantly and positively affect the efficiency of fiscal expenditure at 5%, 5%, 5%, and 10% significance levels, respectively. Among them, for PD, the northeast region is a region with more serious population loss and has a lower PD; at this time, increasing PD is conducive to achieving scale effects and improving government expenditure efficiency. In summary, it can be seen that the factors influencing conditional β convergence are different in each region, and the plans as well as policies to improve the efficiency of fiscal expenditure on aging undertakings should be specified differently.

4. Conclusions

This study uses 2011–2020 data to measure the efficiency of fiscal expenditure on aging undertakings in 26 provinces of China based on the DEA global super-efficiency SBM model and tests the σ convergence, absolute β convergence, and conditional β convergence; the main findings are as follows.
First, the overall fiscal management level and technical level of aging undertakings in the eastern region are higher, and the efficiency gap among provinces needs to be narrowed. The overall fiscal expenditure efficiency level for aging undertakings in the eastern region is higher than that of the northeast, central, and western regions, as well as the national average. However, in the eastern region, there is σ divergence in the efficiency of fiscal expenditure on aging undertakings; for this reason, narrowing the gap in the efficiency of fiscal expenditure within the region should be the focus of efforts, especially to narrow the difference in the level of urbanization within the region and improve the management and technical levels of fiscal funds in lagging provinces.
Second, the central region’s fiscal management level and technical level of aging undertakings are not stable enough. Except for the eastern region, the overall level of the efficiency of fiscal expenditure on aging undertakings in the central region is high, and the efficiency value converges to the effective level, i.e., there is σ convergence, absolute β convergence, and conditional β convergence. However, the efficiency values of provinces such as Hunan and Jiangxi fluctuate between relatively effective and ineffective under the time trend. For this reason, it is important to maintain the smooth fluctuation of efficiency values between relatively effective and ineffective in each province, optimize the fiscal support inputs, and improve the outputs of aging undertakings, focusing on improving the fiscal management and technical levels of some ineffective provinces, such as Shanxi.
Third, the western region’s aging undertakings’ fiscal management and technical levels, in general, are low. They show a trend towards convergence at the effective level, i.e., there is σ convergence, absolute β convergence, and conditional β convergence. However, except for Sichuan, Guizhou, and Ningxia, where the fiscal expenditure efficiency is relatively effective in some years, other provinces are basically ineffective. For this reason, it is important to improve the efficiency of fiscal expenditure on aging undertakings in the western provinces in general, optimize the financial support inputs, and improve the outputs.
Fourth, the fiscal management and technical levels of aging undertakings in the northeast region have progressed more. The average growth rate of the efficiency of fiscal expenditure on aging undertakings in the northeast region is 5.1%, and the trend in efficiency improvement as well as convergence is obvious. For this reason, maintaining the current trend and level of expenditure efficiency improvements should be the focus for actively coping with population aging.

5. Policy Recommendations

The policy recommendations in response to the above conclusions mainly concern two aspects.
On the one hand, they emphasize the improvement of the efficiency of fiscal expenditure on aging undertakings and constantly optimize the fiscal inputs and outputs. The study shows that, from 2011 to 2020, the mean values of the efficiency of fiscal expenditure on aging undertakings in the east, central, west, northeast, and the whole country are 0.78, 0.57, 0.45, 0.46, and 0.58, respectively, which are in a relatively inefficient state. To do this, first, at the national level, while further improving the level of government fiscal management, expanding government information disclosure, strengthening budget supervision, improving government effectiveness, and optimizing the fiscal expenditure structure for aging undertakings, we should reasonably regulate the fiscal expenditure on the elderly and the social welfare lottery funds for aging undertakings, optimize and adjust the fiscal support policy system for aging undertakings, and formulate more effective fiscal support as well as incentive policies, focusing on expanding the talent pool for elderly services, increasing the total number of elderly institutions and facilities, and raising the per capita pension level. Second, at the regional level, while maintaining the steady improvement in the efficiency of fiscal expenditure on aging undertakings in the eastern and central regions, we should focus on adjusting the fiscal inputs and outputs in the western and northeastern regions, specifically including the reasonable regulation of the expenditure on welfare lottery funds for the elderly, focusing on increasing the total number of elderly institutions and facilities, as well as the level of pensions per capita. Third, at the intraregional level, we should focus on provinces with low efficiencies of fiscal expenditure on aging undertakings, such as Xinjiang, Yunnan, Liaoning, Gansu, Shanxi, and Shaanxi, as well as guide active interaction, cooperation, and exchange among provinces to further increase the sharing of technology, resources, and experience, including the use of social welfare funds for aging undertakings, the construction of elderly institutions and facilities, and the improvement of the per capita pension level among provinces, to drive provinces with low efficiencies of fiscal expenditure on aging undertakings to make continuous improvements.
On the other hand, zonal policies and the development of aging undertakings should be tailored to local conditions. Considering that there are large differences in economic, social, and natural resource endowments among provinces, this study found that there are large differences in σ convergence, absolute β convergence, and conditional β convergence in the east, central, west, and northeast; the eastern region should take advantage of its high urbanization rate to narrow the gap between provinces in terms of fiscal management level and technical level, further improve the policy of supporting talents for the development of aging careers and elderly industries, and attract elderly services- and nursing-oriented talents to join elderly services institutions in addition to medical and nursing institutions. In the western region, economic development should drive the development of aging undertakings, and, based on economic development as the main goal, promote scientific and technological innovation, technological progress, focus on the development of the digital economy, and promote the improvement of the efficiency of fiscal expenditure on aging undertakings by improving the management level and technological progress. In the northeastern region, the improvement of the efficiency of fiscal expenditure on aging undertakings needs to deal with the relationship between population size and population structure, and should further strengthen the policy of fertility promotion in addition to solving the problem of “one old man, one small child”, improving the policy of attracting and retaining talents at the same time.
Due to the difficulty in obtaining data, the data analysis was limited to 26 provinces in China. In the future, we will strive to further expand the research group as well as include the Hong Kong and Macao Special Administrative Regions, Taiwan and Hubei Provinces, and other provincial-level administrative regions, so as to better grasp the efficiency of the use of fiscal support funds for population aging.

Author Contributions

Conceptualization, J.Z. and L.Z.; methodology, L.Z.; software, L.Z.; validation, J.Z. and L.Z.; formal analysis, L.Z.; investigation, L.Z.; resources, L.Z.; data curation, L.Z.; writing—original draft preparation, L.Z.; writing—review and editing, L.Z.; visualization, L.Z.; supervision, J.Z.; project administration, L.Z.; funding acquisition, J.Z. All authors have read and agreed to the published version of the manuscript.

Funding

This research was funded by the Key Project of Basic Scientific Research in Colleges and Universities of the Liaoning Provincial Department of Education, grant number LJKZZ20220129.

Institutional Review Board Statement

Not applicable.

Informed Consent Statement

Not applicable.

Data Availability Statement

The dataset generated and analyzed in this study is not publicly available; however, the dataset is available from the corresponding author on reasonable request.

Conflicts of Interest

The authors declare no conflict of interest.

References

  1. National Bureau of Statistics. Bulletin of the Fifth National Census. 2000. Available online: http://www.stats.gov.cn (accessed on 11 October 2022).
  2. National Bureau of Statistics. Bulletin of the Sixth National Census. 2010. Available online: http://www.stats.gov.cn (accessed on 11 October 2022).
  3. National Bureau of Statistics. Bulletin of the Seventh National Census. 2020. Available online: http://www.stats.gov.cn (accessed on 11 October 2022).
  4. Liu, B.; Yang, Z. Population Aging Shock and Fiscal Sustainability in China: Mechanism Analysis and Effect Simulation. Singap. Econ. Rev. 2021, 66, 1687–1708. [Google Scholar] [CrossRef]
  5. Zhang, P.; Shi, M.C. From Demographic Dividend to Demographic Debt: A Study on Demographic Transition in the New Development Stage. Jianghuai Tribune 2021, 20–27. [Google Scholar] [CrossRef]
  6. Feng, J. Population Aging, Social Insurance and Impact on the Labor Market. China Econ. Stud. 2019, 15–33. [Google Scholar] [CrossRef]
  7. Cristea, M.; Noja, G.G.; Stefea, P.; Sala, A.L. The Impact of Population Aging and Public Health Support on EU Labor Markets. Int. J. Environ. Res. Public Health. 2020, 17, 1439. [Google Scholar] [CrossRef] [PubMed] [Green Version]
  8. Blundell, R.; Britton, J.; Dias, M.C.; French, E. The Impact of Health on Labor Supply Near Retirement. J. Hum. Resour. 2021, 58, 1217-9240. [Google Scholar] [CrossRef]
  9. Zhu, C.; Wang, R. Labor Supply under Health Shock: Based on the Perspective of Population Aging. Discussion on Modern Economy. Mod. Econ. Res. 2022, 1–13. [Google Scholar] [CrossRef]
  10. Gordon, R.J. The Rise and Fall of American Growth; Princeton University Press: Princeton, NJ, USA, 2017; pp. 12–31. [Google Scholar]
  11. Wang, W. Population Aging, Birth Policy Adjustment and Chinese Economic Growth. China Econ. Q. 2017, 16, 67–96. [Google Scholar] [CrossRef]
  12. Cao, C.L.; Xiao, G.A.; Xu, S.R.; Zhou, X.Y. The Impact of Population Aging on High-Quality Economic Development: From the Perspective of Financial Sustainability. Financ. Theory Pract. 2022, 43, 114–122. [Google Scholar]
  13. Chen, Q.; Chi, Q.; Chen, Y.; Lyulyov, O.; Pimonenko, T. Does Population Aging Impact China’s Economic Growth? Int. J. Environ. Res. Public Health. 2022, 19, 12171. [Google Scholar] [CrossRef]
  14. Song, J.Y.; Gao, C.S. The Impact of Population Aging on Economic Growth and Mechanism Analysis: Based on the Perspective of Labor Supply and Social Security Expenditure. Inquir. Econ. Issues 2022, 43, 1–18. [Google Scholar]
  15. Yoshino, N.; Miyamoto, H. Declined Effectiveness of Fiscal and Monetary Policies Faced with Aging Population in Japan. Jpn. World Econ. 2017, 42, 32–44. [Google Scholar] [CrossRef]
  16. Luo, M.J.; Long, T. How Population Aging Affects the Effectiveness of Fiscal Policy: Based on a Comparative Study of Economic Expansion and Contraction Period. Financ. Econ. 2021, 93–105. [Google Scholar]
  17. Lee, S.; Kim, J.; Park, D. Demographic Change and Fiscal Sustainability in Asia. Soc. Indic. Res. 2017, 134, 287–322. [Google Scholar] [CrossRef]
  18. Qiu, G.Q.; Yang, Z.A. Population Aging, Distortion Effect and Fiscal Sustainability. Contemp. Econ. Sci. 2022, 44, 19–30. [Google Scholar]
  19. Nishiyama, S. Fiscal Policy Effects in A Heterogeneous-Agent OLG Economy with An Aging Population. J. Econ. Dyn. Control. 2015, 61, 114–132. [Google Scholar] [CrossRef] [Green Version]
  20. Guest, R. Population Ageing, Fiscal Pressure and Tax Smoothing: A CGE Application to Australia*. Fisc. Stud. 2006, 27, 183–203. [Google Scholar] [CrossRef] [Green Version]
  21. Peña, W. Population Aging and Public Finances: Evidence from El Salvador. J. Econ. Ageing. 2020, 17, 100260. [Google Scholar] [CrossRef]
  22. Qi, H.Q.; Yang, Y.; Liu, Y. The Impact of Population Structure Change on Local Financial Burden in China. Inquir. Econ. Issues 2021, 17–25. [Google Scholar]
  23. Ramos-Herrera, M.D.C.; Sosvilla-Rivero, S. Fiscal Sustainability in Aging Societies: Evidence from Euro Area Countries. Sustainability 2020, 12, 10276. [Google Scholar] [CrossRef]
  24. Ruggeri, J.; Zou, Y. The Fiscal Burden of Rising Dependency Ratios. Popul. Res. Policy Rev. 2007, 26, 185–201. [Google Scholar] [CrossRef]
  25. Han, L.H. Fiscal Pressure Faced by Advanced Economies in Their Social Security Systems Against the Backdrop of the Aging Population. Res. Econ. Manag. 2013, 47–53. [Google Scholar] [CrossRef]
  26. Börsch-Supan, A.; Härtl, K.; Ludwig, A. Aging in Europe: Reforms, International Diversification, and Behavioral Reactions. Am. Econ. Rev. 2014, 104, 224–229. [Google Scholar] [CrossRef] [Green Version]
  27. Yoshino, N.; Kim, C.J.; Sirivunnabood, P. Aging Population and Its Impacts on Fiscal Sustainability. In Aging Population and Its Impacts on Fiscal Sustainability; G20 Insights; Asian Development Bank Institute: Tokyo, Japan, 2019. [Google Scholar]
  28. Cho, D.; Lee, K. Population Aging and Fiscal Sustainability: Nonlinear Evidence from Europe. J. Int. Money Finan. 2022, 126, 102665. [Google Scholar] [CrossRef]
  29. Gong, F.; Yu, J.L. Population Aging, Tax Burden and Fiscal Sustainability. Econ. Res. 2015, 50, 16–30. [Google Scholar]
  30. Tang, B.; Li, Z. A Country-Level Empirical Study on the Fiscal Effect of Elderly Population Health: The Mediating Role of Healthcare Resources. Healthcare 2022, 10, 30. [Google Scholar] [CrossRef] [PubMed]
  31. Yang, F.W.; Zhang, X.M. Research on the Choice and Application of Fiscal Taxation Policy Supporting the Development of Pension Industry. J. Southwest. Univ. 2017, 43, 49–59. [Google Scholar] [CrossRef]
  32. Gao, K.; Wang, T.; Ren, J.F.; Zhang, Y.F. Fiscal Investment and Financing Policies to Promote the Development of the Elderly Industry. Macroecon. Manag. 2022, 68–75. [Google Scholar] [CrossRef]
  33. Yang, C.Y.; Lu, Y.; Yang, H. The Dilemma and Improvement Ideas of Fiscal Policy in the Development of Elder Care Service in China: From the Practice and Exploration of Shanghai. J. Shaanxi Norm. Univ. 2018, 47, 15–24. [Google Scholar] [CrossRef]
  34. Feng, J. Research on Fiscal Policy of China’s Elderly Industry Based on Government Intervention Theory. China Econ. Stud. 2019, 124–128. [Google Scholar]
  35. Guo, Q.; Wang, X.L. Research on the Supply of Pension Service Market Based on Government Subsidy. Oper. Res. Manag. 2020, 29, 219–228. [Google Scholar]
  36. Wang, H.L.; Zhang, H.Y. Research on Fiscal and Tax Policies to Promote the High-Quality Development of Elderly Services. Tax. Res. 2021, 118–121. [Google Scholar] [CrossRef]
  37. Feng, H.; Qiu, Y.R.; Huang, Y.; Tang, Z.X. The Impact of Different Government Subsidy Models on the Elderly Care Service Market. Chin. J. Manag. Sci. 2022, 1–18. [Google Scholar] [CrossRef]
  38. Zhao, J.G.; Hai, L. Study on the Mechanism of Sharing Responsibility for Financing Fiscal Subsidies for New Rural Insurance in China: Based on the Perspective of Horizontal Equalization of Public Services. Macroecon. Res. 2014, 10–20. [Google Scholar]
  39. Jiang, Z.L. Improving Fiscal Guarantee Mechanism to Promote the Construction of Elderly Service System: Wuhan City as an example. Financ. Account. Mon. 2018, 164–166. [Google Scholar] [CrossRef]
  40. Wang, D.; Wang, L. Interaction and Integration of Policy and Law in Government Purchase of Elderly Services System: An Analysis Based on the Perspective of Legal Policy. J. Sichuan Norm. Univ. 2021, 48, 91–99. [Google Scholar] [CrossRef]
  41. Chen, S.Y.; Zhang, J. Efficiency of Local Government Financial Expenditure in China: 1978–2005. Soc. Sci. China 2008, 4, 65–78. [Google Scholar]
  42. Gao, X.W.; Zhang, D. The Re-examination of Efficiency of Local Government Spending: An Analysis Based on Provincial Panel Data. Comp. Econ. Soc. Syst. 2013, 181–190. [Google Scholar]
  43. Liu, H.B.; Yang, F.; Chen, G. A Research of the Fiscal Expenditure Efficiency of Province-Level Local Governments in China from 1978 to 2013. J. Hainan Univ. 2016, 34, 41–47. [Google Scholar] [CrossRef]
  44. Yu, H.W. Research on China Regional Social Security Expenditure Efficiency Evaluation and Influencing Factors Analysis Based on Three-stage DEA Model. Soc. Secur. Stud. 2015, 82–89. [Google Scholar]
  45. Wang, M.; Tao, C. Research on the Efficiency of Local Government Health Expenditure in China and Its Spatial Spillover Effect. Sustainability 2019, 11, 2469. [Google Scholar] [CrossRef] [Green Version]
  46. Wang, B.; Wang, X.Z. Evaluation of the Results of China’s Fiscal Medical and Health Expenditure. Risk Manag. Healthc. Policy 2022, 15, 1727–1740. [Google Scholar] [CrossRef]
  47. Wang, D.; Li, J.Y. Regional Differences and Spatial Convergence of Basic Public Service Efficiency in China. Soft Sci. 2022, 1–17. [Google Scholar]
  48. Liu, G.H.; Fan, Y.Q.; Liu, Z.S.; Fan, L.Q.; Zhong, R.G. How does the Combination of Medical Care and Nursing Affect the Service Efficiency of Private Elderly Nursing Institutions: Evidence from the Data of Beijing City. Manag. Rev. 2020, 32, 295–306. [Google Scholar] [CrossRef]
  49. Du, N.; Wu, P.; Yuan, M.; Li, Z. Performance Evaluation of Combining with Medical and Old-Age Care in Pension Institutions of China: A Two-Stage Data Envelopment Analysis. Risk Manag. Healthc. Policy. 2021, 14, 4211–4222. [Google Scholar] [CrossRef] [PubMed]
  50. Bian, Y.W. A Study on the Supply Efficiency of Elderly Institutions Based on DEA-Malmquist Model. Chinese Health Resour. 2022, 25, 669–674. [Google Scholar] [CrossRef]
  51. Zhu, H. A Study on Evaluating the Efficiency of Fiscal Expenditure on Basic Public Pension Services Based on A Three-Stage DEA Model: The Case of Shanghai. World Surv. Res. 2021, 50–57. [Google Scholar] [CrossRef]
  52. Hu, Y.M.; Li, T. Research on the Evaluation of the Operational Efficiency of Urban and Rural Residents’ Basic Pension Insurance System Based on Panel Three-Stage DEA Model. J. Agric. For. Econ. Manag. 2019, 18, 742–751. [Google Scholar] [CrossRef]
  53. Yin, C.Y.; Zhong, W.D. Provincial Differences in the Efficiency Evaluation of Urban and Rural Residents’ Basic Pension Insurance System and its Influencing Factors. Mod. Financ. Econ. 2021, 51–63. [Google Scholar] [CrossRef]
  54. Qu, S.; Feng, C.; Jiang, S.; Wei, J.; Xu, Y. Data-Driven Robust DEA Models for Measuring Operational Efficiency of Endowment Insurance System of Different Provinces in China. Sustainability 2022, 14, 9954. [Google Scholar] [CrossRef]
  55. Charnes, A.; Cooper, W.W.; Rhodes, E. Measuring the Efficiency of Decision-Making Units. Eur. J. Oper. Res. 1979, 3, 339. [Google Scholar] [CrossRef]
  56. Banker, R.D.; Charnes, A.; Cooper, W.W. Some Models for Estimating Technical and Scale Inefficiencies in Data Envelopment Analysis. Manag. Sci. 1984, 30, 1078–1092. [Google Scholar] [CrossRef] [Green Version]
  57. Yin, J.; Yang, Z.Y. Research on the Coordinated Development Path of Aging Industry and Aging Undertaking. Seeker 2015, 48–53. [Google Scholar] [CrossRef]
  58. Tone, K. A Slacks-Based Measure of Super-Efficiency in Data Envelopment Analysis. Eur. J. Oper. Res. 2002, 143, 32–41. [Google Scholar] [CrossRef]
  59. Pastor, J.T.; Lovell, C.A.K. A Global Malmquist Productivity Index. Econ. Lett. 2005, 88, 266–271. [Google Scholar] [CrossRef]
  60. Xu, H.; Ma, B.; Gao, Q. Assessing the Environmental Efficiency of Grain Production and Their Spatial Effects: Case Study of Major Grain Production Areas in China. Front. Environ. Sci. 2021, 9, 520. [Google Scholar] [CrossRef]
  61. Pang, J.; Chen, X.; Zhang, Z.; Li, H. Measuring Eco-Efficiency of Agriculture in China. Sustainability 2016, 8, 398. [Google Scholar] [CrossRef] [Green Version]
  62. Tone, K. A Slacks-Based Measure of Efficiency in Data Envelopment Analysis. Eur. J. Oper. Res. 2001, 130, 498–509. [Google Scholar] [CrossRef] [Green Version]
  63. Berg, S.A.; Forsund, F.R.; Jansen, E.S. Malmquist Indices of Productivity Growth During the Deregulation of Norwegian Banking, 1980–1989. Scand. J. Econ. 1992, 94, S211–S228. [Google Scholar] [CrossRef]
  64. Huang, J.; Yang, X.; Cheng, G.; Wang, S. A Comprehensive Eco-Efficiency Model and Dynamics of Regional Eco-Efficiency in China. J. Clean. Prod. 2014, 67, 228–238. [Google Scholar] [CrossRef]
  65. Charnes, A.; Cooper, W.W. Preface to Topics in Data Envelopment Analysis. Ann. Oper. Res. 1984, 2, 59–94. [Google Scholar] [CrossRef]
  66. Asmild, M.; Paradi, J.C.; Aggarwall, V.; Schaffnit, C. Combining DEA Window Analysis with the Malmquist Index Approach in a Study of the Canadian Banking Industry. J. Prod. Anal. 2004, 21, 67–89. [Google Scholar] [CrossRef]
  67. Zhao, X.; Ma, X.; Shang, Y.; Yang, Z.; Shahzad, U. Green Economic Growth and Its Inherent Driving Factors in Chinese cities: Based on the Metafrontier-Global-SBM Super-Efficiency DEA Model. Gondwana Res. 2022, 106, 315–328. [Google Scholar] [CrossRef]
  68. Yu, X.; Hu, Q.; Shen, M. Provincial Differences and Dynamic Changes in Mariculture Efficiency in China: Based on Super-SBM Model and Global Malmquist Index. Biology 2020, 9, 18. [Google Scholar] [CrossRef] [PubMed]
  69. Fan, Z.Y.; Wang, S.L. Comparative Study on the Development of Aging Undertakings in Provinces of China. Contemp. Econ. Manag. 2012, 34, 48. [Google Scholar] [CrossRef]
  70. Zeng, T.G.; Zhao, Y. Spatial and Temporal Evolution of the Undertakings for the Elderly and Spatial Mismatch of Economy in China. Geogr. Res. 2019, 38, 1497–1511. [Google Scholar] [CrossRef]
Figure 1. Time trend of the efficiency of fiscal expenditure on aging undertakings.
Sustainability 15 02486 g001
Figure 2. Time and space distribution of the efficiency of fiscal expenditure on aging undertakings.
Sustainability 15 02486 g002
Figure 3. σ value of the efficiency of fiscal expenditure on aging undertakings.
Sustainability 15 02486 g003
Table 1. Descriptive statistics of input and output indicators.
IndicatorsMeanStd. Dev.MinMaxUnit
InputFiscal aged expenditureInd1337.75254.8233.421172.65RMB billion
Welfare lottery fundsInd23.432.130.3710.94
OutputThe number of employees in registered elderly institutionsInd311,622.899247.3133846,882Person
The number of beds per 1000 elderly peopleInd426.2710.314.5358.32Sheet
The number of urban workers’ pension insurance participantsInd51237.291049.8081.525392.4310,000 people
The number of urban and rural pension insurance participantsInd61702.71326.9376.25255.910,000 people
The total number of elderly institutions and facilitiesInd74629.636389.897135347Individual
The per capita pension levelInd80.280.160.112.15RMB 10,000
Note: The data on fiscal aged expenditure in 26 provinces, including Anhui, Gansu, Guangdong, Guangxi, Guizhou, Hainan, Hebei, Henan, Heilongjiang, Hunan, Jilin, Jiangsu, Jiangxi, Liaoning, Inner Mongolia, Ningxia, Qinghai, Shandong, Shanxi, Shaanxi, Shanghai, Sichuan, Tianjin, Xinjiang, Yunnan, and Zhejiang, were obtained through the way of information disclosure upon request from 2011 to 2020, and the data of Beijing, Hubei, Fujian, Chongqing, the Tibet Autonomous Region, Taiwan Province, and the Hong Kong as well as Macao Special Administrative Regions were not obtained. In addition, Ind1 to Ind8 represent the corresponding input and output indicators, respectively.
Table 2. Fiscal expenditure efficiency mean input redundancy and output deficiency rates for 2011–2020.
RegionProvinceInputOutput
Ind1Ind2Ind3Ind4Ind5Ind6Ind7Ind8
EastGuangdong0.00.00.10.00.00.00.20.0
Hainan0.00.01.00.10.20.25.10.1
Hebei0.00.00.00.00.00.00.00.1
Jiangsu0.00.00.00.00.00.00.10.0
Shandong0.00.00.00.00.00.00.00.0
Shanghai0.00.00.00.10.216.85.90.0
Tianjin0.00.20.30.00.19.114.60.2
Zhejiang0.00.00.00.00.00.00.10.0
CentralAnhui0.00.00.20.00.20.04.40.2
Henan0.00.10.10.00.00.00.30.0
Hunan0.20.30.30.50.10.00.90.9
Jiangxi0.00.30.20.00.00.02.23.9
Shanxi0.20.40.80.60.10.03.32.0
WestGansu0.30.43.50.12.10.00.23.7
Guangxi0.40.40.60.30.20.00.03.4
Guizhou0.00.10.70.10.20.00.21.3
Inner Mongolia0.00.10.40.00.20.42.41.7
Ningxia0.00.20.30.00.10.52.10.3
Qinghai0.00.14.90.01.90.30.71.1
Shanxi0.60.50.40.30.10.00.72.8
Sichuan0.10.20.20.00.00.01.71.6
Xinjiang0.00.61.00.20.21.317.80.1
Yunnan0.00.22.01.11.10.010.32.6
NortheastHeilongjiang0.20.20.50.30.01.19.91.6
Jilin0.00.00.10.10.00.00.51.6
Liaoning0.20.20.20.30.01.47.52.9
NationalNational0.10.20.20.10.10.11.21.1
Table 3. β convergence regression results.
VariableEastCentralWestNortheastNational
ln Y i , t 1 −0.828 ***
(0.07)
−0.765 ***
(0.10)
−0.773 ***
(0.16)
−1.377 ***
(0.04)
−0.765 ***
(0.08)
Cons−0.245
(0.18)
−0.350 *
(0.14)
−0.689 ***
(0.20)
−1.321 ***
(0.10)
−0.466 ***
(0.09)
Time effectControlControlControlControlControl
Fixed effectsControlControlControlControlControl
N 72459027234
R-sq0.5060.7680.5060.8140.472
Note: *, and *** denote significance at the 10%, and 1% levels, respectively; standard errors are indicated in parentheses.
Table 4. Regression results of conditional β convergence.
VariableEastCentralWestNortheastNational
ln Y i , t 1 −1.147 ***
(0.17)
−0.793 ***
(0.09)
−0.887 ***
(0.20)
−1.058 ***
(0.04)
−0.871 ***
(0.12)
FP0.824
(0.89)
−0.570
(0.48)
−0.039
(0.46)
2.680 **
(0.43)
0.330 *
(0.17)
GDP0.106
(0.10)
−0.046
(0.32)
0.679 *
(0.34)
7.675 **
(1.61)
0.237 **
(0.10)
lnPD1.567
(1.64)
−5.462
(5.17)
−2.059
(3.48)
6.812 **
(1.28)
−3.943 ***
(1.20)
ADR0.029
(0.05)
−0.089
(0.07)
−0.044
(0.07)
−0.354
(0.14)
−0.037
(0.04)
UR20.597 ***
(5.03)
−2.629
(24.61)
−4.032
(5.29)
112.487 *
(29.57)
7.578 **
(3.63)
lnPCI−5.072
(3.15)
2.694
(2.42)
−2.674
(2.19)
−12.618 *
(4.09)
−1.667 *
(0.93)
lnRT−0.381
(0.44)
−0.156
(1.03)
1.508
(0.99)
−3.217
(1.95)
1.128 **
(0.46)
Cons27.953
(34.43)
10.385
(31.55)
23.576
(27.26)
34.660
(39.51)
23.901 **
(10.30)
Time effectControlControlControlControlControl
Fixed effectsControlControlControlControlControl
N 72459027234
R-sq0.6410.8320.5690.9640.533
Note: *, **, *** denote significance at the 10%, 5%, and 1% levels, respectively. To reduce covariance and the influence of heterogeneity on the regression results of this paper, it takes the logarithms of PD, PCI, and RT, which are denoted as lnPD, lnPCI, and lnRT, respectively.
Disclaimer/Publisher’s Note: The statements, opinions and data contained in all publications are solely those of the individual author(s) and contributor(s) and not of MDPI and/or the editor(s). MDPI and/or the editor(s) disclaim responsibility for any injury to people or property resulting from any ideas, methods, instructions or products referred to in the content.

