1. Introduction
Social media is a platform over the Internet where users share their ideas, exchange information, and build relationships. Two-thirds of Internet users access social networks and social sites [
1]. The recent COVID-19 pandemic has increased the use of social media. According to statistics published by [
1], an increasing number of people used social media platforms to convey their feelings to their friends and family during the pandemic. Another reason for the increase in social media is the decline of the newspaper supply during COVID-19 due to the transmission of the novel coronavirus through the newspaper. Before the lockdown, people used to spend an hour reading the newspapers. This has decreased by 22% during the lockdown. This has resulted in a significant shift in social media usage. Twitter is one online micro-blogging site on which people like spending more time. Therefore, Twitter is an important source of sentiments where users express their opinions about every topic. The users of this channel vary from politicians, celebrities, business representatives, and ordinary people. It is possible to access, visualise and interpret users’ views from different socioeconomic and interest groups on Twitter [
2,
3]. Hence, analysis of Twitter data during this pandemic has attracted a great number of researchers.
Sentiment analysis or opinion mining (SAOM) is a domain that automates extracting public opinions or thoughts expressed in a written language (text) across social media, blogs, reviews, news, etc. It aims to analyse people’s personal experiences, opinions, emotions, or attitudes towards an entity, such as products, individuals, organisations, services, etc. The term sentiment means one’s personal feeling or experience or “an attitude towards something” or “an opinion” [
4]. SAOM is an active field of research and an interdisciplinary area that includes text mining, Natural Language Processing (NLP), and data mining [
5]. Sentiment analysis and opinion mining tasks are usually carried out at various levels: word level, sentence level, document level, and aspect level [
4,
6]. The sentiment extractor automatically classifies the opinions expressed in the tweet as positive, negative, or neutral.
Table 1 shows some example tweets and their sentiment polarity level.
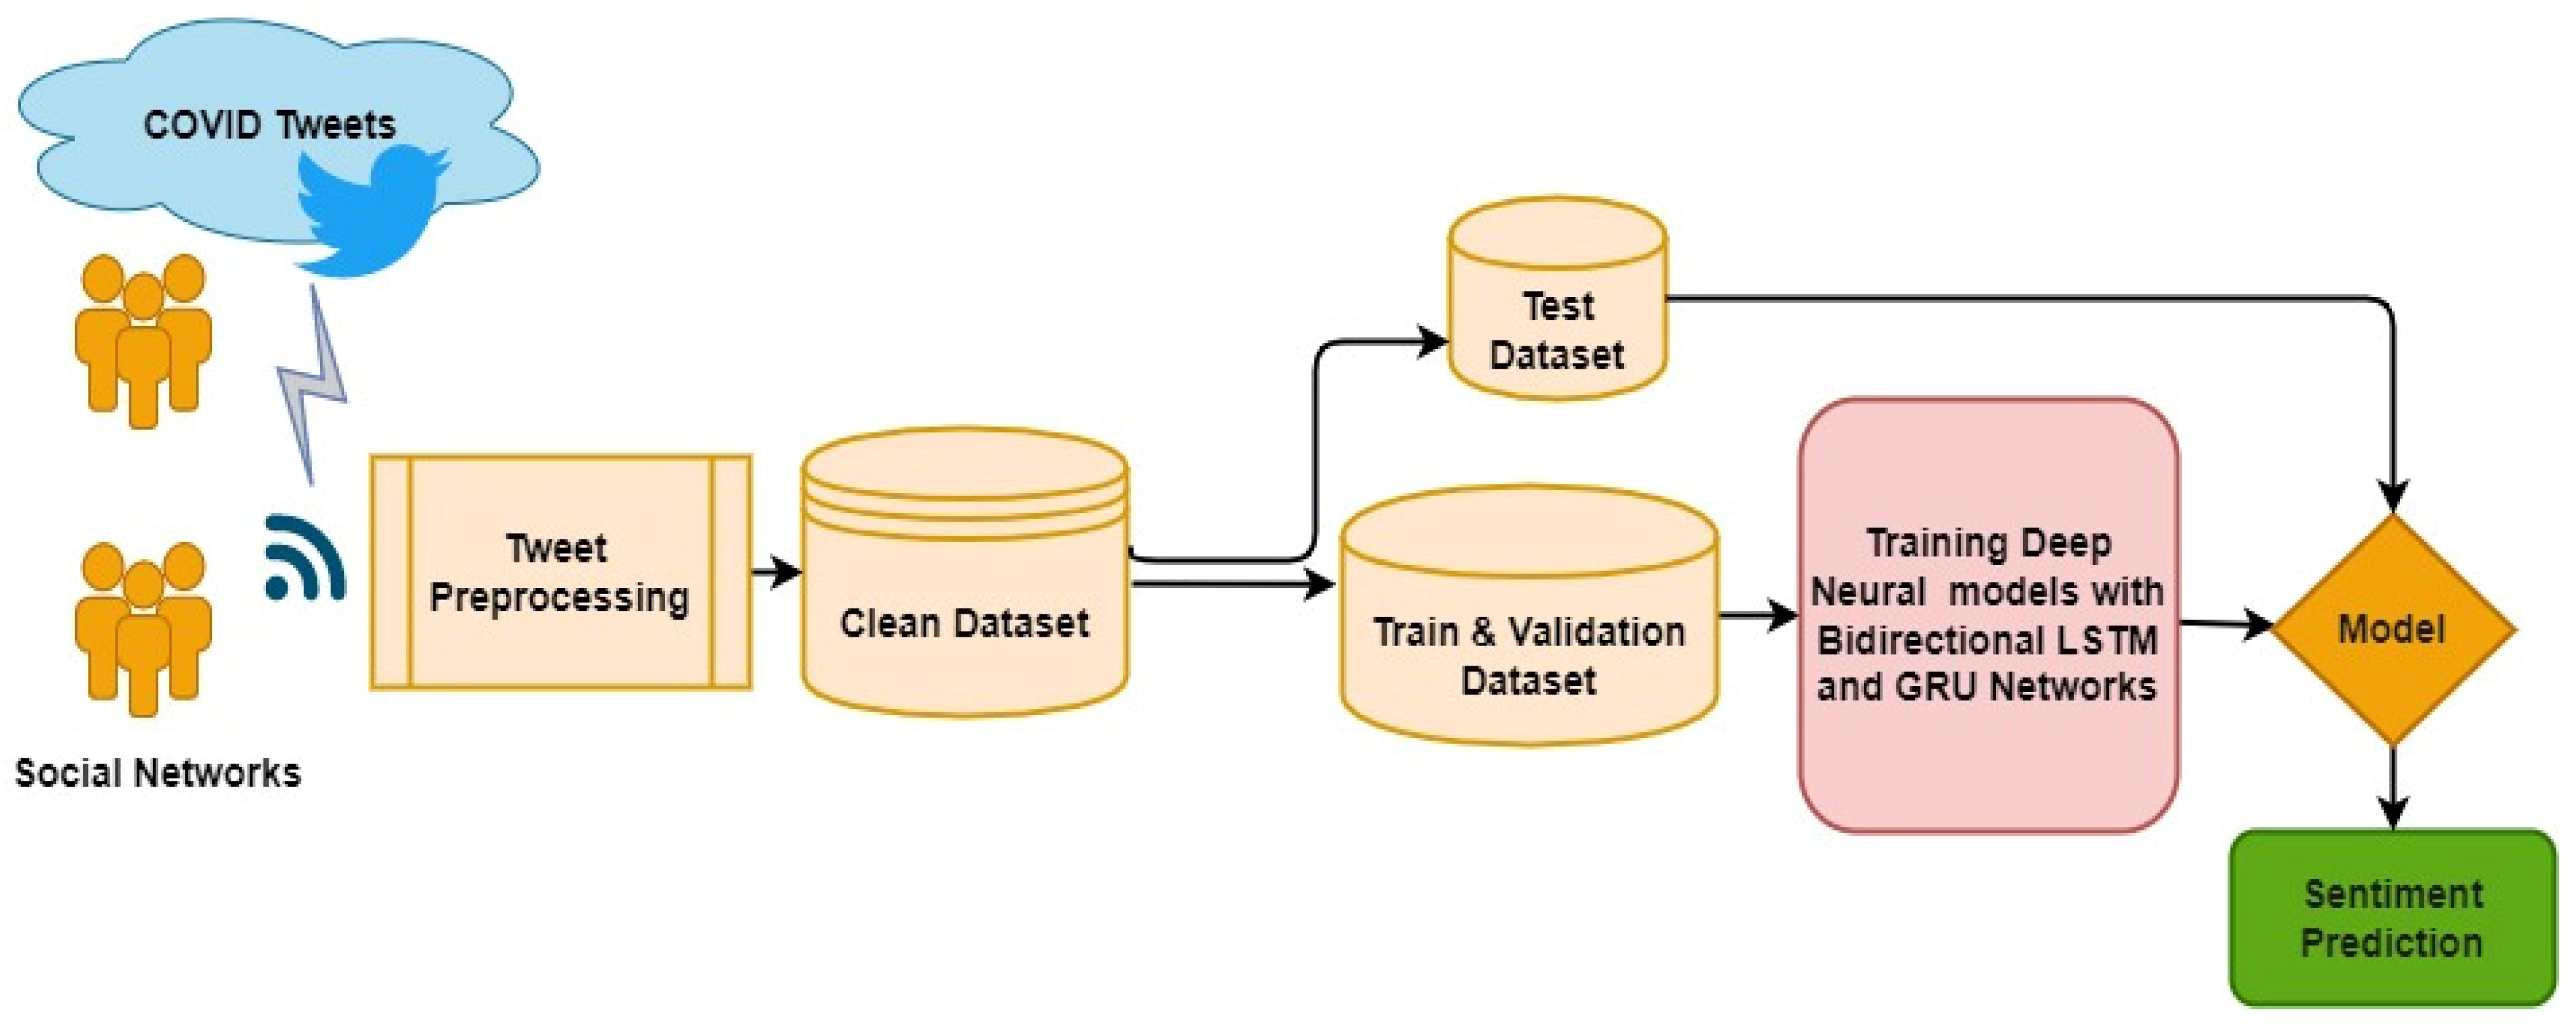
In the proposed work, deep learning-based models, Bidirectional long/short-term memory (Bi-LSTM) and Gated Recurrent Unit (GRU) networks and lexicon analysers, National Research Council of Canada Emotion Lexicon (NRCLex) and Valence Aware Dictionary for Sentiment Reasoning (VEDAR), were used to identify the public sentiments related to COVID-19 and vaccination. The work focuses on analysing public emotions based on tweets posted by people from India. The study also quantifies the sentiment with a positive, neutral, or negative value called polarity [
7,
8]. It provides insights into emotions such as happiness, anger, neutrality, etc., to execute the best policies against upcoming pandemic waves in India. The proposed methodology described in this paper can be useful for Indian government policymakers to take proper managerial decisions by being aware of the public’s emotions towards COVID-19 pandemic and vaccination drives. The managerial implications of the analysis are that the policymakers can:
- (i.)
Understand the concerns and issues raised by people about current facilities related to COVID-19 pandemic and vaccination drives;
- (ii.)
Ensure sufficient provisions are made;
- (iii.)
Understand misunderstandings about vaccination;
- (iv.)
Take appropriate initiatives to create awareness about the current situation.
A large dataset of around 1,000,000 tweets from India related to COVID-19 and vaccination was used as a case study. The following are the unique contributions of this study:
The main intention of the study is to prove the significance of sentiment analysis using two approaches: lexicon-based and deep learning methods.
The size of tweets datasets used in this study is large compared with previous studies.
The classification accuracy obtained is higher than the results of existing similar works.
The study aims to analyse people’s emotions towards COVID-19 pandemic and vaccination as positive, negative and neutral. Furthermore, the tweets are classified into positive (“joy”, “positive” and “trust” etc.) and negative (“fear”, “sadness” and “negative” etc.) emotion affects.
The policymakers can use these approaches to understand public emotions and make appropriate decisions about future outbreaks and planning resources such as COVID care hospitals, setting up COVID care centres and planning for vaccination drives.
This paper is arranged into six sections.
Section 2 presents the literature review.
Section 3 explains the proposed methodology.
Section 4 and
Section 5 explain the implementation of lexicon and deep learning methods and the results. The conclusions of the study are discussed in
Section 6.
2. Literature Review
After COVID-19 was declared as a pandemic, many researchers have investigated the sentiment analysis of COVID-19 posts extracted from social media. Different perspectives of sentiment analysis include:
Trend analysis for different time intervals using COVID-19 datasets [
9,
10,
11]
Sentiment analysis on social distancing [
14], vaccination [
15]
Disease surveillance [
16,
17].
Twitter is a commonly used social media platform for conveying one’s opinions. The current approaches used for Twitter sentiment analysis fall into four main categories: lexicon-based, machine learning techniques, deep learning, and hybrid methods [
18,
19].
In the past decade there have been several research studies conducted to analyse sentiments of the tweets with the above approaches. National Research Council (NRC) and VADER models were used to calculate the intensity score of the sentiments for the Canadian tweets about COVID-19. Data were collected from 24 February 2020 to 14 October 2020 from four cities in Canada, i.e., Toronto, Montreal, Vancouver, and Calgary. Time series analysis was carried out on these data. The authors computed sentiment scores for vaccine, mask, and lockdown. The results were compared with the sentiment scores of the tweets posted from four cities in the United States. The analysis showed that sentiment scores vary depending on the location and time, and people were positive about using masks but negative about vaccines and lockdown. This analysis has limitations in interpreting the meaning of negative sentiments [
20].
A lexicon-based approach was used to perform topic-based sentiment analysis of the tweets about COVID-19 pandemic. This research focused on two main pandemic periods: 1 March 2020 to 30 April 2020 and 1 September 2020 to 31 October 2020. In the first phase, topic extraction was performed using Latent Dirichlet Allocation (LDA), and in the second phase, lexicon-based sentiment analysis was carried out using VADER. For this purpose, around 600,000 English tweets about COVID-19 were extracted and processed [
21]. This work has a few limitations: topic lemmatisation is performed several times to obtain good results, resulting in a slower process. The data from the two periods selected for the study produced contradictory results and required computationally intensive data pre-processing.
Sentiment analysis and topic modelling of tweets on COVID-19 vaccines were performed on the tweets posted from 11 March 2020 (when COVID-19 became a pandemic worldwide) to 31 January 2021. The tweets were extracted from Georgia State University’s Panacea Lab dataset. Emotions expressed by tweets were analysed using NRCLex. The result of the sentiment analysis showed that people’s sentiments towards COVID-19 vaccination became more positive over time. The maximum sentiment score was observed during early November 2020, when the Pfizer vaccine was reported to be highly effective. In emotion analysis, it was found that trust emotion reached highest score with 22.78% around the same time, and also, the percentage of tweets with fear decreased after that period [
22].
Lexicon and VADER methods were used to analyse the sentiment of tweets on COVID-19 from six countries (France, Italy, USA, India, UK, and Spain). The tweets were collected from 15 March to 15 April 2020 from Twitter. Tweets were classified into Negative, Neutral, or Positive sentiment classes. Both approaches showed negativity about the pandemic from all countries. The lexicon-based approach indicated that the UK has the highest negative sentiment score of 23.03%, followed by France (22.71%), USA (22.01%), and India (18.39%). In the VADER-based approach, the results were: 35.92% in France, 35.68% in UK, and 35.38% in USA, while India has a minimum score of 31.03% [
23].
In another study, a lexicon-based sentiment analysis approach was used to analyse the sentiments of public towards COVID-19 pandemic during initial phase of vaccination from Ohio and Michigan. NRCLex and VADER libraries from Python were used to calculate the sentiment scores of tweets. Tweets were classified into four sentiment categories: positive, negative, neutral and compound. The results revealed that tweets from Ohio state exhibited more negative feelings associated with the emotions of “fear” and “sadness” compared to the tweets from Michigan state [
24].
The machine learning approaches for sentiment analysis are mainly based on supervised learning and ensemble techniques. In the supervised learning technique, a dataset of labelled instances of tweets is input to train a machine learning model using classification algorithms such as Support Vector Machine (SVM), Bayesian classifier, and Entropy classifier [
25,
26,
27,
28,
29] to classify the tweets into sentiment categories such as positive, neutral, and negative. The trained model is used to predict the sentiment of new tweets. The main disadvantage of the machine learning approach is that we need to generate a large labelled training dataset as the model’s performance is dependent on the dataset [
30,
31]. It is difficult to obtain a correctly labelled dataset of adequate size. Features such as Part-of-Speech, Hashtag, negation, Term frequency, Term Presence, and n-gram are used to extract the semantic orientation of the text. Some researchers have tried ensemble strategies for sentiment analysis. In ensemble frameworks, a model is built by combining several base classifiers, e.g., Naïve Bayes and an SVM classifier [
32]. Furthermore, sarcasm in the word is identified using a multitask learning framework based on deep learning methods and OntoSenticNet [
33,
34].
COVID-19 vaccination tweet analysis was carried out using Naïve bays and decision tree algorithms. Natural Language Toolkit (NLTK) library, available in Python, is used to tokenise the tweets. Sentiments were classified into three classes: neutral, positive and negative. In the decision tree algorithm, unigram and bigram methods are applied to achieve an accuracy of 96% in prediction. However, this research has considered only vaccination tweets [
35].
In recent years, deep learning approaches such as Bidirectional Encoder Representations from Transformers (BERT), Long-Short Term Memory (LSTM) and Bidirectional Emotional Recurrent Unit (BiERU) [
36] approaches have been successfully employed for NLP tasks. The BERT model was built to analyse the sentiments of COVID-19 Tweets from India. The tweets were collected during the lockdown period from 23 March 2020 to 15 July 2020. Along with BERT, three other models, SVM, Logistic Regression, and LSTM, were built. It was observed that the BERT model obtained a maximum precision of 89%. The study revealed a high incidence among keywords and their related terms in the tweets. Emotions extracted in the study cannot be applied globally, as it is based on tweets from a single country [
37].
A deep learning model based on LSTM was built to predict the public’s feelings towards the pandemic. The dataset consisted of tweets collected from nine states in the United States. The Python library, TextBlog was used to classify three emotions: negative, positive, and neutral. The results indicated that most of the sentiments were neutral. Along with LSTM, another machine learning algorithm, SVM, was used to predict emotions. The purpose of the LSTM model is unclear from the study [
38]. Using Bangladesh tweets, a Bi-LSTM model was trained to analyse public emotions related to COVID-19 vaccines and vaccination campaigns. The model consisted of two Bi-LSTM layers, with the first layer of 100 units and a second layer of 32 units to train. The drawback of this model is that it predicts only two classes of emotions, i.e., positive and negative, and there was no provision to handle the ambiguous tweets [
39].
The ensemble deep learning model was proposed to analyse COVID-19 sentiments in real time for Indian and European tweets. The dataset contained 3100 tweets from India and Europe, collected from 23 March 2020 to 1 of November2021. The model was built using five steps: data collection, pre-processing, feature extraction, exploratory analysis and prediction. Using the ensemble classifiers GRU and Capsule Neural Network (CapsNet), tweets were classified into four sentiment categories: joy, sadness, anger and fear. The model achieved a classification accuracy of 97.28% and 95.20% for Indian and European datasets. This model training required high computational complexity [
40].
The deep learning technique CNN-LSTM was used to analyse sentiments related to the COVID-19 vaccine. In this study, a total of 803,278 Persian tweets were collected for the period between 1 April 2021 and 30 September 2021. This method classified tweets into three categories: negative, positive and neutral. During the analysis, it was observed that: (1) there were more negative tweets on national and international vaccines in the initial stage (2) There were notable variations in positive and negative sentiments towards vaccination among Iranian people. The limitation of this method is that the duration of tweets collection was very short, which might lead to misinterpretation of the analysis [
41].
Hybrid techniques combine lexicon-based and machine-learning and methods to take advantage of both methods [
12]. A deep learning method was used to extract the sentiments from Korean tweets about COVID-19 vaccines. The tweets were collected from 23 February 2021 to 22 March 2021. As the tweets were in Korean language, the KNU, Korean Sentiment Lexicon dictionary, was used to extract the topics. Eight topics were mined using the LDA model, and the sentiment score was computed using Bi-LSTM. The Bi-LSTM was applied to calculate the sentiment polarity of each topic selected for the study. The analysis revealed a rise in negative tweets after the surge in COVID-19 confirmed cases as the vaccination process was limited to only healthcare workers. The outcomes of this analysis cannot be generalised to reflect the entire Korean population as very few tweets were used in this study. Most of the tweets collected were posted using indirect experiences. This study could be repeated after the vaccination, which would have changed sentiment scores. Therefore, further in-depth future work is required [
42].
Neurosymbolic based on Artificial Intelligence (AI) is another recent approach for sentiment analysis. The technique involves the extraction of polarity from the text in an explainable manner using rules and symbols. This method can be applied to enhance the performance of machine learning or deep learning models built to perform sentiment analysis [
43,
44,
45]. However, none of the studies has used this approach for COVID-19 tweet analysis [
46]. The limitations of the previous studies are:
- i.
The datasets used were of limited numbers of tweets. These studies analysed public sentiment about either COVID-19 or vaccination.
- ii.
The researchers applied only a single sentiment computation technique, i.e., either lexicon-based or machine learning, to compute the sentiment.
Considering existing studies’ limitations, the proposed work analysed tweets on both COVID-19 and vaccination. The size of the datasets included is large compared with the existing studies. The sentiment analysis is performed using both lexicon and deep learning approaches. This helps evaluate the most effective model to predict public opinion about COVID-19 and vaccination.
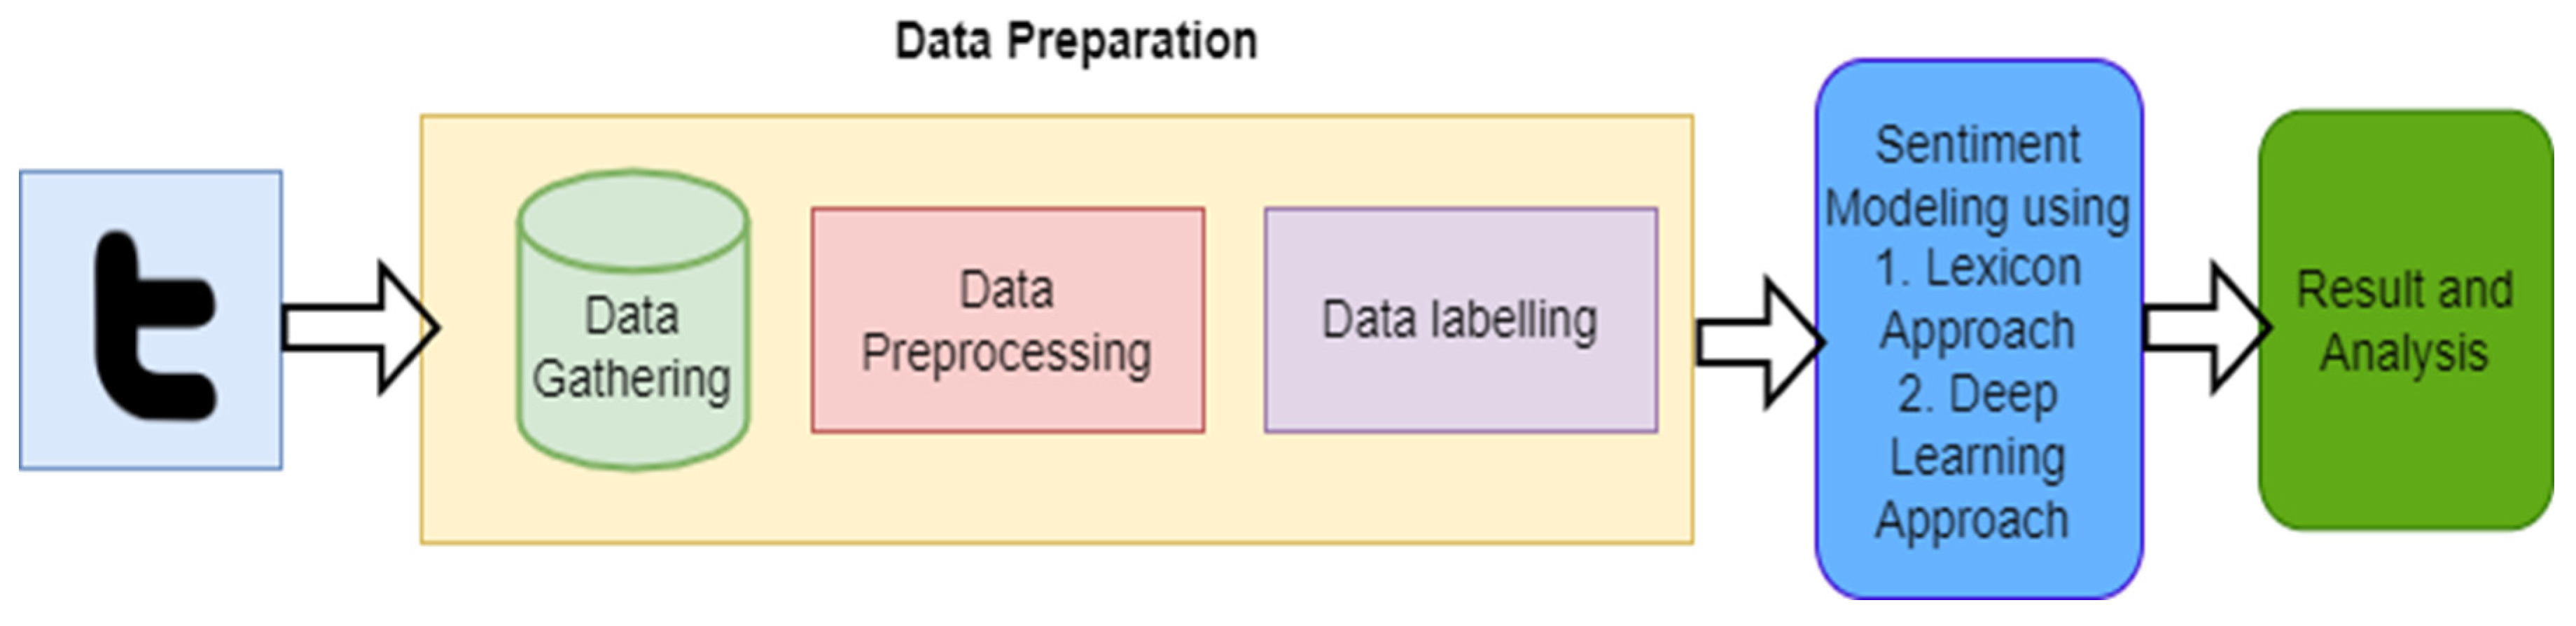
4. Sentiment’s Analysis Using Lexicon Based Approaches
The lexicon-based approach was used to visualise and analyse the emotions for the same datasets. Lexicon-based strategies are very effective and straightforward methods. They depend on a sentiment dictionary, i.e., a lexicon with a predefined list of lexical features (e.g., words, phrases etc.) where each word is labelled with a semantic orientation as either positive or negative or neutral. Semantic orientation (SO) refers to the polarity and intensity (the extent to which the document, sentence or word is positive or negative) of words, phrases or texts. In many lexicon-based studies, adjectives have been used as lexical features to determine the text’s semantic orientation [
50]. Researchers have also used adverbs, verbs and nouns as features, and a list of adjectives and their SO values are collected into a lexicon. Dictionaries can be created manually by language experts or by automatic expansion from an initial list of seed sentiment words.
Using lexicon-based methods, the semantic orientation of a document can be calculated based on the semantic orientation of words and phrases [
51]. The input text is pre-processed and represented as a bag of words. These words’ sentiment values (positive or negative) are extracted by matching the words with the dictionary. An aggregation function, such as sum or average, applies to individual SO scores to predict the overall sentiment of the text. Along with sentiment value, the local context of a word is usually considered, such as intensity measure and negation [
52].
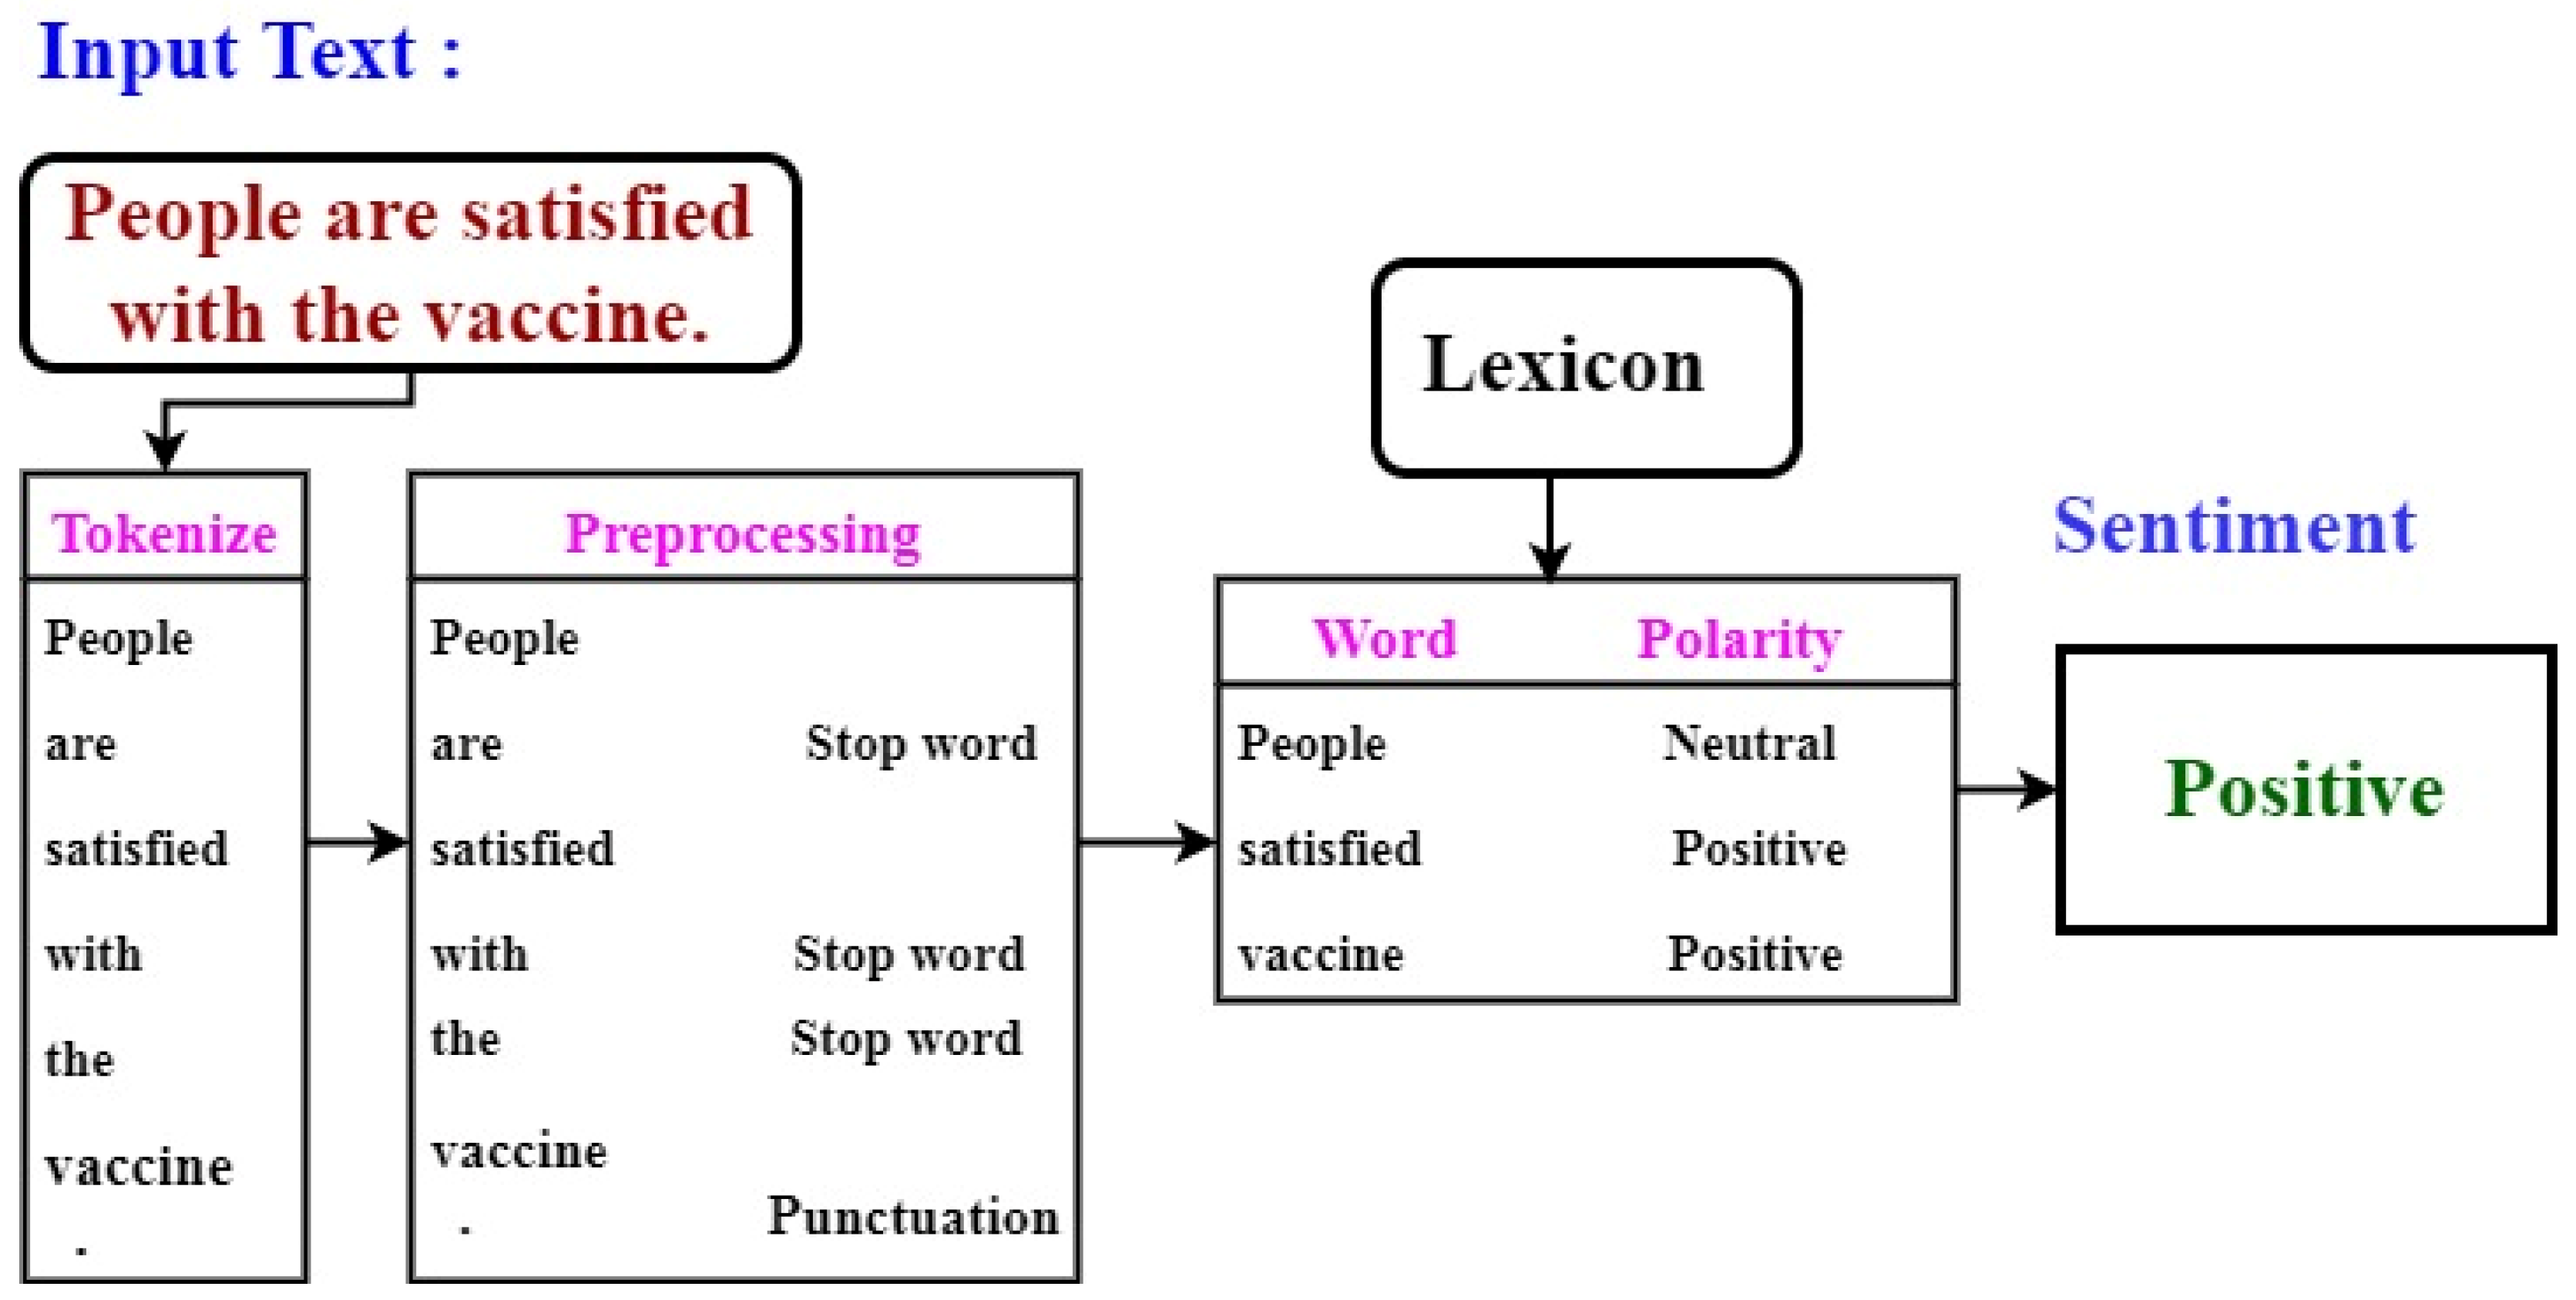
Figure 2 shows the general process of lexicon-based sentiment analysis of tweets, and
Figure 3 presents the process with an example sentence.
Lexicon-based strategies are simple, efficient and easy to understand. They do not require sufficient labelled training data to attain good classification performance. They can consider negation (not attractive) and intensification (e.g., very interesting). This makes a lexicon-based model superior to a classifier model. Examples of some of the popular lexicons used for detecting the sentiment of the given text are SentiWordNet, bing, AFINN, NRCLex, VADER and MPQA.
4.1. Sentiment Analysis with VADER
VADER is a lexicon and rule-based sentiment analysis tool that is precisely attuned to the emotions conveyed on social media. The lexicon incorporates 7500 lexical features with validated valence scores that indicate the word’s polarities (negative and positive) and intensity. Lexical features are labelled with sentiment scores on a scale from “-4: Extremely Negative” to “+4: Extremely Positive” and “0: Neutral (or Neither, N/A)” [
53]. The lexicon contains numerous lexical properties common to the sentiments expressed in microblogs:
- i.
A complete list of Western-style emoticons (for example, “:-(”)
- ii.
Sentiment-related abbreviations (for example—LOL and ROFL)
- iii.
Frequently used slangs with sentiment value (for example, nah and meh)
Table 4 lists few of the words with their polarity and valence score as given in the VADER Lexicon [
54].
VADER sentiment analysis depends on the dictionary approach to map lexical features to sentiment intensity scores. Lexical features such as emoticons “:-)”, acronyms such as “OMG” and commonly used informal words (slang) such as “Flex” are also mapped to sentiment scores. The sentiment score of the sentence is increased or decreased proportionately. VADER developers have incorporated simple heuristic rules to consider the effect of intensifiers (extremely, very, slightly), punctuation (!), and capitalization (AMAZING), which also affect the overall sentiment of the sentence.
VADER applies another heuristic to resolve the semantic ambiguity introduced by conjunction words such as but, though, whereas, yet etc., in a sentence. The conjunctions join two clauses with conflicting opinions and affect the sentence’s sentiment. For example, “I got COVID but symptoms are mild”. The second part of the text dominates the overall sentiment of the sentence. In VADER, the sentiment terms after “but” are assigned higher valence scores than the terms before the conjunction word to determine the compound polarity score of the sentence.
The compound score of the text is calculated by adding up the valence scores of each term, adjusted according to the rules. The final score is scaled to map to a value between +1 (most extreme positive) and −1 (most extreme negative).
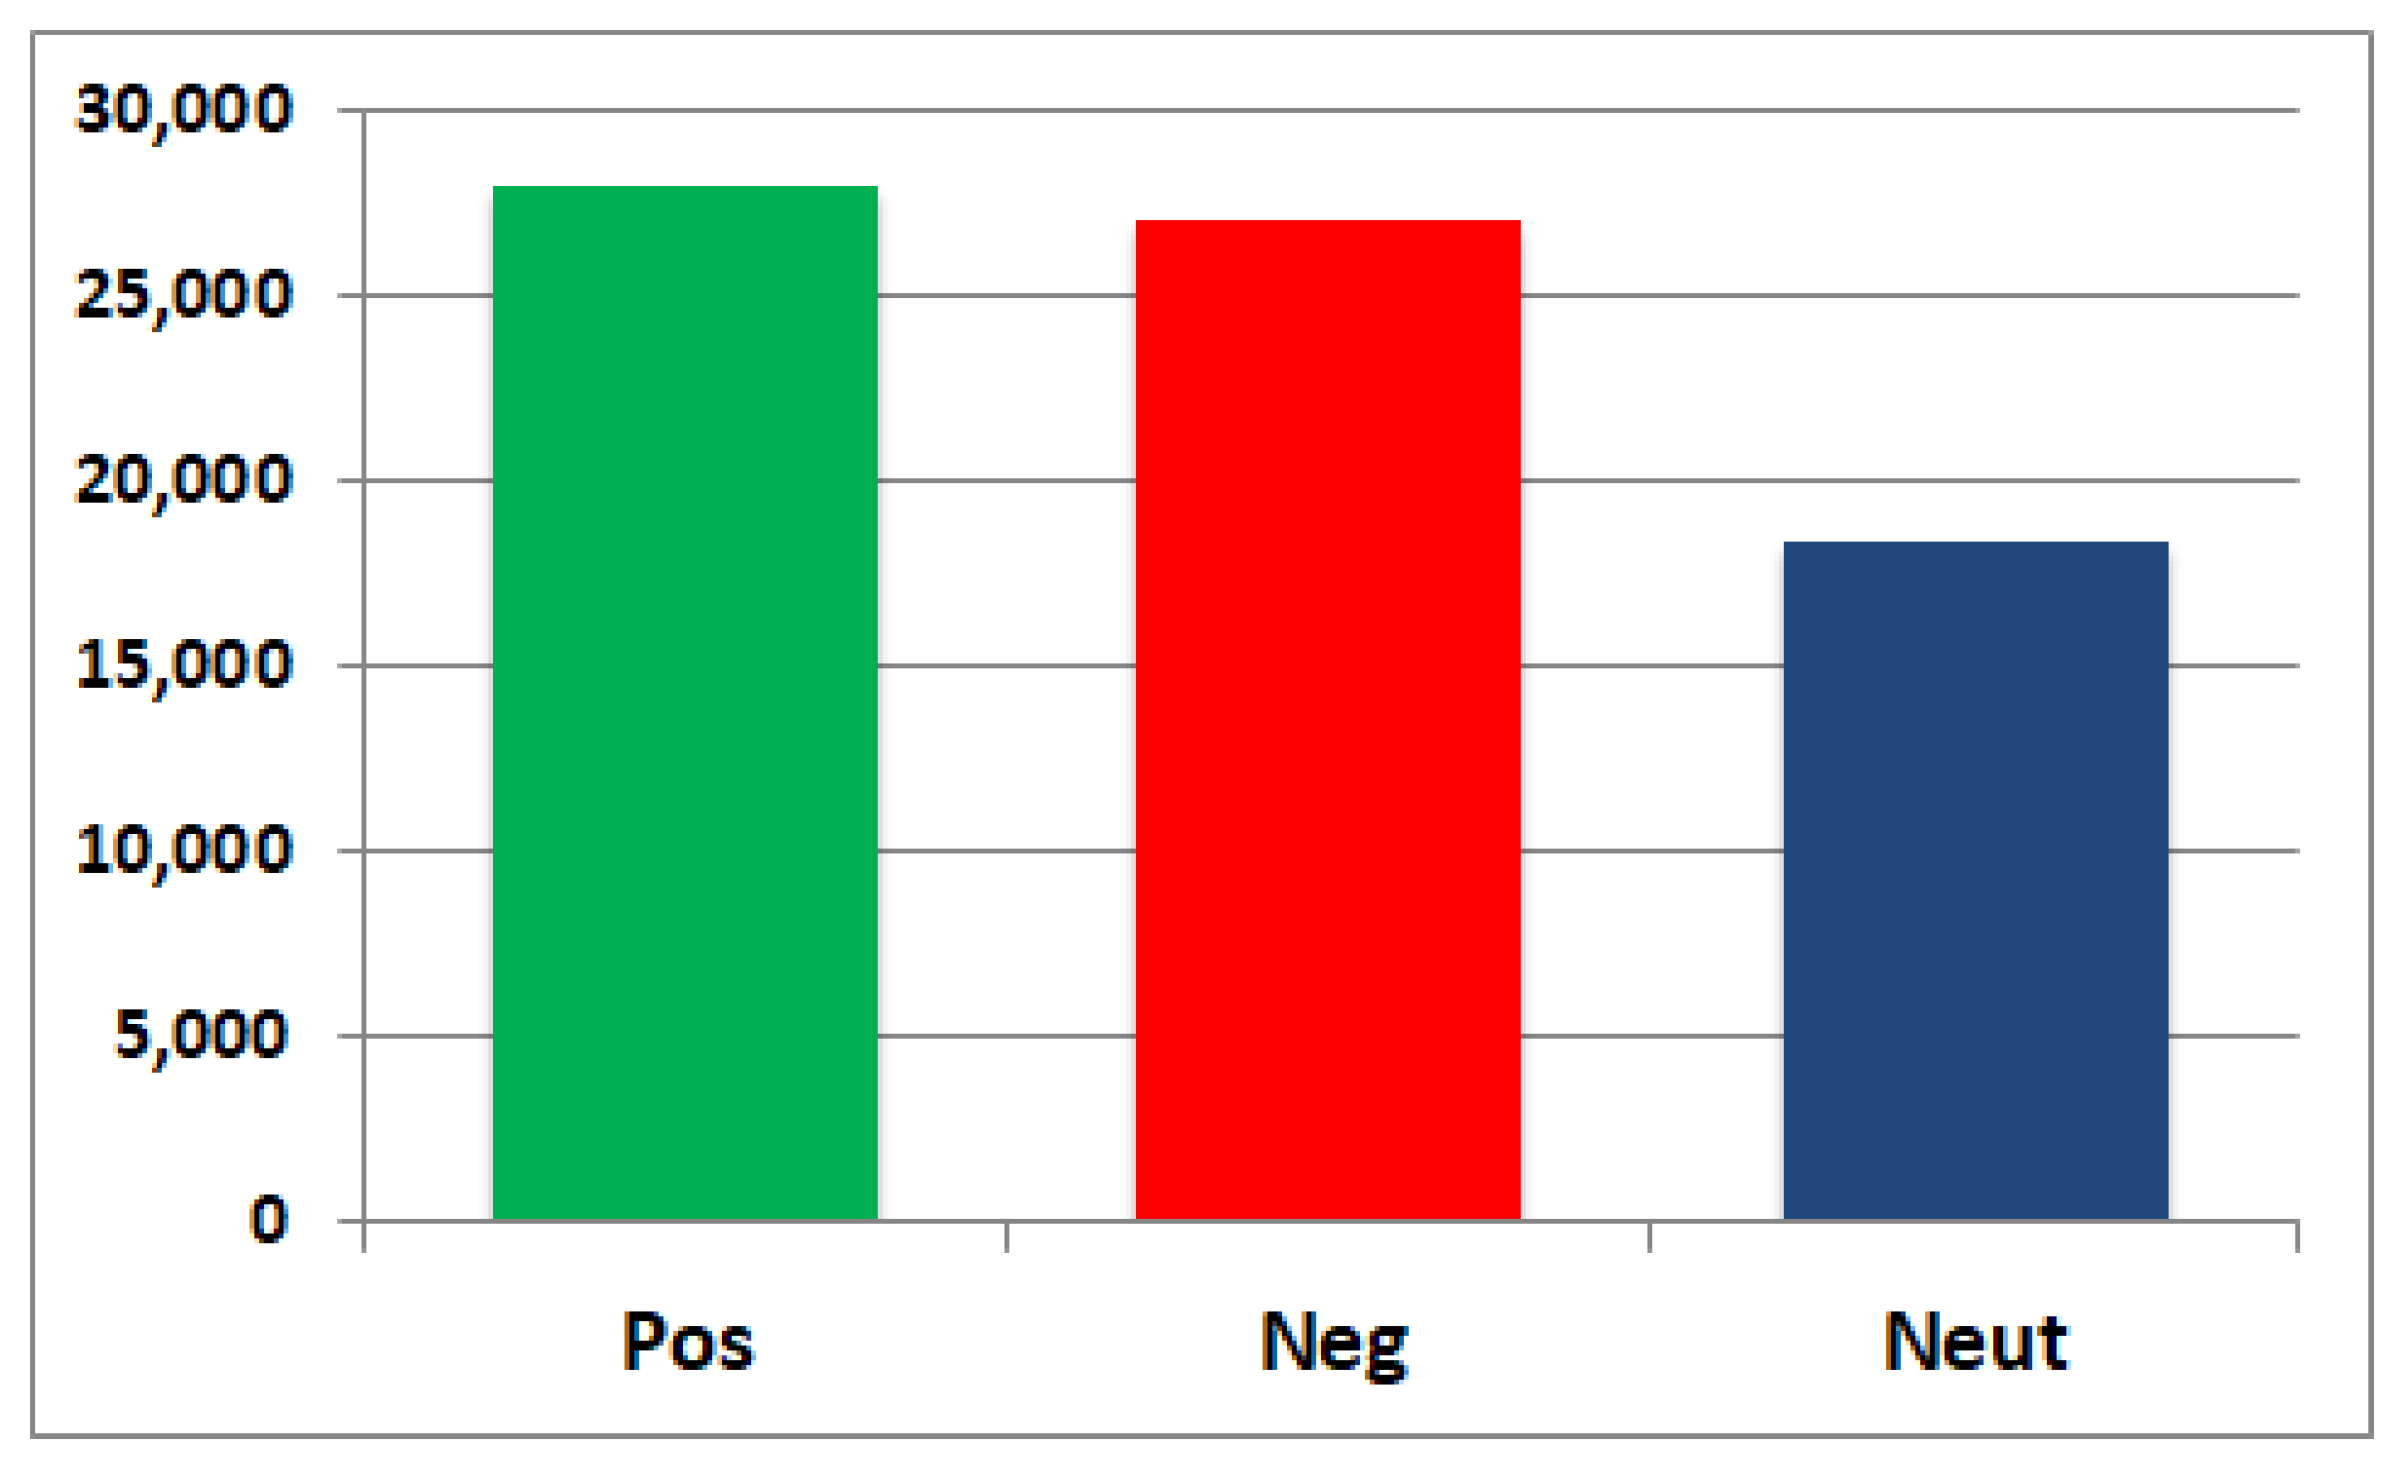
The polarity (pos, neu, neg) and compound sentiment scores of some positive and negative tweets were computed using VADER for the COVID-19 tweets dataset.
Table 5 shows the results obtained. The polarity and the sentiment scores of the tweets are computed using the sentiment analyser class of the VADER tool in the Python module. The bar graph in
Figure 4 shows the count of overall positive (21,907), negative (13,755), and neutral (8517) tweets in the dataset. It can be observed that the count of positive tweets exceeds the negative and neutral tweets.
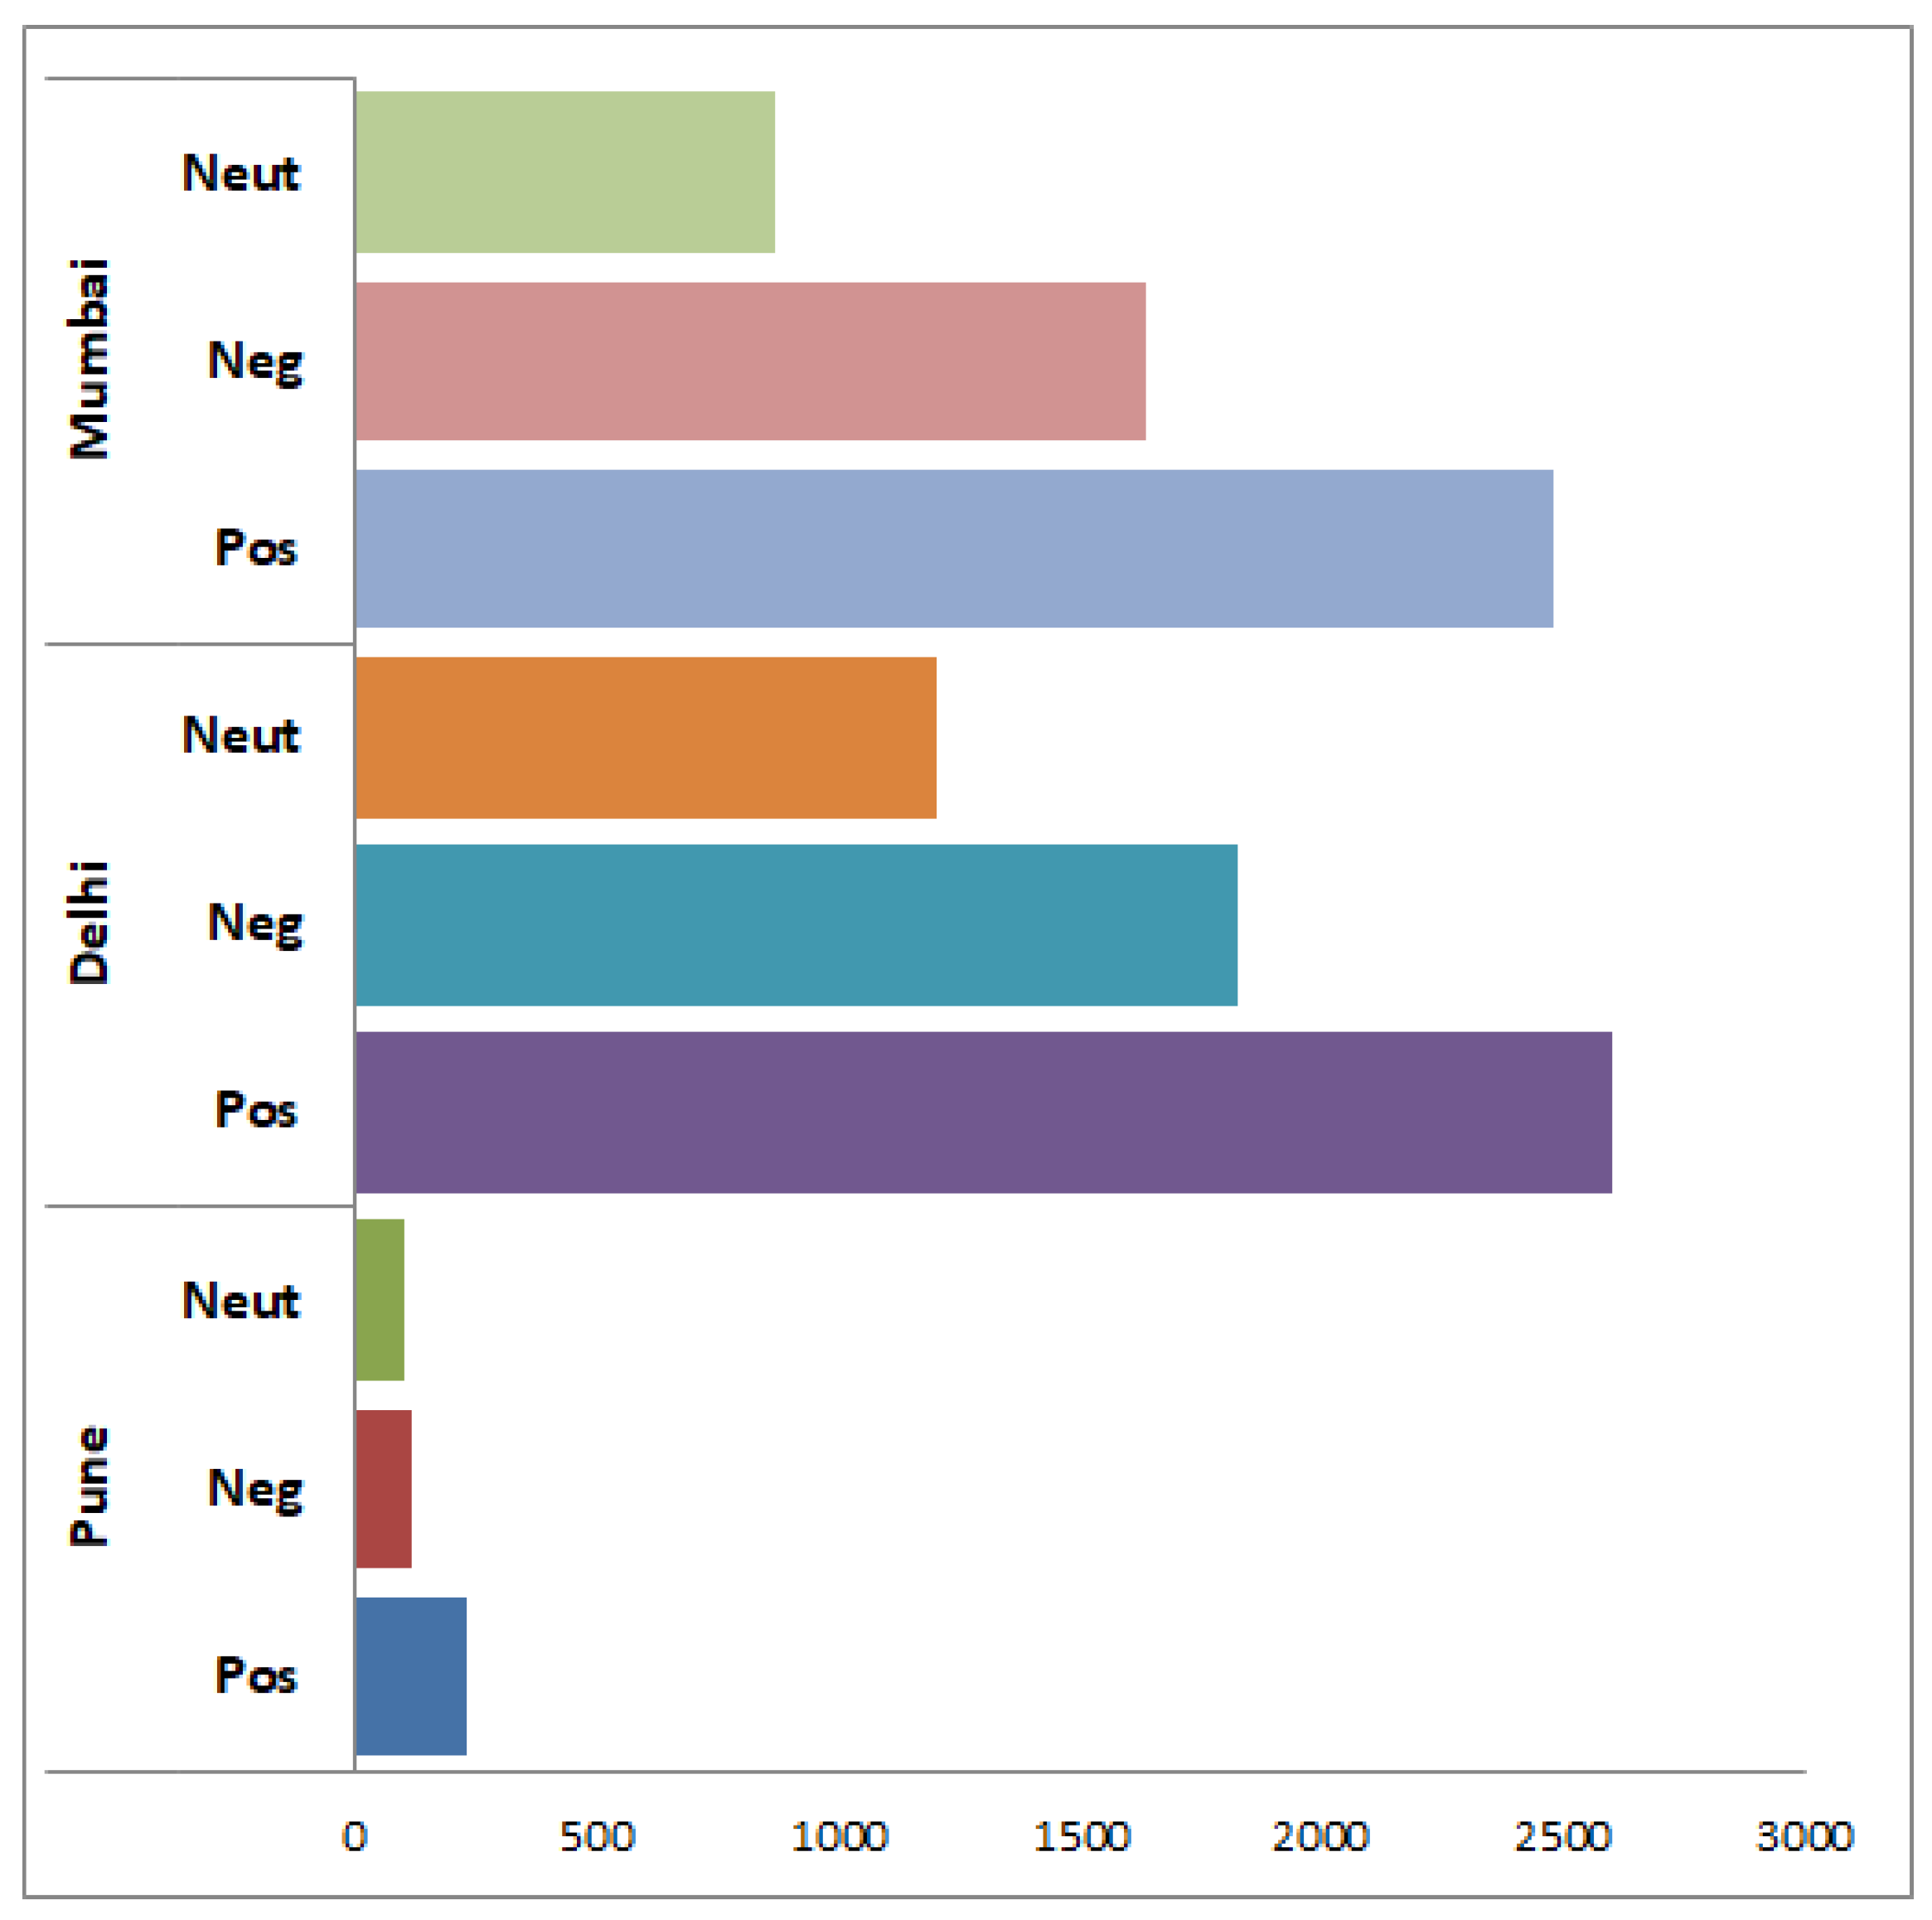
Figure 5 shows the overall positive, negative, and neutral tweets count for the three cities of India: Pune, Delhi, and Mumbai.
4.2. Emotion Effects of Vaccine Tweets with NRCLex
NRCLex is an MIT-approved PyPI project by Mark M. Bailey. It is used to predict the sentiments and emotions of an input text. The dictionary contains around 27,000 words and is based on NLTK library’s WordNet synonym and NRC Canada affect lexicon [
55]. The lexicon comprises a list of English words and their mapping with eight elementary sentiments (joy, anger, surprise, fear, sadness, anticipation, trust, and disgust) and two polarities (positive and negative). NRCLex module is imported in Python code to classify the emotions of tweets from the vaccine dataset.
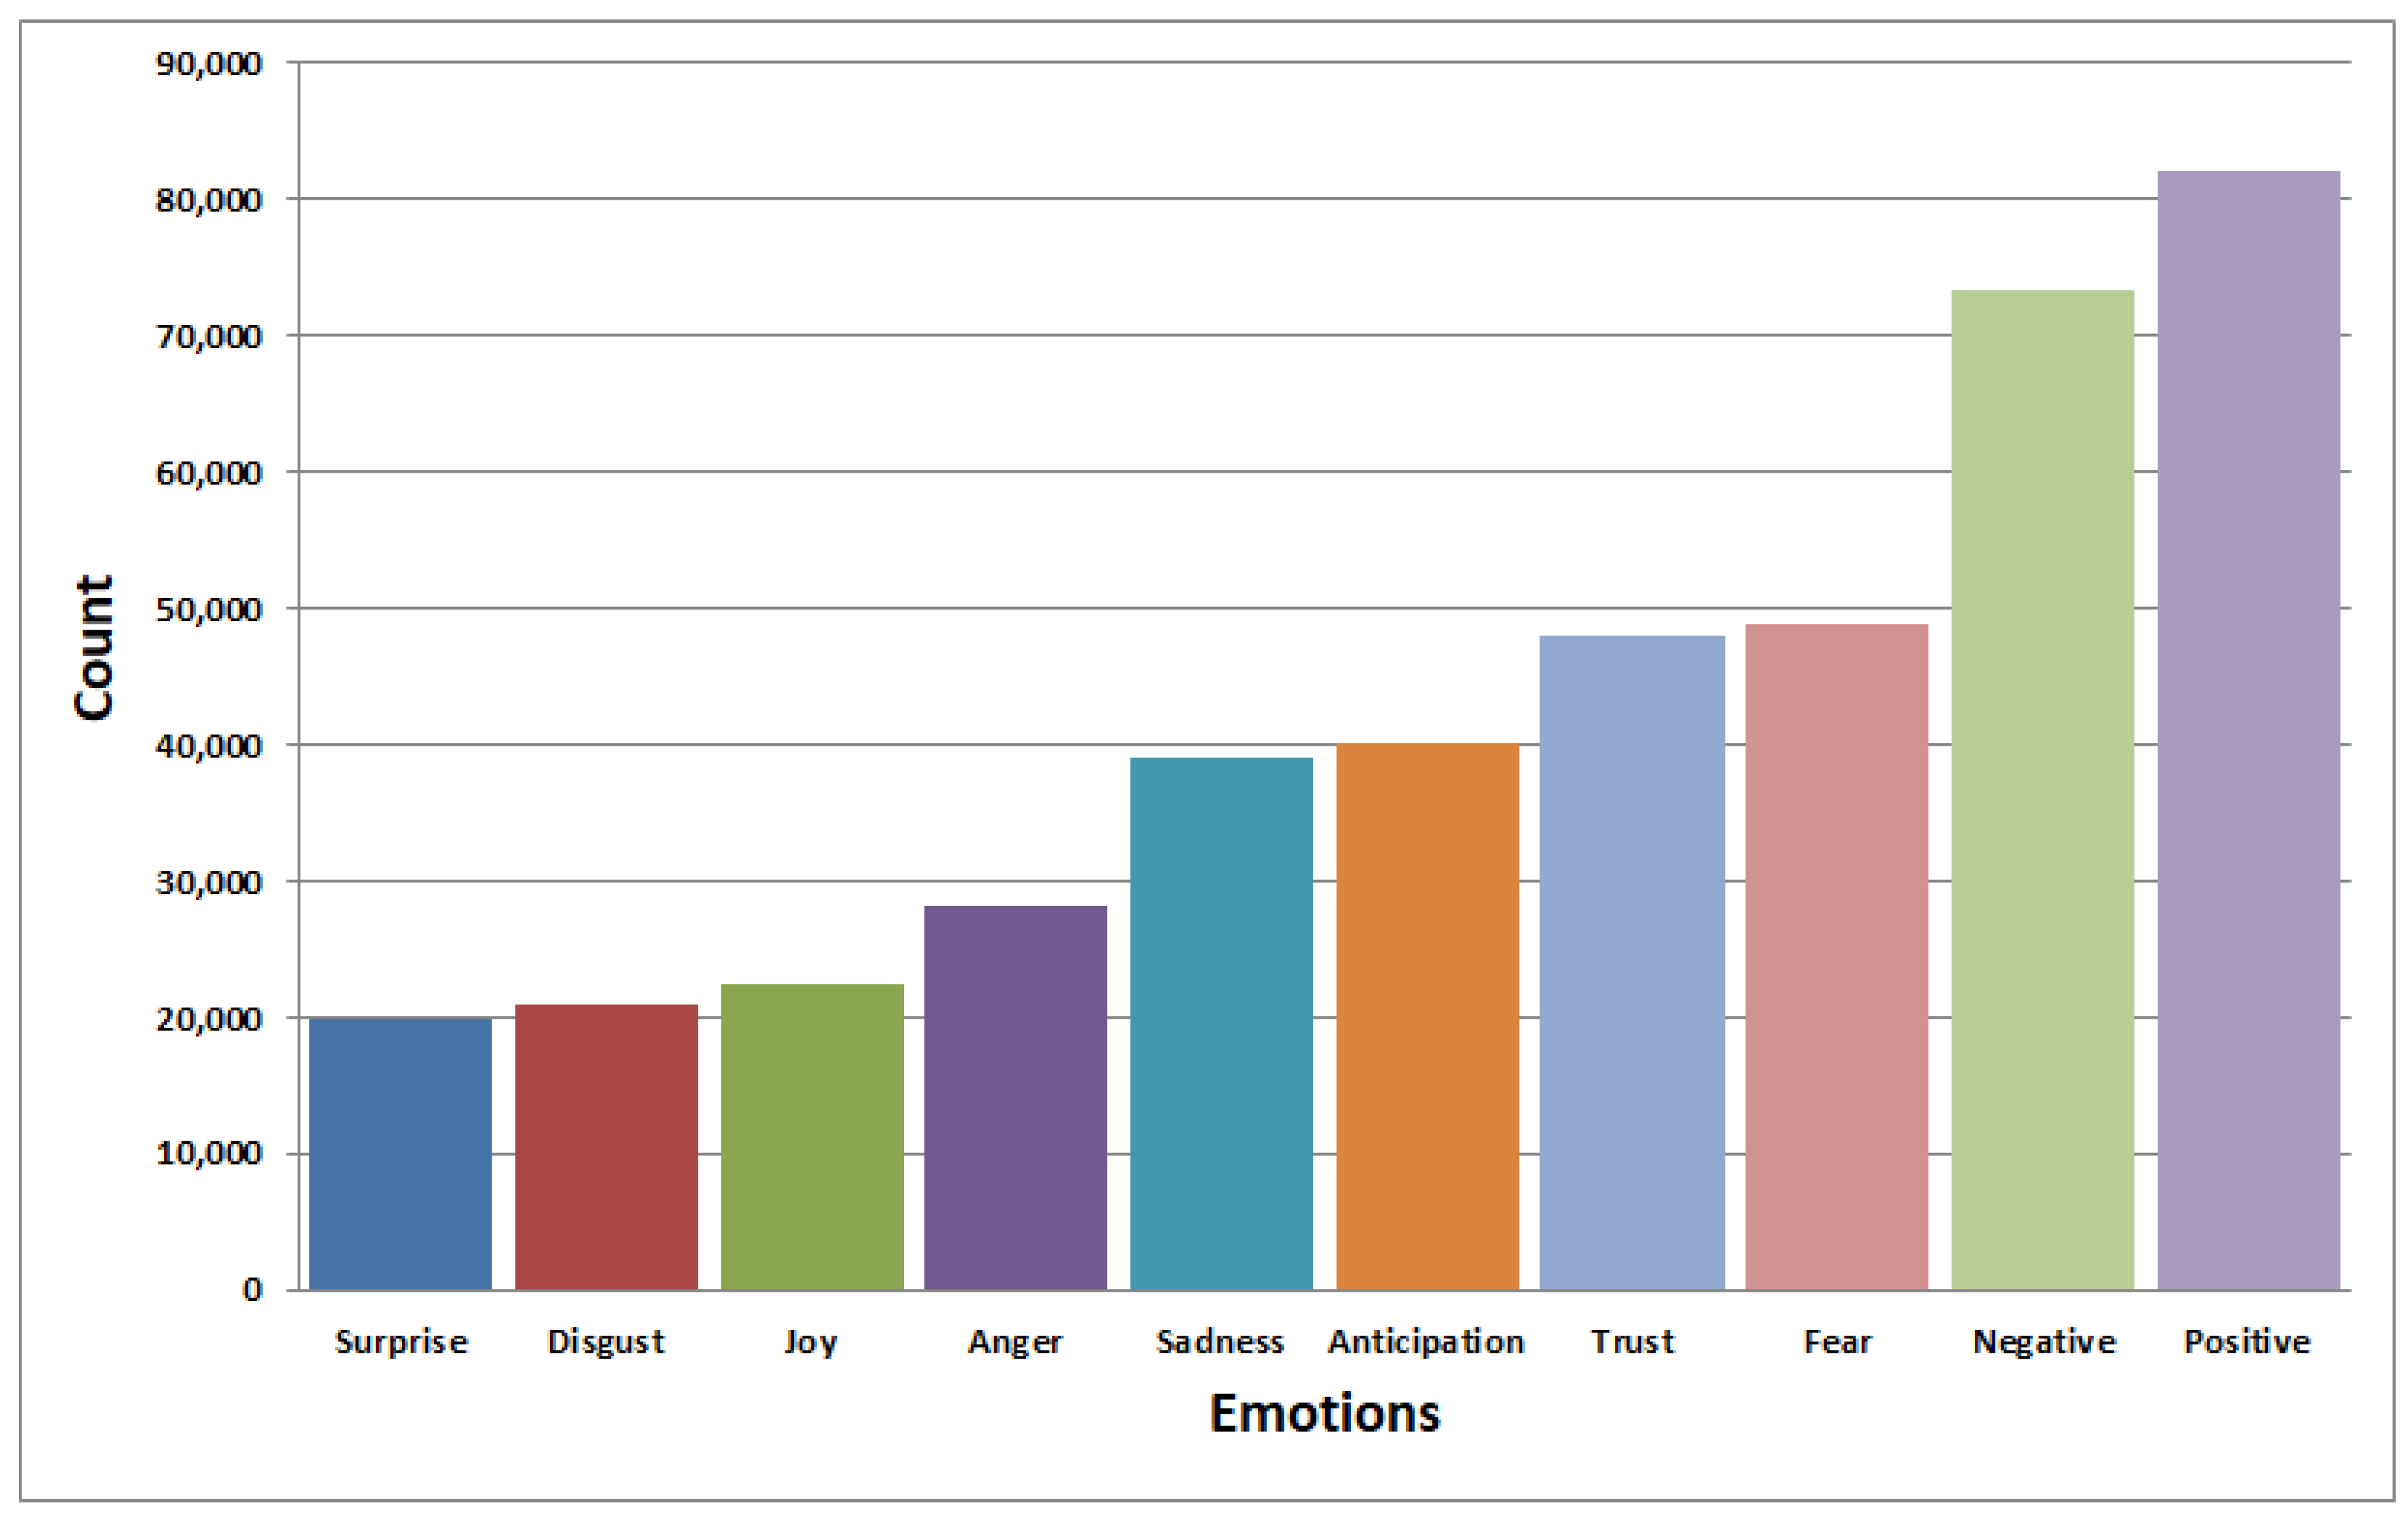
The graph in
Figure 6 shows the result of vaccine tweets classified into different emotional effects. The tweets dataset was extracted from the Kaggle platform [
56]. The graph reveals that the positive sentiments (‘positive’, ‘joy’, ‘trust’) score higher than the negative emotions (‘negative’, ‘disgust’, ‘anger’). The result indicates that people are positive about vaccination.
Table 6 shows the distribution of the number of tweets into various emotion categories.
5. Sentiment Analysis Using Deep Learning Approach
Deep Learning is a machine learning technique inspired by the structure and functioning of the human brain. A deep neural network consists of two or more layers of computing units called neurons working in parallel to simulate the workings of the human brain [
57,
58]. Deep learning models have led to revolutions in text mining, computer vision, and speech recognition [
59].
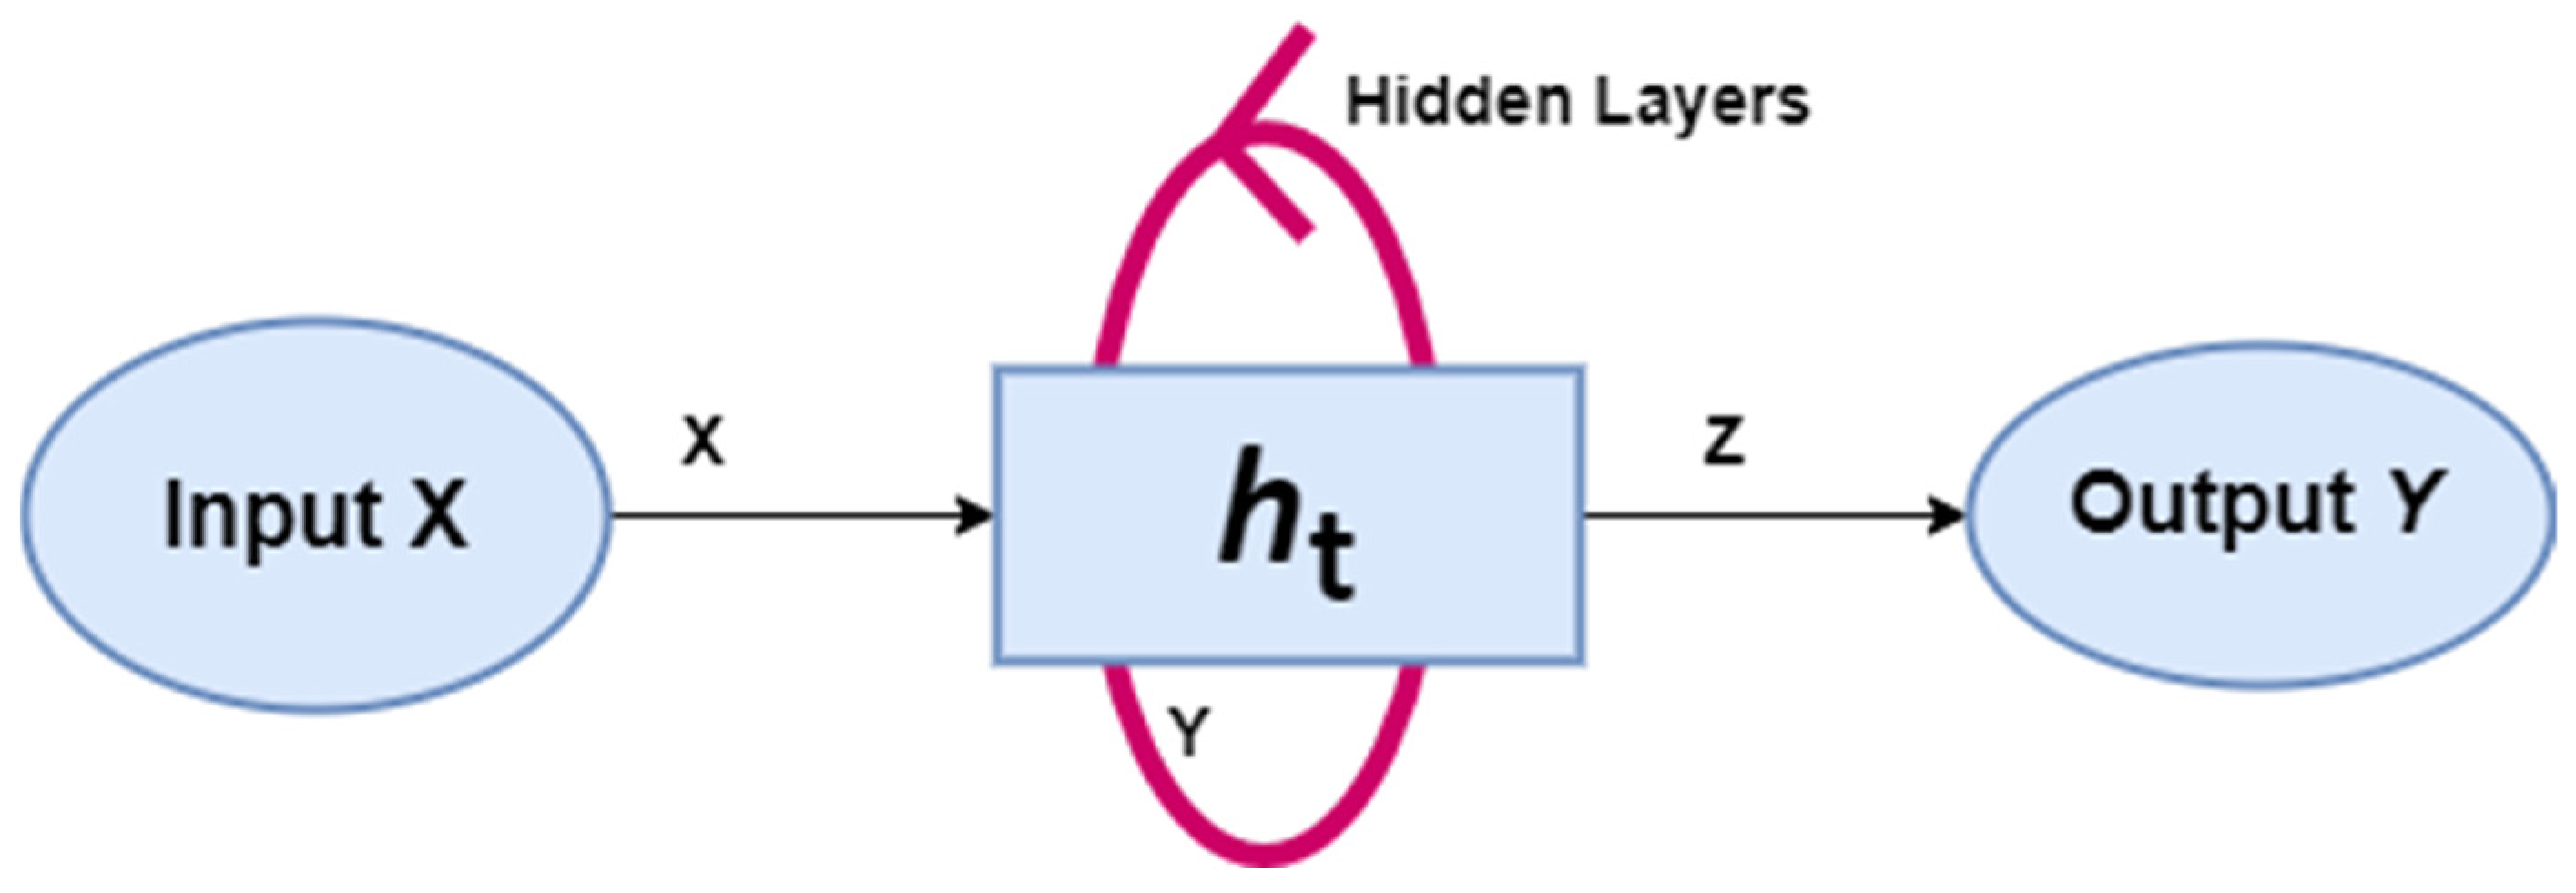
A Recurrent Neural Network (RNN) is a variation of deep neural learning in which time-series or sequential data are used to train the network. An RNN is used to train the model in the proposed work. Here, RNN is used to identify the sentiments in the tweets. It differs from traditional deep neural networks because it has “memory”. In RNN, previous information in the sequence influences current input and output. For example, to predict the next term in a sentence, it is necessary to remember the previous terms. The hidden layer plays a very important role in RNN as it remembers the states of previous information.
Figure 7 shows the general architecture of RNN. The same weight and bias are assigned across all the hidden layers in the RNN to reduce the complexity of the network. This makes the RNN remember the previous outputs that are fed as input to the next layer. The diagram shows that all the intermediate layers are combined to form a single recurrent unit.
X is the input layer,
h is the hidden layer,
Y is the output layer. The parameters
X, Y and Z are used to improve the network performance. Equation (1) is applied to compute the current state.
where
is the current state and
is the previous state.
There are two problems with RNN: 1. Vanishing gradient and 2. Exploding gradient. A vanishing gradient problem arises in the network when there is a small value of gradient present, causing an insignificant parameter update. In exploding gradient problems, the slope tends to grow exponentially due to the accumulation of large gradient errors, which causes large updates to the model. Learning a long data sequence for the model will become difficult due to these problems. As a result, the model will experience low accuracy, more learning time, and poor performance. These problems can be handled using two variants of RNN: LSTM [
60] and GRU [
61].
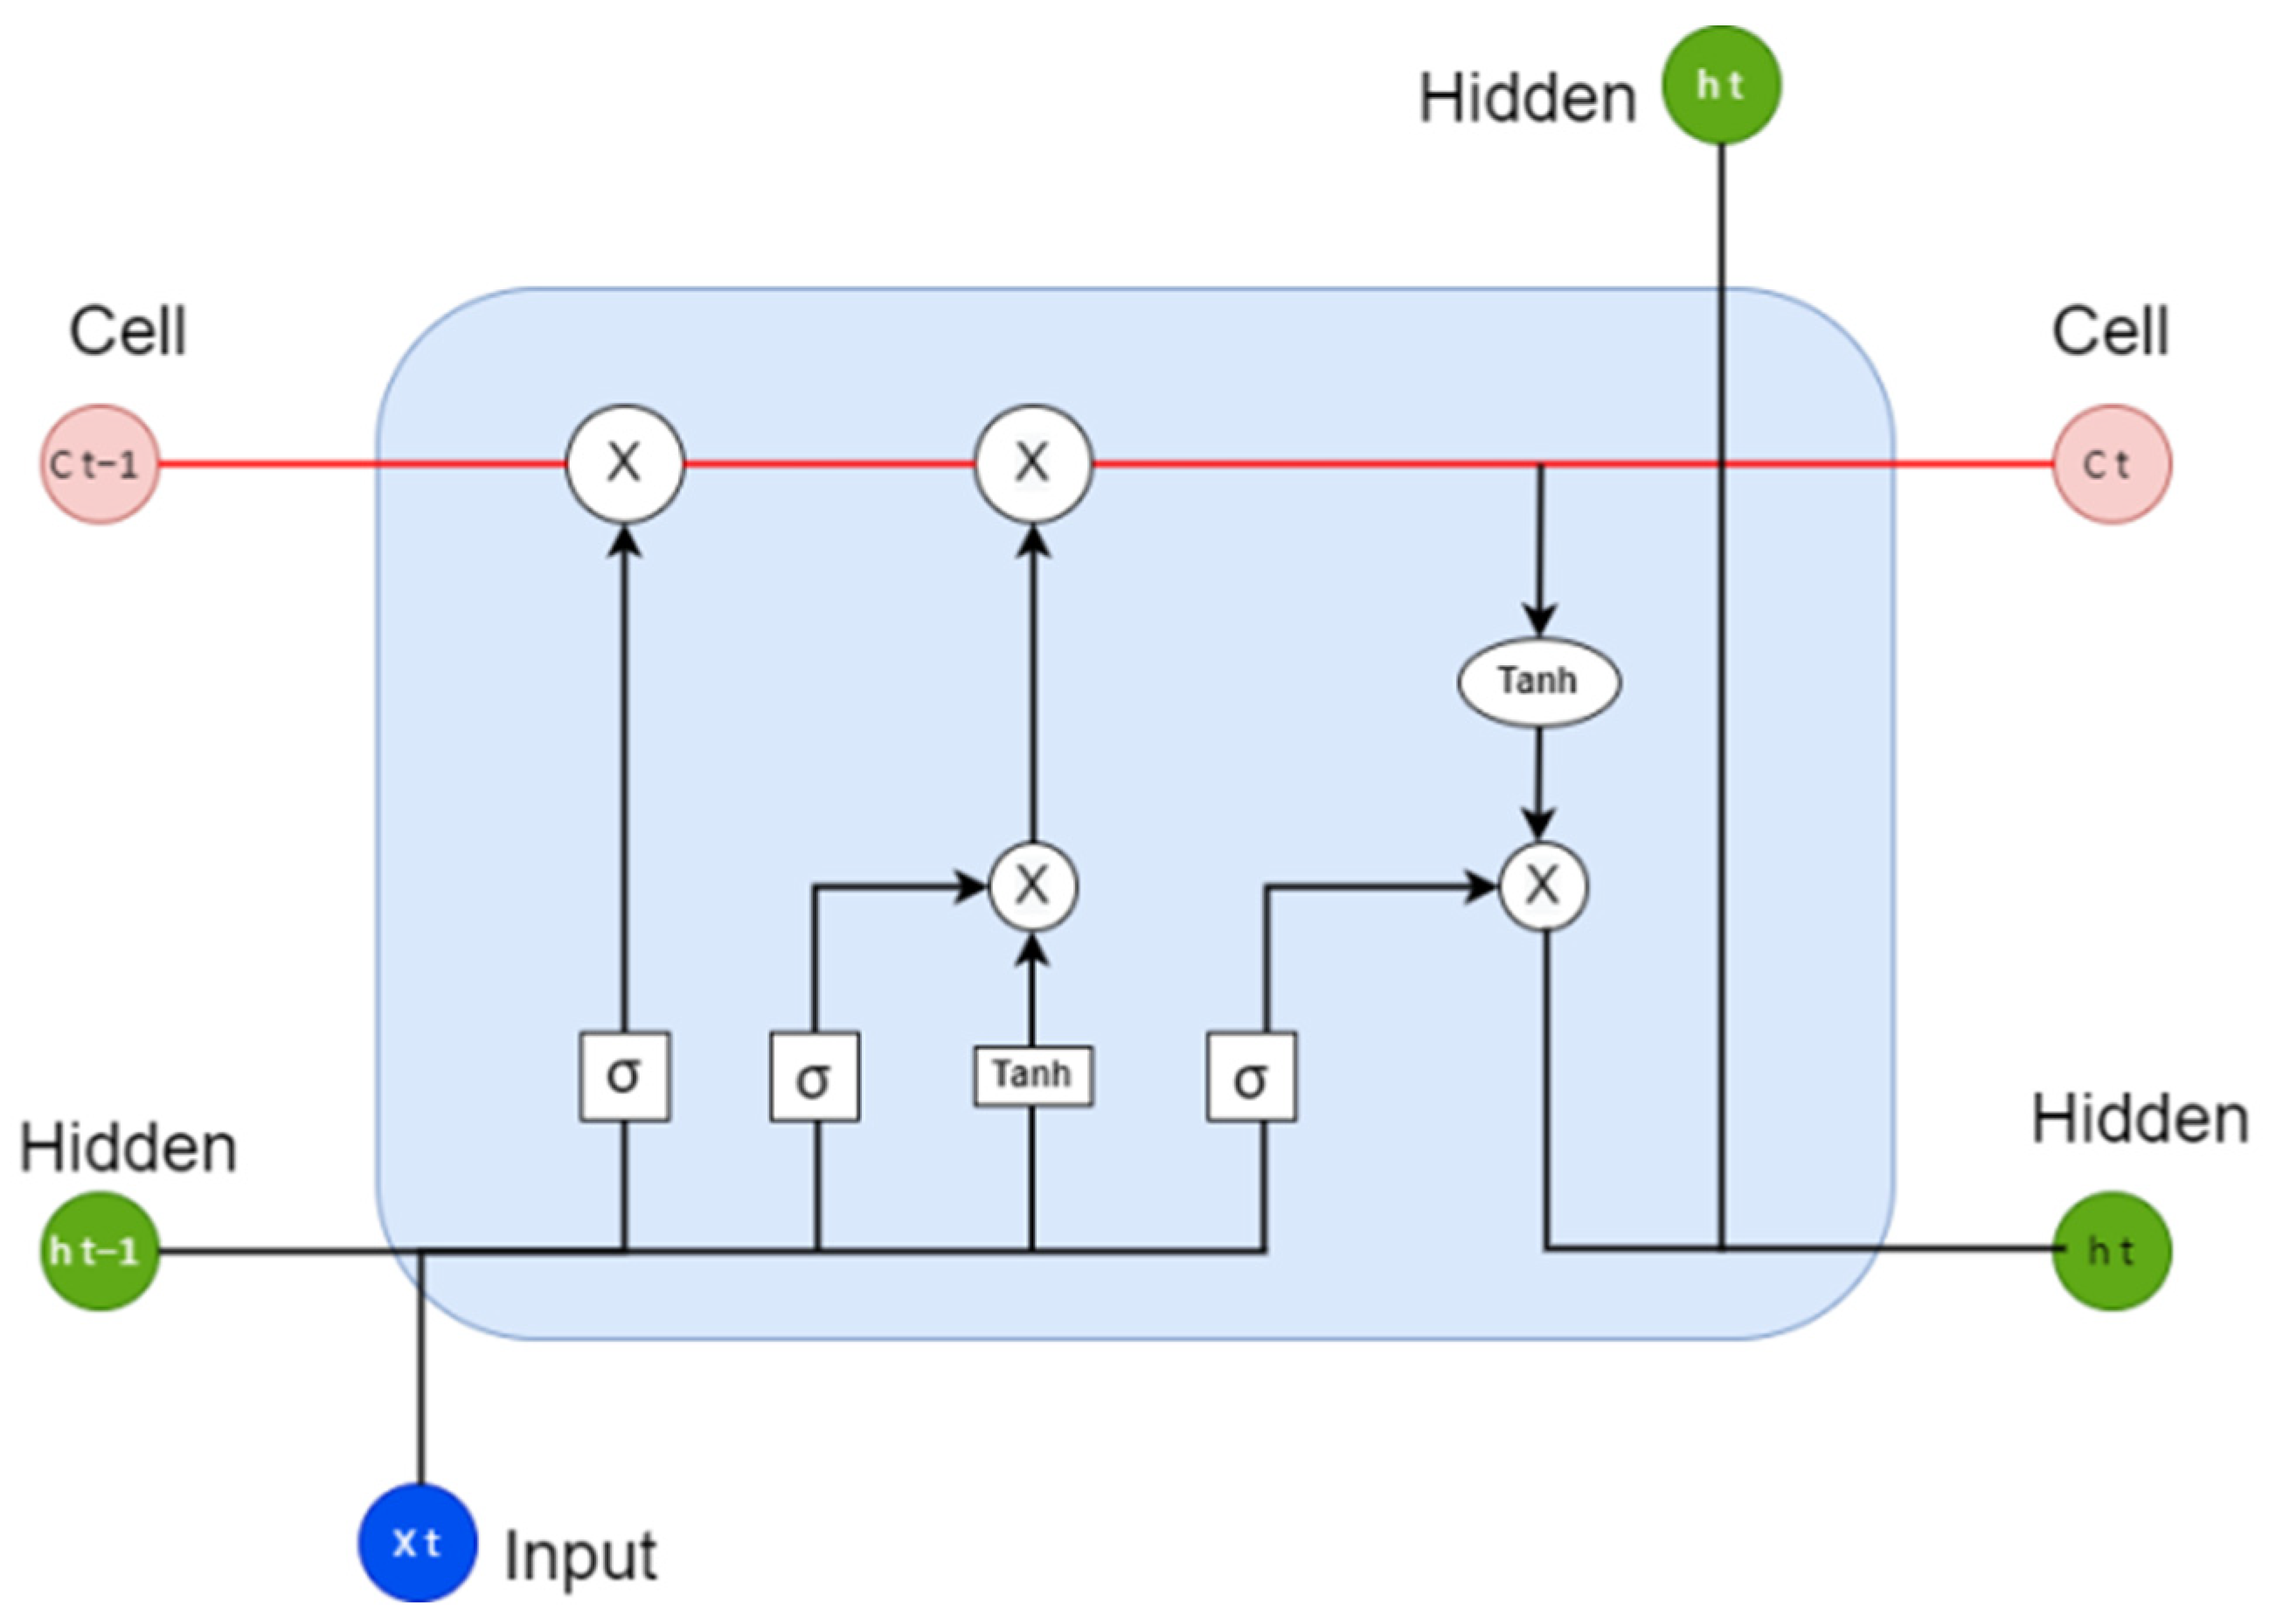
The general architecture of LSTM is shown in
Figure 8. The network comprises three gates: an input gate, an output gate, and a forget gate. The input gate uses the Tanh or sigmoid functions to add information to the cell using the following equations:
where
x is the input value.
Selecting the correct information from the current cell and showing the output is the responsibility of the output gate. This is again done with the help of Tanh and sigmoid. The forget gate removes the less important information from the cell. The forget gate takes two inputs:
ht−1 and
xt. The information from the previous output is 1, and the forget gate transmits the data into the network. If the value is 0, then data are not transmitted to the network. All three gates control the LSTM memory using the following equations:
where
W is weight, matrix,
b is weight vector,
X is the input value, Γ
u is the update gate control, Γ
f is the forget gate control, and Γ
o is the output gate control.
where Equations (8)–(10) are for the new memory cell, memory cell, and hidden cell.
It has already been proven that traditional LSTM models perform well for textual sentiment analysis [
62,
63]. Traditional LSTM networks are better at handling long-term dependencies as they learn from the past. However, Bi-LSTM networks learn from both past and future data. These networks preserve the past data using forward pass and backward data using backward pass. Bi-LSTM networks are better at learning, suitable for complicated data and have better accuracy [
64]. Therefore, Bi-LSTM and GRU networks have been used for emotion prediction on Indian tweets collected from Twitter from March 2020 to May 2020.
Figure 9 shows the architecture of the proposed model using a deep network approach.
The tweets were cleaned and pre-processed, as explained in
Section 3.1, to create a new dataset of tweets along with their corresponding sentiment labels, i.e., positive (1), negative (0), and neutral (2). For the same, Keras Text Vectorization layer is used. The layer converts a string into an encoded representation and is read as input using the Embedding layer. Then, the dataset was split into two parts to building the model. The model was trained using 80% of the dataset, and the remaining 20% was used for testing.
5.1. Model Evaluation
The model calibration was performed by adjusting certain model parameters such as the number of epochs, loss function, training algorithm, batch size and learning rate etc. The CNNs were trained using the Adam optimizer algorithm and a learning rate of 0.001. Adam is an effective optimisation algorithm used in deep learning. The loss function was set to sparse categorical cross-entropy loss, which is an ideal choice for multi-class classification problems. The model was trained using a different combination of batch sizes and the number of epochs. It was observed that the model’s performance was optimal for a batch size of 64. Therefore, the batch size was set to 64.
The model performance is measured using standard metrics such as accuracy, F1-score, specificity sensitivity and recall. For evaluation, we have computed four important values from the predictions: True positives (TP) are the correctly predicted tweets. True negatives (TN) are correctly predicted negative tweets, False Positive (FP) are incorrectly predicted correct tweets, and False Negatives (FN) are positive tweets that are incorrectly predicted to be negative.
Accuracy defines the number of class labels identified correctly by the model and is computed using the following equation.
Specificity is the metric used to monitor true negative predictions made by the model. It is the relationship between the true negative predictions given by the model and the total number of negative assessments.
The sensitivity of the model measures the true positive predictions. The metric presents the ratio of true positive assessments to the number of correct negative and false positive assessments.
The
F1-Score is used to find the harmonic mean of precision and recall. It maintains the balance between precision and recall. The
F1-Score will reach to maximum when precision becomes equal to recall.
5.2. Results and Discussion
To carry out the experiment, the Keras library and TensorFlow framework were used on Google Colab to create Bi-LSTM and GRU networks. TensorFlow is an open-source library for deep learning applications and Keras includes high-level deep learning APIs running on top of TensorFlow [
65]. Google Colab is a cloud-based framework, which provides free access to machine learning tasks [
66]. In this study, Bi-LSTM was trained using seven layers and five epochs. The loss and Adam optimiser parameters along with two types of activation functions, are used. A set of dense layers with 128, and 64 units use Rectified Linear Unit (ReLu) activation function, and the final and outermost dense layer, which has three units, uses the softmax activation function. The model is trained using 64 batches and four verbose. The process is repeated for both datasets, i.e., COVID-19 and vaccination. The same setup was used for the GRU network and found an increase in performance accuracy.
Table 7 and
Table 8 describes the number of epochs, LSTM networks, training accuracy, training loss, validation accuracy and validation loss for the COVID-19 dataset.
Table 9 and
Table 10 show performance measurements of GRU and Bi-LSTM models for COVID-19 and vaccination datasets.
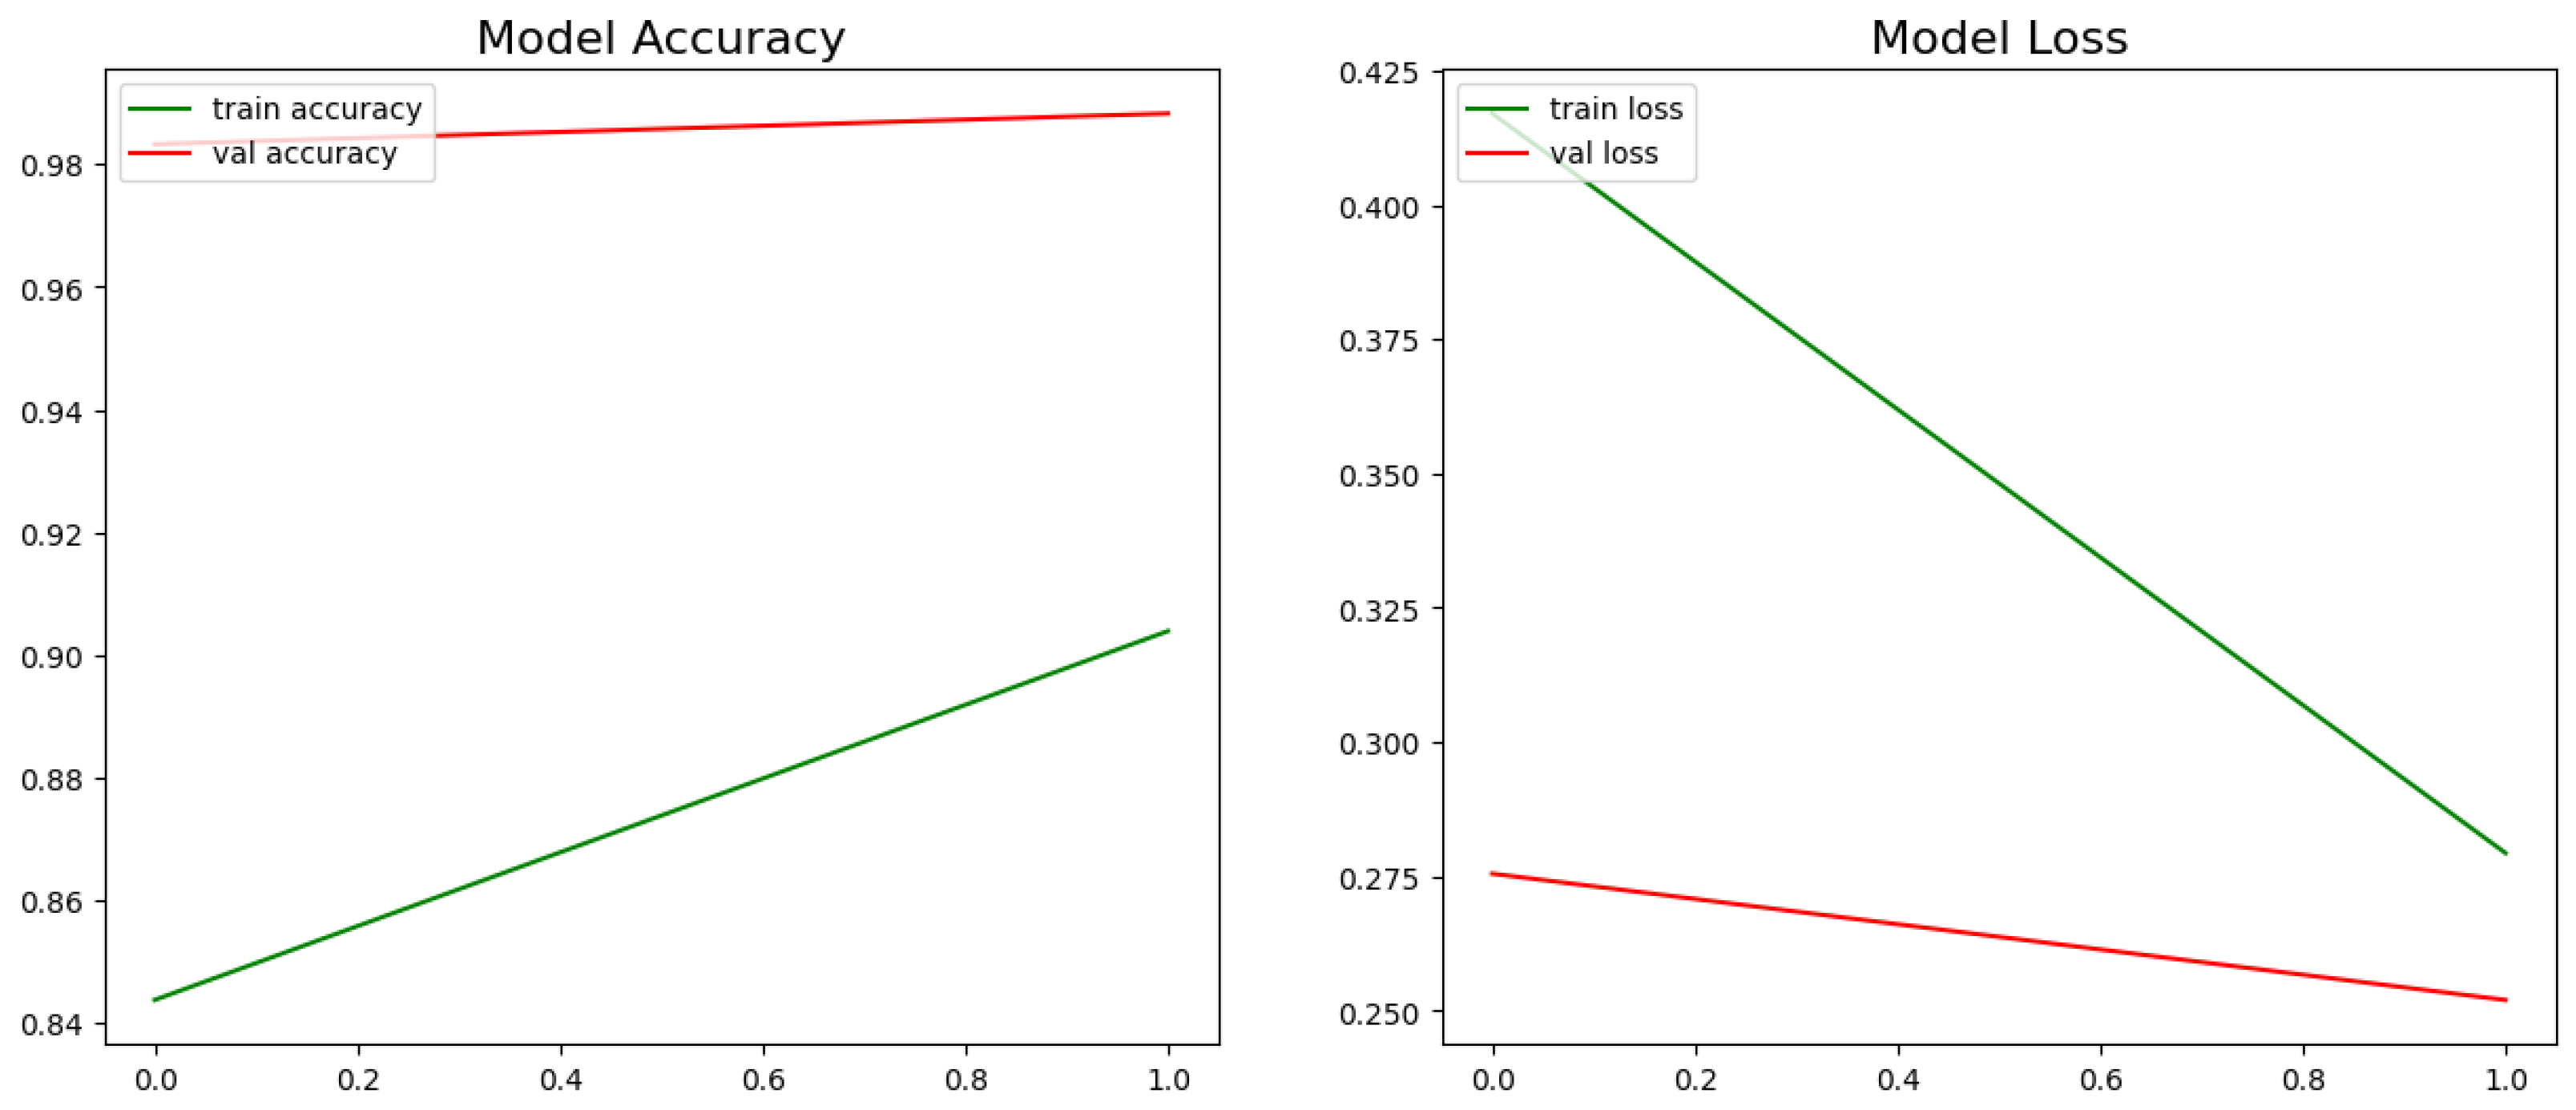
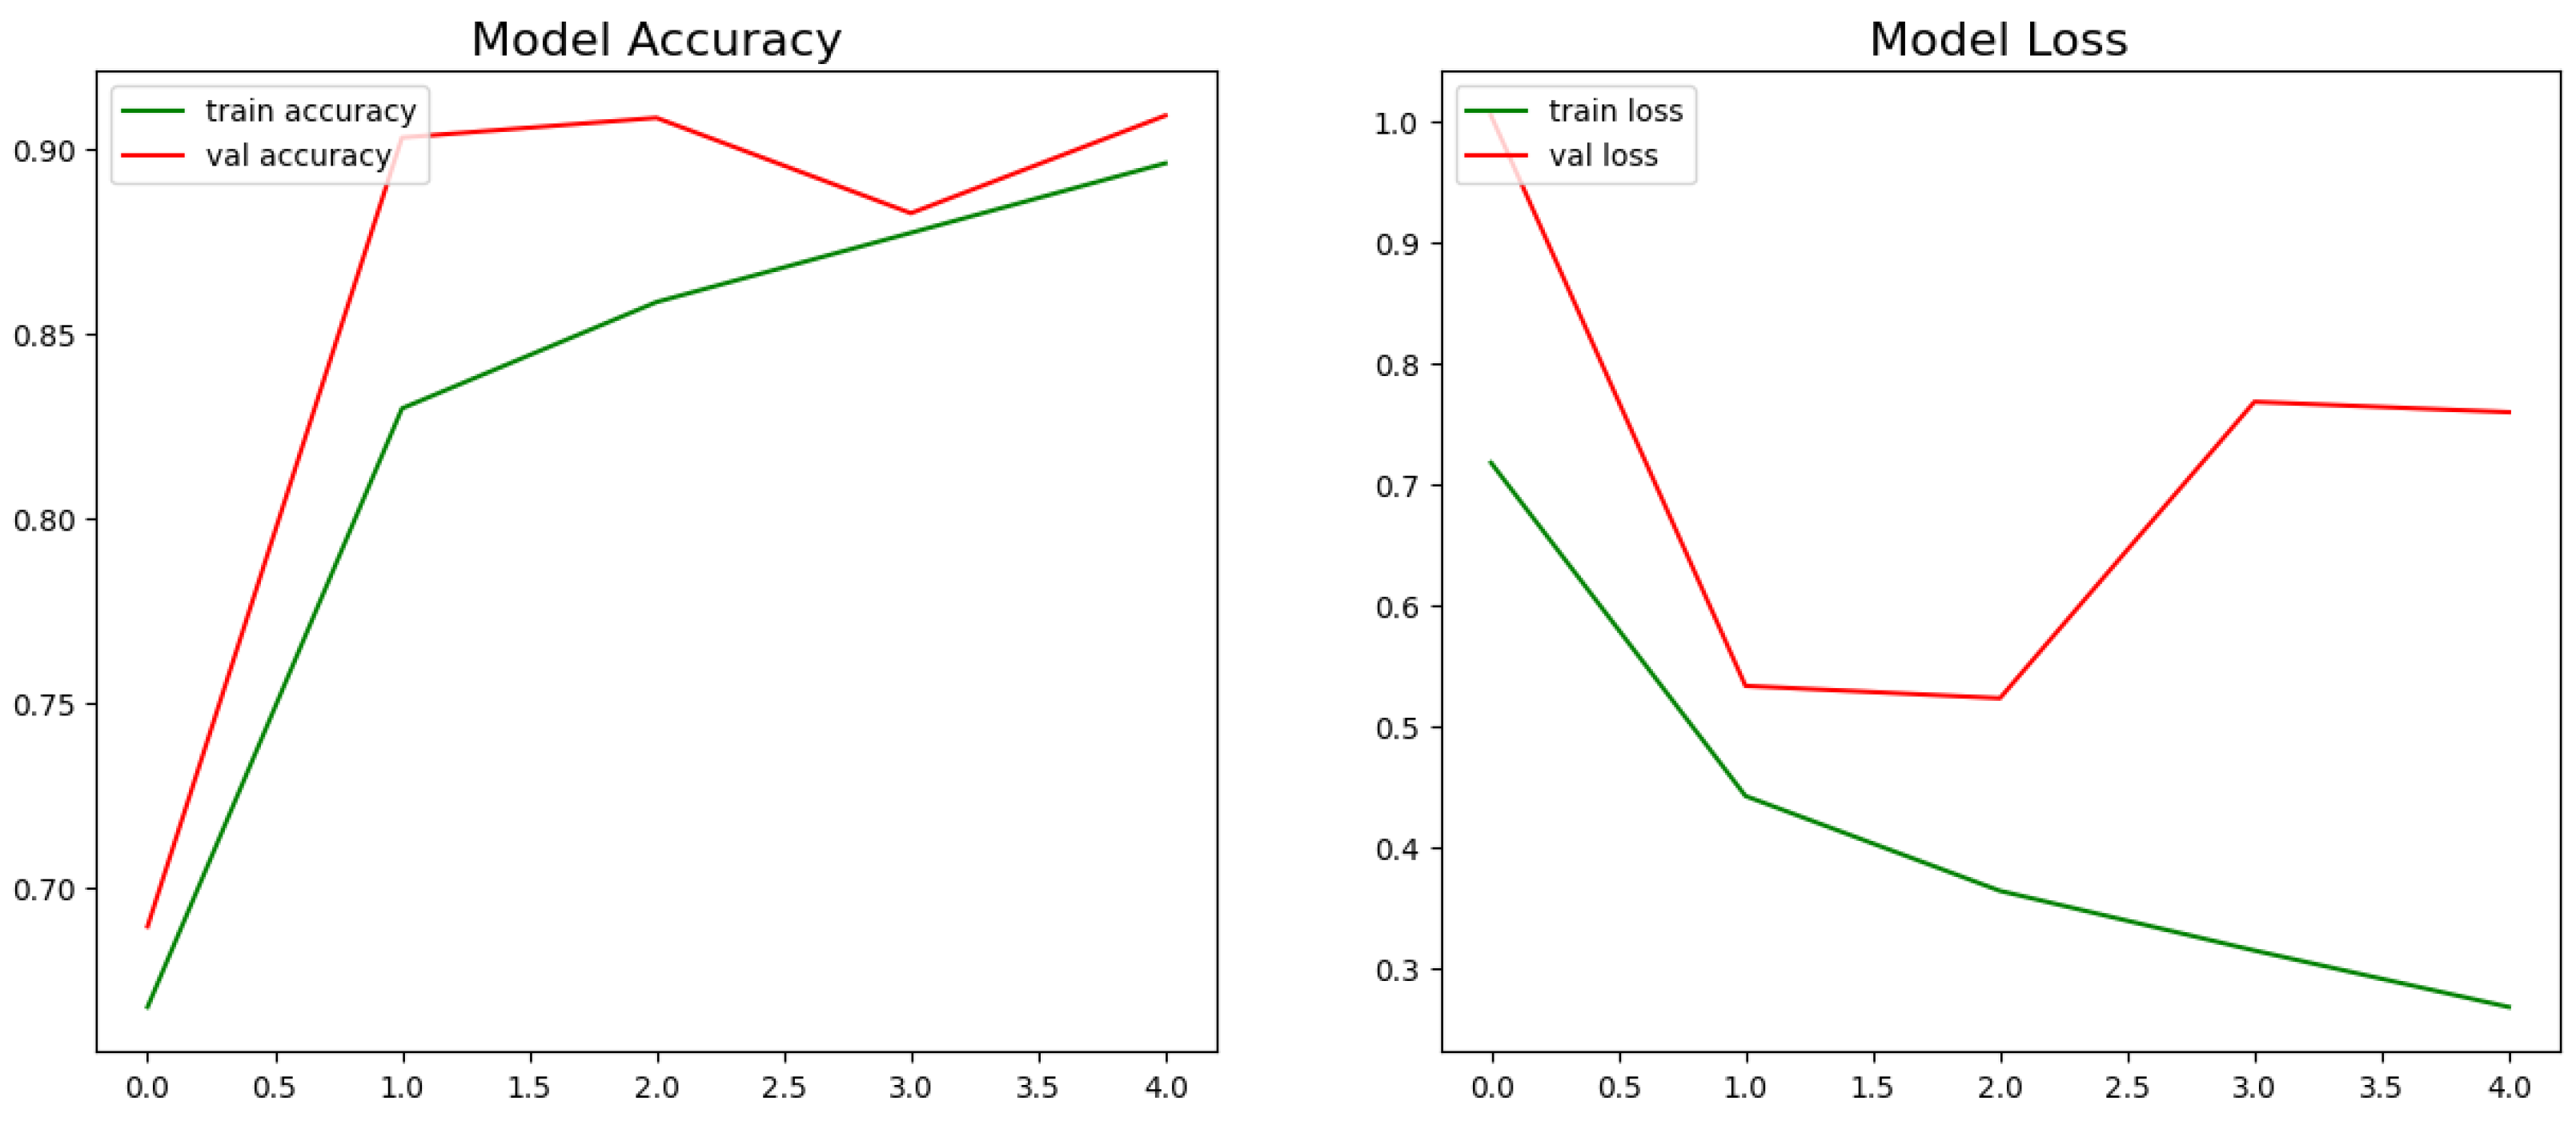
The model accuracy and loss during training and validation with GRU and Bi-LSTM networks are shown in
Figure 10 and
Figure 11 for the vaccination dataset. Using the GRU network, training loss has decreased with an increase in the number of epochs, but after the 5th epoch, the loss increased, and accuracy decreased. With the Bi-LSTM model, training accuracy and loss have increased after the third epoch.
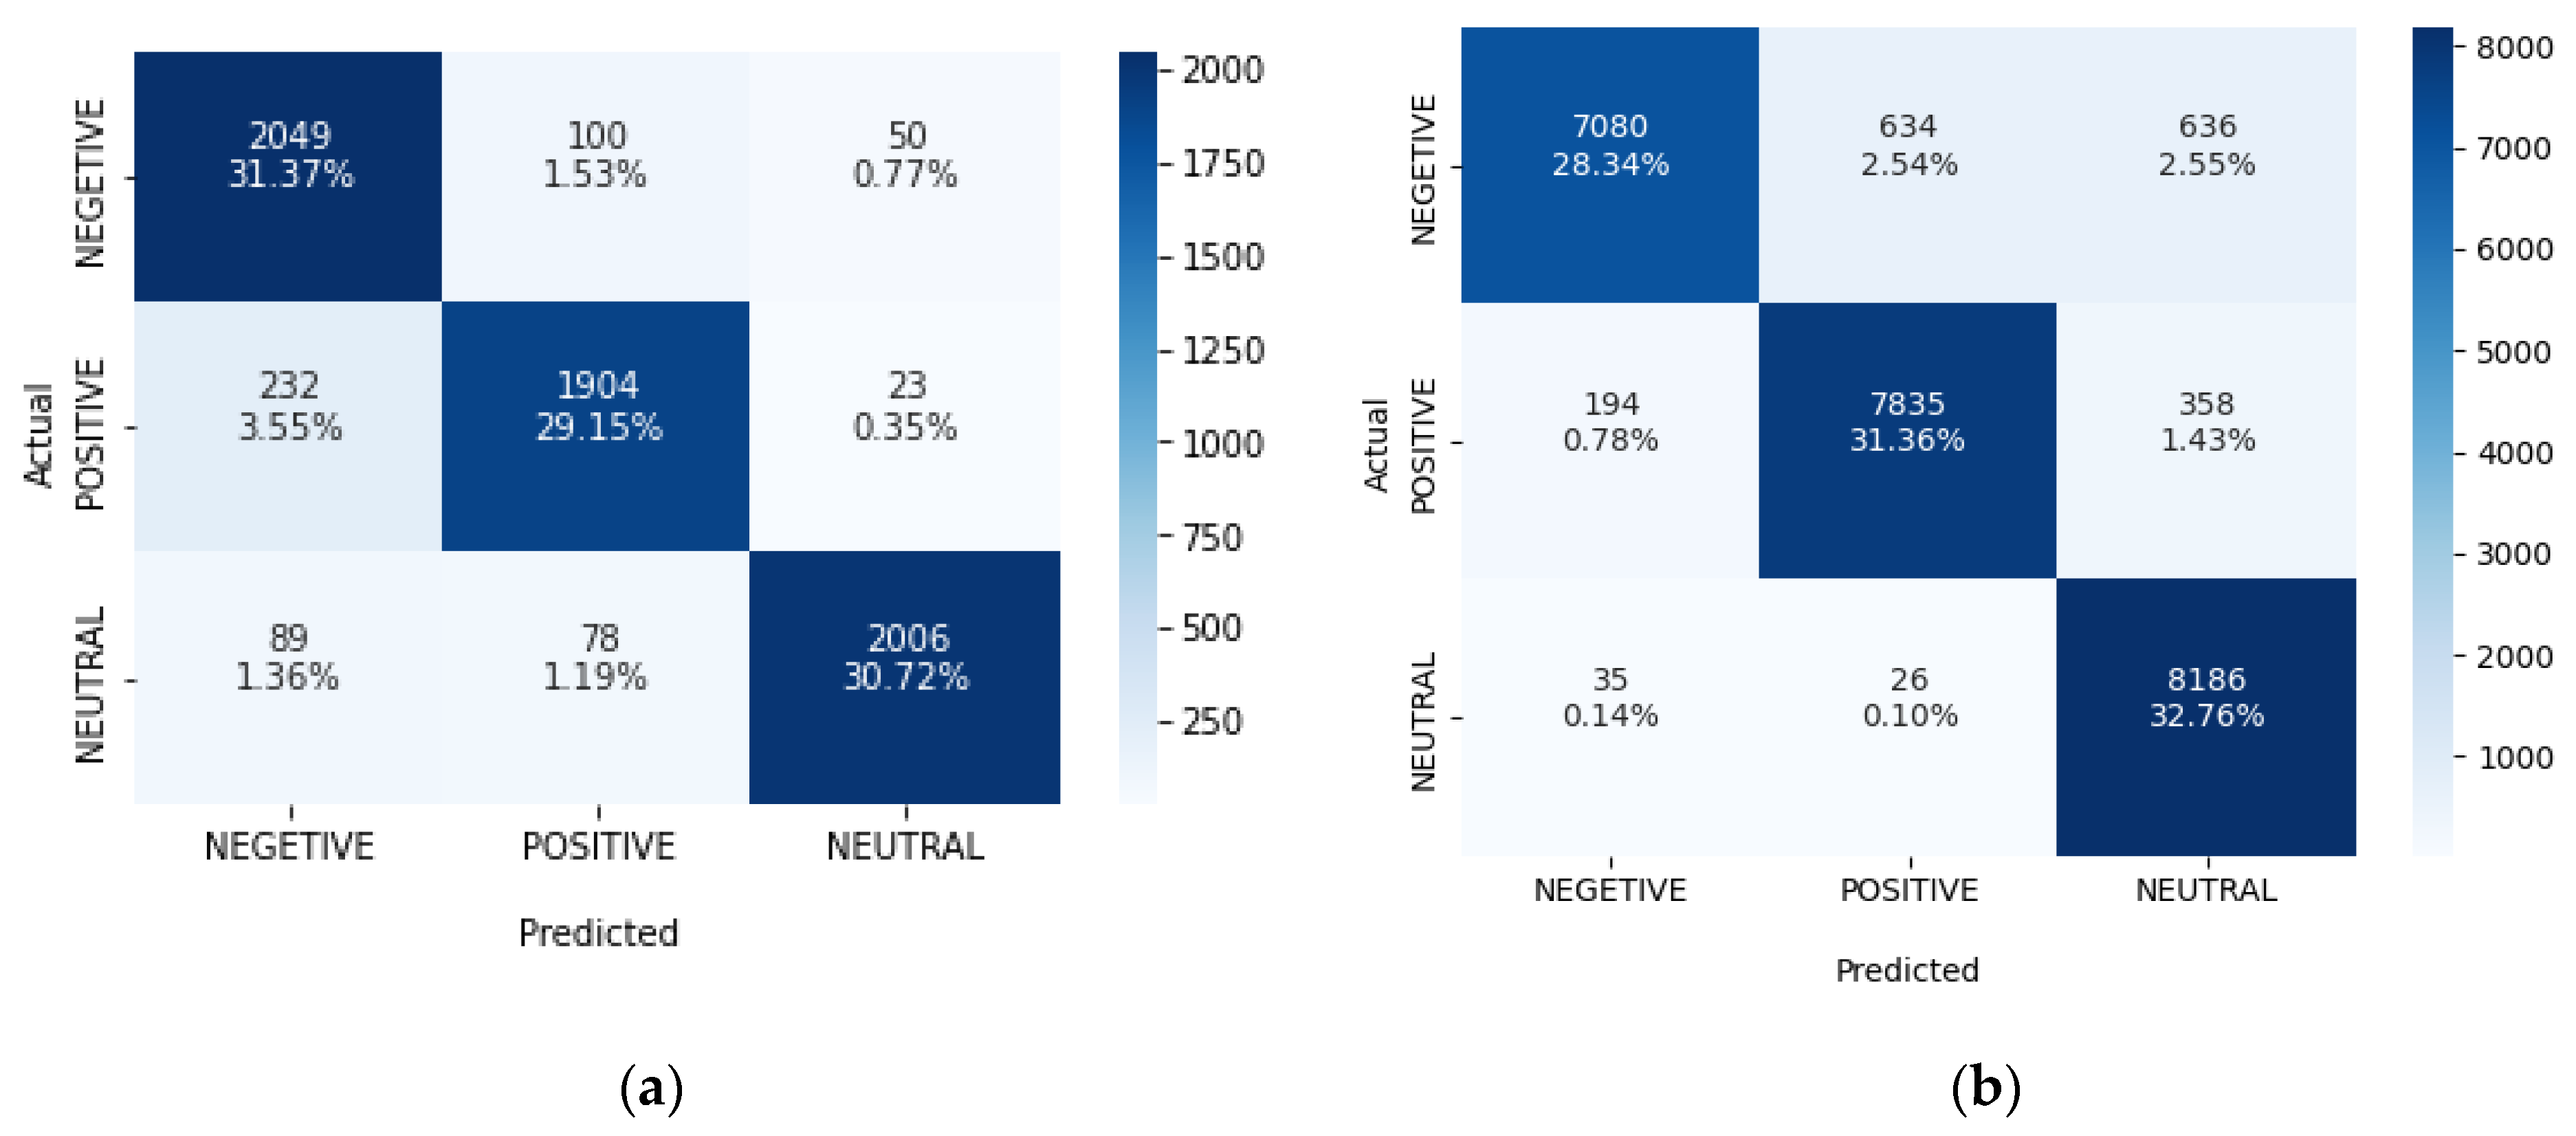
Models are tested with testing data and achieved final accuracy of 92.59% and 91.24%, with GRU and Bi-LSTM, respectively, for the COVID-19 dataset. With the vaccination dataset, 92.70% accuracy was achieved with Bi-LSTM and 92.46% with GRU.
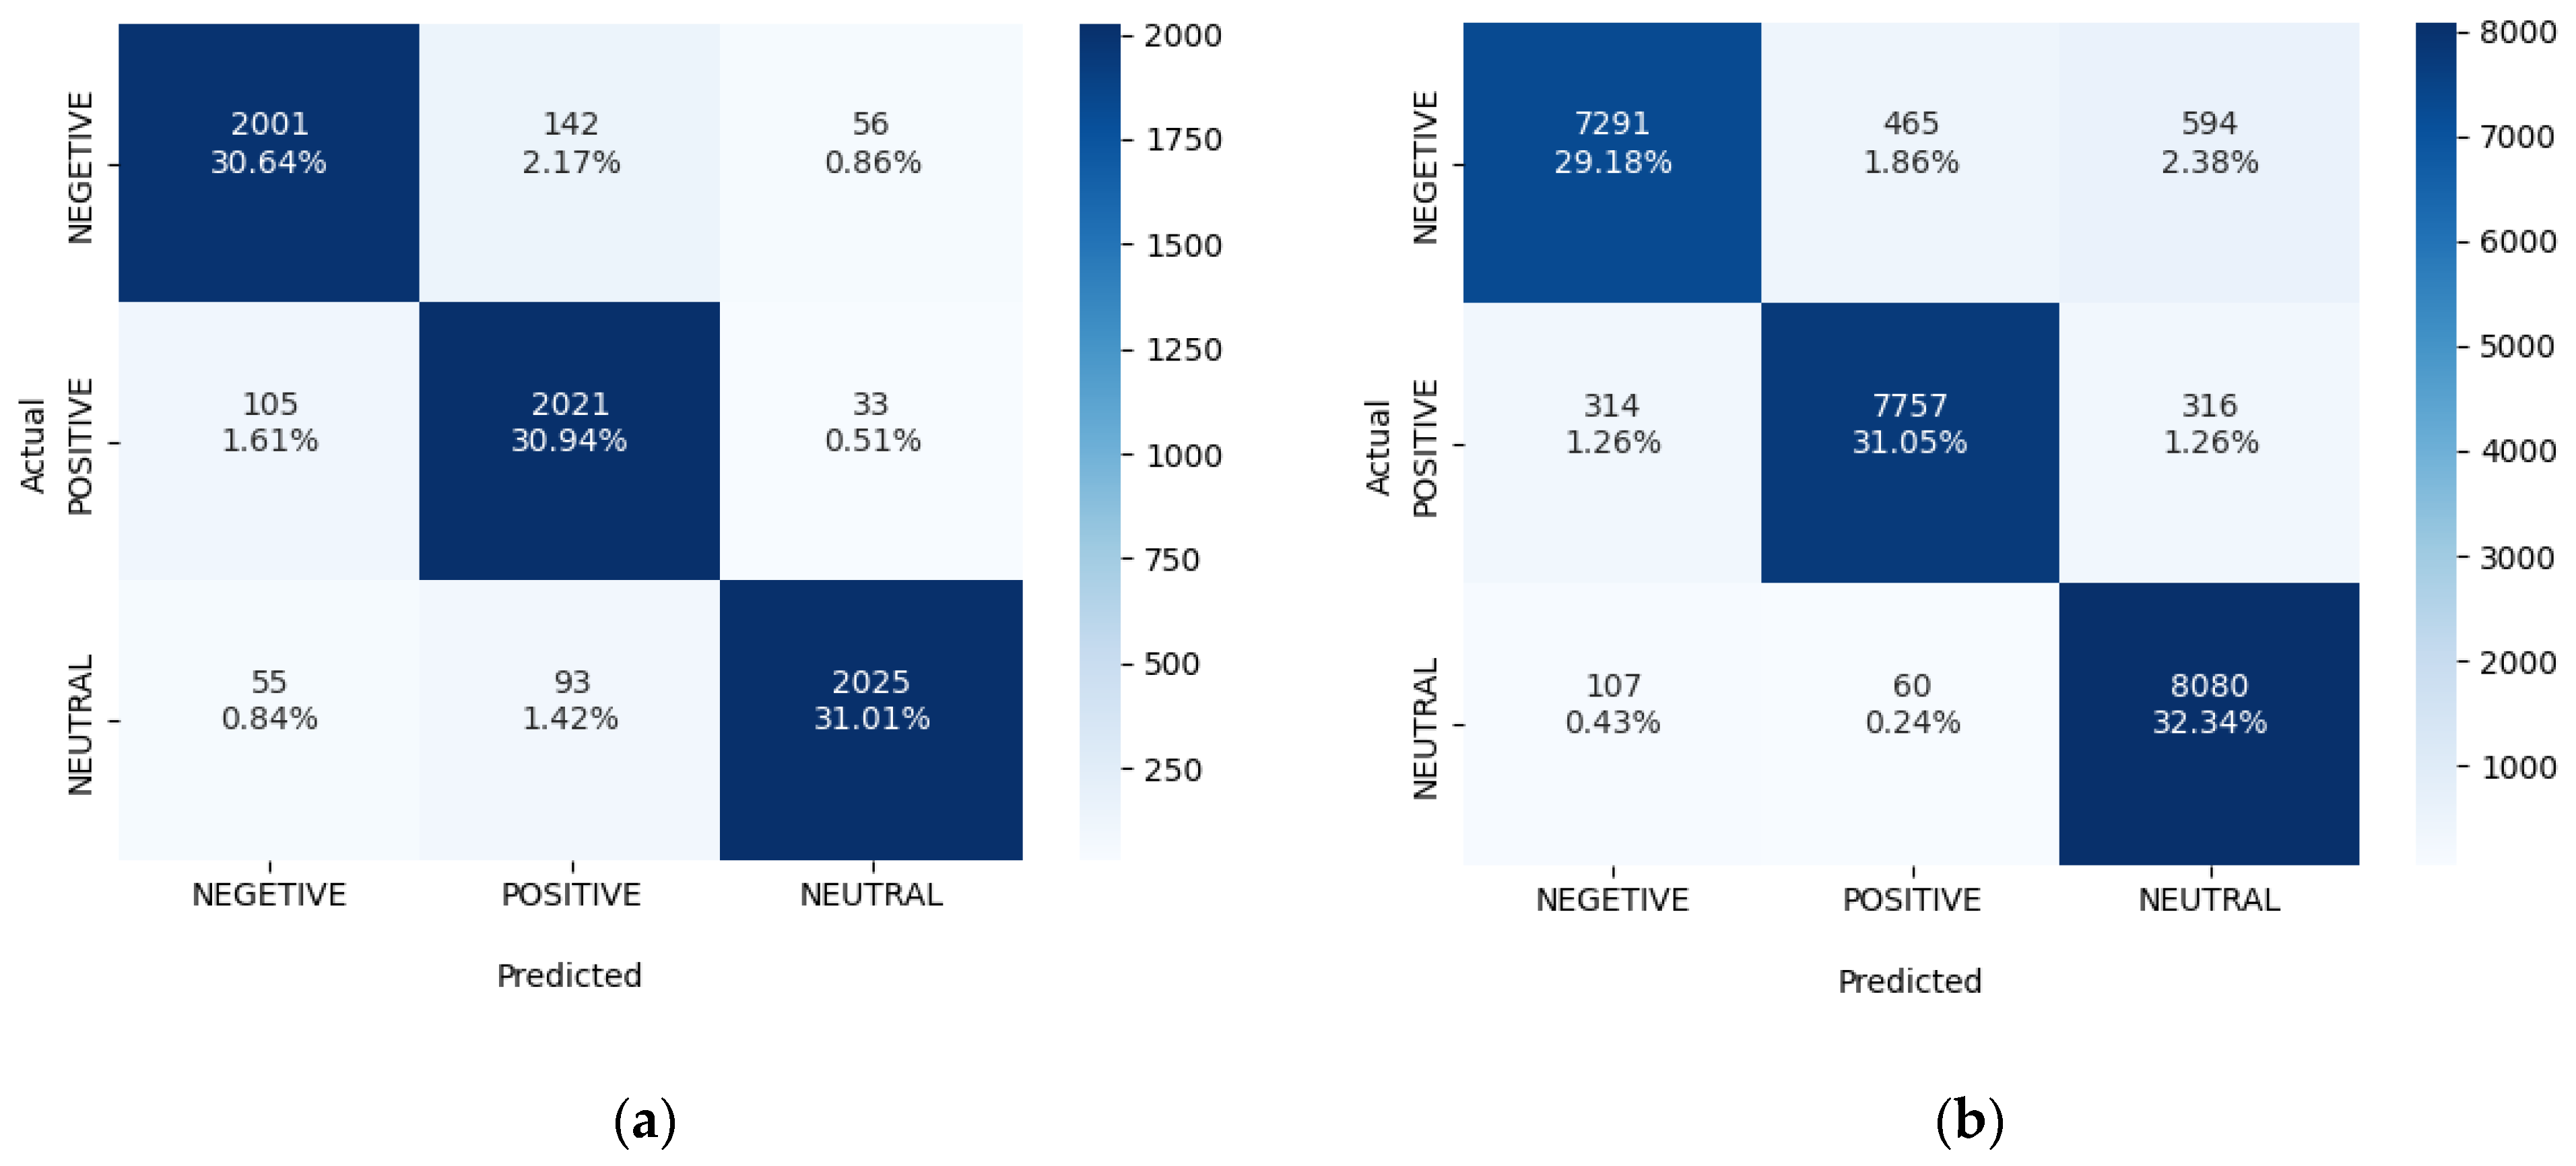
Figure 12 depicts the confusion matrix for predicted
v/
s actual sentiments for the GRU network into three categories: positive, negative and neutral.
Figure 13 depicts the confusion matrix for the Bi-LSTM network.
Table 11 and
Table 12 show the comparative analysis of the proposed methodology (lexicon-based and deep learning based) with similar other works.
The results in the
Table 10 and
Table 11 clearly indicate the superior performance of the proposed method over the existing techniques. The proposed deep learning models are more accurate in analysing the tweets for their polarity, in terms of positive, negative and neutral. Furthermore, the proposed study considers both the COVID-19 Tweets and the vaccination tweets for analysis.
6. Conclusions
This paper has presented the lexicon and deep learning-based approaches for sentiment analysis of tweets. The proposed work aimed to understand people’s feelings about the COVID-19 pandemic and vaccines based on the messages posted on Twitter in English, and finally to discover their concerns relative to this topic. The sentiment analysis was performed with (i) lexicon-based techniques using the tools: VADER and NRCLex, and (ii) deep learning methods such as Bi-LSTM and GRU.
The tweets were classified into positive, negative, and neutral categories. Further sentiment scores and different emotional effects of vaccination tweets were calculated. Based on the results, it can be concluded that most of the vaccination dataset’s tweets were positive polarity. With the Bi-LSTM approach, the classification accuracy achieved was 92.7%, and with GRU, the accuracy was 91.24% for COVID-19 tweets.
For vaccination tweets, the accuracy obtained was 92.48% with Bi-LSTM and 93.03% with GRU model. It can be concluded that the application of these sentiment analysis techniques can prove to be powerful tool to extract, identify and analyse people’s perceptions about disease and vaccination during the pandemic period. The results of this analysis can be helpful to health sectors and government organisations to understand the public’s concerns about the disease and take necessary actions. Further, the work can be extended to analyse the sentiments of people from different countries and their sentiments related to the new booster vaccine. In future, this study aims to include neurosymbolic AI techniques for better interpretation of sentiment analysis results.


 ,
, 


