Article

Optimization of Municipal Waste Streams in Achieving Urban Circularity in the City of Curitiba, Brazil

by
Aarthi Aishwarya Devendran
1,
Brijesh Mainali
1,*,
Dilip Khatiwada
2,
Farzin Golzar
2,
Krushna Mahapatra
1 and
Camila H. Toigo
3
1
Department of Built Environment and Energy Technology, Linnaeus University, 35195 Växjö, Sweden
2
Energy Systems, KTH Royal Institute of Technology, 11428 Stockholm, Sweden
3
Economics Department, Business School, Pontifícia Universidade Católica do Rio Grande do Sul, Porto Alegre 90619-900, Brazil
*
Author to whom correspondence should be addressed.
Sustainability 2023, 15(4), 3252; https://0-doi-org.brum.beds.ac.uk/10.3390/su15043252
Submission received: 16 December 2022 / Revised: 6 February 2023 / Accepted: 7 February 2023 / Published: 10 February 2023
(This article belongs to the Topic Solid Waste Management)

Abstract

:
The municipal solid waste (MSW) remains a great challenge in most cities of developing countries, as the majority of the generated waste is either not collected or is dumped in open uncontrolled non-engineered landfill sites, creating significant pollution due to the leakage of landfill leachate in the surrounding environment. In developing countries, a complete transition to a zero-landfill scenario is less likely to happen in the near future due to various socio-economic challenges. Therefore, the existing landfills in developing countries need holistic waste management thinking with more efforts on waste to energy conversions. This study highlights the challenges with existing MSW management practices of Curitiba, Brazil, and suggests some holistic and sustainable landfill management techniques. This is accomplished through the (i) identification of the suitable sites for setting up transfer stations (TSs), (ii) route optimization for MSW transportation, and (iii) analysis of the life expectancy of the existing landfill with waste valorization techniques for enhancing circularity of MSW of the city. The study has identified six potential TSs, making use of various geological criteria and constraints as suggested by the United States Environmental Protection Agency using GIS-based spatial analysis, which could save fuel cost of approximately 1.5 million Brazilian Real (BRL) per year for the solid waste transportation (from the source to the landfill site). This research has also made a value addition in this specific field with the preparation of a digitized road network map of the study region. Further, the sensitivity-based scenario analysis highlights that the lifespan of the existing landfill (until 2030) might be extended to 2058 if the city achieves the targeted recycling rate of 85% compared with the current rate of 23%. The results would be useful for policy-makers to adopt the crucial MSW scenario to achieve a circular economy in the waste management of the city of Curitiba.

1. Introduction

Across the globe, approximately 2 billion tonnes of municipal solid waste (MSW) are generated annually, with at least 33% of it not managed in an environmentally friendly manner. Recycling and reuse of solid waste (SW) are becoming necessary worldwide to prevent the depletion and degradation of our natural resources [1]. In 2016, the world’s cities generated SW amounting to a per capita generation of 0.74 kg/person/day [2]. Global waste is expected to grow to 3.4 billion tonnes by 2050, more than double the population growth over the same period. In many developed countries, landfills are sophisticatedly designed and systematically managed under strict government regulations [3]. European landfill directive urges its member states to gradually phase out landfilling all biodegradable waste, imposing higher landfill taxes and discouraging the development of new landfills [4]. Waste sorting at source and waste valorisation (i.e., management of waste through recycling, reuse, and waste-to-energy (WtE)) have been practiced, reducing the waste generation significantly and minimizing the MSW inflow towards landfills [5]. However, such systems are limited mostly to affluent countries. MSW management in developing countries, including Brazil, is characterized by limited-service access for core urban population (excluding low-income population living in peri-urban areas), lack of institutional infrastructure, inappropriate technologies, and deficient management capabilities [6,7]. Insufficient municipal budget, inadequate service fee, and lack of awareness about the waste management among the citizens have been identified as some key barriers in MSW management [8]. Landfill is still the most common and likely the least expensive method of managing MSW in various developing countries [9]. Typically, one- to two-thirds of the SW generated is either not collected or is dumped in non-engineered landfill sites. These open uncontrolled non-engineered MSW landfills create significant pollution in the surrounding environment due to the leakage of landfill leachate, especially surface and groundwater bodies [10]. Therefore, the MSW management challenge for the developing countries with emerging economies, including Brazil, is to discourage the dumping of MSW in non-engineered landfill sites and to operate the existing engineered landfill sites in a more sustainable way. In this pretext, the current study makes a value addition within the existing body of scientific knowledge in landfills of SW with (i) the identification of the suitable sites for setting up transfer stations (TSs), (ii) optimizing the route for MSW transportation, and (iii) analysing the lifespan expectancy of the existing landfill with waste valorisation techniques enhancing circularity in the city of Curitiba, Brazil.

1.1. Existing Situation of Management of MSW in Curitiba

Curitiba has an integrated MSW plan, developed in accordance with Federal Law number 11,445/2007, which establishes the National Sanitation Policy and Federal Law number 12,305/2010. To manage the MSW problem in developing countries, specialists point out that it is necessary and urgent to put into practice a less expensive, sustainable, and efficient way to manage the waste generated in urban spaces [11]. The National Solid Waste Policy (NSWP) does not encourage incineration in Brazil, and, thus, all the waste generated in Curitiba is disposed of in landfills or recycled [12]. The treatment and final destination of SW in Curitiba is carried out by Intermunicipal Consortium, established in 2001. Curitiba performs special collection services, which include household toxic waste, plant waste, civil construction waste, useless furniture, and animal corpses [13]. It is important to highlight that, contrary to many developed countries, in Brazil, the existence of controlled sanitary landfills is allowed. Sanitary landfill is one of the methods of solid waste disposal and is often considered better than an open dump. However, engineering knowledge and planning are required to operate a satisfactory sanitary landfill [14]. Experts point out that the technologies needed to replace the landfill with more sustainable process are already available, but the costs and the lack of integration in waste management are still serious obstacles [15].
According to the Paraná state government, a new project, named the Lixo 5.0 program, aims to implement pilot projects in municipalities of Paraná for testing and evaluating new technologies for the treatment and management of SW. Curitiba is one of the municipalities that will be the target for a pilot project, and the city has planned to reduce the waste that is currently destined for landfills by up to 97% [16].

1.2. Importance of Transfer Stations in Achieving an Effective Management of MSW in Curitiba City

TSs play an important role in achieving an effective management of waste in a community by serving as a link between the community’s SW collection centres and the final waste disposal facility. A TS is a facility with a designated receiving area where waste collection vehicles discharge their loads. The waste is often compacted, then loaded into larger vehicles for long-haul delivery to a final disposal site (either landfill, WtE plant, or a composting facility). The waste is quickly consolidated and loaded into a larger vehicle and moved off site, usually in a matter of hours; thus, long-term storage of waste does not occur at the TS [17]. Bovea et al. (2007) [18] described TS as an integral part of present day MSW management systems. TSs proved to minimize the transport costs, as it is less expensive to transport great amounts of waste over long distances in large loads compared with small ones. Jia et al. (2002) [19] highlighted that transfer stations are an important facility in the urban waste transfer process, especially in cities of developing countries, including China, where the population density is high. They act as a link between the MSW at the collection points and the final disposal facilities (landfill or processing plant) [20]. Kellerman (1991) [21] discussed that if the distance to the disposal site is higher, then the use of small collection trucks may prove to be expensive, and TS might be a cost-effective solution in such conditions. Yadav et al. (2016) [22] proposed a facility location model to choose the best locations and numbers of TSs in an economically optimal manner in Nashik city, India. The proposed model for location of the TSs helped to improve the efficiency of waste collection and decreased the costs and pollution level of the city. In Bilaspur city, India, setting up of TSs proved economically viable and reduced the solid waste collection cost by approximately 30% [23].
One of the major problems faced by the city of Curitiba for the efficient MSW management is the inefficient use of SW vehicles and collection staff time. International Finance Corporation (2015) [24] identified potential developmental plans to improve the present MSW management practice in the city. The plan aimed to introduce TSs to receive the waste to lower the haulage costs involved in transporting the MSW in the city. These stations, which would be located closer to the point of origin of the waste, would then be used to bulk and haul the waste to the treatment or disposal sites. The plan highlighted the significance of TS infrastructure in Curitiba to allow bulk transport of MSW, thereby reducing the costs and impacts of wastes to the landfill.

1.3. Implementation of GIS-Based Route Optimization Technique for Efficient Transportation of MSW

The quantity and the category of MSW change over time depending upon the level of technological development and anthropogenic activities of a city. Geographical Information System (GIS) works as a high-performance spatial decision support tool and is widely implemented in MSW management studies related to landfill site selection, route optimization, and so on. The potential advantage of using GIS in MSW management studies lies in the fact that, apart from providing timely and cost-effective solutions, GIS-based tools provide a digital database of a city’s MSW system for long-term monitoring and analysis [25]. The selection of optimal landfill sites with reduced environmental impacts for SW disposal is one of the most important factors to reach the circularity concept [26]. Transportation of SW is the most influential and the costliest component and requires the biggest fraction of the budget allocated by the local authorities for the MSW of a city [27]. An optimal route for transportation of MSW is essential for an integrated SW management system to effectively reduce the cost for waste collection and transportation [28]. GIS-based spatial modeling tools for collection and transportation of SW through optimization can provide economic and environmental gains by reducing travel time, distance, fuel consumption, and pollutant emissions [29].
A GIS-based MCE tool for landfill site selection was proposed by Alkaradaghi et al. (2019) [30] in Sulaimaniyah, Iraq. The study region had no landfill site meeting the scientific and environmental criteria, and the GIS-based model identified seven appropriate sites for landfills satisfying the requirements. The study further suggested techniques to facilitate shifting the present dumpsite to an alternative location. In the Srem region of North Serbia, the traditional method of site selection for landfills was replaced by implementing the GIS-based Analytical Hierarchy Process (AHP) technique [31]. Five sites close to two large urban agglomerations were suggested as potential locations for a regional landfill site within the study region. These studies show the major contribution of geo-spatial tools in the effective management of MSW of cities, such as selection of suitable sites for TS and landfill, identifying the most cost-effective and shortest route for the collection and transportation of SW through optimization techniques.
In this context, the objectives of the current study are to identify the suitable sites for setting up TS using geological and socio-economic criteria/constraints in Curitiba, Brazil. The study further aims to identify cost-effective optimum route to transport MSW in the city. The study also analyses the lifespan of the existing landfill with MSW management techniques, with the inclusion of TS based on various MSW policies of the cities and identifying the most appropriate SW management technique that might increase the lifespan of the existing landfill site through scenario-based sensitivity analysis.
The current manuscript is structured into five sections. Section 1 details the research background, the state of the art, and the research objectives of the current study. The geographical locational details of the study region of the study are provided in Section 2. Section 3 highlights the methodological framework implemented to achieve the research objectives of the current study, while the corresponding results are described in detail in Section 4. The conclusions drawn from the current study, and the scope for future research activities are discussed in Section 5.

2. Study Area

Curitiba is the capital and largest city in the Brazilian state of Paraná. The city’s population was 1,948,626 as of 2020, making it the eighth most populous city in Brazil. The city is geographically located between the coordinates 25°25′46″ S and 49°16′16″ W, extending over an area of 716.30 sq.km and is situated 917 m above mean sea level. The terrain is flat or gently undulated. According to the climatic classification of Köeppen-Geiger, this region exhibits Cfb characteristics (subtropical and mesothermal). Its average annual temperature and rainfall are 17.4 °C and 1486.5 mm/year, respectively [32].

3. Data and Methods

In the present study, to identify the potential sites for TSs, five criteria are used as input variables, as recommended by US EPA (2002) [17], and are shown in Figure 1. These criteria include (i) drainage network, (ii) road network, (iii) residential areas, (iv) amenities (educational institutions, hospitals, places of worship, recreational centres, public utility centres, government offices, and banks), available from Open Street Map (https://www.openstreetmap.org/#map=4/62.99/17.64, accessed on 10 September 2021), and (v) slope, derived from SRTM (Shuttle Radar Topography Mission) of 1 Arc-second Global data, available from U.S. Geological Survey (USGS) (EarthExplorer, https://earthexplorer.usgs.gov/, accessed on 1 September 2021) In addition, based on IPPUC (2019) [33] and US EPA (2002) [17], constraints, as represented in the top right box in Figure 1, are also used in the study.

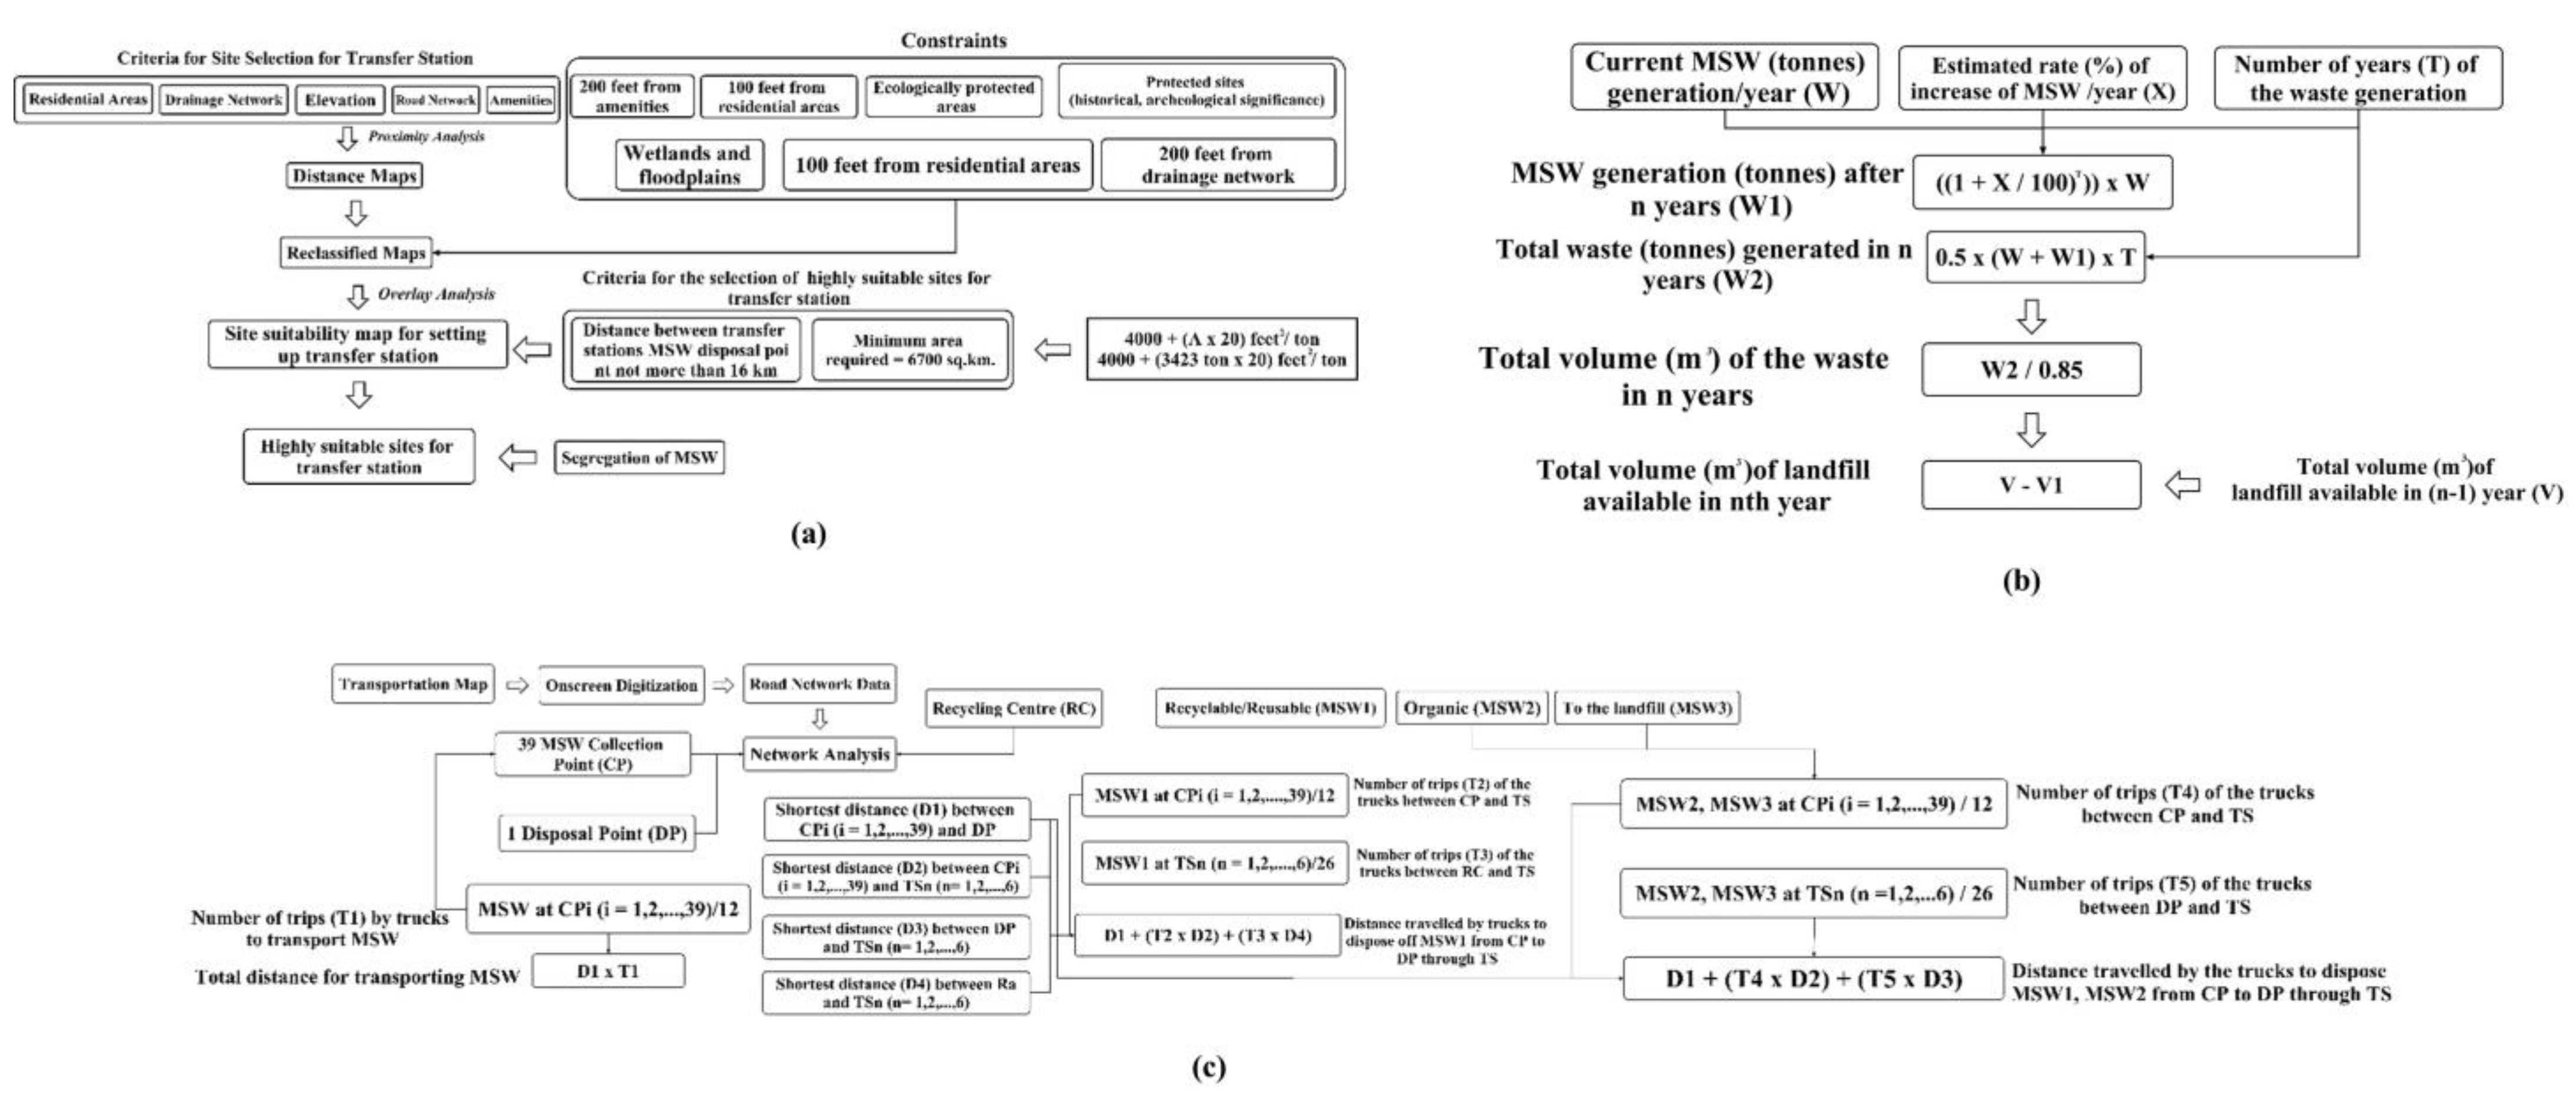
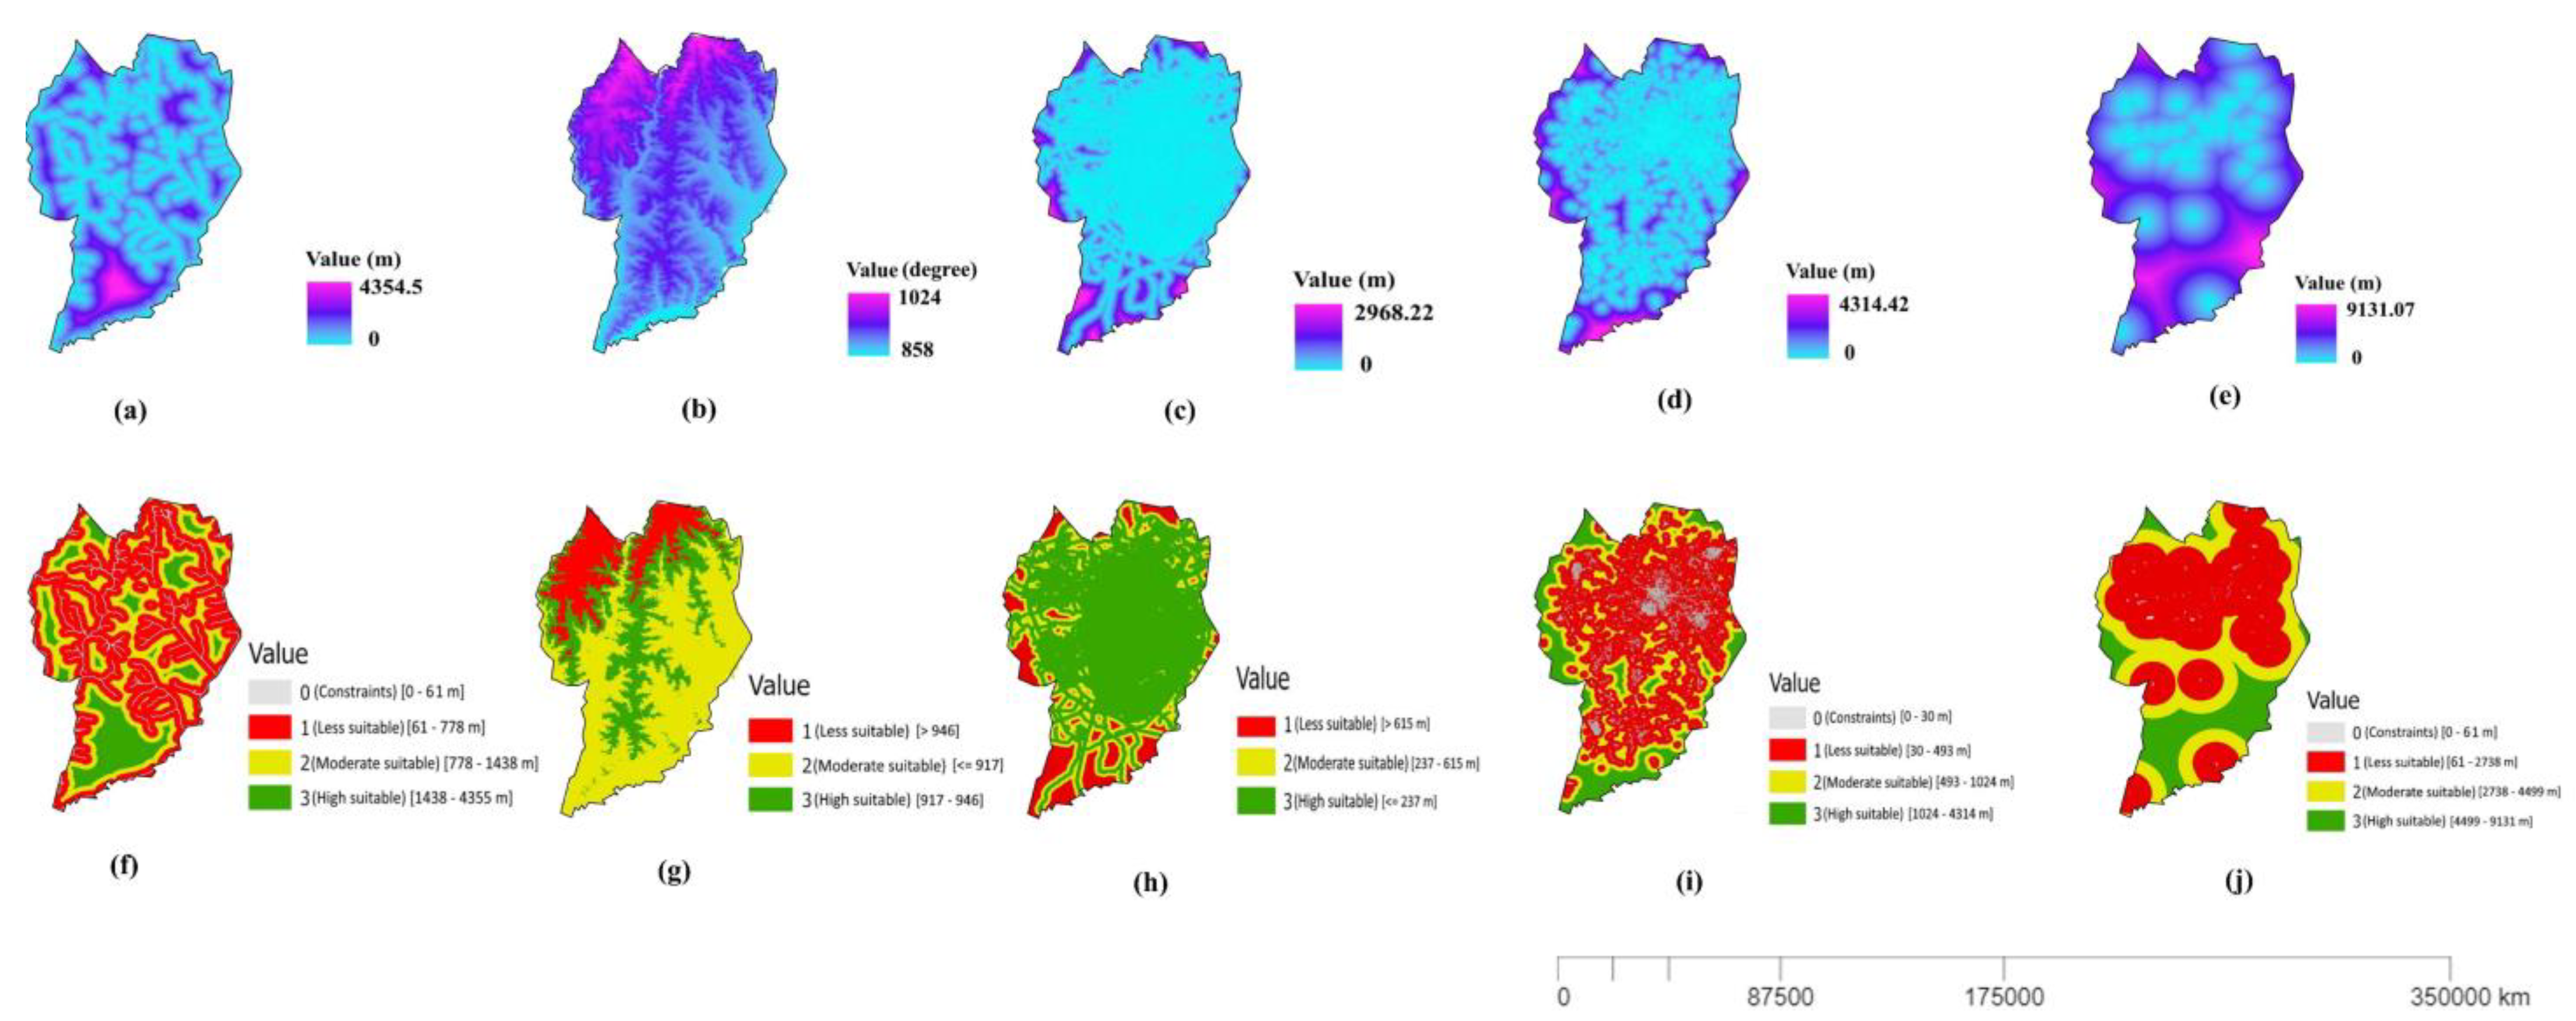
3.1. GIS-Based Spatial Analysis for Transfer Station Site Selection

The five input variables ((i)–(v) described in Section 3) are used in the preparation of distance maps through proximity analysis in an ArcGIS environment [34]. The distance maps are further reclassified into three categories (less, moderately, and highly suitable) for the selection of suitable sites for TS. From the distance maps of each of the five variables, the mean (µ) and standard deviation (σ) values are used for the reclassification [35]. Thus, areas with values (µ+ σ) are considered moderately suitable sites for TS, whereas areas with values lesser and greater than (µ+ σ) are considered less and highly suitable sites for TS, respectively. These reclassified maps of the input variables with three categories are further used in the preparation of suitability map through overlay analysis.

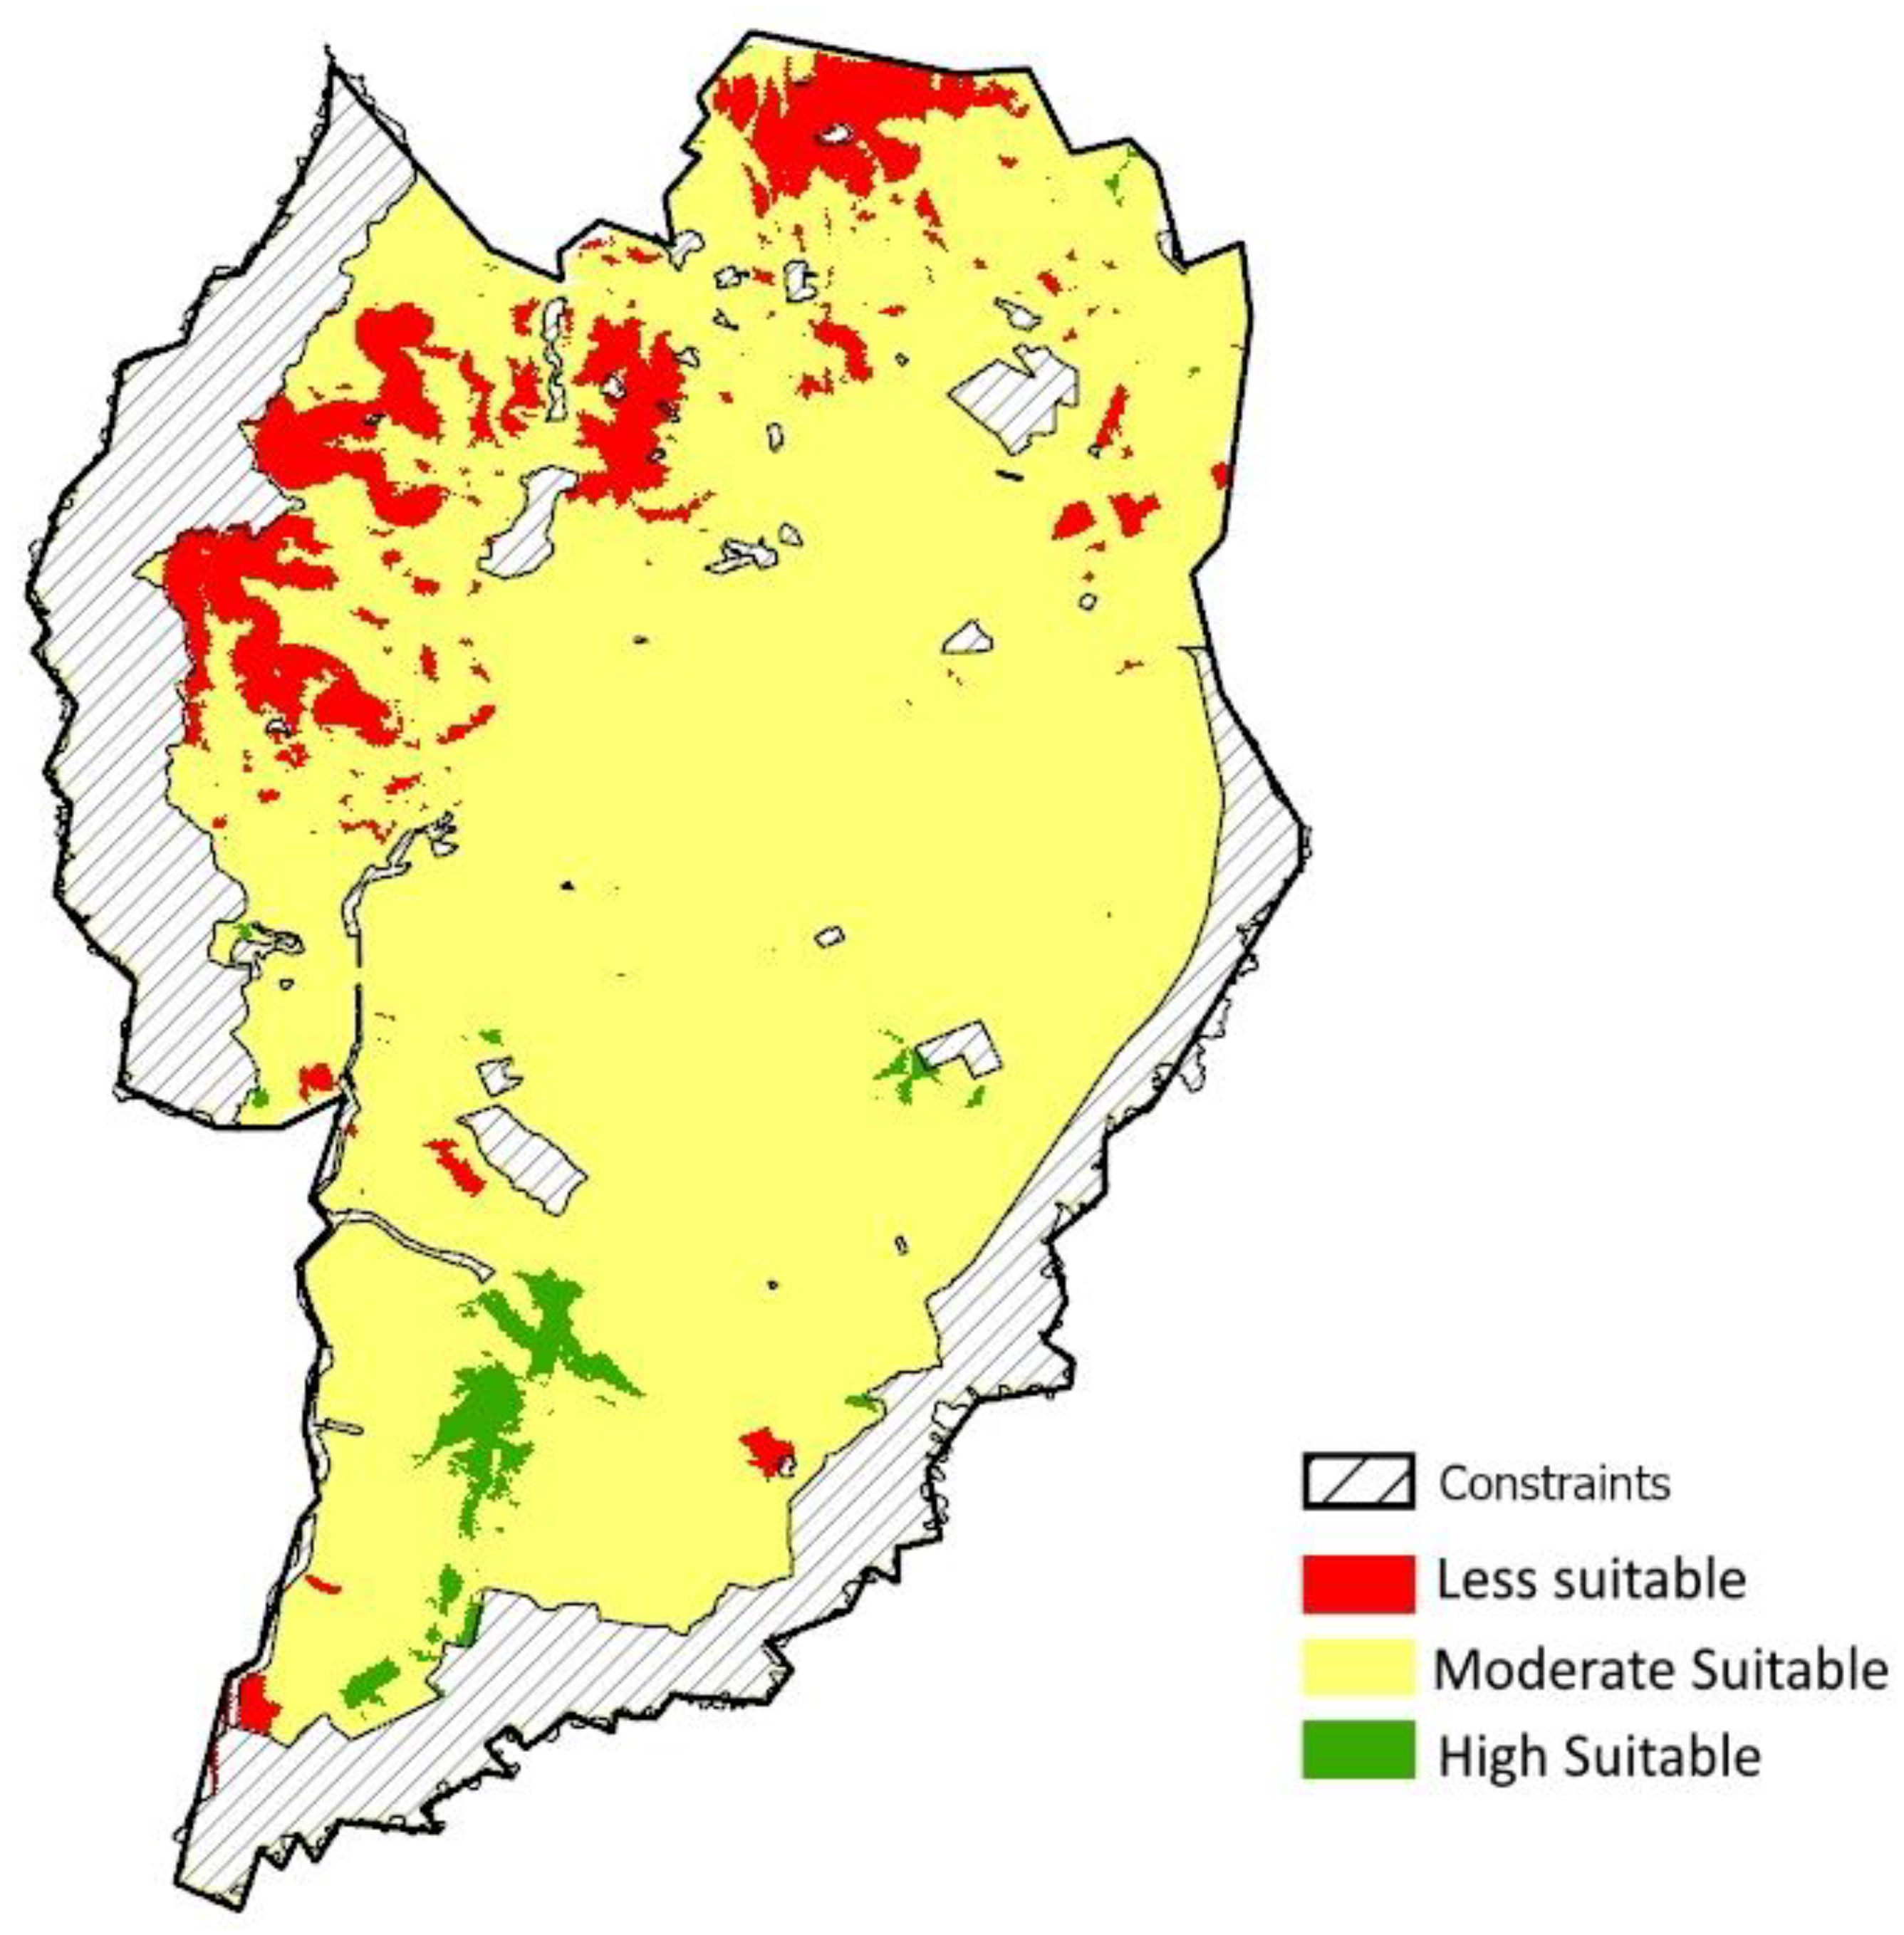
3.2. Preparation of Transfer Station Site Suitability Map

The reclassified maps of the input variables, including residential areas, drainage network, elevation, road network, and amenities, are used in the preparation of suitability map through overlay analysis [36,37] in an ArcGIS environment. The suitability indices are obtained through overlay analysis by making use of the reclassified maps of the input variables, as represented in Equation (1).
S I = i = 1 N ( w i × x i )
where, S I is the suitability index ranging from 1 to 3 (1—less suitable, 2—moderately suitable, and 3—highly suitable);
N: total number of pixels in the study region (depends upon the spatial resolution of the satellite image used; in the current study, Landsat data with 15 m spatial resolution are used);
w: weights assigned to each of the input variable (here, w = 0.2 since equal weightage is assigned to all the input variables);
x: reclassified values of the input variables.

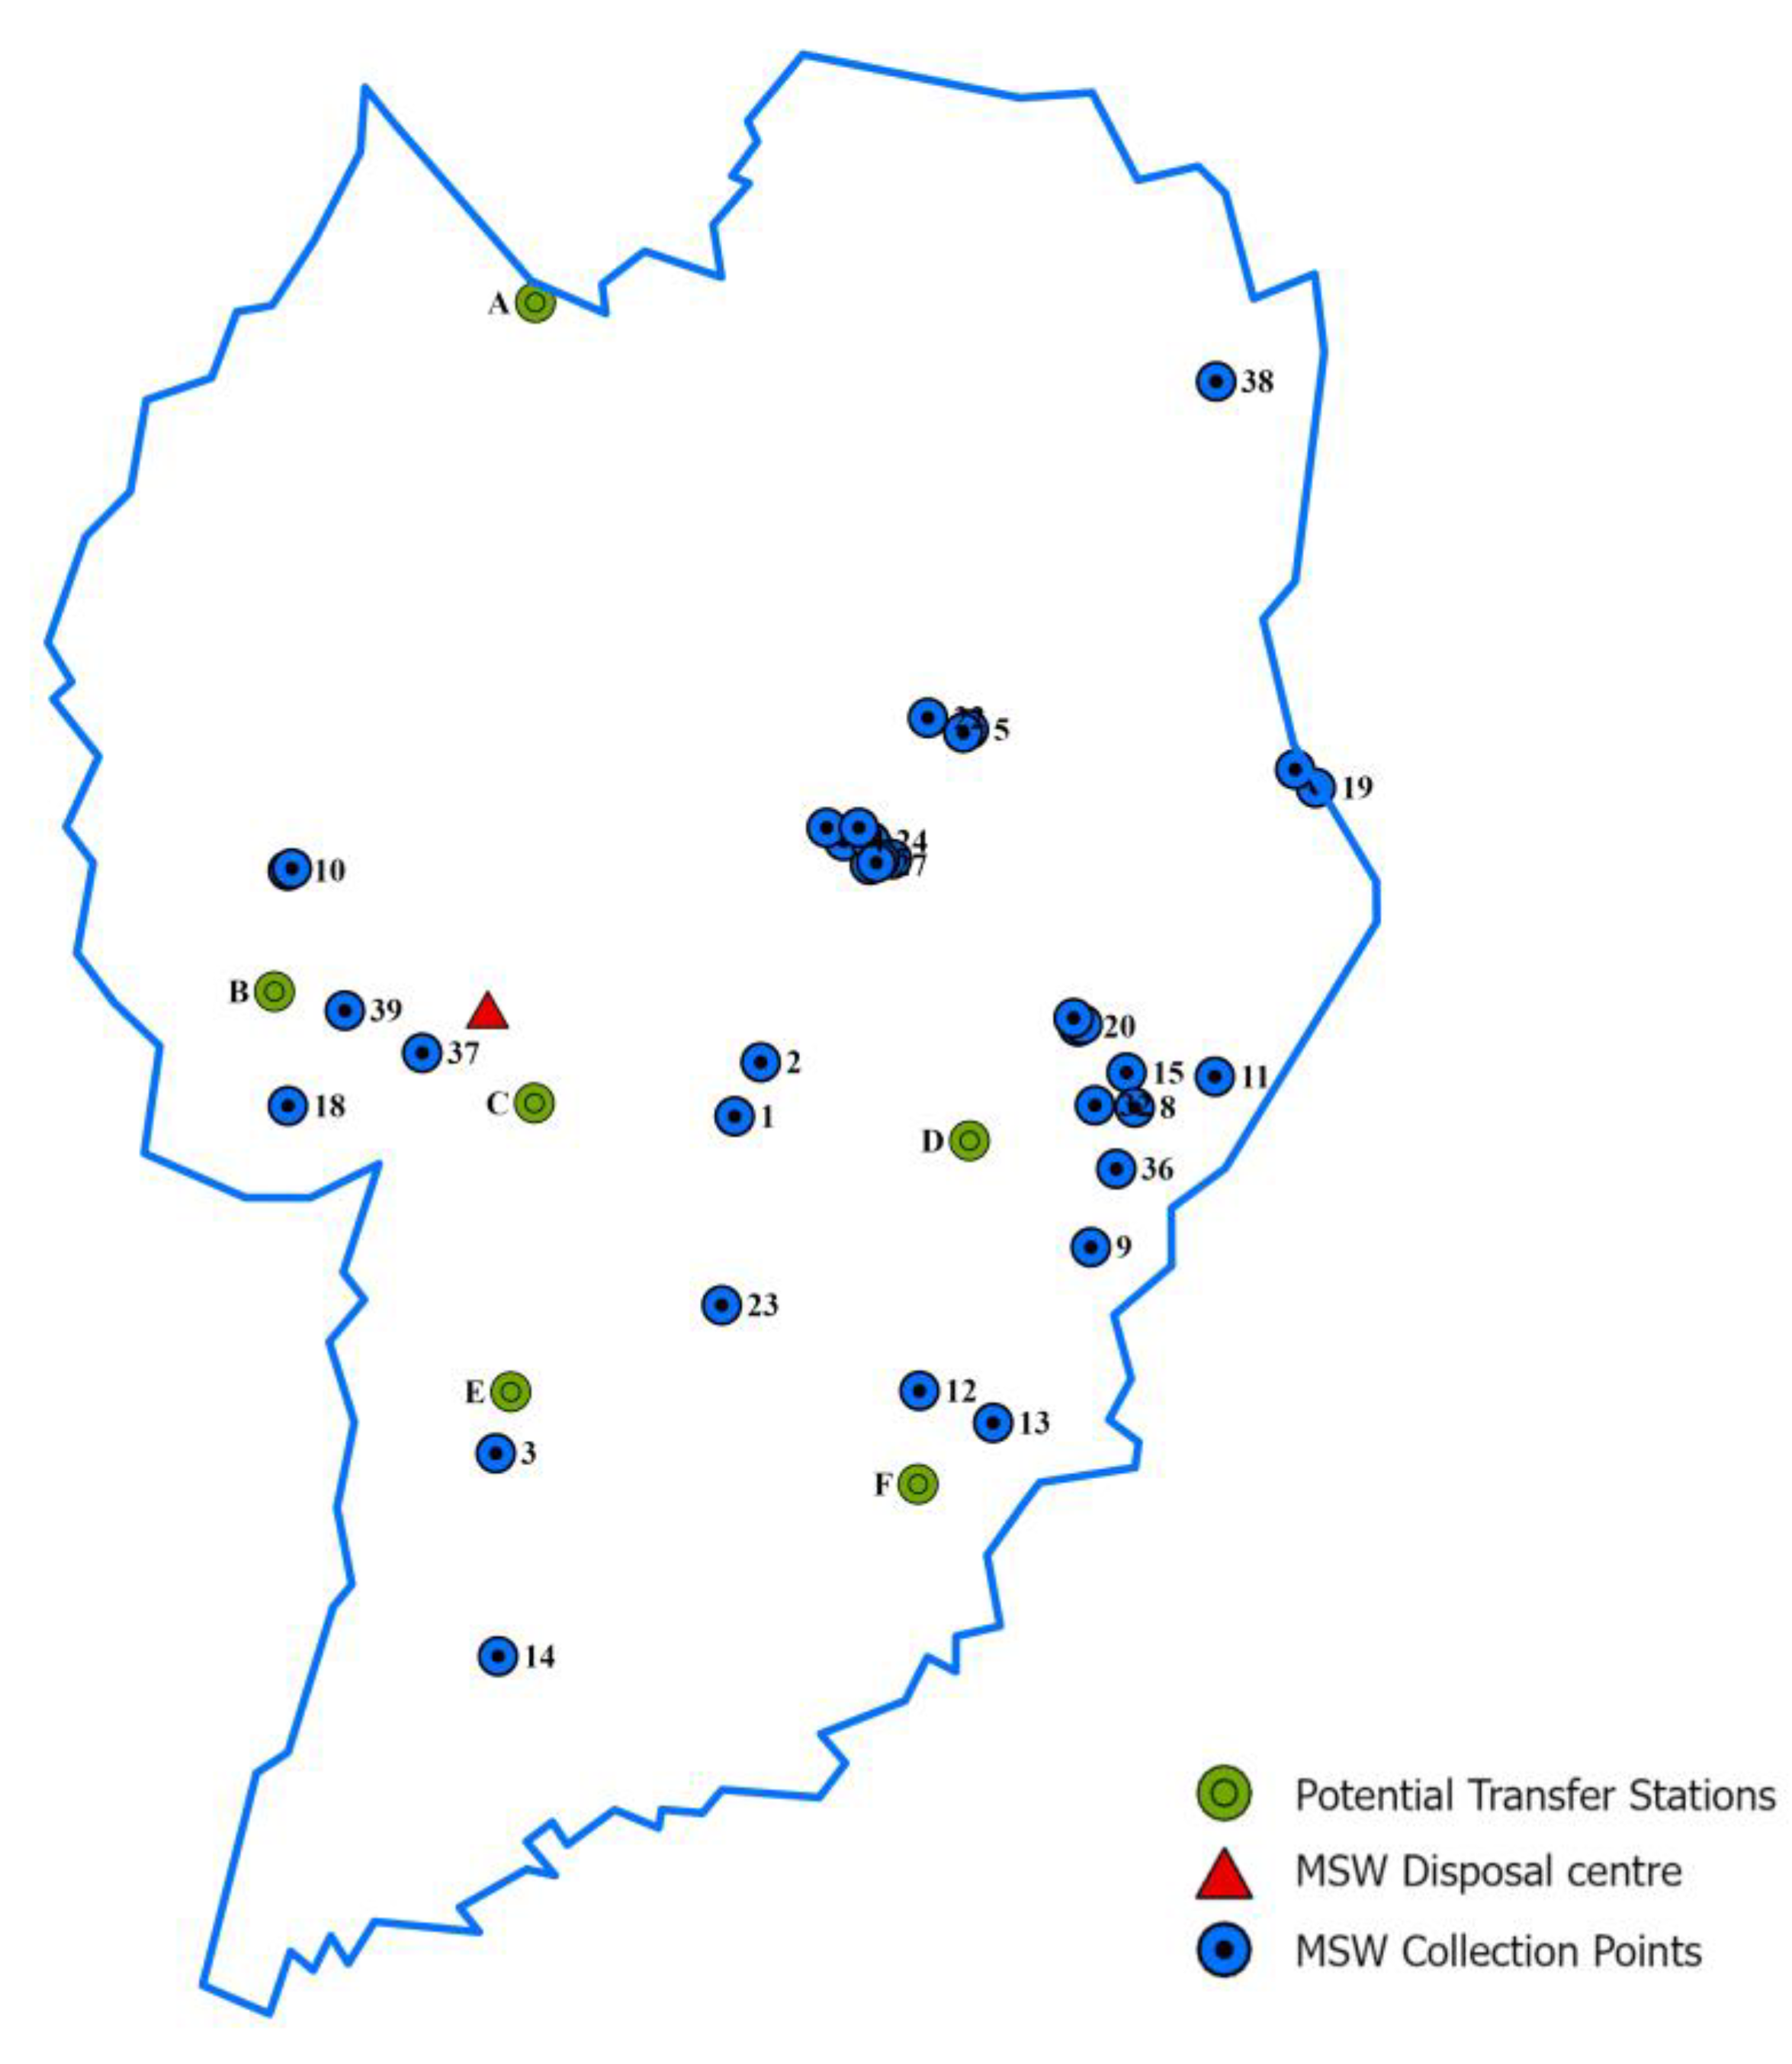
3.3. Identification of Potential Sites for Transfer Station

The suitability map prepared through overlay analysis, as described in Section 3.2, identified 26 sites suitable for setting up TSs in the study region. As per US EPA (2002) [17], (a) the TS should be located at a distance not more than 16 km from the disposal point (DP). This is because the logistics cost involved in transporting MSW from the source to destination points is higher, especially in the cities of developing countries [38]. In addition, the selected TS should be able to hold a day’s worth of MSW in case of an emergency situation, and, thus, a minimum Tipping Floor Space (TFS) is calculated, which shows the minimum area that is required to set up a TS.
T F S = 4000 + A × 20 s q . f e e t / t o n
where 4000 is the minimum area (sq. feet) required for TS;
A: MSW (tonnes) generated in a day (here, A = 3423 tonne, as of 2020)
Based on Equation (2), (b) a minimum area of 72,453.2 sq. feet (~6731.12 sq. m) is required to set up a TS for the efficient management of MSW in the city of Curitiba. Thus, out of the 26 suitable sites, 6 sites satisfying the above two criteria (a, b) are selected as highly suitable sites to set up the TS in the study region.

3.4. Optimization of Route Using GIS-Based Network Analysis for the Transportation of MSW with the Inclusion of Transfer Stations

3.4.1. MSW of Curitiba

A diverse range of waste streams from domestic, commercial, and industrial sources are being generated within the city of Curitiba. Several waste collection schemes and programmes are currently operating in Curitiba, including Lixo que não é lixo (waste that is not a waste), Estações de Sustentabilidade (sustainability stations), Câmbio Verde (green exchange), and Ecocidadão (eco-citizen) to collect the SW generated in the city.
The city of Curitiba has 39 SW collection points (CPs) where the MSW are being collected and 1 DP where the collected waste from CP are received before being sent to the landfill site. A key challenge that the city currently faces is its dependency on a single landfill site for the disposal of its waste, which is 30 km from the city centre and has a lifespan of less than ten years (i.e., until 2030). In Curitiba, 6% of the municipal budget is earmarked for MSW collection and transportation [39]. The city faces inefficiencies in logistical arrangements for collection and transfer, high levels of contamination of recyclables, and low recycling rate (23%). This leads to increasing tonnages of waste being produced, requiring collection, transport, and treatment [40].
Curitiba generated 3423 tonnes of MSW in a day in 2020. On the basis of the map of the residential areas (described in Section 3), a total of 6443 residential buildings are identified in the study region. On the basis of the population density (4062 per sq. km) of the city and the area of the residential buildings, the amount of MSW generated from each of the built-up area is calculated. It is assumed that the residents would prefer to dispose the solid waste at a CP which lies at 75 m away from their residences [41]. Thus, the amount of MSW that each CP might receive in a day is calculated for the study region.

3.4.2. Optimization of Route through GIS-Enabled Network Analysis

The road network dataset of Curitiba is prepared through digitization in an ArcGIS environment [42]. The base map of the road network is used to digitize the road features of the city with SIRGAS 2000 (Sistema de Referencia Geocentrico para las Americas) Universal Transverse Mercator (UTM) 22S zone projection system. The spatial data of roads created, along with the 39 CPs and 1 DP (as discussed in Section 3.4.1), are used to find the optimized route to transport the SW through network analysis. A GIS-enabled network analysis tool is useful to find the shortest path between two points, the distance, and the cost [29,43]. In the current study, the network analysis is implemented to determine the optimal route to transport MSW in Curitiba, as described in Section 3.4.3.

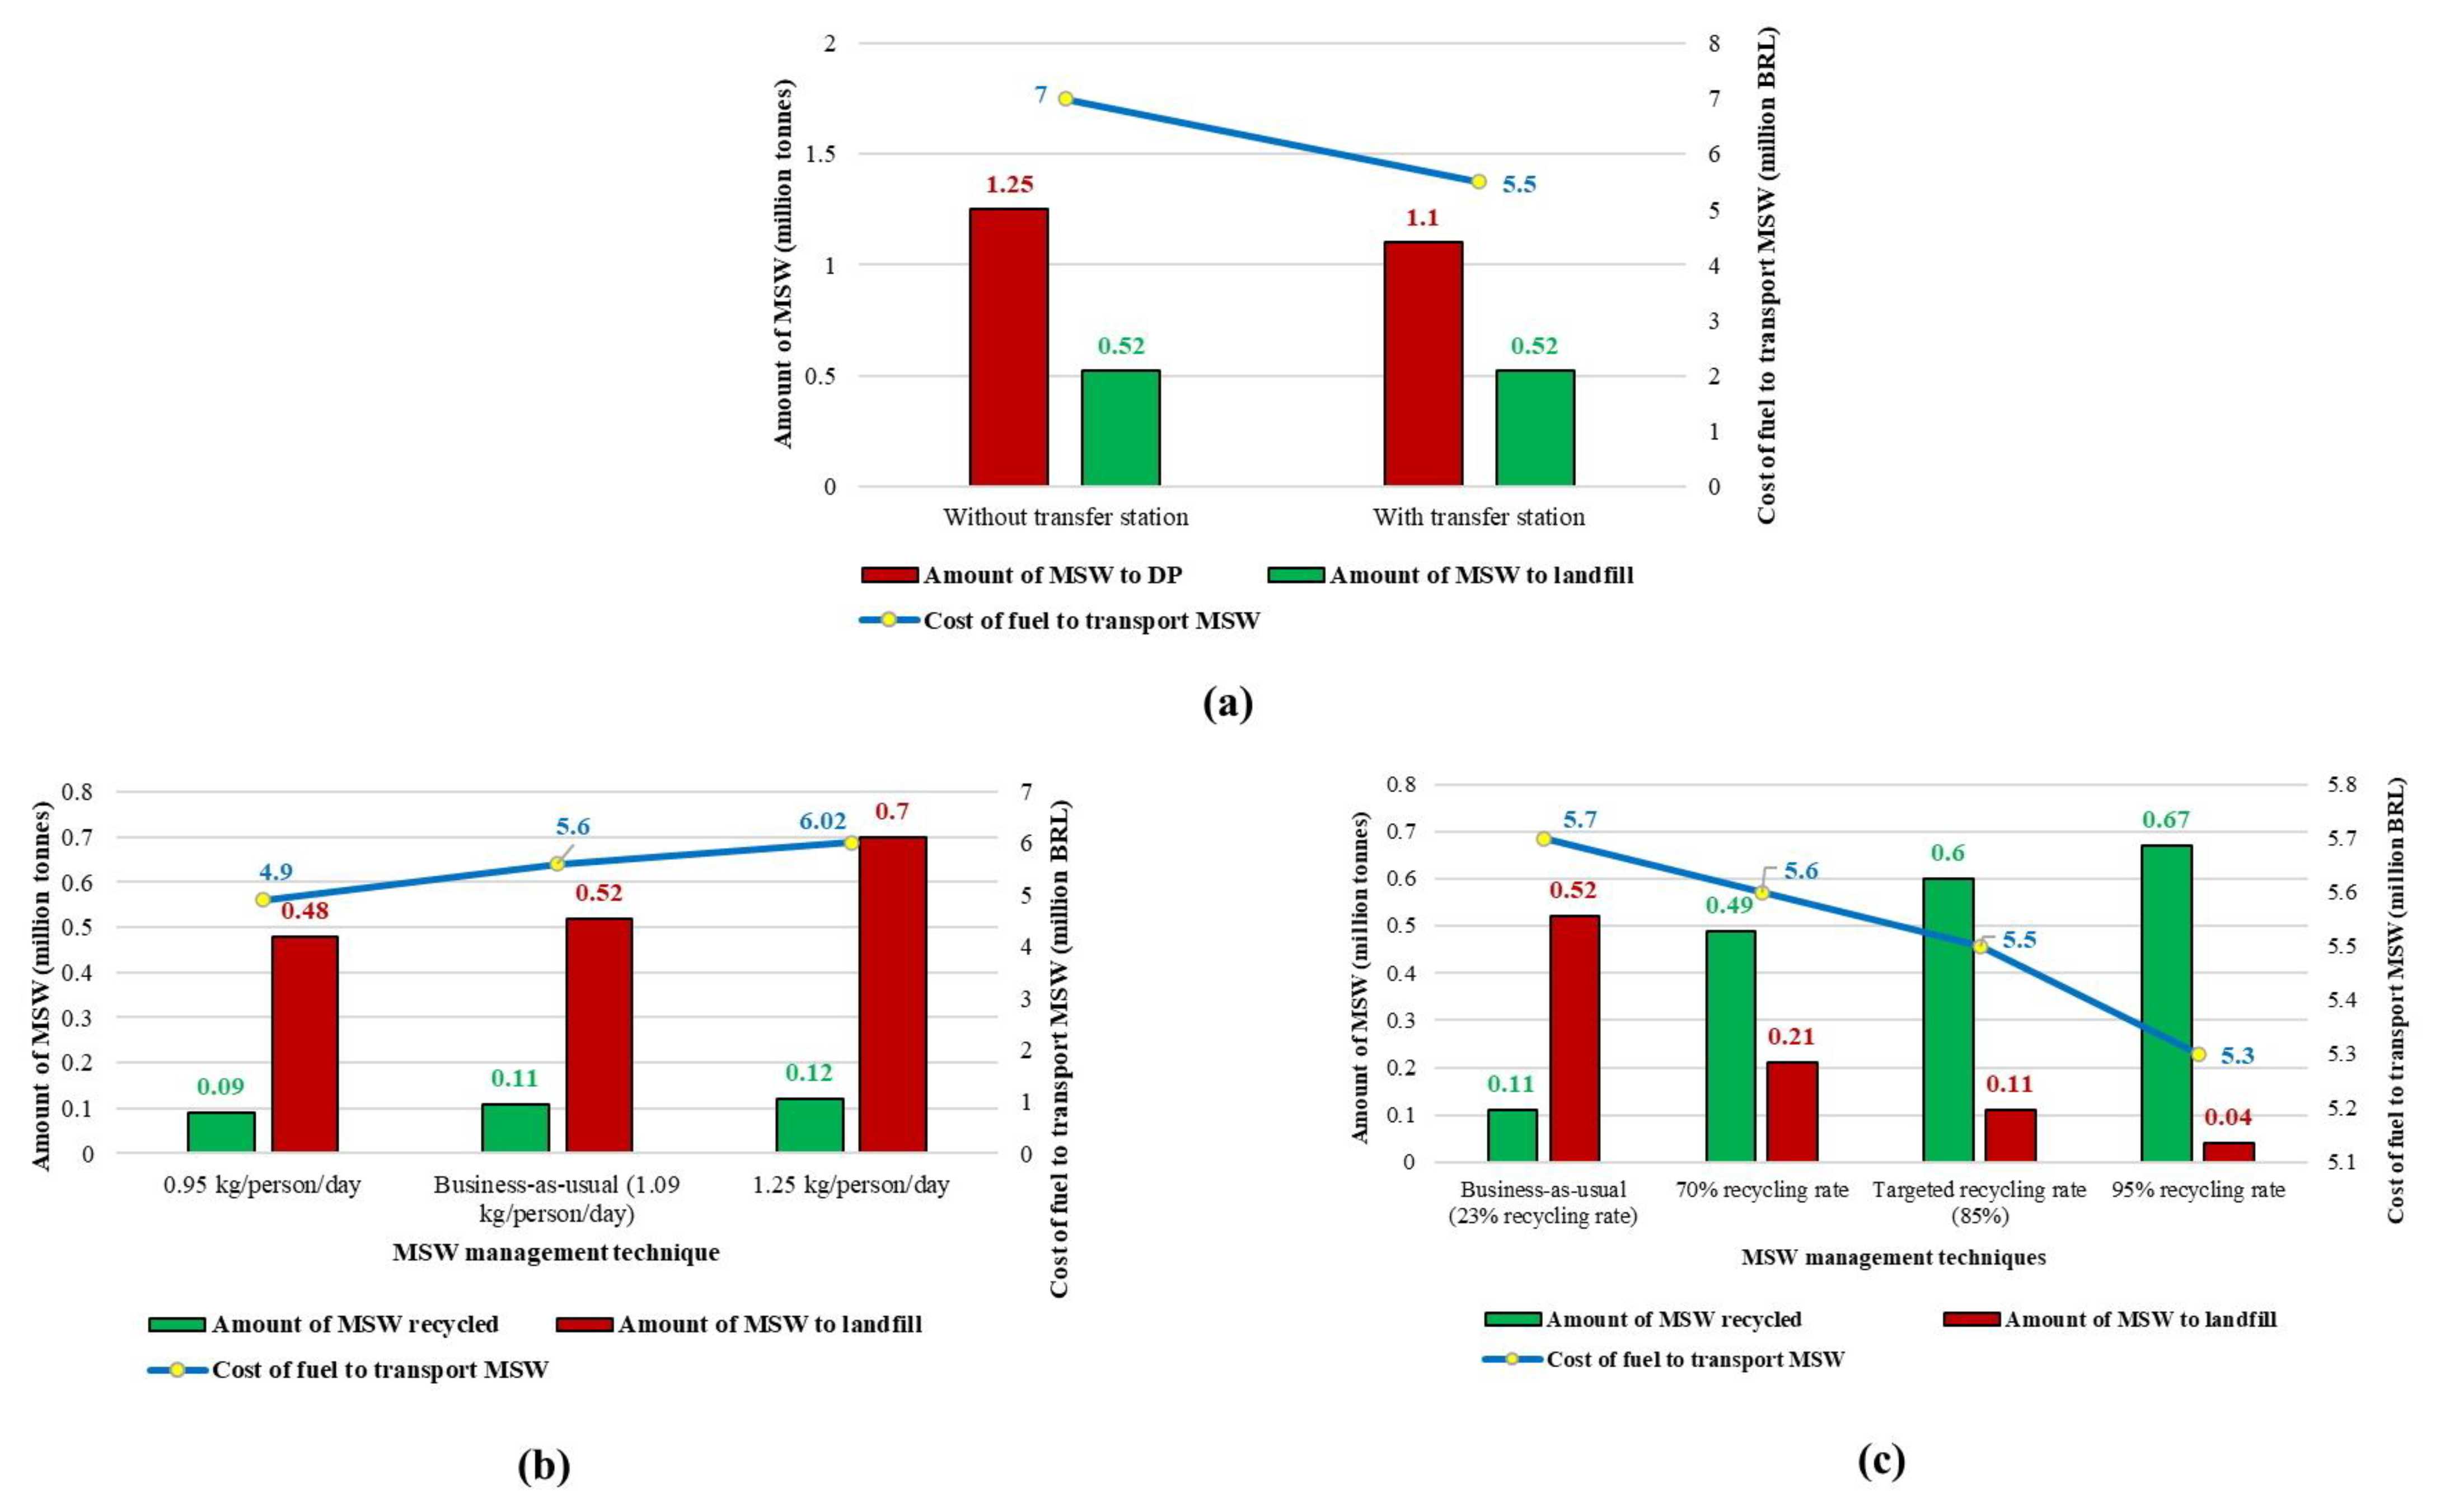
3.4.3. Reduction in the Distance and Fuel Cost to Transport MSW in Curitiba with the Inclusion of Transfer Stations

Currently, without TSs in the study region, the trucks start from the DP and carry the SW from the 39 CPs, and then from the DP, it is taken to the landfill site. Segregation of SW would facilitate the effective recycling of materials and reduce the overall cost of waste disposal [44]. In the study region, segregation of waste is not being carried out at the CP, and waste from various sectors, including residential, industrial, and commercial are intermixed and are, as such, carried to the DP [24]. Further, there is no optimized route for the trucks to effectively manage the transportation of MSW in the city. Thus, an average 53 trucks/day are deployed to transport the MSW in the city, and the trucks travel an approximate total distance of 70–100 km per collection shift.
The distance travelled (DN) to transport MSW from CP to the landfill site is represented as
D N = N = 1 39 ( d 1 N × n N ) + ( d 2 × n 2 )
where N is the total number of CP in the study region (here, N = 39);
d1 is the distance (km) between CP and DP;
d2 is the distance (km) between DP and the landfill;
n2 is the total number of trips required by the truck to transport MSW from DP to landfill site;
n is the total number of trips required by the truck to transport MSW from CP to DP, calculated as per Equation (4).
n = Q u a n t i t y   o f   M S W   i n   C P M S W   c a r r y i n g   c a p a c i t y   o f   t h e   t r u c k
In our study, the waste carrying capacity of the truck is assumed to be 12 tonnes [24]. With the inclusion of TS, the distance travelled (DNt) to transport the SW from CP to landfill through TS in the city of Curitiba is given by Equation (5)
D N t = N = 1 39 ( 2 d 1 + t = 1 6 d t × n t + ( d 2 ) )
where dt is the distance (km) between CP and TS.
When TSs are implemented in the city, as discussed in Section 3.1, Section 3.2 and Section 3.3 the SW gets segregated at the TS, and the MSW are categorized for recycling/reuse, WtE technology (biogas generation), and that to be landfilled. In this way, only the waste that has to be dumped at the landfill site would be carried back to the DP and further to the landfill site. This segregation of waste at the TS would reduce the number of trips required by the trucks, as the recyclable/reusable waste along with organic waste are sent to the respective processing plants.
Further, the fuel efficiency of the majority of the waste-carrying trucks in the city is approximately 2.55 km/litre [45]. The cost of fuel (CF) required to transport the SW from the CP to the landfill site without TS is given in Equation (6).
C F = D N 2.55 × F u
where Fu is the unit fuel price, which was 6.71 Brazilian Real (BRL) per litre in the study region.
With the inclusion of TS, the fuel cost (CFTS) for the trucks carrying waste from CP to the landfill site through the potential TS is shown in Equation (7).
C F T S = D N t 2.55 × F u

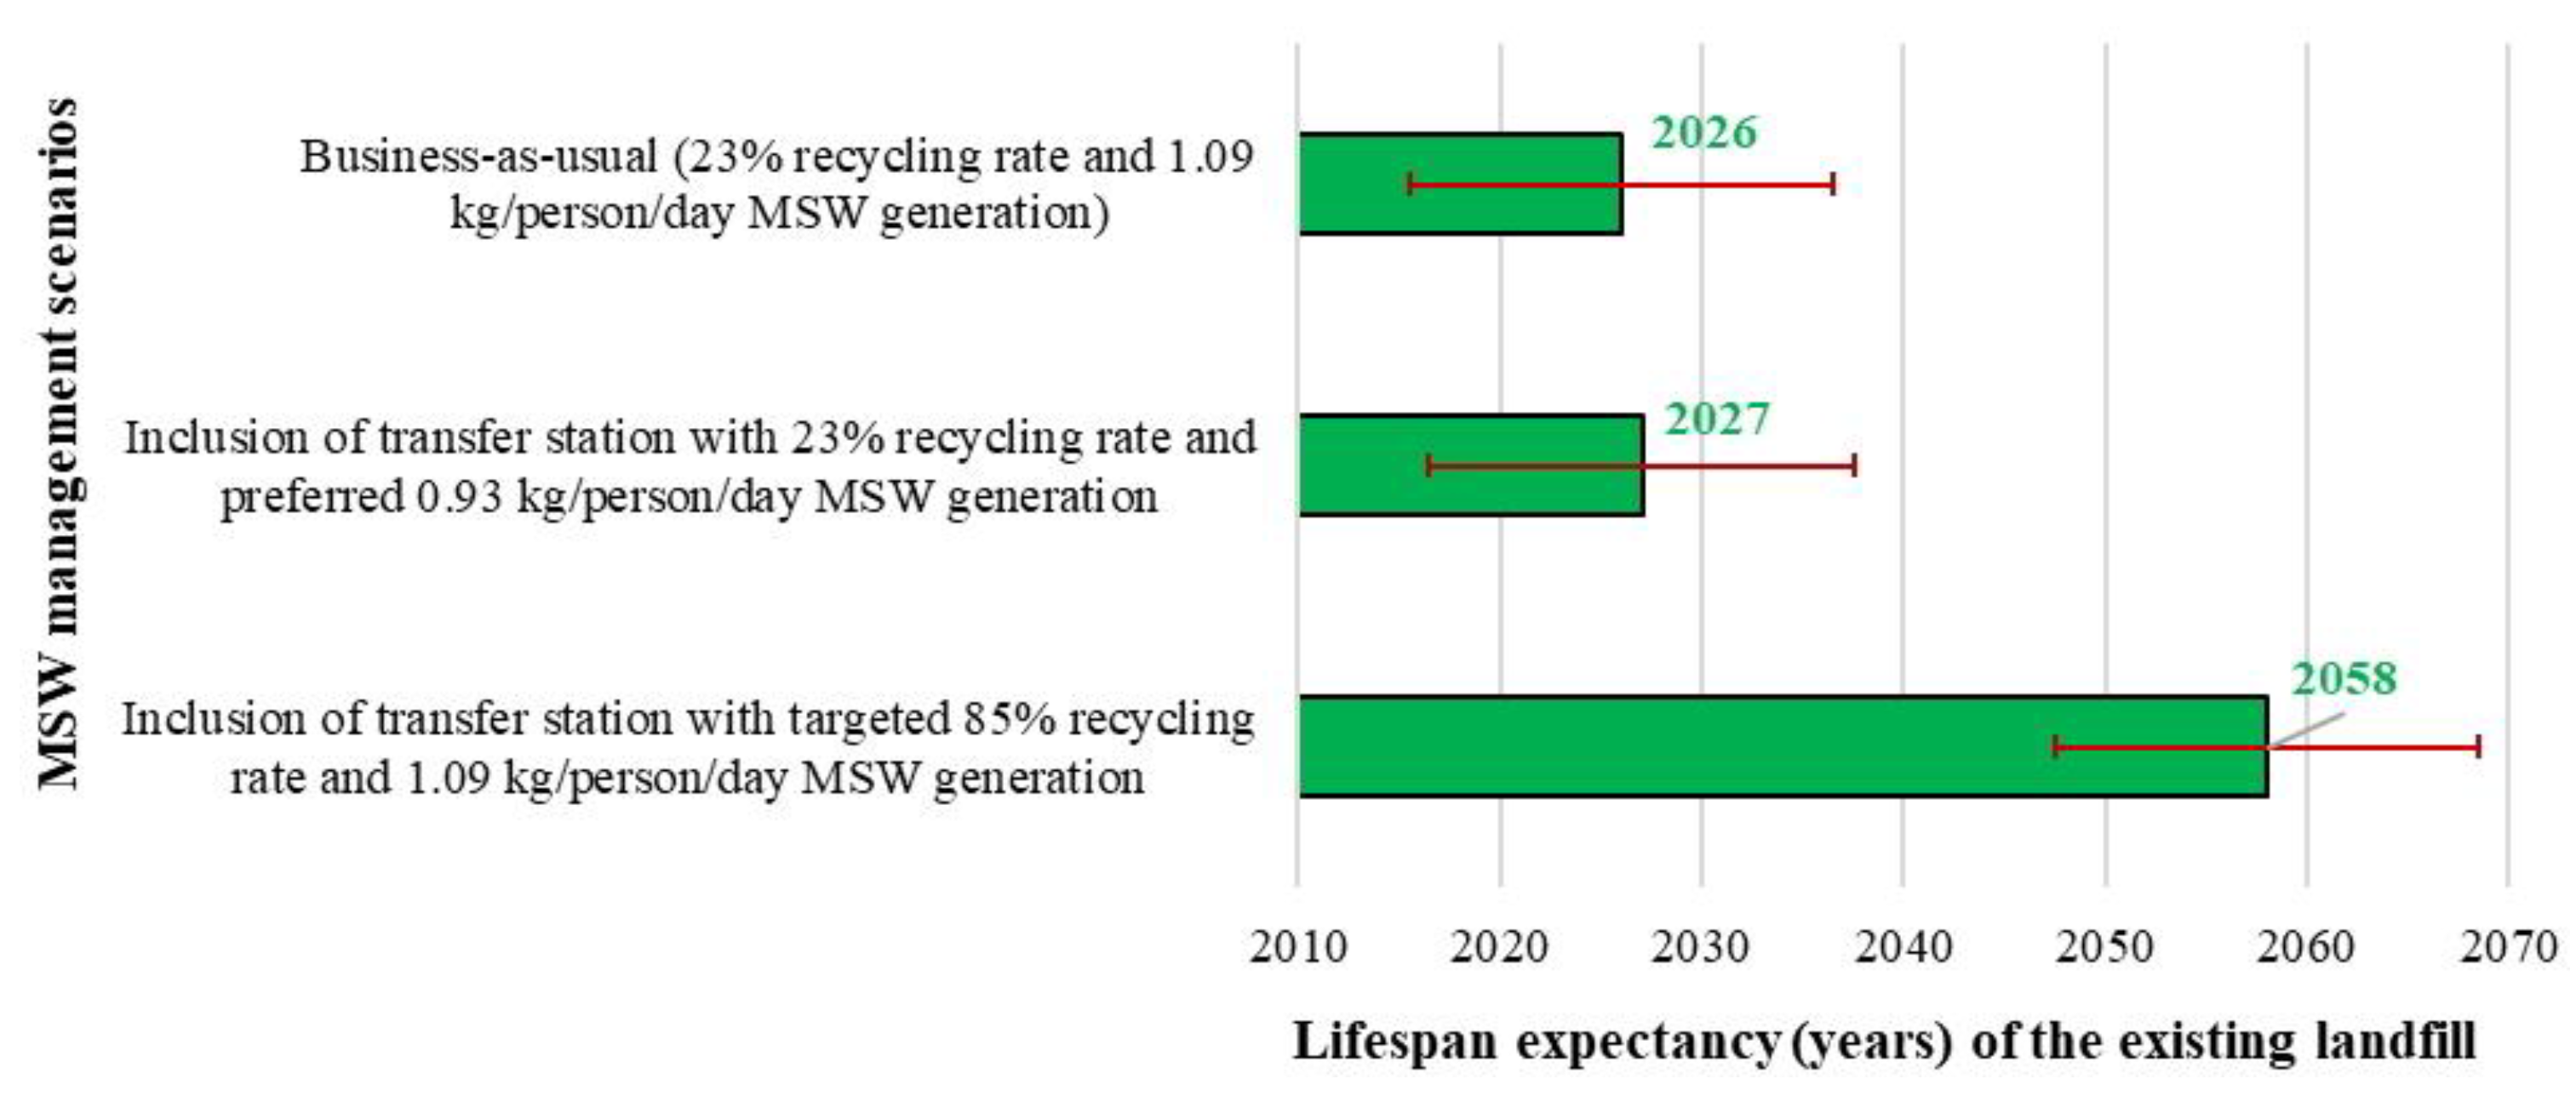
3.5. Estimation of Lifespan of the Landfill

The final disposal of the MSW from the city of Curitiba is managed largely by Conresol (Consórcio Intermunicipal para Gestão de Resíduos Sólidos Urbanos). Currently, waste from the city and most of the other municipalities in the area is disposed of at Estre Landfill, operational from 2010, with a lifetime of at least 20 years. As per International Finance Corporation (2015) [24], the landfill is at only 30% of its capacity (802,500 cubic meter) for the remaining years of the estimated lifespan. The landfill, with an area of 267,500 sq. m., is located at the South, 30 km from the centre of Curitiba, in Fazenda Rio Grande municipality. The landfill features a biogas and leachate collection system, and approximately 2500 tonnes of organic SW are being treated per day, which generates 4.6 mega watts of electricity [46].
For the effective management of MSW, Curitiba aims to reach 100% collection of MSW of the city, recycling 85% of that, while the remaining 15% is to be sent to the landfill [24]. This way, the lifespan of the existing landfill could be extended, thereby reaching the zero-landfill scenario to attain circularity in terms of MSW management in the city. The lifespan expectancy of the landfill is estimated, as represented in Equations (8)–(11), [47].
The total waste, W1 (tonnes), generation after n years is given by
W 1 = 1 + x 100 n × W
where x is the estimated rate of increase of population growth in the study region (here, x = 3%);
n is the year in which the landfill is completely filled;
W is the total amount of MSW (tonnes) dumped in landfill per year (here W = 519,395 tonnes/year as on 2020);
Total volume of landfill available in nth year (V) is given by Equation (9):
V = ( v v t )
where v is the existing available volume of the landfill (here, v = 802,500 cubic m).
vt is the total volume (cubic m) of the solid waste in n years (on an assumption of 0.85 tonnes/cubic m density of waste), calculated as:
v t = T 0.85
where T is the total waste generated (tonnes) in n years:
T = 1 2 W + W 1 + x 100 n × n

3.6. Sensitivity Analysis Based on Various MSW Scenarios

Currently, one-third of the SW ends up in open dumps, posing environmental threats in Curitiba. Moreover, the city relies upon a single landfill whose operational lifespan is until 2030. Hence, there is a strong need for an efficient integrated MSW management system in the study region [48]. The major composition of the SW generated in the city is organic, accounting for 38%. However, because of the non-availability of waste segregation, the organic waste degrades the quality of other recyclable/reusable SW found in the garbage. Further, the recycling/reuse rate of MSW is very low (23%) when compared with other developing countries [49]. The city thrives to achieve an 85% recycling rate, thereby sending 15% of the total MSW generated to the landfill [24]. However, the per capita waste generation of 1.09 kg/person/day in the city is within the international norms and is lower than that of members of the Organisation for Economic Co-operation and Development (OECD) [50].
In the current study, two scenarios based on MSW management policy techniques are considered to analyse their effects on the fuel efficiency of the trucks and on the lifespan of the existing landfill through sensitivity analysis.

3.6.1. Scenario 1: Influence of Per Capita MSW on the Fuel Efficiency of Trucks and on the Existing Landfill’s Lifespan

In this scenario-based sensitivity analysis, the fuel efficiency of trucks to transport MSW and the lifespan expectancy of current business as usual scenario (1.09 kg/person/day and 23% recycling rate) are analysed along with an increase (1.25 kg/person/day) and decrease (0.95 kg/person/day) of per capita MSW generation with the existing recycling rate of 23%. The result of this sensitivity analysis might provide foresight to the policy-makers on the landfill expectancy of the existing landfill and on the optimized route for transporting the generated MSW.

3.6.2. Scenario 2: Influence of Change in the Recycling Rate of MSW on the Fuel Efficiency of Trucks and on the Lifespan of the Existing Landfill

Under this scenario, the influence of change in recycling rate of MSW—for instance, if the city manages to fulfil the targeted 85% recycling rate with the current 1.09 kg/person/day MSW generation and when the recycling rate reaches almost an idealistic situation of 95%—on the life cycle of the landfill and the fuel efficiency of the trucks to carry MSW in the city are analysed with the business-as-usual condition (23% recycling rate and 1.09 kg/person/day MSW). This scenario-based analysis will be more interesting for the SW decision-makers, as they would be able to foresee the implications of their SW policy set in the year 2015, whose aim was to increase the recycling rate in the city.

4. Results and Discussions

The main findings of the current study are described in Section 4. Herein, Section 4.1 shows the site suitability analysis carried out to identify potential sites for setting up TS in the study region. The results of network analysis technique to identify the optimized route to transport SW from CP to landfill is described in Section 4.2. In the current study, sensitivity analysis is implemented on the basis of various MSW management scenarios and is shown in Section 4.3. Section 4.4 explains in detail the lifespan expectancy of the existing landfill in the study region under various MSW management scenarios. Section 5 highlights the policy framework to achieve circularity in the urban MSW.

4.1. Site Suitability Analysis for Setting Up Transfer Stations

The reclassified maps (Figure 2f–j) of the input variables, prepared from the proximity maps (Figure 2a–e), are used in the preparation of suitability map (Figure 3) for the implementation of TS in the study region. It can be seen that the suitable sites included regions in the southern part of the city. It is to be noted that the Estre landfill is located to the south of the city boundary, approximately 30 km from the city centre. The results of this study identified 26 potential sites for TSs in the southern region of Curitiba, making the transportation of MSW from the TS to the landfill site comparatively easier in terms of optimized distance and, therefore, improving fuel efficiency.
Out of the 26 potential sites identified through suitability analysis (as described in Section 3.2), 6 best sites for TSs are selected on the basis of the criteria discussed in Section 3.3 and are represented in Table 1. Figure 4 highlights the location of the potential sites for TSs along with the location of 39 CPs and 1 DP within the study region. When a TS is closer to a CP, it might be the most cost-effective case, as it would lower the collection costs of the waste, and the crews in the waste truck might need to spend less time traveling to and from the CP. This would reduce the costs for labour, fuel, and waste collection vehicle maintenance. Results of the analysis would be helpful to local authorities in identifying the potential sites for TSs for an efficient management of MSW in the city.

4.2. Optimal Distance Estimation with the Inclusion of Transfer Stations

In the study region, as discussed in Section 3.4.3, the MSW of the city are being collected at the 39 CPs (Figure 4) and taken to the DP. The waste collected in the DP are then transported to the landfill site. The amount of MSW collected in the 39 CPs in a day is given in Table 1 (also, see Section 3.4.1).
Without the TS, the total MSW generated in the city (3423 tonnes/day) is being transported to the DP and from there, it is taken to the landfill site. At the landfill site, the waste is segregated, and the organic waste (1500 tonnes) are used for biogas generation, while 1423 tonnes are landfilled in a day. Thus, approximately 2000 tonnes per day of MSW to be recycled/reused or to be sent for WtE processing centres are also unnecessarily taken to the landfill site. This would not only increase the number of trips made by the trucks to transport the MSW (since it would have a larger quantity of waste to be transported) but would also lead to increased traffic flow in the roads, thereby increasing the greenhouse gas (GHG) emissions in the city.
However, with the inclusion of TS in the city, the segregation of MSW takes place at the TS, and, thus, the recyclable/reusable waste are sent to the respective processing centres from the TS itself. Only the solid waste to be dumped is taken to the landfill site. Thus, at DP, only 1423 tonnes of MSW per day might be available to be transported to the landfill. This would reduce the total distance travelled by the trucks and increase the fuel efficiency of the trucks transporting the MSW in the study region, as the waste is segregated at TS itself and sent to the respective processing centres.
Based on Equations (3) and (4), the total distance travelled to transport MSW in the study region without TS is approximately 7223 km/day. However, with the inclusion of TS, the total distance might be reduced to 5696 km/day (Equation (5)) since the truck might have less MSW to transport to the landfill. Hence, the fuel cost required to transport the SW from DP to the landfill might be reduced up to BRL 5.5 million when TSs are implemented compared to that of BRL 7 million without TS (Figure 5a). The results of this analysis would aid in reducing the total distance and, therefore, the fuel cost of the trucks to transport MSW, thus helping to achieve the waste segregation at the identified TS in the study region.

4.3. Sensitivity Analysis

The results of the sensitivity analysis of two scenarios based on the MSW management policies of Curitiba (discussed in Section 3.6) are shown in Figure 5b,c. On the basis of Figure 5b, it can be determined that with the business-as-usual condition of 1.09 kg/person/day MSW generation and 23% recycling rate, the fuel cost for the trucks to transport MSW from the DP to landfill site is approximately BRL 5.6 million/year. However, if the per capita waste generation rate of the city reaches the East Asia and Pacific standard of 0.95 kg/person/day, there would a reduction in the fuel consumption of the trucks (BRL 4.9 million/year). On the other hand, a fuel cost of BRL 6.02 million/year might be required by the trucks to transport the solid waste from the CP to the landfill if the per capita of the city increases to 1.25 kg/person/day. This is due to the fact that, with decrease with the per capita rate, the SW available to be landfilled at each CP also reduces considerably. This would reduce the number of trips by the trucks between CP and TS, and ultimately to the landfill site, and thus, improve the fuel efficiency.
Meanwhile, if the city satisfies the sanitation municipal plan of 2015 and recycles 85% of the SW generated in the city and continues to generate 1.09 kg/person/day of MSW, the amount of MSW to be sent to landfill would be reduced to a great extent. It is noteworthy that currently, 1423 tonnes/day of MSW are landfilled. However, with the 85% recycling rate, only 291 tonnes/day might be available to be sent to the landfill, and the trucks might consume fuel costing BRL 5.5 million/year to transport the MSW from DP to the landfill (Figure 5c).

4.4. Lifespan Expectancy of Landfill with MSW Management Techniques

The current waste generation in the study region is 3423 tonnes/day, and 519,395 tonnes are sent to the landfill site every year. Hence, based on the lifespan estimation of the landfill (discussed in Section 3.5), the existing landfill might be operational only until 2026 if the business-as-usual situation of MSW management (23% recycling rate and 1.09 kg/person/day) continues in the city. However, if the per capita MSW generation reaches the desired value of 0.95 kg/person/day, then 482,530 tonnes/year might be landfilled, and the landfill may function until 2027. It should be noted that if the current recycling rate (23%) is followed in the city, reducing the source level waste generation of 0.95 kg/person/day might not significantly increase the lifespan of the existing landfill (Figure 6).
However, it is interesting to note that, with the current per capita generation of MSW (1.09 kg/person/day), if the city achieves its targeted 85% recycling rate, then the landfill may be available for a comparatively longer time, i.e., until 2058. This is because, with higher recycling rate, a lesser amount of SW (106,215 tonnes/year) might be available to be dumped in the landfill site. Hence, the result of the analysis would be useful to the planning authorities of Curitiba to focus more on implementing their SW management plan set in 2015 to recycle 85% of the SW and to implement segregation of the waste at source level so that the quality of the recyclable/reusable waste is not affected. Further, the analysis highlights the fact that the city’s per capita level (1.09 kg/person/day) is already well below the international norms, and aiming to decrease the per capita value of MSW might not be a better solution since the landfill might be available only for an additional one year (until 2027) compared with the current situation, where the landfill might be operational until 2026. However, to reach circularity in MSW management in the study region, increasing the recycling rate (85%) of the SW could be the best strategy since the landfill might be available to accommodate the city’s MSW for a much longer time (until 2058) (Figure 6).
In the current study, the yearly population increase rate of Curitiba is expected to be 3%. The available capacity of the existing landfill is 802,500 cubic m. Table 2 highlights the calculation involved in the lifespan estimation of the landfill under different MSW management scenarios.

5. Policy Framework for Circularity in Urban MSW Management

CE, in contrast to the traditional linear ‘take–make–use–dispose’ model, has been gaining momentum in the management of MSW [51]. The CE framework seeks to reduce the generation of waste, resource circulation (reuse and recycle), and replace the ‘end-of-life’ concept while promoting economic prosperity and environmental quality [52]. The CE action plan would promote ways towards cleaner, sustainable, and competitive societies and/or regions. Thus, it is important to localize the concept of circularity in cities, especially in the waste management sector, as it promotes sustainable development. There are several initiatives, action plans, and directives in the favor of promoting circularity globally [53,54]. Collection of MSW, resource recovery, lack of infrastructure, and adequate funding are a few challenges for the efficient management of SW in the cities of developing countries [55]. Further, in the cities of EU, management of MSW is considered as a major decision-making issue for the sustainable development [56].
Brazil is aiming towards CE, for which the country needs consorted efforts and improvement on the current practices, both at national and local levels. The city of Curitiba coordinates with local and regional partners in the management of solid waste [24]. In addition, Curitiba is one of the targeted pilot project cities with the aim of reducing landfills up to 97%. There are several tools and methods for accounting for circularity in the management of solid waste in cities. We need to use suitable decision support tools, such as multi-criteria optimization tools and GIS spatial analysis, which would help in realizing an optimal pathway towards the implementation of a circular economy [57]. It should be noted that a phase-wise transition towards circularity could be possible considering the challenges and constraints in the mobilization of resources and the need of socio-economic transitions in cities, especially in developing countries. In this way, the CE framework in the management of SW should adopt an integrated approach, starting from the assessment of circularity using decision support tools, the promotion of sustainable practices (reduce, recycle, reuse), the involvement of relevant actors (municipalities, civil society), and the formulation/implementation of plans and policies. This paper contributes to sustainable waste management and resource recovery, which could offer co-benefits and enormous opportunities for scope-sharing while addressing various sustainable development goals (SDGs), especially SDG 6 (clean water and sanitation), SDG 11 (sustainable cities and communities), SDG 12 (related with sustainable consumption and production) [58], and the cross-cutting goals such as poverty alleviation (SDG1). WtE strategies used in the management of MSW will help to increase the share of renewable energy in the energy mix (SDG 7) and minimize GHG emissions, helping to combat climate change (SDG13). Circularity in the MSW management and its linkages for the achievement of SDGs has been discussed in detail by [57].

6. Conclusions

This study has highlighted the need for an integrated MSW management plan for the city of Curitiba in Brazil after analysing the current solid waste management practices of the city. Non-segregation of waste at source level is one of the major challenges faced by the city. Through a GIS-based spatial analysis technique, this study identified six potential transfer stations by taking into account of various geological criteria and constraints. With the inclusion of transfer stations, the solid wastes is segregated into organic, recyclable/reusable, and that to be landfilled. This way, only the waste that has to be landfilled would be transported from the transfer stations, thereby reducing the distance travelled by the trucks to transport the solid waste from the city to landfill. In the current study, with the inclusion of transfer stations, the distance travelled by the trucks to transport the solid waste from the source to the landfill site could be reduced from 7223 km to 5696 km per day. This would have a fuel saving of 1.5 million Brazilian Real (BRL) in a year.
Further, sensitivity analyses on the basis of various solid waste management policy scenarios of the city have been also carried out. The results of the analysis suggest that if the city targets reduction of waste generation at the source level, i.e., reduction in the per capita waste generation of 0.93 kg/person/day, then the landfill might be available only until 2027. However, if the solid waste management authorities and policy-makers of the city succeed in recycling 85% of the generated waste, then the existing landfill might be available for another 16 years (until 2058).
The current study highlighted the need for transfer stations for waste segregation, which might reduce the travelling distance and the fuel cost of the trucks transporting the solid waste to the landfill. The results of the study might be beneficial to cities, especially in developing countries where landfill is still considered one of the ways to dispose of solid waste. However, these cities are striving to achieve a ‘zero-landfill’ scenario, and the transition towards this goal might be a gradual one. Lack of efficient solid waste management practices, inadequate resources, lack of public awareness, and non-segregation of waste at the source level are considered the major problems of solid waste management in developing countries. The results of this study could be helpful to the cities given the need to improve the recycling rate of the waste, reaching the concept of circularity in the waste management, and, thus, a no-landfill scenario could be achieved in the future. However, the impact of transfer stations on GHG emissions also play a major role in devising appropriate waste management policies, which would be taken into consideration in our future research activities. The traffic and water pollution impact of the transfer station was not assessed during the study. A larger number of waste trucks on the road could contribute to increased traffic and lead to congestion on the roads. Waste will not remain long enough at a properly managed transfer station for significant decomposition to occur. However, if waste is left outside the transfer station, then the rain can wash a number of pollutants into nearby waters. Further, in the current study, with the inclusion of transfer stations, only the cost of fuel that could be saved to transport the solid waste from collection points to the landfill was analysed. However, the contribution of transfer stations to the reduced greenhouse gas emissions was not studied.

Author Contributions

A.A.D. and B.M.; methodology, A.A.D. and B.M.; software, A.A.D.; validation, A.A.D. and B.M.; formal analysis, A.A.D. and B.M.; investigation, A.A.D., B.M. and K.M.; resources, A.A.D. and B.M.; data curation, A.A.D. and B.M.; writing—original draft preparation, A.A.D., B.M., D.K., F.G., K.M. and C.H.T.; writing—review and editing, A.A.D. and B.M.; visualization, A.A.D.; supervision, B.M. and K.M.; project administration, B.M. and D.K.; funding acquisition, D.K. and B.M. All authors have read and agreed to the published version of the manuscript.

Funding

This paper is a part of the research project “Bio-based circular recovery model for sustainable urban economies” funded by the Swedish research council for sustainable development (FORMAS), Grant number: 2017-00266. We would like to express our thanks to FORMAS for their financial support.

Institutional Review Board Statement

Not applicable.

Informed Consent Statement

Not applicable.

Data Availability Statement

Not applicable.

Conflicts of Interest

The authors declare no conflict of interest.

Abbreviations

AHPAnalytical Hierarchy Process
CECircular Economy
CPCollection Point
DPDisposal Point
GIS Geographic Information System
MCEMulti-Criteria Evaluation
MSWMunicipal Solid Waste
NSWPNational Solid Waste Policy
SWSolid Waste
TSTransfer Station
WtEWaste to Energy

References

  1. Cudjoe, D.; Wang, H.; Zhu, B. Assessment of the potential energy and environmental benefits of solid waste recycling in China. J. Environ. Manag. 2021, 295, 113072. [Google Scholar] [CrossRef]
  2. The World Bank. Solid Waste Management. 2019. Available online: https://www.worldbank.org/en/topic/urbandevelopment/brief/solid-waste-management (accessed on 6 October 2021).
  3. Blair, J.; Mataraarachchi, S. Review of Landfills, Waste and the Nearly Forgotten Nexus with Climate Change. Environments 2021, 8, 73. [Google Scholar] [CrossRef]
  4. Interreg Europe. Sustainable waste management in a circular economy, A Policy Brief from the Policy Learning Platform on Environment and resource efficiency. 2020. Available online: https://www.interregeurope.eu/fileadmin/user_upload/plp_uploads/policy_briefs/Policy_brief_on_waste_management.pdf (accessed on 14 February 2022).
  5. Abdel-Shafy, I.; Mansour, M.S.M. Solid waste issue: Sources, composition, disposal, recycling, and valorization. Egypt. J. Pet. 2018, 27, 1275–1290. [Google Scholar] [CrossRef]
  6. Malav, L.C.; Yadav, K.K.; Gupta, N.; Kumar, S.; Sharma, G.K.; Krishnan, S.; Rezania, S.; Kamyab, H.; Pham, Q.B.; Yadav, S.; et al. A review on municipal solid waste as a renewable source for waste-to-energy project in India: Current practices, challenges, and future opportunities. J. Clean. Prod. 2020, 277, 123227. [Google Scholar] [CrossRef]
  7. Prajapati, K.K.; Yadav, M.; Singh, R.M.; Parikh, P.; Pareek, N.; Vivekanand, V. An overview of municipal solid waste management in Jaipur city, India-Current status, challenges and recommendations. Renew. Sust. Energ. Rev. 2021, 152, 111703. [Google Scholar] [CrossRef]
  8. Henry, R.K.; Yongsheng, Z.; Jun, D. Municipal solid waste management challenges in developing countries—Kenyan case study. Waste Manag. 2006, 26, 92–100. [Google Scholar] [CrossRef] [PubMed]
  9. Lima, P.D.M.; Olivo, F.; Paulo, P.L.; Schalch, V.; Cimpan, C. Life Cycle Assessment of prospective MSW management based on integrated management planning in Campo Grande, Brazil. Waste Manag. 2019, 90, 59–71. [Google Scholar] [CrossRef]
  10. Naveen, B.P.; Sumalatha, J.; Malik, R.K. A study on contamination of ground and surface water bodies by leachate leakage from a landfill in Bangalore, India. Int. J. Geo. Eng. 2018, 9, 1–20. [Google Scholar] [CrossRef]
  11. Yukalang, N.; Clarke, B.; Ross, K. Solid Waste Management Solutions for a Rapidly Urbanizing Area in Thailand: Recommendations Based on Stakeholder Input. Int. J. Environ. Res. Public Health 2018, 15, 1302. [Google Scholar] [CrossRef]
  12. Silva, C.L. Proposal of a dynamic model to evaluate public policies for the circular economy: Scenarios applied to the municipality of Curitiba. Waste Manag. 2018, 78, 456–466. [Google Scholar] [CrossRef]
  13. Sustainability in Curitiba, 2021. Curitiba City, A Model In Sustainable Urban Planning. Available online: https://viablealternativenergy.com/curitiba-city/ (accessed on 14 February 2022).
  14. Mian, M.M.; Zeng, X.; Nasry, A.a.N.B.; Al-Hamadani, S.M.Z.F. Municipal solid waste management in China: A comparative analysis. J Mater Cycles Waste Manag. 2017, 19, 1127–1135. [Google Scholar] [CrossRef]
  15. Matheson, T. Disposal is Not Free: Fiscal Instruments to Internalize the Environmental Costs of Solid Waste; IMF Working Paper; IMF: Washington, DC, USA, 2019. [Google Scholar] [CrossRef]
  16. Silva, C.L.; Bolson, C. Public Policy for Solid Waste and the Organization of Waste Pickers: Potentials and Limitations to Promote Social Inclusion in Brazil. Recycling 2018, 3, 40. [Google Scholar] [CrossRef]
  17. US EPA. Waste Transfer Stations: A Manual for Decision-Making, United States Environmental Protection Agency. 2002. Available online: https://www.epa.gov/sites/default/files/2016-03/documents/r02002.pdf (accessed on 15 February 2022).
  18. Bovea, M.D.; Powell, J.C.; Gallardo, A.; Capuz-Rizo, S.F. The role played by environmental factors in the integration of a transfer station in a municipal solid waste management system. J. Waste Manag. 2007, 27, 545–553. [Google Scholar] [CrossRef] [PubMed]
  19. Jia, D.; Li, X.; Shen, Z. Robust optimization model of waste transfer station location considering existing facility adjustment. J. Clean. Prod. 2022, 340, 130827. [Google Scholar] [CrossRef]
  20. Chang, N.B.; Lin, Y.T. Optimal siting of transfer station locations in a metropolitan solid waste management system. Spectrosc. Lett. 1997, 30, 601–623. [Google Scholar] [CrossRef]
  21. Gil, Y.; Kellerman., A. A Multicriteria Model for the Location of Solid Waste Transfer Stations: The Case of Ashdod, Israel. GeoJournal 1991, 22, 27–37. [Google Scholar] [CrossRef]
  22. Yadav, V.; Karmakar, S.; Dikshit, A.K.; Vanjari, S. A feasibility study for the locations of waste transfer stations in urban centers: A case study on the city of Nashik, India. J. Clean. Prod. 2016, 126, 191–205. [Google Scholar] [CrossRef]
  23. Rathore, P.; Sarmah, S.P. Modeling transfer station locations considering source separation of solid waste in urban centers: A case study of Bilaspur city, India. J. Clean. Prod. 2019, 211, 44–60. [Google Scholar] [CrossRef]
  24. International Finance Corporation. Curitiba Solid Waste Management Project Phase 1A: Assessment Report. 2015. Available online: https://mid.curitiba.pr.gov.br/2016/00176737.pdf (accessed on 5 October 2021).
  25. Ersoy, H.; Bulut, F. Spatial and multi-criteria decision analysis-based methodology for landfill site selection in growing urban regions. Waste Manag Res. 2009, 27, 489–500. [Google Scholar] [CrossRef]
  26. Vaverková, M.D. Landfill Impacts on the Environment–Review. Geosciences 2019, 9, 431. [Google Scholar] [CrossRef]
  27. Amal, L.; Son, L.H.; Chabchoub, H.; Lahiani, H. Analysis of municipal solid waste collection using GIS and multi-criteria decision aid. Appl. Geomat. 2020, 12, 193–208. [Google Scholar] [CrossRef]
  28. Lou, C.X.; Shuai, J.; Luo, L.; Li, H. Optimal transportation planning of classified domestic garbage based on map distance. J. Environ. Manag. 2020, 254, 109781. [Google Scholar] [CrossRef]
  29. Nguyen-Trong, K.; Nguyen-Thi-Ngoc, A.; Nguyen-Ngoc, D.; Dinh-Thi-Hai, V. Optimization of municipal solid waste transportation by integrating GIS analysis, equation-based, and agent-based model. Waste Manag. 2017, 59, 14–22. [Google Scholar] [CrossRef] [PubMed]
  30. Alkaradaghi, K.; Ali, S.S.; Al-Ansari, N.; Laue, J.; Chabuk, A. Landfill Site Selection Using MCDM Methods and GIS in the Sulaimaniyah Governorate, Iraq. Sustainability. 2019, 11, 4530. [Google Scholar] [CrossRef]
  31. Vasiljević, T.Z.; Srdjević, Z.; Bajčetić, R.; Miloradov, M.V. GIS and the analytic hierarchy process for regional landfill site selection in transitional countries: A case study from Serbia. Environ. Manag. 2012, 49, 445–458. [Google Scholar] [CrossRef] [PubMed]
  32. Aparecido, L.E.O.; Rolim, G.S.; Richetti, J.; Souza, P.S.; Johnn, J.A. Köppen, Thornthwaite and Camargo climate classifications for climatic zoning in the State of Paraná, Brazil. Ciência E Agrotecnologia 2016, 40, 405–417. [Google Scholar] [CrossRef]
  33. IPPUC. Institute for Research and Urban Planning of Curitiba, Zoning regulation. 2019. Available online: https://www.ippuc.org.br/visualizar.php?doc=https://admsite2013.ippuc.org.br/arquivos/documentos/D311/D311_009_BR.pdf (accessed on 5 October 2021).
  34. Sahani, N. Application of analytical hierarchy process and GIS for ecotourism potentiality mapping in Kullu District, Himachal Pradesh, India. Environ. Dev. Sustain. 2020, 22, 6187–6211. [Google Scholar] [CrossRef]
  35. Bosompem, C.; Stemn, E.; Fei-Baffoe, B. Multi-criteria GIS-based siting of transfer station for municipal solid waste: The case of Kumasi Metropolitan Area, Ghana. Waste Manag. Res. 2016, 34, 1054–1063. [Google Scholar] [CrossRef]
  36. Mussa, A.; Suryabhagavan, K.V. Solid waste dumping site selection using GIS-based multi-criteria spatial modeling: A case study in Logia town, Afar region, Ethiopia. Geol. ecol. landsc. 2021, 5, 186–198. [Google Scholar] [CrossRef] [Green Version]
  37. Şener, Ş.; Sener, E.; Karagüzel, R. Solid waste disposal site selection with GIS and AHP methodology: A case study in Senirkent–Uluborlu (Isparta) Basin, Turkey. Environ. Monit. Assess. 2011, 173, 533–554. [Google Scholar] [CrossRef] [PubMed]
  38. Balasubramanian, M. Economics of Solid Waste Management: A Review; Saleh, H., Ed.; Strategies of Sustainable Solid Waste Management; IntechOpen: London, UK, 2020; pp. 1–10. [Google Scholar]
  39. Silva, C.L. Avaliacão Da Política Municipal Da Gestão Integrada De Resíduos Sólidos Urbanos De Curitiba. 2016. Available online: https://observatoriopnrs.files.wordpress.com/2016/06/relatorio-pmgirs-curitiba-junho-2016.pdf (accessed on 15 February 2022).
  40. Solid Waste Management City Profile. 2017. Available online: https://www.waste.ccacoalition.org/sites/default/files/files/city_profile_curitiba_2017_final_10_may.pdf (accessed on 5 October 2021).
  41. Nithya, R.; Velumani, A.; Kumar, S.R.R. Optimal location and proximity distance of municipal solid waste collection bin using GIS: A case study of Coimbatore city, WSEAS Trans. Environ. Dev. 2012, 8, 107–119. [Google Scholar]
  42. Das, D.; Ojha, A.K.; Kramsapi, H.; Baruah, P.P.; Dutta, M.K. Road network analysis of Guwahati city using GIS. SN Appl. Sci. 2019, 1, 906. [Google Scholar] [CrossRef]
  43. Hatamleh, R.I.; Jamhawi, M.M.; Al-Kofahi, S.D.; Hijazi, H. The Use of a GIS System as a Decision Support Tool for Municipal Solid Waste Management Planning: The Case Study of Al Nuzha District, Irbid, Jordan. Procedia Manuf. 2020, 44, 189–196. [Google Scholar] [CrossRef]
  44. Zhang, D.Q.; Tan, S.K.; Gersberg, R.M. Municipal solid waste management in China: Status, problems and challenges. J. Environ. Manag. 2010, 91, 1623–1633. [Google Scholar] [CrossRef] [PubMed]
  45. Araujo, C.S.C. Freight in Brazil, an Assessment and Outlook for Improving Environmental Performance. 2021. Available online: https://theicct.org/wp-content/uploads/2021/12/brazil-freight-assessed-sept21.pdf (accessed on 14 March 2022).
  46. Silva, C.L.; Rabelo, J.M.O.; Maria, J.; Ramazzotte, V.C.B.; Rossi, L.F.S.; Bollamann, H.A. The biogas chain and local sustainability: An environmental socioeconomic analysis of energy obtained from urban solid-waste from the Caximba land-fillin Curitiba, Paraná, Brazil. Innovar 2009, 19, 83–98. [Google Scholar]
  47. CPHEEO. Central Public Health & Environmental Engineering Organisation, Manual on Municipal Solid Waste Management. 2016. Available online: http://cpheeo.gov.in/upload/uploadfiles/files/annex17.pdf (accessed on 5 October 2021).
  48. PPIAF (Public-Private Infrastructure Advisory Facility). Managing municipal solid waste in Latin America and the Caribbean. 2007. Available online: https://ppiaf.org/documents/3021/download (accessed on 5 October 2021).
  49. Alfaia, R.G.S.M.; Costa, A.M.; Campos, J.C. Municipal solid waste in Brazil: A review. Waste Manag. Res. 2017, 35, 1195–1209. [Google Scholar] [CrossRef]
  50. Hettiarachchi, H.; Ryu, S.; Caucci, S.; Silva, R. Municipal Solid Waste Management in Latin America and the Caribbean: Issues and Potential Solutions from the Governance Perspective. Recycling 2018, 3, 19. [Google Scholar] [CrossRef]
  51. Ntostoglou, E.; Khatiwada, D.; Martin, V. The Potential Contribution of Decentralized Anaerobic Digestion towards Urban Biowaste Recovery Systems: A Scoping Review. Sustainability 2021, 13, 13435. [Google Scholar] [CrossRef]
  52. Kirchherr, J.; Reike, D.; Hekkert, M. Conceptualizing the circular economy: An analysis of 114 definitions. Resour. Conserv. Recycl. 2017, 127, 221–232. [Google Scholar] [CrossRef]
  53. Mancini, S.D.; Medeiros, G.A.; Paes, M.X.; Oliveira, B.O.S.; Antunes, M.L.P.; Souza, R.G.; Ferraz, J.L.; Bortoleto, J.P.; Oliveira, J.A.P. Circular Economy and Solid Waste Management: Challenges and Opportunities in Brazil. Circ. Econ. Sust. 2021, 1, 261–282. [Google Scholar] [CrossRef]
  54. Ogunmakinde, O.E. A Review of Circular Economy Development Models in China, Germany and Japan. Recycling 2019, 4, 27. [Google Scholar] [CrossRef] [Green Version]
  55. Hemidat, S.; Achouri, O.; Fels, L.E.; Elagroudy, S.; Hafidi, M.; Chaouki, B.; Ahmed, M.; Hodgkinson, I.; Guo, J. Solid Waste Management in the Context of a Circular Economy in the MENA Region. Sustainability 2022, 14, 480. [Google Scholar] [CrossRef]
  56. Pires, A.; Martinho, G.; Chang, N.-B. Solid waste management in European countries: A review of systems analysis techniques. J. Environ. Manag. 2011, 92, 1033–1050. [Google Scholar] [CrossRef] [PubMed]
  57. Khatiwada, D.; Golzar, F.; Mainali, B.; Devendran, A.A. Circularity in the Management of Municipal Solid Waste–A Systematic Review. Environ. Clim. Technol. 2021, 25, 491–507. [Google Scholar] [CrossRef]
  58. Velenturf, A.P.M.; Purnell, P. Resource Recovery from Waste: Restoring the Balance between Resource Scarcity and Waste Overload. Sustainability 2017, 9, 1603. [Google Scholar] [CrossRef] [Green Version]
Figure 1. Methodological framework implemented in the study region. (a) Site suitability analysis for the selection of transfer station; (b) Lifespan expectancy of the landfill; and (c) Network analysis to estimate the cost-effective route to transport MSW in the study region.
Sustainability 15 03252 g001
Figure 2. Input variables used to identify suitable sites for transfer station in the study region. (ae) Proximity Maps and (fj) Reclassified Maps of drainage network, elevation, road network, residential areas, and amenities (educational institutions, hospitals, places of worship, recreational centres, public utility centres, government offices, and banks), respectively.
Sustainability 15 03252 g002
Figure 3. Site suitability map prepared through overlay analysis for transfer station implementation in the study region.
Sustainability 15 03252 g003
Figure 4. Location of MSW collection and disposal centres in the study region along with the proposed transfer stations.
Sustainability 15 03252 g004
Figure 5. Influence of inclusion of transfer station and different MSW management scenarios on the fuel efficiency and the amount of MSW to landfill in the study region (a) with the inclusion of transfer; (b) Change in per capita of MSW; (c) Change in the recycling rate of MSW.
Sustainability 15 03252 g005
Figure 6. Lifespan expectancy of the existing landfill under different MSW management techniques.
Sustainability 15 03252 g006
Table 1. Potential sites for transfer station implementation in Curitiba city.
Site IDArea (sq. m)Distance (km) from the Disposal PointCollection Points ServedAmount of MSW (Tonnes) Received at Collection Points
A890015.36381059.75
B78,2004.210, 17, 391152.78
C109,2002.31, 2, 37172.84
D581,500104–9, 11, 15, 16, 18–36, 37, 40951.68
E47,8008.43, 1440.87
F148,40013.4312, 1345.09
Table 2. Lifespan expectancy calculation under different MSW management techniques.
DescriptionBusiness As Usual (23% Recycling Rate, 1.09 kg/Person/Day per Capita MSW Generation without the Transfer Station)Inclusion of Transfer Station, with 23% Recycling and Preferred per Capita MSW Generation of 0.93 kg/Person/DayInclusion of Transfer Station, with Targeted 85% Recycling Rate and per Capita MSW Generation of 1.09 kg/Person/Day
Current amount of MSW (tonnes) as of 2020 to be landfilled/year (W)519,395482,530106,215
Expected lifespan (years) of the landfill (n)6738
Waste generation (tonnes/year) after n years (W1)696,039678,968678,233
Total waste generation (tonnes) in n years (T)679,46766,280662,085
Total volume (m3) of waste generated in n years (vt)79,93777,976778,924
Disclaimer/Publisher’s Note: The statements, opinions and data contained in all publications are solely those of the individual author(s) and contributor(s) and not of MDPI and/or the editor(s). MDPI and/or the editor(s) disclaim responsibility for any injury to people or property resulting from any ideas, methods, instructions or products referred to in the content.

