Article

Approaching Urban Food Waste in Low- and Middle-Income Countries: A Framework and Evidence from Case Studies in Kibera (Nairobi) and Dhaka

1
Fresh Food & Chains Department, Wageningen Food & Biobased Research, Bornse Weilanden 9, 6708 WG Wageningen, The Netherlands
2
European Centre for Development Policy Management, Avenue des Arts 44, 1000 Brussels, Belgium
3
Division Impacts on Agriculture, Forests and Ecosystem Services (IAFES), Foundation Euro-Mediterranean Center on Climate Change (CMCC), Via Garbini 51, 01100 Viterbo, Italy
*
Author to whom correspondence should be addressed.
Sustainability 2023, 15(4), 3293; https://0-doi-org.brum.beds.ac.uk/10.3390/su15043293
Submission received: 22 December 2022 / Revised: 2 February 2023 / Accepted: 3 February 2023 / Published: 10 February 2023

Abstract

:
Increased urbanization rates pose crucial challenges in terms of food systems’ sustainability, including urban food waste (FW). The global narrative around FW has focused mainly on Western countries, but recent evidence shows that FW is also a major issue in the developing world. The objective of this article is to define the characteristics and drivers of urban FW in low- and middle-income countries (LMIC). We firstly present a tailor-made three-step approach to identify urban FW hotspots in LMIC, understand the main drivers and design and implement prevention and reduction interventions considering LMIC food system characteristics. We then draw on results from four different urban FW case studies based in Nairobi (Kenya) and Dhaka (Bangladesh) and discuss their characteristics in light of the proposed approach. The case of Nairobi focuses on quantifying and understanding possible drivers of household FW in Kibera and characterizing FW disposal through a household survey (N = 774). The other three studies examine FW at retail, food service and institutional levels for onions, mangoes and beef in Dhaka. The results confirm that FW happens at the urban supply chain level, particularly among mobile vendors but also among households living below the poverty line. The article thus urges LMIC municipalities to consider urban FW strategies as a key action to tackle food security, environmental issues and FW management challenges.

1. Introduction

In this article, we aim to define the characteristics and drivers of urban food waste (FW) in low- and middle-income countries (LMIC) and propose a three-step approach to monitor and reduce urban FW that, by drawing on existing frameworks and tools, can be tailored to LMIC food system contexts.
FW—defined as the food that is removed from the human food supply chain from households and the retail and food service sectors—is one of the paradoxes of our era. Global averaged per capita food loss and waste (FLW) has increased by 44% between 1961 and 2011 [1] and in 2017, it was approximately 1.9 Gt of food, which accounted for 29% of the total primary food production [2]. In 2019, FAO indicated that 13.8% of the world’s food produced globally in 2016 was lost, and approximately 30% of the world’s agricultural land was used to produce food that was either lost or wasted [3]. Reducing FW is critical for several economic, social and environmental reasons, but also to achieve healthy diets and sustainable food systems [4,5] and to reach several different sustainable development goals (SDGs). Traditionally, FW studies have focused on high income countries (HIC), whereas research on LMIC has dealt with harvest and post-harvest losses (PHL). However, the recent UNEP FW Index disrupted this global narrative showing that FW is a global problem, being equally prevalent in high, upper middle and LMIC, although with insufficient data to make conclusions on low-income countries [6]. The report warned that FW at the consumer level may be more than twice the previous FAO estimate, with a global average of 74 kg of food wasted per capita each year (for a total of 931 million tons), remarkably similar between LMIC and HIC.
Since FW influences food availability, access, utilization and stability, its reduction could contribute positively to both food security and nutrition in LMIC, especially when considering that about 481 million and 282 million people are currently undernourished in Asia and Africa, respectively [7]. FW prevention is also important from an environmental perspective because it represents 8–10% of global greenhouse gases (GHG) emissions (3.3 billion tons CO2-eq. per year) [8] and has a mitigation potential between 0.8–4.5 Gt CO2 eq./year [8,9]. So far, there has been limited research and data on FW in LMIC, despite some worrying trends. First of all, Africa and Asia are experiencing rapid population growth, with a projected increase of 42% in Africa and of 12% in Asia in the next 15 years [10]. Secondly, with 2.5 billion people estimated to move towards urban settlements globally in the coming decade [11], urbanization, change of consumer patterns [12] and growing urban wealth are going to have an impact on FW generation [12,13]. Organic waste already accounts for more than half of total urban waste [14], and increasing incomes in urban settlements [15,16] or a greater awareness about food safety [17] are expected to lead to even higher levels of FW. Growing urban FW represents a threat for the environment and public health in LMIC [18], putting a tremendous pressure on Municipal Solid Waste Management (MSWM) systems: waste disposal and management in 2016 were responsible for about 5% of GHG emissions [14].
In the past few years, some research has started to provide insights to help design protocols and interventions to measure and reduce FLW [3,19,20,21,22]. However, these studies have focused predominantly on pre- and post-harvest loss reduction. In LMIC food system contexts, major knowledge gaps remain on downstream FW, including gaps in terms of data collection, FW drivers and frameworks/tools to design and implement interventions to prevent, reduce and manage urban FW in LMIC. The FUSIONS and the REFRESH projects—although focused only on the EU—have contributed to improving FW monitoring harmonization by providing a definitional framework for FW, a manual for FW quantification, and a set of recommendations concerning policies, practices and effective approaches for FW prevention and reduction. In addition, the Milan Urban Food Policy Pact (MUFPP) has launched a monitoring framework [23] with specific recommended actions for FW, as well as clear indicators and tools for data collection. Other studies proposed a framework to assess urban FW policies and initiatives in a selection of European cities [24]. However, most of the studies are biased towards Western food systems. LMIC urban food systems have specific features, such as the predominant role of the informal sector for the midstream value chain operations, the absence of a dominant modern retail sector (supermarkets), a food production system based on smallholder farmers, the absence of cold chain infrastructure, less resources and storage infrastructure, and generally deficient MSWM systems with extensive littering and landfill disposal. Due to these structural differences in the urban food system context between HIC and LMIC, we cannot expect the solutions proposed for HIC to be directly applicable to LMIC contexts. Moreover, no in-depth research has been conducted yet on what characterizes (in terms of waste hotspots, products, waste flows, and destinations) and drives the problem of urban FW in LMIC. Likewise, we expect these characteristics and drivers to be considerably different from those relevant for HIC, but due to a lack of data and existing studies, this remains conjecture and is left for further research. Therefore, investigating the characteristics and drivers of urban FW in LMIC represents a key knowledge gap to be addressed. Starting from this research gap, this work has been guided by the following research questions:
(1)
“What are the available tools and frameworks for analyzing urban FW in LMIC and developing related reduction interventions and management?”
(2)
“What are the main FW hotspots and drivers in the urban areas of LMIC?”
To address these research questions, the paper first presents a 3-step food system approach to urban FW in LMIC (Section 2). This approach, derived from previous frameworks and tools, is based on (i) identifying and understanding urban FW hotspots, (ii) choosing and designing a proper FW intervention and (iii) evaluating its correct implementation. Second, this research digs into four case studies based in Nairobi (Kenya) and Dhaka (Bangladesh). Section 3 provides details about data collection and data analysis, whereas Section 4 presents the main results related to FW for all the case studies. The manuscript then discusses the results of the case studies, identifying urban FW hotspots, their main drivers and possible interventions to scale up in LMIC cities (Section 5). Finally, in the conclusion (Section 6), we urge LMIC municipalities to consider urban FW management as a key action to tackle food security, environmental issues and FW management challenges.
The study in Nairobi focused on quantifying and understanding possible drivers of household FW in a slum and characterizing FW disposal. Kenya’s capital, Nairobi, is an example of the critical situation related to urban food insecurity in Africa, with 47% of its total population being food insecure [25] and 60–70% of its population living in slums in 2014 [26]. Near the city center stands Kibera, one of the largest slums in Africa [27], with an estimated population varying from 700,000 [28] to 170,000 residents [29]. More than three-quarters of the households in Kibera live below the official poverty line of USD 1 per day [30], with unstable incomes, of which 40–50% on average is spent on food, and chronic food insecurity being a norm [31]. Together with lack of access to clean water, decent sanitation, security and durable housing, one issue in Kibera is the lack of MSW management systems and infrastructure. This is worsened by the uncontrolled dumping of waste by inhabitants, with waste being burned or ending up in streets and streams [32], which contributes to slum pollution. The generated MSW in Kibera was estimated to be around 205 tons per day [33]. Overall, the complexities of slums like Kibera have yet to be fully untangled, including the FW amounts and possible drivers behind them.
The other three studies presented in this work examined urban FW at retail, food service and institutional levels for three food supply chains (onions, mangoes and beef) in Dhaka. While Bangladesh has made significant progress in terms of food and nutrition security, 15.9 million people were still undernourished between 2018 and 2020 [3]. Significant problems remain regarding FLW: between 2016 and 2017, a total of 23.69 million tons of food was wasted, corresponding to approximately 45% of the total food production, with 67% of total FW occurring from post-harvest to the consumer stage [34]. The pace of urbanization and the ongoing process of climate change are raising new concerns about food and nutrition security, especially in the capital city of Dhaka, which is expected to house over 27 million people by 2030 [35]. This fast urbanization—mainly through rural migration—is putting increasing pressure on the urban food system and its MSWM system. The total MSW generated daily within all the Bangladeshi cities is roughly 10.000 tons, of which 68.3–81.1% is FW [36] and only 40–50% is appropriately managed [37]. The Dhaka region has the highest per capita FW generation rate (0.56 kg/capita/day) and the highest net amount of FW (1.2 megatons/year) [34]. Despite these general figures, available information on urban FW, its drivers and its management is scarce, and the UNEP report (2021) indicated a high level of uncertainty about current Bangladesh FW levels. One study on food service FW in Dhaka, gave an estimation of 12 tons/day of waste produced by restaurants, shops, hotels, markets and public facilities [38]. Another two studies explored household FW in Chittagong, and they indicated an estimate of 74 and 57 kg/capita/year, respectively [39,40], leading to a household FW estimate of 11 Gt/year for the whole country [6]. The country does not have a specific FW management policy since this is treated as a part of MSW and is not separated for specific waste treatment.

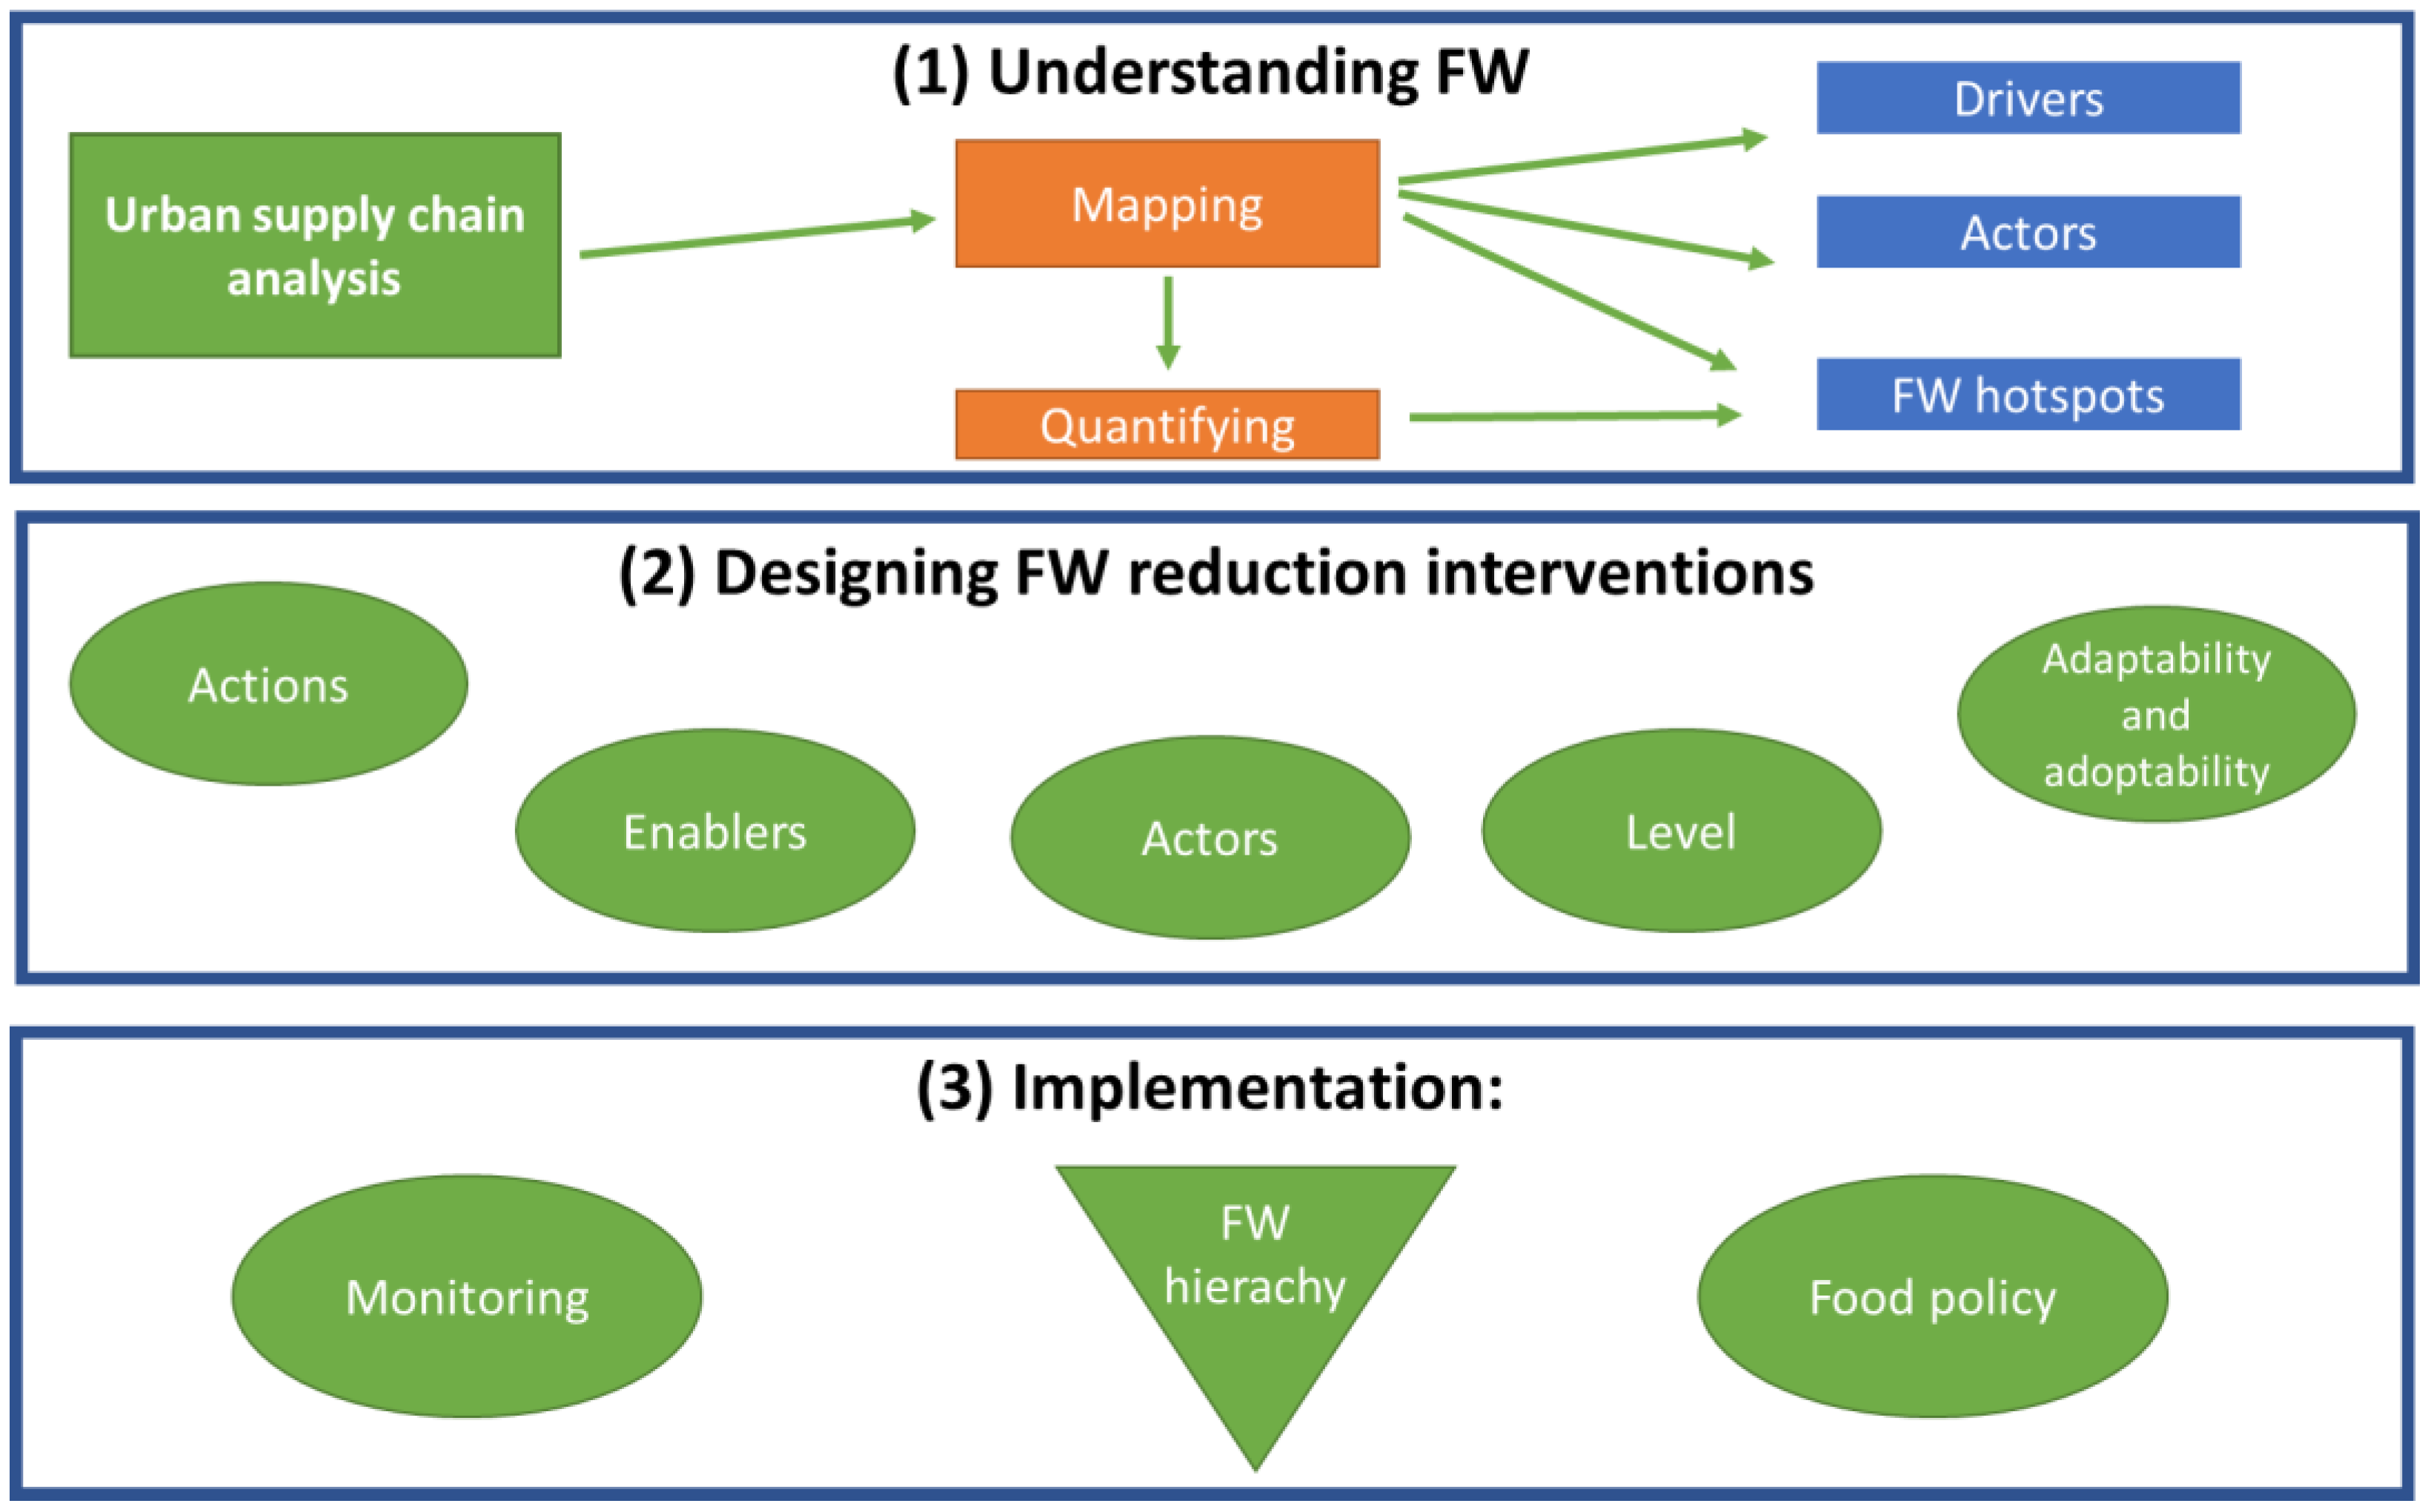
2. A Three-Step Food System Approach to Tackle Urban Food Waste in Low- and Middle-Income Countries

Reducing FW can benefit LMIC at least in three ways: (i) improving food and nutrition security; (ii) reducing the environmental impact in terms of GHG emissions and pressure on water and land resources and (iii) boosting productivity to generate economic growth. Following the approach presented in a recent publication from IFAD [41] and by considering the “Target, Measure, Act” strategy (SDG 12.3 Champions), we propose a three-step food system approach for addressing FW at the urban level (Figure 1) [42]. The approach draws on existing tools and frameworks launched to assess urban FW, aiming to adapt them to the needs and features of LMIC.
This approach is based on three layers: (i) understanding and identifying urban food FW hotspots, (ii) designing effective FW reduction interventions tailored to the specific urban scenario and (iii) implementing urban FW reduction interventions. The proposed framework is not meant to be “one-size-fits-all”, but rather a tool that can be easily adapted to local needs and used by policymakers, research organization and NGOs.

2.1. Step 1: Understanding and Identifying Urban FW Hotspots and Their Drivers

Identifying urban FW hotspots requires a deep understanding of the food system and the related supply chains with their set of activities including food production, processing, packaging, distribution, retailing and consumption, where the last three play the most prominent role. Urban FW hotspots refer to the stages and operations that result in the highest share of FW level. For instance, in LMIC, perishable products, such as fruits and vegetables, are the types of food where the highest waste occurs at the distribution level [2].
A product supply chain analysis can help to define the system’s boundaries (including geographical boundaries), the main product flows, and the actors involved in it, including their activities (e.g., sorting, grading, transportation, storage, etc.), which can result in different waste levels. Once the actors in the urban supply chain are defined, FW flows at each level and their drivers should be inferred. A recent example of a mapping approach is the EFFICIENT protocol [43]. Quantifying and measuring waste levels is one of the hardest challenges regarding FW. In the literature, a broad range of methodologies—each with its own advantages and disadvantages—has been developed [6,43,44,45,46,47]. A summary of the most commonly used methods is presented in Figure 2 [6,48].
In general, it is more cost-effective to use existing data—assuming they are of appropriate quality and coverage—than perform new measurements. When data are not available, as in most cases for LMIC cities, quantification measurements should be used, with a preference for direct measurement or waste compositional analysis due to the production of more accurate data. This is rarely performed due to the time-consuming nature and high associated costs as compared to secondary data collection from existing sources [49]. In addition, most of the primary measurements may not be feasible when resources are limited. A balance must be struck between reliability, quantification detail and resources available, which—especially in LMIC—may be limited. Questionnaires, interviews, surveys and focus groups may be some of the tools used in this context. While they are not sufficiently accurate for obtaining primary data at a country level [6] and they tend to underestimate FW amounts, especially when used for household quantification [50,51], they can help quantifying and estimating urban FW hotspots with a relatively low investment, as shown in three recent case studies in Quito, Nairobi and Antananarivo [52]. In these cases, semi-structured interviews, a census, online surveys and participatory workshops were used to collect both primary and secondary data on FLW from different urban food system actors. These methodologies can help in further investigating the drivers behind FW at specific levels of the supply chain and may be the only option when dealing with the informal sector.

2.2. Step 2: Designing FW Interventions

When designing a FW reduction/prevention intervention, five key elements should be considered (Figure 1): (i) the intervention level, (ii) the action type, (iii) the actors involved, (iv) the enablers and (v) its adaptability and adoptability.
As food systems and supply chains are interconnected, interventions on urban FW may involve or affect actors not directly related to urban areas. We suggest an adaptation of the High Level Panel of Experts (HPLE) classification [53] to the urban context by considering micro, meso and macro levels for urban contexts. The intervention type should be chosen based on the FW hierarchy, which helps prioritize interventions aimed to prevent, reduce and reuse undesirable food surplus resulting from oversupply of food and supply chain mismatches [54,55]. In this perspective, the main classes of FW prevention and recovery interventions that can be implemented in LMIC cities are: technological interventions, best practices, educational interventions and policy interventions.
  • Technological interventions are usually based on the introduction of physical tools or equipment at the desired level for reducing FLW, such as a more efficient cold chain, efficient packaging, storage, transport and distribution techniques. In LMIC, these interventions have often been implemented by development programs and by investors since most of the midstream value chain operations are dominated by small, informal businesses with low investment capacity and no access to financing. High initial costs, high use of energy and a lack of rewarding markets often led to the abandonment of the technology [19] and the creation of the so-called “white elephants”. Therefore, it is important to adjust the technology level to the application scenario by considering available knowledge, resources and profitability [42]. In LMIC cities, rather than choosing high-level technology investments, it is better to go for more feasible low- or mid-technology solutions, such as a more efficient way of transporting and packing products [56,57] or platforms for improving the communication between stakeholders to have a better match between offer and demand.
  • Using best practices from organizations and alliances such as the MUFPP, C40 and ICLEI is cheaper, replicable and can help in improving product management in the urban supply chain, including product transportation, processing, storage and proper hygienic conditions in urban markets. The development of product-specific SOPs can reduce FW by boosting quality awareness, standardization, market alignment and options for extension and gradual technology uptake. Some examples of best practices for the retail and food service sectors include correct portion sizing, improved food labeling and redistribution of the surplus/unsold food to groups affected by food poverty (i.e., charities). For households, better planning when shopping and preparing food and best practices for extending the shelf life of perishable foods can all contribute to preventing FW.
  • Education interventions can help to disseminate and improve the adoption of best practices. In this context, education interventions do not refer only to awareness-raising campaigns but also to training programs for improving product management and conservation.
  • Policy interventions can have multiple effects, working as enablers to facilitate or promote all the other interventions, but urban governance can impact different levels of the urban food system. Policy interventions for urban FW reduction have been classified as: information-based, market-based, regulatory, voluntary agreements, food sharing and social protection [24].
In choosing the best intervention type, it is crucial to identify which of the preliminarily mapped actors need to be involved. Some of these actors are: retailers (food markets, supermarkets, local and street vendors), food services (restaurants, hotels, canteens), food processors (from large multinational companies to small and medium enterprises and street vendors), workers involved in product transportation (truck drivers and intermediaries), trade associations, education institutions (schools, municipalities/governmental educational programs, advisors, consultants and extension services), waste management companies, governance and policy-makers, international donors with food programs, NGOs involved in food security and food redistribution, researchers and community and religious groups. One of the most important differences between HIC and LMIC urban food systems is the fundamental role played by the informal sector. The informal sector includes all businesses, workers and activities operating outside the legal and regulatory systems. Evidence on fruits and vegetables in LMIC showed that 90% or more of all domestically produced volumes are traded through informal midstream supply chain operations [58], and the informal economy accounts for 25 to 40% of GDP in LMIC [42]. In LMIC cities most of the retail sector can be classified as being informal, such as large market places, informal shops, kiosks and street food vendors, even if there has been a growth of formal retail outlets like supermarkets [59]. Informal businesses tend not to respond to conventional policies, (fiscal) incentives and regulation like formal businesses would, but they can contribute to reducing urban FW if properly involved and if their informality is considered. Rather than pushing for the sector’s formalization, local government should support informal businesses and their organizations by acknowledging their importance, contribution and needs.
Some enablers can also support the creation and implementation of urban FW interventions. Any form of funding, credit, insurance and other financial products, together with providing access to a wider range of financial service providers, can help interventions be implemented since smallholders and informal business actors often do not have the resources for economic investments. Policy can also act as an enabler since policymakers can improve infrastructure and communications and provide financial resources through subsidies or tax measures (policy interventions). In the case of infrastructure, policymakers can facilitate access to services such as water and electricity, as well as improve roads and urban viability, since efficient transportation is essential for distribution and avoiding FW due to long transport times, exposure to heat and physical damage. Finally, a business case is needed for commercial value chain actors to increase adoption rates.
A successful waste-reducing intervention should consider some criteria [60], such as (i) the existence and alignment of the proposed intervention with a national FLW strategy [61]; (ii) the affordability for smallholders and informal business actors with relatively low (or nonexistent) investment capacity and (iii) the availability of material and/or services. (iv) Interventions’ acceptability by the wider society is also crucial and requires compatibility with the existing culture, with its social norms, values and hierarchies. To maximize intervention adoption, the actors involved should be made aware of the intervention benefits through direct education or other advertising media. (v) Finally, interventions should be technically feasible, scalable and adaptable to different environments and infrastructures. The combination of these factors is key to ensuring intervention adoption without significant investments and being able to produce an impact in terms of profit and FW reduction.

2.3. Step 3: Implementing and Monitoring the Efficiency of FW Interventions
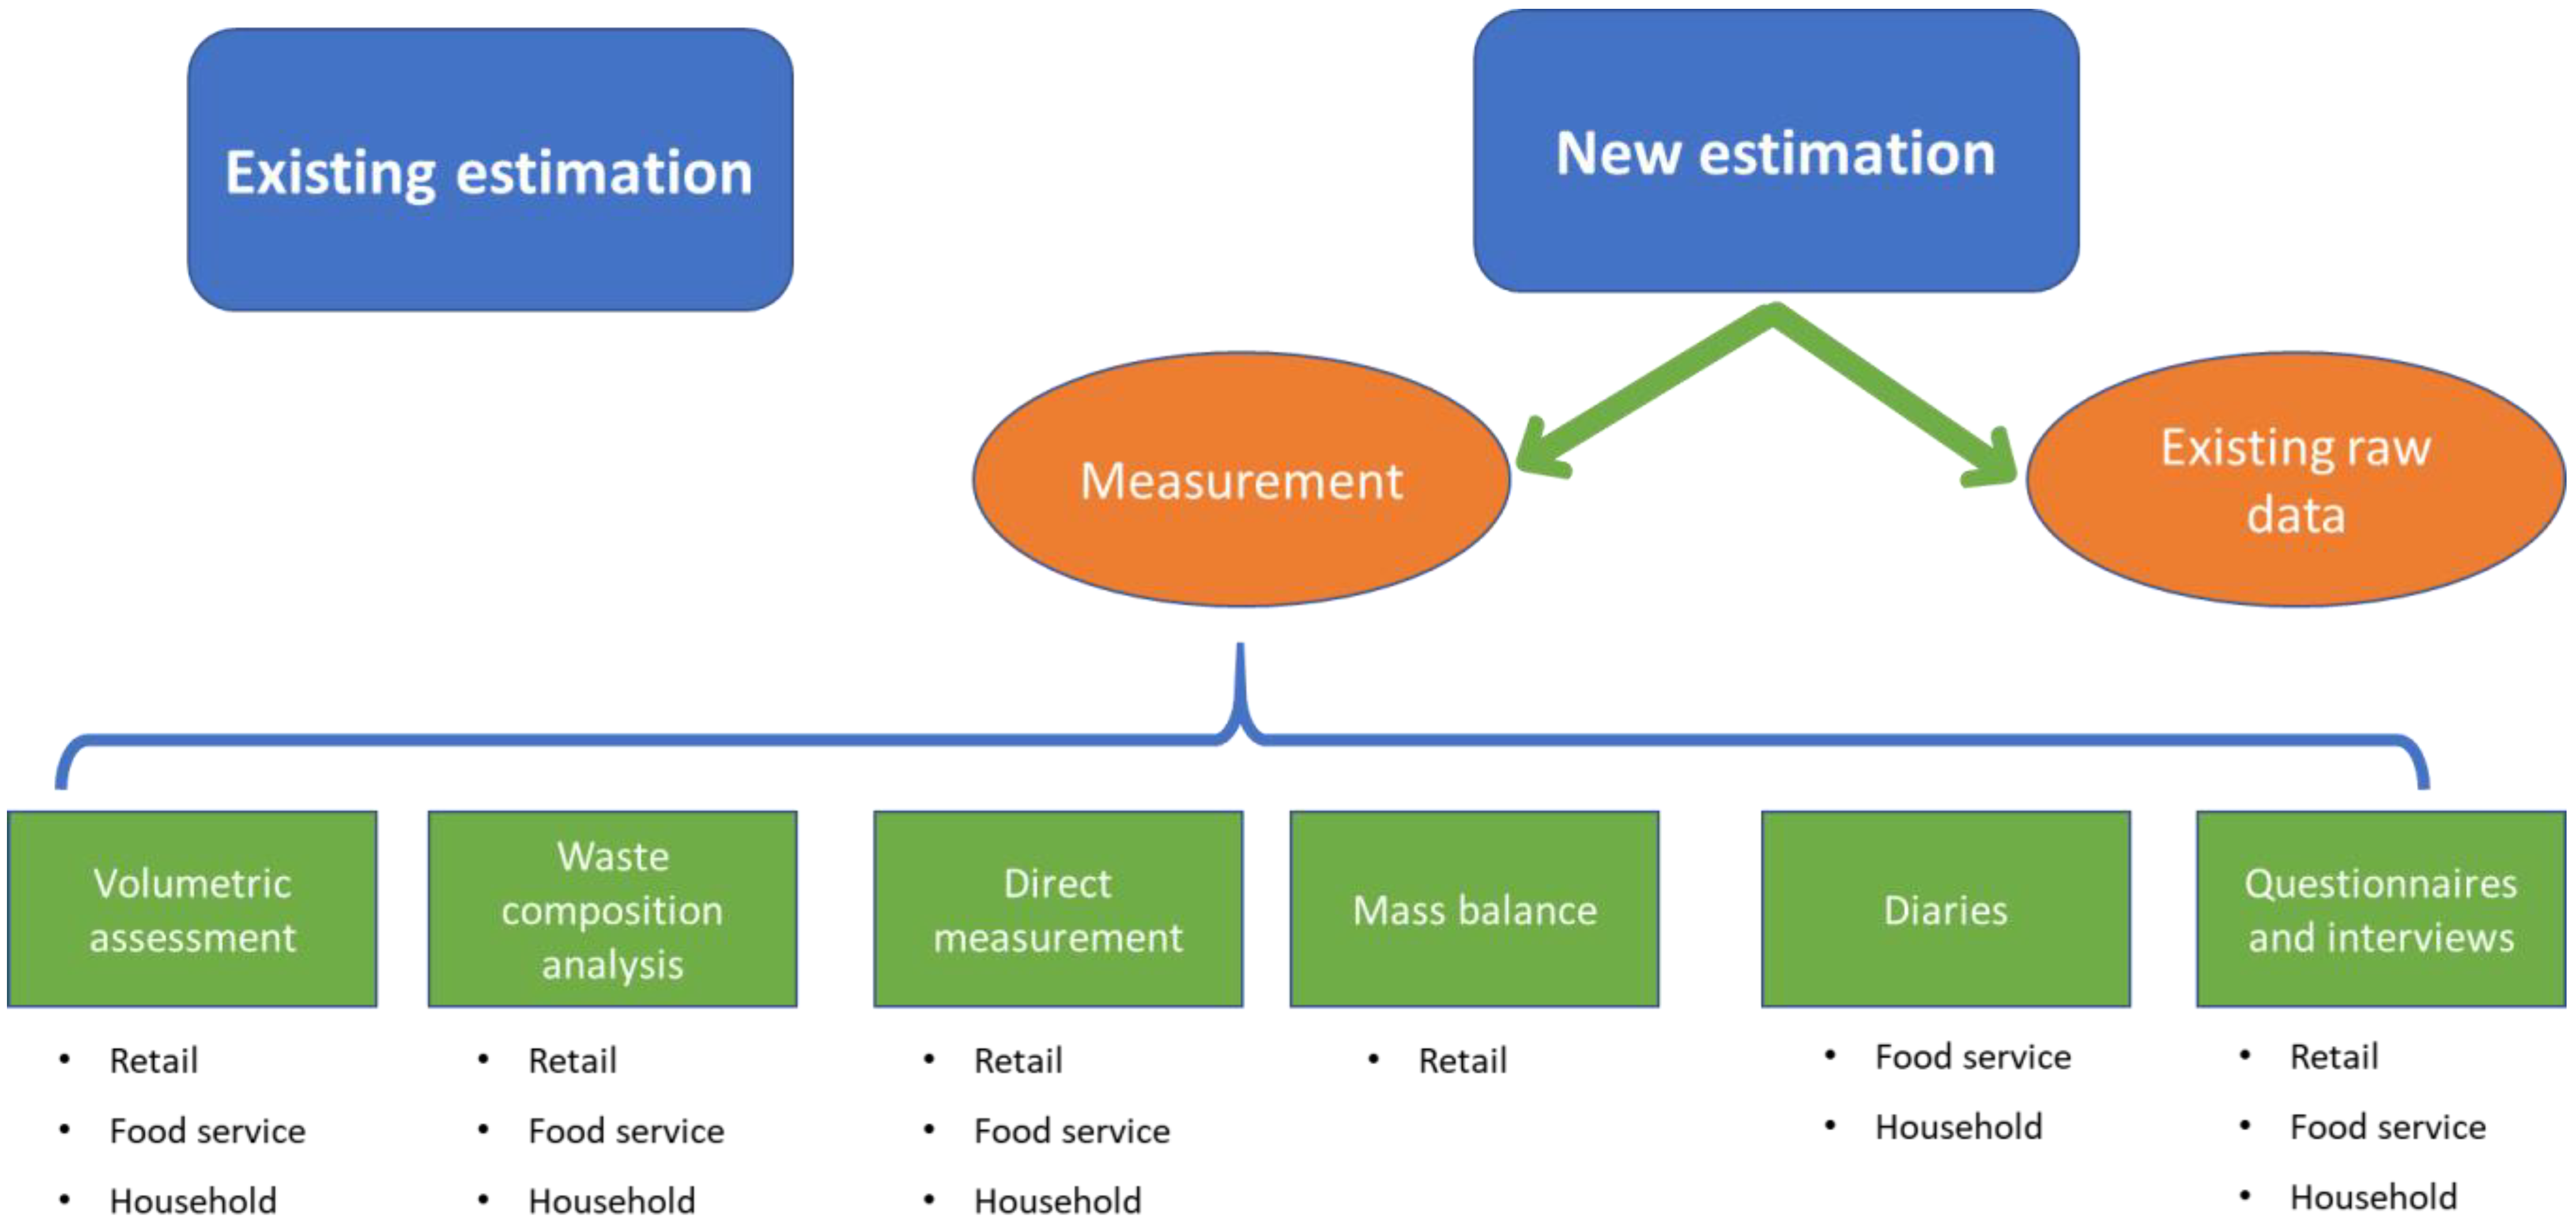
In principle, the respect of the above-mentioned criteria (i.e., affordability, availability, acceptability and adaptability) can ensure an effective intervention implementation. However, when deploying the intervention, it is essential to collect data to monitor interventions performance and progress. When designing the intervention protocols and forms for data collection, they should be included and distributed among the involved stakeholders. When looking into the literature, there is still a lack of studies and of appropriate methods to assess FW interventions’ efficiency. Recently, an evaluation framework has been proposed, together with a tool based on life cycle thinking, to enable the quantification of net economic benefits and environmental savings of FW prevention interventions [62]. The most critical part of the tool’s application in an LMIC context may be the data availability. Among the different data required by the calculator are the cost of implementing the action, the resources needed to implement the action and the waste treatment that would have been used if the food had been wasted. Limitations in logistics and resources may prevent an accurate estimation of these data. Moreover, if the intervention involves the informal sector, data collection would be even harder to achieve. Alternatively, the MUFPP monitoring framework [23] provides a practical resource pack for any city interested in developing and assessing its urban food systems performance [52]. The handbook contains a series of pilot projects conducted in three cities in 2019 in Madagascar (Antananarivo), Kenya (Nairobi) and Ecuador (Quito), together with steps, tips and resources to set up and use the monitoring framework. Replicating the MUFFP approach can be useful not only to design, implement and evaluate FW interventions but also as a key element for setting up urban food policies [24]. Structurally integrated urban food policies can allow for better cooperation between sectors and actors on anti-food waste initiatives and MSWM.
Finally, when implementing and monitoring, an intervention it is important to understand the destination of the saved food by keeping in mind the FW hierarchy. Interventions that aim at reducing or redistributing food surplus and/or unsold food should be preferred to other solutions that rely on recycling and recovery. When these recovery options fail, food is disposed of and/or landfilled, which can add pressure on urban waste systems.

3. Data Collection

In all the case studies, only the edible fraction of FW is considered.

3.1. Kibera Case Study

The original study was conducted inside the project “Feeding cities and migration settlements” and has been described in great detail in this special issue [63]. For our work, the scope was to (i) investigate if slum inhabitants experience any FW, (ii) what are the socio-economic drivers behind it, and (iii) how MSW is managed.
The target population in the study comprised households in 12 villages in Kibera. A two-stage cluster sample design was adopted for the survey, involving the selection of clusters, households, and eligible individuals (see [28,64] for a full description of the survey and data collection process). The study was conducted in two different rounds: the first one was carried out in August 2020, and the second one in August 2021. A total of 774 respondents were interviewed: 385 during the first wave of interviews and 389 during the second wave. In total, 77% of the respondents were female (n = 598) and the average age was 32 ± 9 years old. Nearly all respondents indicate they are the ones who make the decisions concerning food and shopping in the household. A structured questionnaire with multiple-choice questions and open- and closed-ended questions (for a total of more than 400 items) was used. In the second round of interviews, an additional 25 questions were added regarding food storage, FW and food management, partially inspired by a FW frequency questionnaire [64]. The aspects that will be analyzed here are the ones related to the socio-economic characteristics of the household head and household, food security and livelihood, food management, shopping habits and FW, including its disposal. In terms of data analysis, the data were processed to omit incomplete or (likely) erroneous responses. Subsequently, descriptive statistics and percentages were obtained for data related to demographics, food shopping and planning habits, food consumption, leftovers and their storage, and FW and its disposal. The specific survey items used to obtain information on FW, which can be found in the supplementary materials (Table S1), covered all major characteristics and drivers of FW. The average household income was calculated by adding the income from various sources (formal/informal work, self-employment, remittances, renting income, other possible incomes).

3.2. Description of the Dhaka Studies

The three Dhaka studies used a similar methodology to investigate and identify leverage points for reducing FLW in the supply chains of onions, mangoes and beef. For further details, the reader is invited to refer to the original reports [65,66,67].
Workshops and extensive interviews (>300 participants) were conducted with the actors in the value chains, including producers, intermediaries, truck drivers, wholesalers, retailers, mobile vendors and institutional users (all from different production districts and four cities inside the Dhaka division (Dhaka North, Dhaka South, Narayanganj and Gazipur)). Since the focus of this work is on FW, only the relevant (downstream) parts of the supply chain (retailers, mobile vendors, institutional users, and slaughterhouses) will be considered. Table 1 summarizes the participants in the study.

4. Results

4.1. Investigating Food Waste in Kibera

4.1.1. Demographics

The average household size was 5 ± 2 with large differences per household (the largest household was reported to be 15 people living together) with 2.4 children on average in the house and a maximum of eight children per household.
On average, only 1.5 household members reported being income-generating, with a maximum of six people. Most of the respondents declared to have informal employment (38%) or to be self-employed (35%), while 11% had formal employment in an organization, a firm or the public sector, and 4% had casual labor. The average daily income was 450 ± 362 Kenyan shillings. A total of 56% of the participants reported that the household income was not enough to cover the living costs (food, rent, electricity and water), 30% said that it was just enough to cover living costs, and 9% said that also managed to send remittances to relatives in rural areas. This data highlights the precarious living conditions in the slum, where extreme poverty—people living with less than USD 1 per day—is highly prevalent.

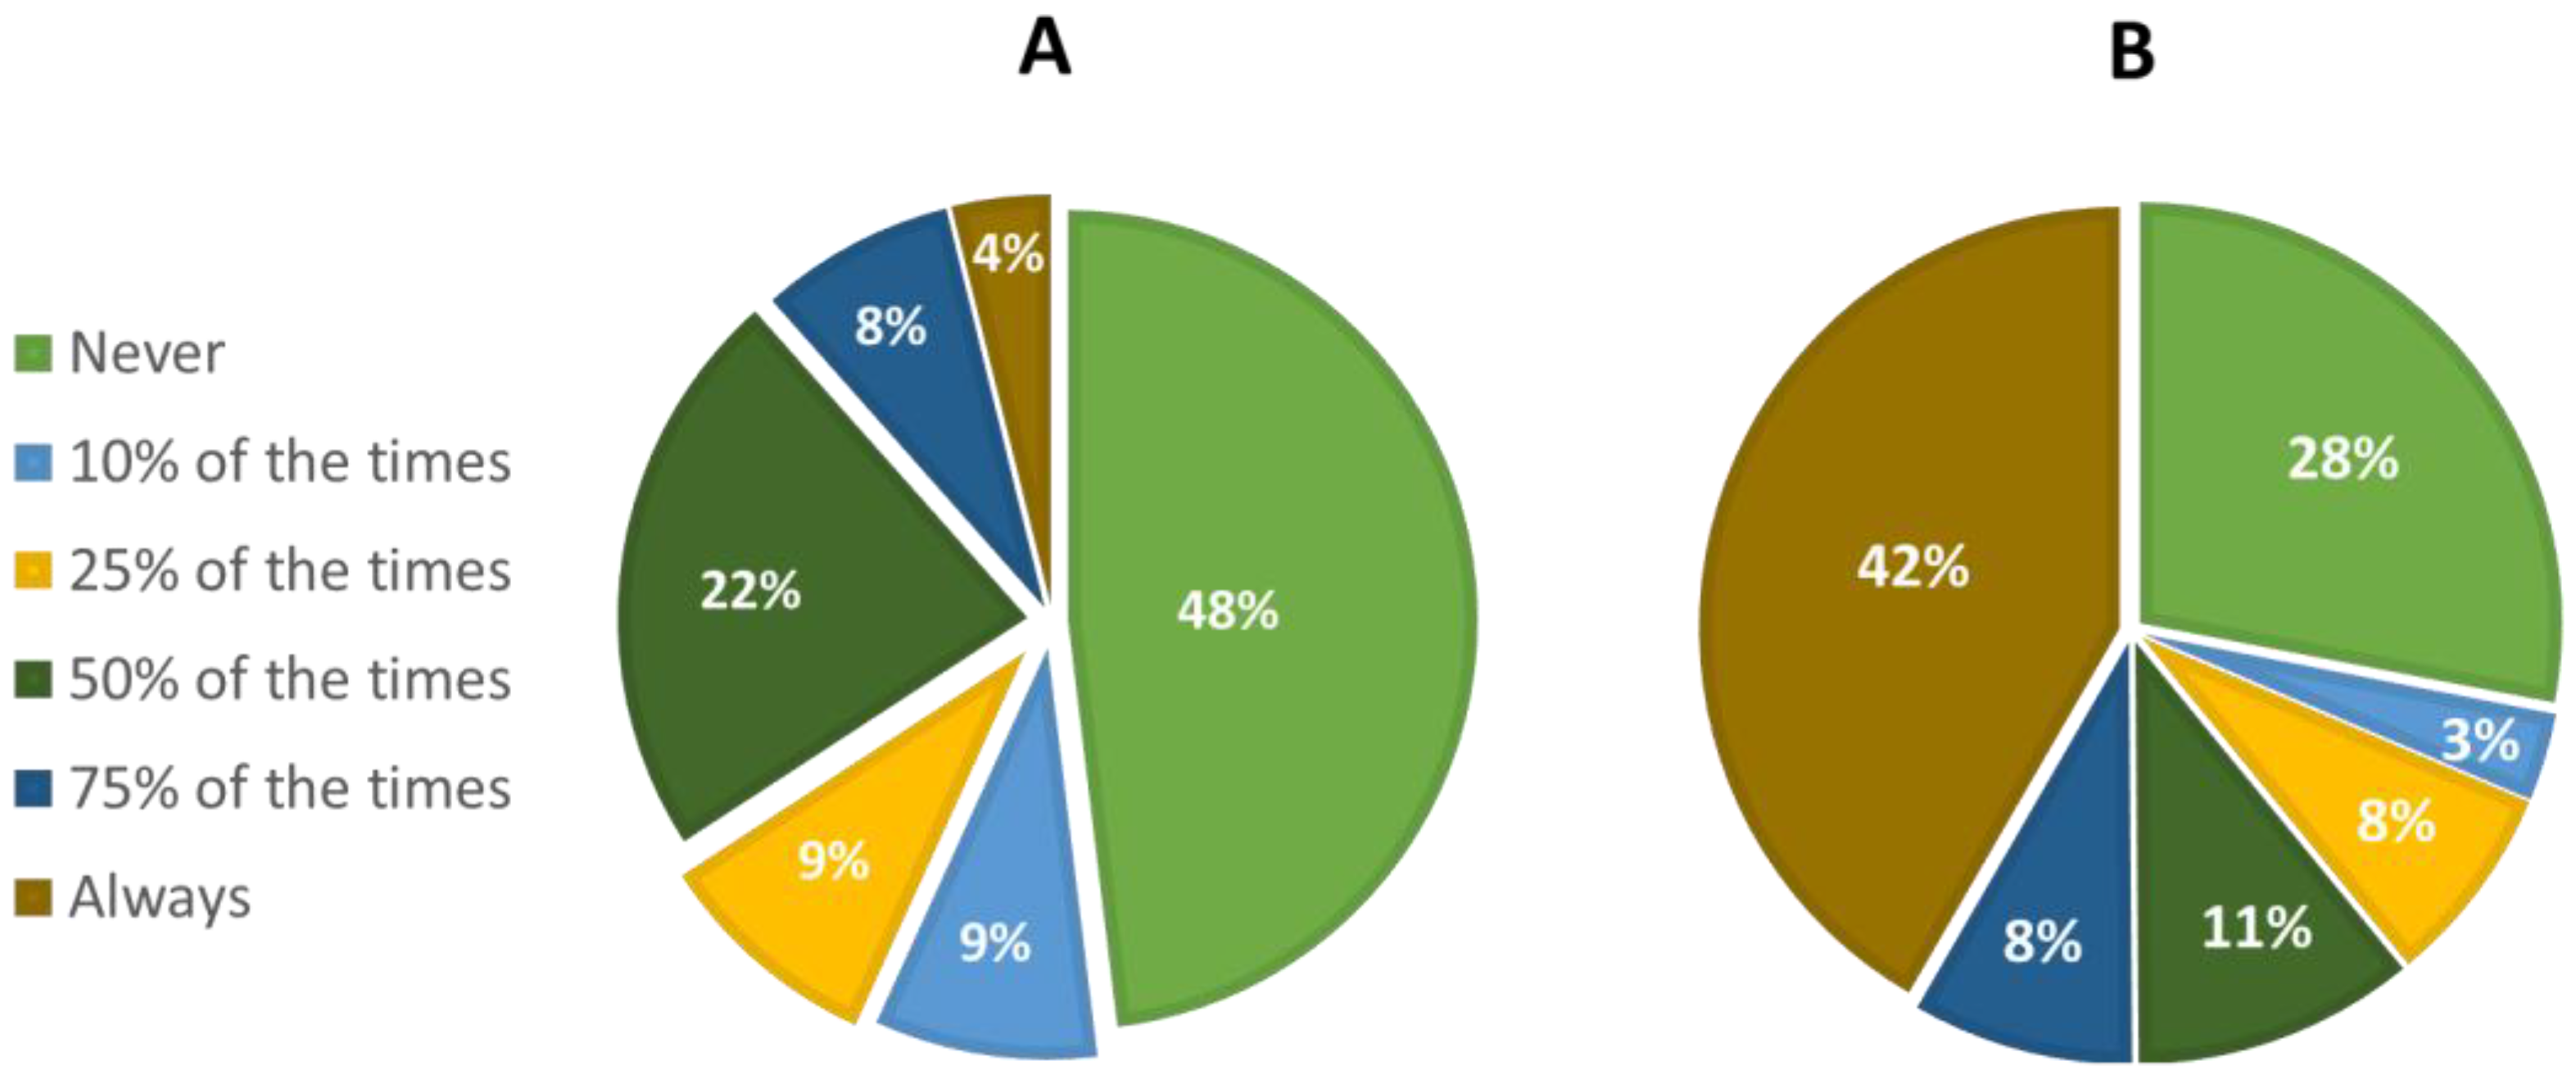
4.1.2. Food Shopping and Planning

The questionnaire collected information on the shopping habits of the respondents. Most participants reported purchasing their food from small shops (90%), street vendors (88%) and markets (56%). Regarding the frequency of food shopping, 66% of the participants reported going for food purchase two times per day, 8% once every three days, 7% once per day, 6% once every two days and only 4% once per week. The habit (or necessity) to obtain food everyday may be an indication of food insecurity and may negatively influence shopping planning. Indeed, almost 50% of respondents indicated that they never plan what to buy when going food shopping, while only 4% indicated that they always plan what to buy (Figure 3A). Similarly, the survey highlighted that participants do not usually plan meals in advance, with 57% of the participants reporting that they never plan their meals at home and only 5% of the participants often (75% of the time) plan their meals. However, the survey did find that Kibera’s inhabitants often check their supplies before going to purchase food (Figure 3B).
Respondents were asked to self-evaluate their household skills in terms of planning for meals and shopping, cooking, storing food and buying the right food in the right amounts on a 7-point scale (from very poor to exceptional) (Figure S1). Overall, participants had a positive impression of their skills: the majority (≈30%) rated all their skills in planning, buying, cooking and storing food as good. Margins of improvements were observed for the skills of planning meals and shopping since 14% and 13% of the participants, respectively, evaluated their skills in these domains as poor. The participants also had a positive perception of their skills in storing the food, since more than 87% of them reported that their skills ranged from good to exceptional.

4.1.3. Food Meals, Leftovers and Storage

Approximately 50% of the participants (n = 379) reported to have three meals per day (breakfast, lunch and supper), while the other half (47%, n = 365) reported to have two meals per day. Only 4% of the participants had one meal per day (n = 30). Regarding food leftovers in the household, 56% of participants reported having leftovers one time per day, 18% two times per day and 14% one time every two days. A total of 10% indicated that they had leftovers one time every week. These leftovers were mostly consumed in the next few meals. When looking into the different strategies that people in Kibera adopted to store food leftovers, most of the participants (72%, n = 558) kept them in food containers like sufuria (cooking pot), on the ground or hanging from a rope to keep rats away. A total of 31% (n = 239) left the food in open places (e.g., on the table), while 17% (n = 135) had a dedicated, organized space like a cupboard or jars where to store the leftovers. Only 7% (n = 53) stored their food in the refrigerator, and five participants reported to use salting as a method to store the leftovers.

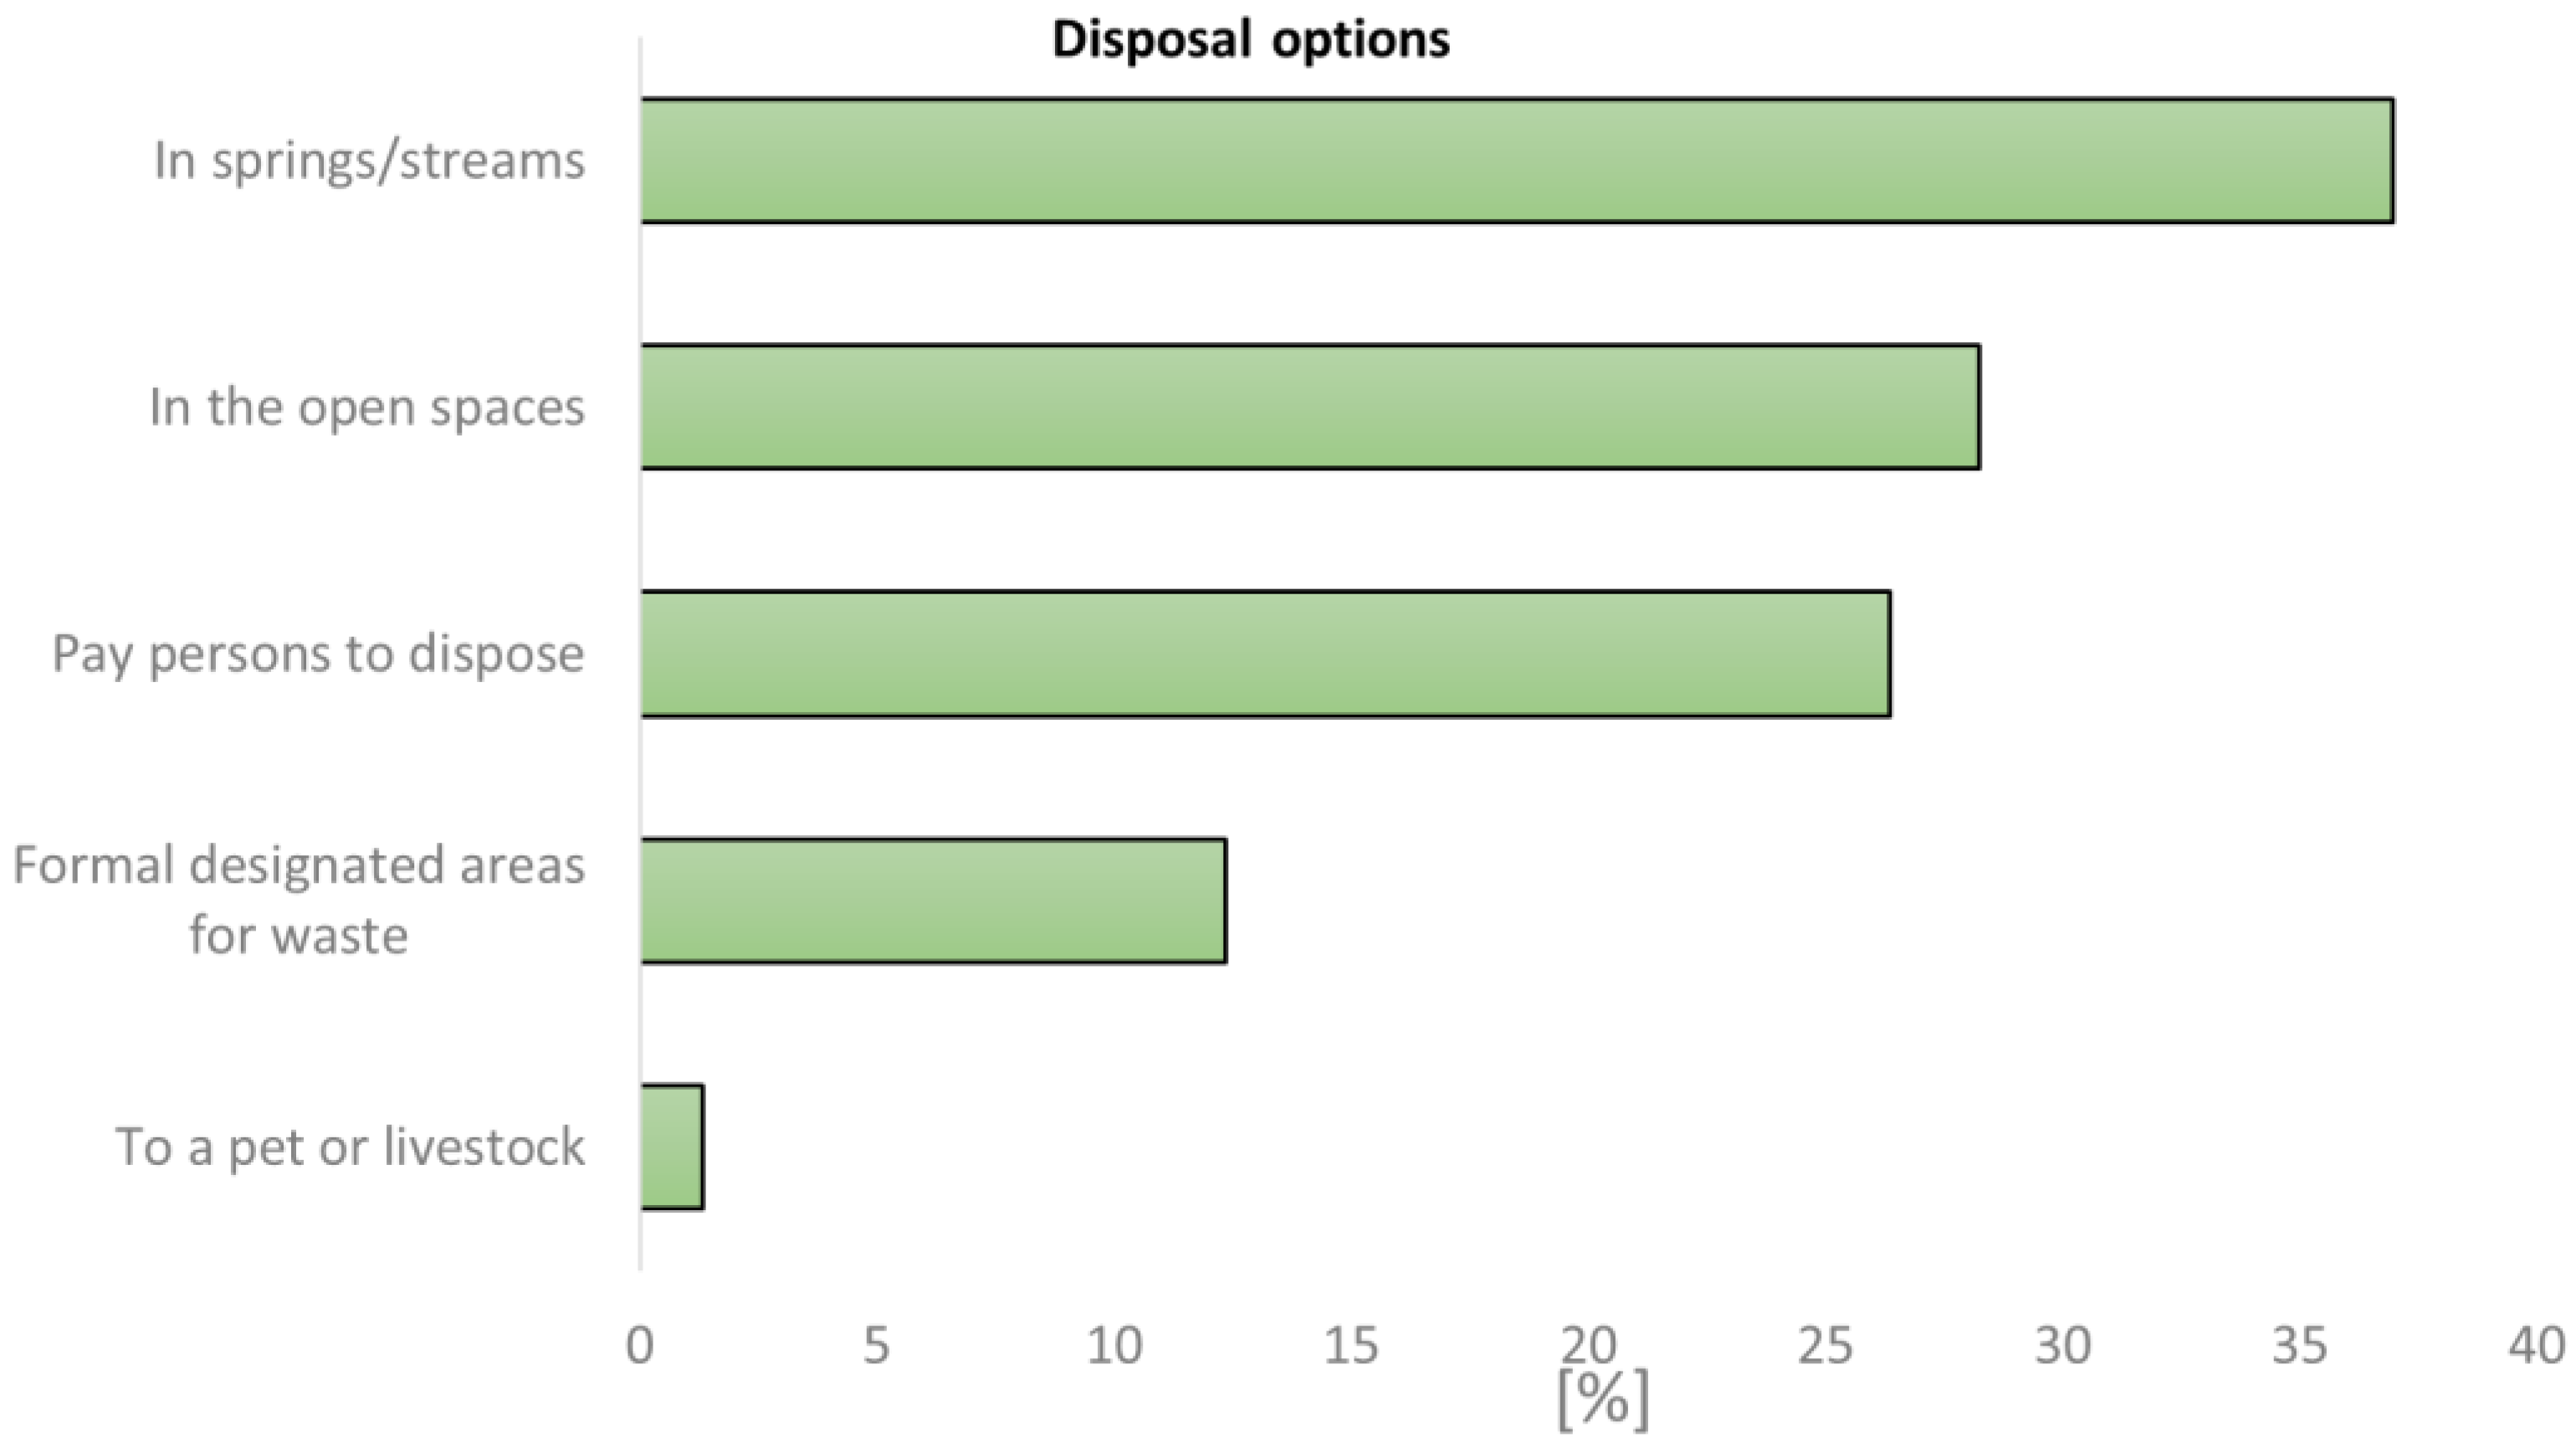
4.1.4. Food Waste and Waste Disposal

Figure 4 summarizes the main reasons behind the FW generation. While 28% of the participants (n = 207) did not report any FW at the household level, the remaining ones (72%, n = 480) reported that this occurred mainly due to food going stale because of poor storage (45%, n = 333) and to spoilage/contamination (12%, n = 91). Contamination by dirty water does not seem to be a relevant reason for FW, and only in a few cases was food noticed to be bad or expired just after purchase (7%, n = 54). According to many participants, high weather temperatures also played a role in spoiling food. In terms of food categories, participants indicated that the products that were wasted most were maize-based products (including flour, whole grain, green maize, ugali, githeri and uji) and perishable products like vegetables, fruits and milk-based products.
Participants were asked about both MSW disposal and, more specifically, FW disposal. Since similar answers were recorded, only data about MSW are shown. The main waste disposal places in Kibera resulted to be the springs/streams (37%, n = 275) and/or in open spaces around Kibera (28%, n = 210) while 26% reported to pay a person to dispose of their MSW and/or dispose of their waste in formal designated areas (13%, n = 92) (Figure 5). Only 1% of the participants used their MSW for feeding livestock (mainly chickens). Other options that were mentioned were burning the non-decomposing waste, such as plastic bags, while the kitchen waste was also used for composting.

4.2. Dhaka FW: Case Studies on Mango, Beef and Onion Supply Chains

4.2.1. Onion Supply Chain

Onions are a popular product in Bangladesh, with a total production in 2017–2018 of 1738 million tons and a production that keeps increasing [65]. Table 2 and Figure 6 show the main results regarding the amounts of handled onions, what percentages are left unsold, and the destinations of these unsold onions at retailers, mobile vendors and institutional users.
Most unsold onions were at the level of mobile vendors (4.6%), followed by retailers (4.1%). Two-thirds of institutional users reported to never having losses, whereas most retailers and mobile vendors reported losses. Respondents who identified reasons for waste absence in their business reported to sell older onions for a lower price or to mix them with good onions. Most unsold onions were reported to end up in landfills, with smaller quantities used for domestic consumption or donated. Grading and sorting are not common practices, with only 27% of mobile vendors reporting to do so, nor are the use of packaging materials (5% of retailers, 3% of mobile vendors) or storage (22% of retailers, 17% of mobile vendors and 20% of institutional users). The storage used is mainly a dry room with a fan (not temperature-controlled), predominantly for short periods of time (less than a week), and reported reasons for using storage included preventing product loss, waiting for market demand, securing a good price or reducing time and labor costs.
Both retailers and mobile vendors had losses due to sorting and grading. These losses may be caused by suboptimal packaging, transportation, and bad quality when purchasing. The latter waste occurs at the retailer and mobile vendor but is already generated earlier in the supply chain (e.g., unproper curing or storage conditions). Interestingly, part of the unsold onions is still used for human consumption (domestic consumption and charity), indicating that the real amount of FW is lower than the amount of onions discarded by these actors. Still, landfills remain the main destination for unsold onions.
Overall, among the main causes behind the FW of onions occurring at retailers, mobile vendors and institutional users are: (i) damages caused by transportation; (ii) sorting; (iii) lack of proper storage and cold chain infrastructures and (iv) delays in marketing the onions. Most of the unsold onions were disposed of in landfills but all the stakeholders reported that some onions were saved for their own consumption and by donations to charity.

4.2.2. Mango Supply Chain

Bangladesh is the 10th largest mango producer worldwide, with 2.61% of the world’s production in 2019 [67]. In terms of production volume, mango is the most important fruit in Bangladesh, representing over 23% of the total fruit production [68].
As for the onions, the mangoes investigation analyzed FW for retailers, mobile vendors and institutional users. All the actors were found to perform the handling, packaging and storage of the products to increase their value. Only retailers and mobile vendors performed sorting and grading, and mobile vendors also transported the products around Dhaka. Table 3 and Figure 7 show the main results regarding the amounts of mangoes that are being handled, what percentages are left unsold, and the destinations of unsold mangoes.
As for the onions, most unsold mangoes are at the end of the supply chain, namely at the mobile vendors (5.7%) and institutional users (5.1%). Retailers mostly lack the ability to sell all mangoes: 85% indicate that they will remain with unsold mangoes. Most unsold mangoes end up in landfills, with smaller quantities being destined for charity, own consumption, animal feed, or fertilizer.
Retailers purchase from different sources, including wholesalers, intermediaries or directly from producers. Of these purchased products, 3.7% are not sold, and respondents most often indicate landfill as the main destination for unsold products. Only a minority of actors (37% of retailers, 12% of mobile vendors) grade and sort mangoes, most by their own standards based on size, color, shape and/or smell—a process during which up to 5–10% is discarded. The great majority of institutional users use some form of processing and sell, for example, mango juice, pickles, bars or cut mango. Small numbers of actors (27% of retailers, 20% of mobile vendors, and 32% of institutional users) used storage, commonly a dry room with ventilation. In the case of retailers and mobile vendors, the mangoes are commonly stored in plastic crates for less than one week, but institutional users reported using storage for processed products for periods ranging up to six months. Reasons to use storage included preventing product loss, waiting for market demand to secure a good price, ripening the product and having availability for a longer period.
As for the onions, a quality decrease along the supply chain is a main reason for FW in Dhaka. Within Dhaka, respondents mentioned lack of consumers (i.e., unpredictability of demand) as a major problem and a FW cause. The study revealed that low value is added in the mango supply chain due to the low price for mangoes, while actors face high costs for storage, packaging material, transport and labor. Retailers and mobile vendors also indicated a lack of cash as one of their main problems. As for the onions, a sizable part of the unsold mangoes is still consumed at home or given away, reducing the amount of FW.
To summarize, most unsold mangoes were found at the end of the supply chain at retailers, mobile vendors (5.7%) and institutional users. Similar findings were reported in previous research [69]. During the handling process, losses occurred mainly due to peeling and the removal of spoiled parts, while during storage, losses were reported due to an improper storage facility or rot development in bad-quality mangoes. These losses can be due to sub-optimal packaging, transportation that can damage the fruits, exposure to high temperatures and, in general, poor quality of the purchased mangoes. Losses due to bad quality are caused by a lack of proper handling, sorting and storage earlier in the supply chain, including harvesting activities.

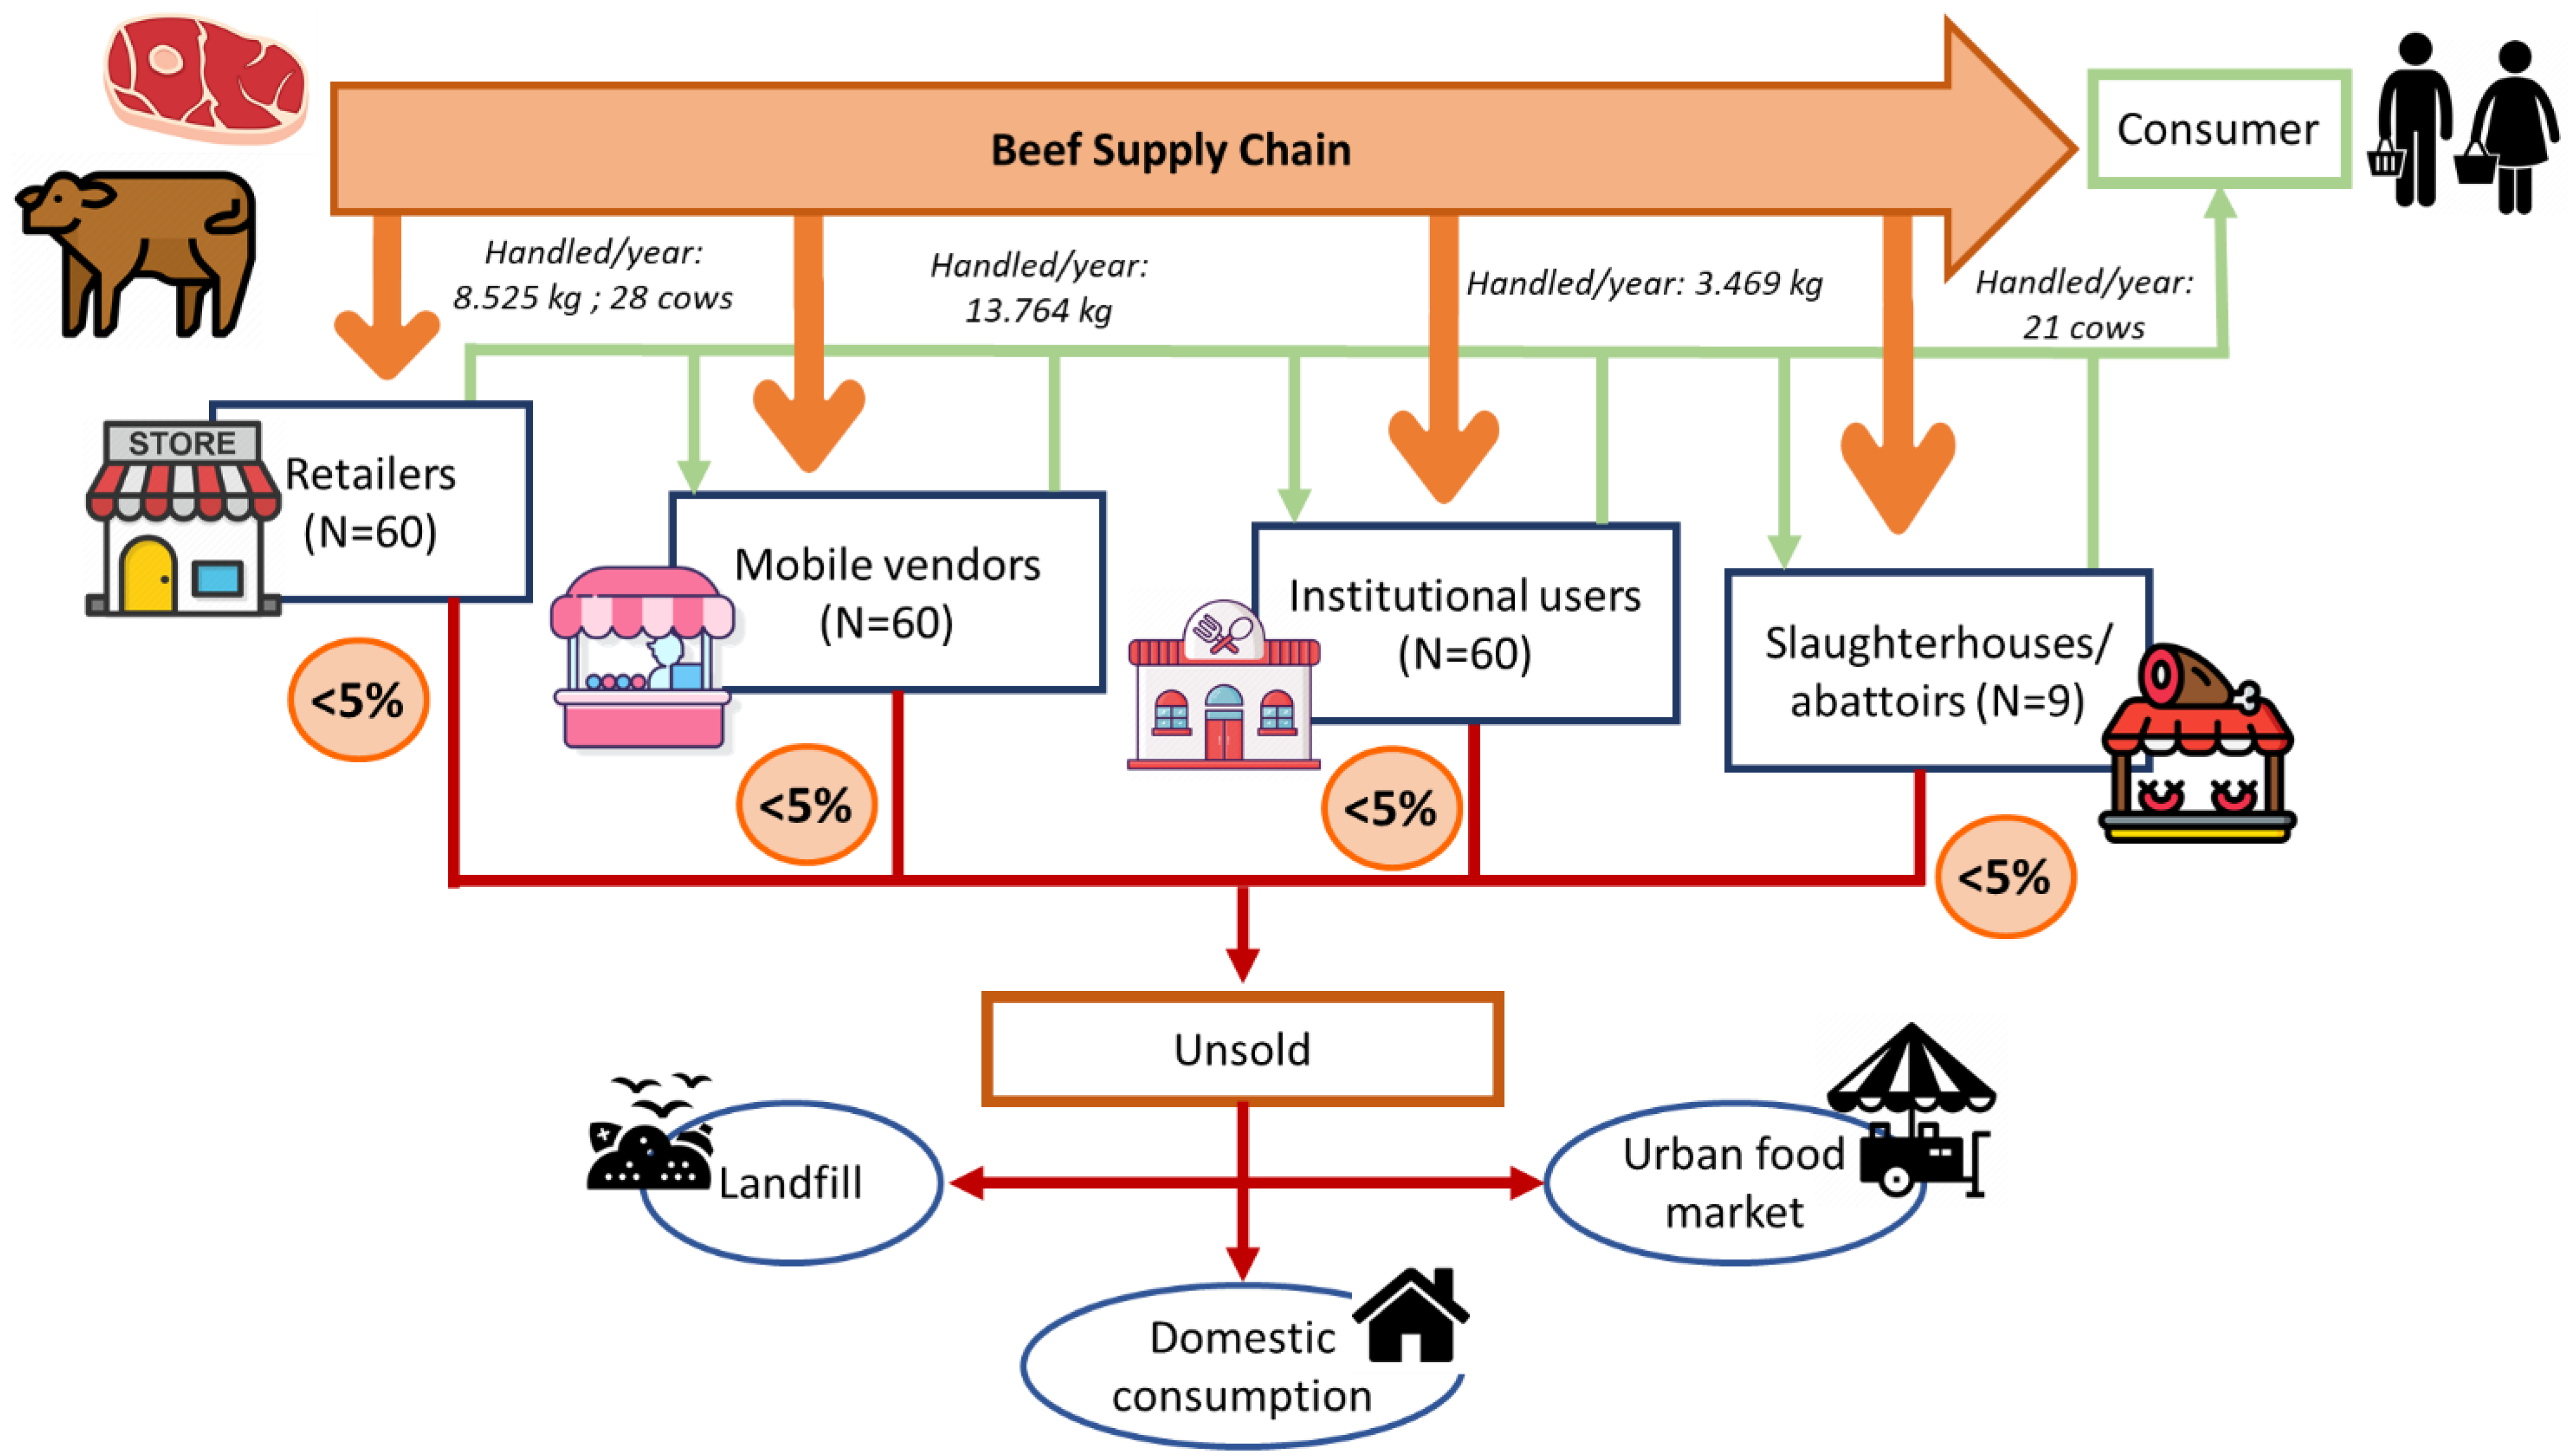
4.2.3. Beef Supply Chain

A total of 60% of Bangladeshi consumption of animal products consists of fish [70]. However, livestock products have become increasingly important in Bangladeshi diets (up to 4.27 kg of meat per capita per year in 2017 [71]), due to income growth and urbanization. Data about beef consumption in the country does not provide a clear picture, with ambiguity as to whether consumption has decreased [72] or increased [73] over the past decade. While beef is not eaten as often as other animal products, most of the population (48%) eats beef at least once a week [74].
The study analyzed four beef food system actors: retailers, mobile vendors, institutional users (which include restaurants and hotels) and abattoirs. Inside the supply chain, every actor increases the product’s value by performing different activities, including handling and storage. An additional level of complexity is introduced since both live cattle and meat are traded, often by the same actors. Table 4 and Figure 8 show the main results regarding the amounts of beef and live cattle that are being handled, what percentages are left unsold, and the destinations of the unsold meat for each actor.
A total of 63% of retailers buy live animals, sometimes also slaughtering them themselves, with only 30% of the cattle being slaughtered in official slaughter facilities. Even in these facilities, the lack of food safety standards prevents the preparation of uncontaminated, safe meat. The other slaughtering occurs in unofficial and unregulated sites (sometimes even roadside), without veterinarian supervision and the proper tools, which may result in additional waste.
Mobile vendors and institutional users purchase their beef from butchers, slaughterhouses, wholesalers as well as retailers. Not all parts of the animal are used for human consumption, as the majority of participants indicate using somewhere between 60–80% of the animals, with the by-products being discarded and most often ending up in landfills. Beef product waste was indicated by all actors to be under 10%, attributed to the poor work accuracy of butchers and/or bad quality. The beef that could not be sold is still predominantly used for human consumption, either going to other urban markets, the food or food service industry, for personal consumption or being donated to the poor. A total of 40% of retailers, 37% of mobile vendors, and 35% of institutional users store the beef in dry, ventilated, temperature-controlled storage, but mobile vendors may use more rudimentary methods such as covering the meat with wet cloth. Overall, the beef is purchased in small quantities and sold quickly to prevent total losses. Nearly all mobile vendors and institutional users indicate processing the meat further to some extent, ranging from cutting to seasoning and/or cooking.
To summarize, only relatively low waste (<5%) was reported by retailers, mobile vendors, institutional users and abattoirs in the beef supply chain. Among the main reasons for unsold products, institutional users and mobile vendors reported a lack of customers, while retailers stated bad quality meat. Still, when the product or selected parts were dismissed from the intended market, alternative uses were found to sell or consume the product. The research highlighted that food safety is a critical concern during slaughtering, which is often carried out without any supervision or inspection.

5. Discussion

The aim of this study was to define the characteristics and drivers of urban FW in LMIC. While the three-step food system approach presents the key elements to consider when designing and implementing an urban FW reduction/prevention intervention in a LMIC context (Section 2), the data collected in Dhaka and Kibera (Section 4) highlights some trends in LMIC urban FW. The studies investigated the phenomenon in a complementary way: while the Kibera study investigated households’ food habits, food environment and FW, the research in Dhaka covered urban supply chains, including retailers, mobile vendors and institutional users and the operations performed on the products by also collecting quantitative data about food flows. In terms of FW data collection, both studies were based on questionnaires and interviews, which led to mainly qualitative, self-reported data and may have led to volume underestimation. All the studies confirmed that FW is relevant in LMIC cities, with its main drivers being low food quality along the supply chain, a lack of sorting and grading procedures, inadequate infrastructure for storage and processing and, in the case of households, poor leftover storage. Moreover, the data underlines the importance of the informal sector for feeding the cities and the problem of FW and its management.
More precisely, the Dhaka data showed that in the urban food supply chains of mango and onions, 1–6% of the input volumes were reported as unsold for each of the supply chain actors. While some unsold produce may be donated to charity and used for domestic consumption, most of it ends up in landfills, which is the least preferred option in the FW hierarchy. Mobile vendors were reported to have the largest portion of unsold products along the whole supply chain (5.7% and 4.6% of the total input volume of mangoes and onions, respectively). Most of them in Dhaka are part of the informal sector, which provides food at relatively low prices and offers employment for the urban poor. Official numbers are unknown, as the non-licensed street food vendors do not pay taxes and registration is lacking, but at the beginning of the century, it was estimated that around 200,000 street food vendors were active in Dhaka city [75]. Informal markets also play an important role in the Dhaka food system since most of Dhaka’s food enters the city through these markets. Even if they are much more vulnerable than market places and supermarkets due to their lack of recognition from authorities, informal actors have an important role in urban food security by providing poor households with an accessible, affordable, and reliable source of food [25]. Municipalities should not ignore the informal sector but rather accept its existence since small, informal businesses can help reduce urban FW, but they need to be supported by incentives and policy measures without the explicit goal of their formalization [42]. Urban governance can initiate social protection policy interventions by better coordinating with the informal sector and providing services like water, electricity, and solid waste disposal. This may lead to the development of voluntary agreements for the re-using and sharing of unsold food by enhancing the connection with charity organizations or food banks. Municipalities can play a role as enablers at the policy level by facilitating processes for allocating trading space through the design of streets with suitable spaces for street food vendors and, when needed, they should provide a simplified, temporary legal status to these informal actors.
One of the main drivers of waste and unsold product highlighted by the Dhaka studies was the quality decay along the supply chain and the lack of adequate storage infrastructure. While in HIC most of the solutions that have been developed have focused on sophisticated postharvest storage conditions and advanced packaging, in LMIC, these may not be adequate due to logistics and resource limitations, the inability to access high and medium-level technologies and the different maturity levels of the supply chains. Interventions should be a mix of best practices, technological and educational interventions for improving both pre- and post-harvest management to maximize quality preservation along the whole supply chain. For example, technical support on production and improving post-harvest handling and storage through SOPs can help reduce losses along the chain [76]. The same can be achieved by a wider adoption of procedures for sorting and grading perishable products at retail and vendor levels (for both formal and informal business actors), which can then implement a first-expired-first-out selling strategy. For products like onions and potatoes (semi-perishables), improving post-harvest curing and storage can also lead to waste reduction. Increasing the adoption of low-cost, low-tech storage solutions could also help, since only a minority of respondents reported using storage rooms with adequate storage conditions. As recently recognized by FAO [77], sustainable cold chain infrastructures are the best option. However, they may not always be feasible due to the considerable resources needed and the limited return on investment. A possible solution is to establish shared storage infrastructure in key city locations (e.g., food markets) that could be used by different actors. Financing is an essential requirement and enabler here, especially for technological interventions. These actions should be initiated and funded by the national government as well as by private small and medium enterprise initiatives. Transportation was also mentioned as another waste driver, with high transport costs, bad road communication, bribery and extortion (except for institutional users), the market/selling point being far away, and transport unavailability being mentioned as common challenges. On these points, macro-level policy interventions are needed and should be integrated into a comprehensive urban food policy.
In the case of the Dhaka beef value chain, most of the unsold product was resold to urban food markets, to the food industry and to other actors or used for domestic consumption. Despite limited losses, beef production has large environmental impacts [78], and therefore, even minimal waste reduction can have a great sustainability impact. Opportunities for optimizing the beef sector and reducing potential waste have been identified in supporting cooperative structures to organize actors, enhancing micro-credit groups and giving better access to information and infrastructure [66]. Slaughtering facility modernization can improve food safety and valorize by-products like blood, manure and bone. Governmental and private investments are needed to achieve this through education, technical support and the introduction of stricter hygiene guidelines.
The survey in Kibera collected information about food habits and FW at the household level. The survey confirmed that Kibera’s inhabitants are still highly vulnerable to food insecurity, and a relevant part of household income is spent on food provision [79]. Almost all participants reported having at least two meals per day, but 56% of the households reported not having enough money to cover food expenditures. The same trend has been observed in other African cities [80] and in Nairobi, where low and medium-income households spend about three-quarters of their income on food [25]. Data collected on food shopping habits showed that inhabitants purchase their food mainly in small shops and from street vendors and markets. Food planning is rare, and most of the participants purchased food regularly or even multiple times each day, indicating that only a few food items are stored in households. Previous studies on Nairobi household FW reported about 100 kg/capita of FW per year [6], but these studies did not focus specifically on slums. While it was not possible to precisely quantify FW at the household level, FW has been reported mostly due to contamination and poor food storage conditions, with only 28% of the participants reporting to have no FW in their household. Meal leftovers were reported to be regularly consumed by almost all participants and may be a good target to start with FW reduction actions. Feasible education interventions for Kibera’s communities may give guidelines on how to properly store leftovers to avoid bacteria or animal spoilage and food containers. For example, an informational campaign through radio could help share best practices and tips for improving the shelf life and storage leftovers.
The study highlighted that waste management remains a major issue: the participants’ majority still throw their waste in non-dedicated areas of the slum, exacerbating environmental and health problems. Disposing waste around the slum can have many negative health and environmental implications. While in this research household waste compositional analysis has not been performed, previous studies in Nairobi have indicated that the majority (>60%) of MSW is composed of organic/food waste [81,82]. Kibera’s waste management should also be considered when formulating an urban food policy.

6. Conclusions

The current urbanization trend is a primary driver of changes in dietary composition and consumption patterns, which, together with higher wealth, are increasing urban FW. Reducing urban FW should be among the priorities of municipalities in LMIC, as it is crucial for tackling both food security and environmental issues, including FW management challenges. However, local municipalities face a lack of information about FW characteristics, volumes, drivers and effective approaches to prevent, reduce, and effectively manage urban FW. This study confirms that urban FW is not only a problem of HIC but also of LMIC, though not always with the same characteristics and drivers. While evidence from Kibera suggests that even households that live below the poverty line are affected by FW, data from Dhaka suggest that relevant FW is also happening inside the urban supply chain. For the onion and mango supply chains, mobile vendors had the highest percentage of unsold products, and a relevant portion of it ends up in landfills. In this article, we have proposed a three-step approach to help address urban FW. Analyzing and characterizing supply chains is the starting point for understanding and identifying FW hotspots and their drivers. Designing an effective FW intervention by considering the actors that should be involved, the level and type of the intervention, the enablers and the features that can help its adoption and success (i.e., affordability, availability, acceptability, adaptability) is the second step. The last step consists of providing guidelines on how to effectively implement and monitor the intervention. Municipalities, NGOs, private institutions and research organizations are all called to cooperate with local policymakers municipal services for waste management to collect more data about FW and start implementing FW interventions focused on preventing and reusing edible food products. National and local policymakers should support cities’ efforts by providing technical and human resources and by considering the informality of most of the actors involved in the urban food system.

Supplementary Materials

The following supporting information can be downloaded at: https://0-www-mdpi-com.brum.beds.ac.uk/article/10.3390/su15043293/s1, Table S1: items used to collect FW information during Kibera’s investigation. Figure S1: Self-estimated household skills from households’.

Author Contributions

Conceptualization, M.P.; methodology, M.P.; formal analysis and literature review, M.P.; data curation, M.P. and B.C.; writing—original draft preparation, M.P.; writing—review and editing, M.P., D.F., M.A. and B.C.; supervision, B.C.; project administration, B.C. All authors have read and agreed to the published version of the manuscript.

Funding

This work was developed within the motif ‘Feeding cities and migration settlements’ (2282700540), as part of the programme of Food Security and Valuing Water (KB-35-002-001) of Wageningen University and Research and was subsidized by the Dutch Ministry of Agriculture, Nature and Food Quality.

Institutional Review Board Statement

The data collection in Kibera (Nairobi) adhered to the Egerton University Data Policy. For the data collection in Dhaka, see [65,66,67].

Informed Consent Statement

Informed consent was obtained from all subjects involved in the study.

Data Availability Statement

Anonymized data is available from the authors upon request.

Acknowledgments

This work was developed within the motif ‘Feeding cities and migration settlements’ (2282700540), as part of the programme Food Security and Valuing Water (KB-35-002-001) of Wageningen University & Research and was supported by the Dutch Ministry of Agriculture, Nature and Food Quality. The household survey in Kibera was conducted by Egerton University, team of Oscar Ingasia Ayuya. The Value Chain Studies in Dhaka were conducted in the project ‘Support for Modelling, Planning, and Improving Dhaka’s Food System’, implemented by the FAO Bangladesh and funded by The Embassy of the Kingdom of the Netherlands.

Conflicts of Interest

The authors declare no conflict of interest.

References

  1. Porter, S.D.; Reay, D.S.; Higgins, P.; Bomberg, E. A half-century of production-phase greenhouse gas emissions from food loss & waste in the global food supply chain. Sci. Total Environ. 2016, 571, 721–729. [Google Scholar] [CrossRef] [PubMed]
  2. Guo, X.Z.; Broeze, J.; Groot, J.J.; Axmann, H.; Vollebregt, M. A Worldwide Hotspot Analysis on Food Loss and Waste, Associated Greenhouse Gas Emissions, and Protein Losses. Sustainability 2020, 12, 7488. [Google Scholar] [CrossRef]
  3. FAO. The State of Food and Agriculture. Moving Forward on Food Loss and Wast Reduction Food and Agriculture; FAO: Rome, Italy, 2019. [Google Scholar]
  4. Willett, W.; Rockstrom, J.; Loken, B. Food in the Anthropocene: The EAT-Lancet Commission on healthy diets from sustainable food systems (Volume 393, p. 447, 2018). Lancet 2019, 393, 2590. [Google Scholar] [CrossRef] [PubMed]
  5. Searchinger, T.; Waite, R.; Hanson, C.; Ranganathan, J. Creating a Sustainable Food Future: A Menu of Solutions to Feed Nearly 10 Billion People by 2050; World Resources Report; World Resources Institute: Washington, DC, USA, 2019. [Google Scholar]
  6. UNEP (Ed.) Food Waste Index Report; UNEP: Nairobi, Kenya, 2021. [Google Scholar]
  7. FAO, IFAD; United Nations International Children’s Emergency Fund; World Food Programme; WHO. The State of Food Security and Nutrition in the World 2021. Transforming food Systems for Food Security, Improved Nutrition and Affordable Healthy Diets for All; FAO: Rome, Italy, 2021. [Google Scholar]
  8. IPCC. Climate Change and land: An IPCC Special Report on Climate Change, Desertification, Land Degradation, Sustainable land management, Food Security and Greenohuse Gas Fluxes in Terrestrial Ecosystems; IPCC Report; IPCC: Geneva, Switzerland, 2019. [Google Scholar]
  9. Ellen MacArthur, F. Cities and Circular Economy for Food; Ellen MacArthur Foundation: Cowes, UK, 2019. [Google Scholar]
  10. United Nations. Population 2030: Demographic Challenges and Opportunities for Sustainable Development Planning (ST/ESA/SER.A/389); United Nations: New York, NY, USA, 2015. [Google Scholar]
  11. FAO. Our World Is Urbanizing, Is Food on Your Agenda? FAO: Rome, Italy, 2018; p. 12. [Google Scholar]
  12. Nerenberg, R.; Chakona, G.; Shackleton, C.M. Local setting influences the quantity of household food waste in mid-sized South African towns. PLoS ONE 2017, 12, e0189407. [Google Scholar] [CrossRef]
  13. Bricas, N. Urbanization Issues Affecting Food System Sustainability. In Designing Urban Food Policies; Urban Agriculture; Springer International Publishing: Cham, Switzerland, 2019; pp. 1–25. [Google Scholar]
  14. Kaza, S.; Yao, L.C.; Bhada-Tata, P.; Van Woerden, F. What a Waste 2.0: A Global Snapshot of Solid Waste Management to 2050; World Bank Publications: Tokyo, Japan, 2018. [Google Scholar]
  15. Cattaneo, A.; Sánchez, M.V.; Torero, M.; Vos, R. Reducing food loss and waste: Five challenges for policy and research. Food Policy 2021, 98, 101974. [Google Scholar] [CrossRef]
  16. Min, S.; Wang, X.; Yu, X. Does dietary knowledge affect household food waste in the developing economy of China? Food Policy 2021, 98, 101896. [Google Scholar] [CrossRef]
  17. Hoffmann, V.; Mutiga, S.K.; Harvey, J.W.; Nelson, R.J.; Milgroom, M.G. Observability of food safety losses in maize: Evidence from Kenya. Food Policy 2021, 98, 101895. [Google Scholar] [CrossRef]
  18. Iyamu, H.O.; Anda, M.; Ho, G. A review of municipal solid waste management in the BRIC and high-income countries: A thematic framework for low-income countries. Habitat Int. 2020, 95, 102097. [Google Scholar] [CrossRef]
  19. Affognon, H.; Mutungi, C.; Sanginga, P.; Borgemeister, C. Unpacking Postharvest Losses in Sub-Saharan Africa: A Meta-Analysis. World Dev. 2015, 66, 49–68. [Google Scholar] [CrossRef]
  20. Bellemare, M.F.; Çakir, M.; Peterson, H.H.; Novak, L.; Rudi, J. On the Measurement of Food Waste. Am. J. Agric. Econ. 2017, 99, 1148–1158. [Google Scholar] [CrossRef] [Green Version]
  21. Reynolds, C.; Goucher, L.; Quested, T.; Bromley, S.; Gillick, S.; Wells, V.K.; Evans, D.; Koh, L.; Kanyama, A.C.; Katzeff, C.; et al. Review: Consumption-stage food waste reduction interventions—What works and how to design better interventions. Food Policy 2019, 83, 7–27. [Google Scholar] [CrossRef]
  22. Delgado, L.; Schuster, M.; Torero, M. Quantity and quality food losses across the value Chain: A Comparative analysis. Food Policy 2021, 98, 101958. [Google Scholar] [CrossRef]
  23. FAO. The Milan Urban Food Policy Pact—Monitoring Framework; FAO: Rome, Italy, 2019. [Google Scholar]
  24. Fattibene, D.; Recanati, F.; Dembska, K.; Antonelli, M. Urban Food Waste: A Framework to Analyse Policies and Initiatives. Resources 2020, 9, 99. [Google Scholar] [CrossRef]
  25. Dixon, J.; Omwega, A.M.; Friel, S.; Burns, C.; Donati, K.; Carlisle, R. The Health Equity Dimensions of Urban Food Systems. J. Urban Health 2007, 84, 118–129. [Google Scholar] [CrossRef] [PubMed]
  26. Wamukoya, M.; Kadengye, D.T.; Iddi, S.; Chikozho, C. The Nairobi Urban Health and Demographic Surveillance of slum dwellers, 2002–2019: Value, processes, and challenges. Glob. Epidemiol. 2020, 2, 100024. [Google Scholar] [CrossRef]
  27. George, N.; Mildred, N.; Hudson, N. Health Risk Assessment on Selected Essential and Non-Essential Elements in Food Crops Grown in Kibera Slum, Nairobi-Kenya. Food Nutr. Sci. 2019, 10, 635–647. [Google Scholar] [CrossRef]
  28. Benson, O.; Mbauni, C.; Mwangi, G.F.; Soma, K. Food System Value-Chain Adaptability—Can New Opportunities Increase Food Security and Food Safety in Kibera? Linking Aquaculture to Urban Food Systems; Wageningen Economic Research: Wageningen, The Netherlands, 2020. [Google Scholar]
  29. Desgroppes, A.; Taupin, S. Kibera: The Biggest Slum in Africa? Les Cah. D’afrique De L’est East Afr. Rev. 2011, 44, 23–33. [Google Scholar] [CrossRef]
  30. Gulyani, S.; Talukdar, D. Inside Informality: The Links Between Poverty, Microenterprises, and Living Conditions in Nairobi’s Slums. World Dev. 2010, 38, 1710–1726. [Google Scholar] [CrossRef]
  31. Mohamed, S.F.; Mberu, B.U.; Amendah, D.D.; Kimani-Murage, E.W.; Ettarh, R.; Schofield, L.; Egondi, T.; Wekesah, F.; Kyobutungi, C. Poverty and Uneven Food Security in Urban Slums. In Rapid Urbanisation, Urban Food Deserts and Food Security in Africa; Crush, J., Battersby, J., Eds.; Springer International Publishing: Cham, Switzerland, 2016; pp. 97–111. [Google Scholar]
  32. Njoroge, B.K.; Ndunge, D.; Kimani, M. Review of municipal solid waste management: A case study of Nairobi, Kenya. Int. J. Eng. Sci. 2014, 4, 16–20. [Google Scholar]
  33. Njagi, K. Kenyan Slum Seeks to Turn Sewage into Gold with Recycling Plant. Available online: https://www.reuters.com/article/us-kenya-slums-water-energy/kenyan-slum-seeks-to-turn-sewage-into-gold-with-recycling-plant-idUSKBN15F2QY (accessed on 20 November 2022).
  34. Ananno, A.A.; Masud, M.H.; Chowdhury, S.A.; Dabnichki, P.; Ahmed, N.; Arefin, A.M.E. Sustainable food waste management model for Bangladesh. Sustain. Prod. Consum. 2021, 27, 35–51. [Google Scholar] [CrossRef]
  35. UN Habitat. World Cities Report 2016; UN Habitat: Nairobi, Kenya, 2016. [Google Scholar]
  36. Islam, K.M.N. Municipal solid waste to energy generation: An approach for enhancing climate co-benefits in the urban areas of Bangladesh. Renew. Sustain. Energy Rev. 2018, 81, 2472–2486. [Google Scholar] [CrossRef]
  37. Mourshed, M.; Masud, M.H.; Rashid, F.; Joardder, M.U.H. Towards the effective plastic waste management in Bangladesh: A review. Environ. Sci. Pollut. Res. 2017, 24, 27021–27046. [Google Scholar] [CrossRef] [PubMed]
  38. JICA. The Study on the Solid Waste Management in Dhaka City; JICA: Tokyo, Japan, 2005.
  39. Salam, M.; Hossain, M.; Das, S.; Wahab, R.; Hossain, M. Generation and assessing the composition of household solid waste in commercial capital city of Bangladesh. Int. J. Environ. Sci. Manag. Eng. Res. 2012, 1, 160–171. [Google Scholar]
  40. Sujauddin, M.; Huda, S.M.S.; Hoque, A.T.M.R. Household solid waste characteristics and management in Chittagong, Bangladesh. Waste Manag. 2008, 28, 1688–1695. [Google Scholar] [CrossRef]
  41. IFAD. Transforming Food Systems for Rural Prosperity. In Proceedings of the Rural Development Report 2021; IFAD: Roma, Italy, 2021. [Google Scholar]
  42. Pedrotti, M.; Fattibene, D. Food loss and waste in cities. In A Journey into the World’s Food Systems in Search of Losses, Waste and Ways to Solve Them; Stroosnijder, S., Hetterscheid, B., Castelein, B., Eds.; Wageningen Food & Biobased Research: Wageningen, The Netherlands, 2022. [Google Scholar]
  43. Kok, M.G.; Castelein, R.B.; Broeze, J.; Snels, J.C.M.A. The EFFICIENT Protocol: A Pragmatic and Integrated Methodology for Food Loss and Waste Quantification, Analysis of Causes and Intervention Design; Wageningen Food & Biobased Research: Wageningen, The Netherlands, 2021. [Google Scholar] [CrossRef]
  44. WRAP. Food Waste Measurement Principles and Resources Guide; WRAP: Banbury, UK, 2018. [Google Scholar]
  45. FAO. Methodological Proposal for Monitoring SDG Target 12.3. The Global Food Loss Index Design, Data Collection, Methods and Challenges; FAO: Rome, Italy, 2018. [Google Scholar]
  46. APHLIS. How APHLIS Estimates Loss. Available online: https://www.aphlis.net/en/page/4/how-aphlis-estimates-loss (accessed on 16 March 2022).
  47. FLWP. Food Loss and Waste Accounting and Reporting Standard; World Resource Institute: Washington, DC, USA, 2016; ISBN 978-1-56973-892-4. Available online: http://flwprotocol.org/ (accessed on 1 February 2023).
  48. Stenmarck, A.; Jensen, C.; Quested, T.; Moates, G. Estimates of European Food Waste Levels. FUSIONS Project Report, Stockholm. 2016. Available online: https://www.eu-fusions.org/phocadownload/Publications/Estimates%20of%20European%20food%20waste%20levels.pdf (accessed on 1 February 2023).
  49. Xue, L.; Liu, G.; Parfitt, J.; Liu, X.; Van Herpen, E.; Stenmarck, Å.; O’Connor, C.; Östergren, K.; Cheng, S. Missing Food, Missing Data? A Critical Review of Global Food Losses and Food Waste Data. Environ. Sci. Technol. 2017, 51, 6618–6633. [Google Scholar] [CrossRef] [PubMed]
  50. Delley, M.; Brunner, T.A. Household food waste quantification: Comparison of two methods. Br. Food J. 2018, 120, 1504–1515. [Google Scholar] [CrossRef]
  51. Williams, H.; Wikström, F.; Otterbring, T.; Löfgren, M.; Gustafsson, A. Reasons for household food waste with special attention to packaging. J. Clean. Prod. 2012, 24, 141–148. [Google Scholar] [CrossRef]
  52. Carey, J.; Cook, B. The Milan Urban Food Policy Pact Monitoring Framework: A Practical Handbook for Implementation; FAO: Rome, Italy, 2021. [Google Scholar]
  53. HLPE. Food Losses and Waste in the Context of Sustainable Food Systems. In A Report by the High Level Panel of Experts on Food Security and Nutrition of the Committee on World Food Security of Sustainable Food Systems; HLPE: Rome, Italy, 2014. [Google Scholar]
  54. Papargyropoulou, E.; Lozano, R.; Steinberger, J.K.; Wright, N.; Ujang, Z.B. The food waste hierarchy as a framework for the management of food surplus and food waste. J. Clean. Prod. 2014, 76, 106–115. [Google Scholar] [CrossRef]
  55. FAO. Save Food for a Better Climate—Converting the Food Loss and Waste Challenge into Climate Action; FAO: Rome, Italy, 2017. [Google Scholar]
  56. Odokonyero, K.; Gallo, A.; Mishra, H. Nature-inspired wax-coated jute bags for reducing post-harvest storage losses. Sci. Rep. 2021, 11, 15354. [Google Scholar] [CrossRef]
  57. Plaisier, C.; Sibomana, M.; Van der Waal, J.; Clercx, L.; Van Wagenberg, C.P.A.; Dijkxhoorn, Y. Approach for Designing Context-Specific, Locally Owned Interventions to Reduce Postharvest Losses: Case Study on Tomato Value Chains in Nigeria. Sustainability 2019, 11, 247. [Google Scholar] [CrossRef]
  58. de Steenhuijsen Piters, B.; Dijkxhoorn, Y.; Hengsdijk, H.; Brouwer, I.; Ticharř, T.; Carrico, C. Synthesis Report of the Global Fruits and Vegetables Scoping Study: Assessing Opportunities for Philanthropic Investment; Wageningen Economic Research: Wageningen, The Netherlands, 2021; p. 47. [Google Scholar]
  59. Smit, W. Urban governance and urban food systems in Africa: Examining the linkages. Cities 2016, 58, 80–86. [Google Scholar] [CrossRef]
  60. Soethoudt, J.M.; Pedrotti, M.; Bos-Brouwer, H.E.J.; Castelein, R.B. Adoption of Food Loss and Waste-Reducing Interventions in Low- and Middle-Income Countries; Wageningen Food & Biobased Research: Wageningen, The Netherlands, 2021. [Google Scholar]
  61. Hanson, C.K.F.; Robertson, K.; Axmann, H.; Bos-Brouwers, H.; Broeze, J.; Kneller, C.; Maier, D.; McGee, C.; O’Connor, C.; Sonka, S.; et al. Reducing Food Loss and Waste: Ten Interventions to Scale Impact; World Resource Institute: Washington, DC, USA, 2019. [Google Scholar]
  62. De Laurentiis, V.; Caldeira, C.; Sala, S. No time to waste: Assessing the performance of food waste prevention actions. Resour. Conserv. Recycl. 2020, 161, 104946. [Google Scholar] [CrossRef]
  63. Ayuya, O.I.; Soma, K.; Obwanga, B. Socio-Economic Drivers of Fish Species Consumption Preferences in Kenya’s Urban Informal Food System. Sustainability 2021, 13, 5278. [Google Scholar] [CrossRef]
  64. van Herpen, E.; van Geffen, L.; Nijenhuis-de Vries, M.; Holthuysen, N.; van der Lans, I.; Quested, T. A validated survey to measure household food waste. MethodsX 2019, 6, 2767–2775. [Google Scholar] [CrossRef] [PubMed]
  65. Kok, M.G.; Soethoudt, J.M.; Vernooij, D.M. Analysis of the Onion Value Chain in Bangladesh: Towards a Strategic Action Agenda for the Dhaka City Corporations; Wageningen Food & Biobased Research: Wageningen, The Netherlands, 2021; p. 43. [Google Scholar]
  66. Kok, M.G.; Soethoudt, J.M.; Vernooij, D.M.; Chowdhury, K.B. Analysis of the Beef Value Chain in Bangladesh: Towards a Strategic Action Agenda for the Dhaka City Corporations; Wageningen Food & Biobased Research: Wageningen, The Netherlands, 2021; p. 46. [Google Scholar]
  67. Kok, M.G.; Soethoudt, J.M.; Vernooij, D.M.; Hetterscheid, S. Analysis of the Mango Value Chain in Bangladesh: Towards a Strategic Action Agenda for the Dhaka City Corporations; Wageningen Food & Biobased Research: Wageningen, The Netherlands, 2021; p. 43. [Google Scholar]
  68. BBS. Bangladesh Statistics 2019; BBS: Schiltach, Germany, 2019. [Google Scholar]
  69. Roy, S.; Hassan, M.K.; Ahmed, Q.M.; Rahman, M.M.; Hasan, G.N.; Sarkar, M.N. Assessment of postharvest loss and constraints in the supply chain of mango. Int. J. Bus. Manag. Soc. Res. 2019, 7, 412–420. [Google Scholar] [CrossRef]
  70. Belton, B.; Karim, M.; Thilsted, S.; Collis, W.; Phillips, M. Review of Aquaculture and Fish Consumption in Bangladesh; Studies and Reviews 2011-53; The WorldFish Center: Penang, Malaysia, 2011; p. 71. [Google Scholar]
  71. FAO. Food Balances Data; FAO: Rome, Italy, 2017. [Google Scholar]
  72. Selvanathan, E.A.; Jayasinghe, M.; Hossain, M.M.; Selvanathan, S. Modelling the Demand for Meat in Bangladesh. In Science and Technology Innovation for a Sustainable Economy; Islam, M.M., Hossain, M.M., Eds.; Springer International Publishing: Cham, Switzerland, 2020; pp. 135–151. [Google Scholar]
  73. Income, Bangladesh Household. Household Income and Expenditure Survey 2016–2017; International Household Survey Network/Bangladesh Bureau of Statistics: Dhaka, Bangladesh, 2017.
  74. Islam, M.J.; Sayeed, M.A.; Akhtar, S.; Hossain, M.S.; Liza, A.A. Consumers profile analysis towards chicken, beef, mutton, fish and egg consumption in Bangladesh. Br. Food J. 2018, 120, 2818–2831. [Google Scholar] [CrossRef]
  75. Faruque, Q.; Shekhar, H.; Begum, S. Institutionalization of healthy street food system in Bangladesh: A pilot study with three wards of Dhaka city corporation as a model. Natl. Food Policy Capacit. Strength. Programme 2010, 7, 1–84. [Google Scholar]
  76. Alam, S.K.; Rahman, M.; Reza, M.; Amin, M.; Hussen, M.A. Postharvest loss assessment of mango at different stages of supply chain through traditional and improved handling practices. Adv. Plants Agric. Res. 2019, 9, 384–388. [Google Scholar]
  77. FAO. Sustainable Food Cold Chains: Opportunities, Challenges and the Way Forward; FAO: Rome, Italy; UNEP: Nairobi, Kenya, 2022. [Google Scholar]
  78. de Vries, M.; van Middelaar, C.E.; de Boer, I.J.M. Comparing environmental impacts of beef production systems: A review of life cycle assessments. Livest. Sci. 2015, 178, 279–288. [Google Scholar] [CrossRef]
  79. Ahmed, S.; Haklay, M.; Tacoli, C.; Githiri, G.; Dávila, J.D.; Allen, A.; Fèvre, E.M. Participatory mapping and food-centred justice in informal settlements in Nairobi, Kenya. Geo: Geogr. Environ. 2019, 6, e00077. [Google Scholar] [CrossRef]
  80. Battersby, J. Urban food security and climate change: A system of flows. In Climate Change, Assets and Food Security in Southern African Cities; Routledge: London, UK, 2013. [Google Scholar]
  81. UNEP. Africa Waste Management Outlook; Programme ONU Environnement: Nairobi, Kenya, 2018. [Google Scholar]
  82. JICA. Preparatory Survey for Integrated Solid Waste Management in Nairobi City in the Republic of Kenya; JICA: Tokyo, Japan, 2010.
Figure 1. A three-step approach for analyzing urban food systems, identifying FW hotspots and designing and implementing effective FW prevention/reduction interventions. (Elaboration by the authors).
Sustainability 15 03293 g001
Figure 2. Available methods for quantifying urban FW.
Sustainability 15 03293 g002
Figure 3. (A) Frequency of shopping planning and (B) frequency on checking inventory levels before shopping.
Sustainability 15 03293 g003
Figure 4. Main reasons for food waste at the household level. Multiple answers were possible, so totals may not add up to 100%.
Sustainability 15 03293 g004
Figure 5. Disposal strategies for solid waste.
Sustainability 15 03293 g005
Figure 6. Onion food waste visualization. The handled values per year represent an average per actor.
Sustainability 15 03293 g006
Figure 7. Mango food waste visualization. The handled values per year represent an average per actor.
Sustainability 15 03293 g007
Figure 8. Beef food waste visualization. The handled values per year represent an average per actor.
Sustainability 15 03293 g008
Table 1. Participants in the different supply chain studies. For each stakeholder category of the urban supply chain, the number of participants is reported together with information on gender and average age. M = males, Y.o. = years old.
Supply ChainRetailersMobile VendorsInstitutional UsersSlaughterhouses
Onion60 (95% M, 39 y.o.)60 (97% M, 39 y.o.)60 (97% M, 39 y.o.): 4 hotel managers, 56 hotel/restaurant owners.-
Mango60 (97% M, 40 y.o.)60 (98% M, 40 y.o.)60 (98% M, 36 y.o.)-
Beef60 (all M, 40 y.o.)60 (all M, 38 y.o.)60 (98% M, 40 y.o.): 59 hotels, 1 beef processorEmployees from 9 (all M, 43 y.o.)
Table 2. Summary of the onion supply chain actors, kgs handled, unsold (amounts of actors that mentioned to have no unsold products), and main destinations for the unsold.
Value Chain ActorsKgs Handled (Average)Kgs Not Sold (Average)% Unsold (Average)No Unsold1st Destination of Unsold2nd Destination of Unsold
Retailers51,04820884.0935%Landfill (58%)Domestic consumption (42%)
Mobile vendors31,91814734.6143%Landfill (42%)Domestic consumption (30%)
Institutional users6051821.0267%Landfill (25%)Domestic consumption (15%)
Table 3. Summary of the mango supply chain actors, kgs handled, unsold and destinations for unsold.
Value Chain ActorsKgs Handled (Average)Kgs Not Sold (Average)% Unsold (Average)No Unsold1st Destination of Unsold2nd Destination of Unsold
Retailers259309723.715%Landfill (68%)Given to poor (50%)
Mobile vendors145928265.727%Landfill (57%)Given to poor (50%)
Institutional users1504775.167%Landfill (22%)Domestic consumption (17%)
Table 4. Summary of the beef supply chain actors, kgs handled, unsold and destinations for unsold. The average per actor is presented.
Value Chain ActorsPurchased InputN. of Cattle/kgs Handled per YearKgs Not Sold% UnsoldNo Unsold1st Destination of Unsold2nd Destination of Unsold
RetailersCows28N.A.--Urban food market
Home consumption
Bulls331N.A.
Beef8525 kgN.A.<513%; 12% after storage
Mobile vendorsBeef13764 kg34 kg<512%Home consumptionUrban food market
Institutional usersBeef3469 kg115 kg<50%; 12% after storageHome consumptionUrban food market
AbattoiresCows21-<523%LandfillOwn consumption
Bulls241
Disclaimer/Publisher’s Note: The statements, opinions and data contained in all publications are solely those of the individual author(s) and contributor(s) and not of MDPI and/or the editor(s). MDPI and/or the editor(s) disclaim responsibility for any injury to people or property resulting from any ideas, methods, instructions or products referred to in the content.

