
Geographies of Frontline Workers: Gender, Race, and Commuting in New York City
1
Department of Geography and GIScience, University of Illinois at Urbana-Champaign, Urbana, IL 61801, USA
2
Environmental and Urban Change, York University, Toronto, ON M3J 1P3, Canada
*
Author to whom correspondence should be addressed.
Sustainability 2023, 15(4), 3429; https://0-doi-org.brum.beds.ac.uk/10.3390/su15043429
Submission received: 15 December 2022
/
Revised: 2 February 2023
/
Accepted: 7 February 2023
/
Published: 13 February 2023
(This article belongs to the Special Issue Frontiers in Economic Geography)
Abstract
:The COVID-19 pandemic amplified social, economic, and environmental inequalities in American cities, including inequities in commuting and access to employment. Frontline workers—those who had to work on site during the pandemic—experienced these inequalities in every aspect of their daily lives. We examine the labor force characteristics and commuting of frontline workers in New York City with a focus on gender and race/ethnic disparities in wages and commuting modes and times. Using Census PUMS microdata for a sample of New York City residents in the 2015–2019 period, we identify frontline workers from detailed industry and occupation codes and compare characteristics of frontline workers with those of essential workers who could work remotely. The data highlight wide disparities between frontline and remote workers. Minority men and women are concentrated in the frontline workforce. The residential geographies of frontline and remote workers differ greatly, with the former concentrated in low- and moderate- income areas distant from work sites and with long commute times. Compared to men, women frontline workers rely heavily on public transit to commute and transit dependence is highest among Black and Latina women. Low-wage employment, long commute times, and transit dependence intersected to increase minority women’s economic and social vulnerability during the pandemic.
1. Introduction
The rise of digital technologies, the emergence of new divisions of labor, and the increasing emphasis on cognitive and cultural capital in production are transforming urban economies and heightening social inequalities in cities [1]. These transformations accelerated during the recent global pandemic, as COVID-19 upended working lives around the globe, profoundly changing the geographies of employment. While many workers were able to work remotely, protecting themselves from exposure to the novel SARS-COV-2 virus, others—frontline workers—continued to go to work. Interrogating unequal opportunities to work remotely allows us to investigate how social and technological processes transforming the geographies of work contribute to gender, race, and class inequalities.
The analysis contributes to knowledge of the changing geographies of paid work by focusing on workers whose daily lives and well-being are constrained by the separation of home and work and the need to commute between them. Aside from a handful of national studies [2,3] that lack geographic detail, our knowledge of who frontline workers are, where they live, and their work trips and the wages they earn is limited. Our goal is to fill this gap via a descriptive analysis of frontline workers in New York City in the early phase of the pandemic. While the need to work frontline will change over time, especially as technological innovations enable more telework, the pandemic demonstrated the urgency of understanding the social characteristics and geographies of frontline workers.
1.1. Literature
The large and growing geographic literature about telework [4,5,6] provides little information about workers who are unable to perform their jobs remotely. Frontline workers whose jobs involved face-to-face interactions commuted throughout the pandemic [7,8]. They provided the paid care and productive and distributional labor that undergirds society’s social and economic relations and enables growing numbers of employees in other industries to work remotely. In addition to concerns about their own health and safety during work trips, many frontline workers had to negotiate reductions in public transit services instituted in response to declining demand, staff shortages as transportation workers became ill with COVID-19, and the need to clean equipment more often and more thoroughly [9]. Service changes affected all aspects of commuting: the availability of different modes, commuting times, and commuting distances [8], forcing frontline workers to adapt, often extending the distance and time of work trips.
As remote work increased during the pandemic, the total number of people commuting plummeted and the decline was especially marked for those who used public transit [10,11,12]. Surveys revealed that working from home was only one of the reasons that users abandoned transit. Concerned about the cleanliness and safety of transit [11,13,14], transit users started using alternative modes. While many walked and biked to work, cars quickly became the favored commuting mode. Even as the pandemic has eased, transit use has not returned to pre-pandemic levels.
Using information from small residential areas, studies in cities worldwide confirmed that COVID-19′s impacts on travel generally, and commuting specifically, were marked by income and racial inequalities [15,16,17]. Travel and transit use declined more in high-income neighborhoods than in low-income ones. Often considered more convenient and comfortable than other modes, commuting by private automobile was also judged safer than commuting by bus or rapid transit at the beginning of the pandemic [11,18]. Many highly educated and well-paid workers whose cognitive and cultural capital is highly valued worked remotely, and the few who had to go to the workplace often drove to work rather than commuting on public transit [13,19,20]. In low-income areas, transit use declined, but less precipitously than in high-income areas [15,16,17]. Reductions in transit use were often racialized, especially in American cities where residential areas dominated by affluent Whites recorded larger drops in transit use than low-income areas with large minority populations [15,19].
The shifts in mode use affected commute times and workers’ overall well-being. Mode has a direct impact on commuting time: trips on public transportation often take more time than corresponding trips by car [21]. Time is a crucial resource: workers who endure long commuting trips have less time available to care for themselves and their households and to maintain friendships. Long commutes have been linked to stress, anxiety, and other health concerns [22]. Low-wage workers are especially vulnerable to the adverse effects of long commuting trips [23], as their limited economic resources compound the stresses associated with lack of time to meet basic needs.
Gender has not been considered much in the literature about commuting during the pandemic. For example, Brough et al. [19] and Hu and Chen [15] document the rapid decline in transit use at the beginning of the pandemic, but they do not distinguish between men and women. When research takes account of gender, it is often treated as one additional variable rather than a dimension of identity that is equally important as income and race/ethnicity in shaping mobility and commuting [24]. On average, women still commute shorter distances and times than men, although the gender gap is diminishing [25,26]. This well-established gender difference has been attributed to many factors, but three are particularly relevant for understanding frontline workers’ commutes. Gender segmentation in the labor market means women’s jobs are concentrated in health care and social services, and compared with men, women also hold a smaller share of managerial, executive, scientific, and professional jobs [27], potentially reducing women’s opportunities for remote work. Gender also influences access to cars. While women in the United States now account for more than half of all licensed drivers [28], they still drive fewer miles on average than men and are more reliant than men on transit, which posed more risks and required more adaptation during the pandemic [29]. Finally, gender roles, especially women’s responsibilities for housework and child-care, influence frontline workers’ commutes. To accommodate the responsibilities of paid work and social reproduction, some women work closer to home than men. Others increase their daily trips to accommodate the trip chaining by which they accomplish domestic tasks [30,31]. As schools and childcare centers shut down during the pandemic, frontline workers who were women scrambled to arrange care for their children, even as they continued to commute, often depending on constantly changing and increasingly infrequent public transportation.
Race and ethnicity affect gender differences in commuting, and we expect this to be especially true for frontline workers. In the U.S., Black and Latinx workers make up a disproportionate share of the frontline workforce [2]. Residential segregation by race and ethnicity and relatively low rates of car ownership result in challenging commutes for many minority workers, leading to longer commute times and higher rates of transit reliance than for White workers [32].
The effects of gender and race/ethnicity are often evident in tradeoffs between commuting time and wages. Although still positively related in many urban settings in the United States, the relationship between commuting time and wages depends on the residential location of workers as well as their race and gender. For example, in New York City in 2010, commuting time declined as wages increased for White and Asian workers in central neighborhoods in Manhattan, where there is a dense concentration of jobs, residences, and public transit. High-wage workers in Manhattan were “advantaged” both economically and by their short travel times to work. In the inner suburbs of New York City, limited residential choices, infrequent transit service, and lack of proximity to well-paid employment opportunities result in a commuting disadvantage, as workers, especially workers of color, commute long times to low wage jobs [33].
1.2. Aims
The analysis concentrates on essential workers, “who are vital for the core functioning of societal infrastructure” [2] (p. 1). We distinguish frontline essential workers who must provide their labor in person at the worksite from remote essential workers who can work from home [2,34]. Using detailed individual information from the American Community Survey (ACS) that captures the residential distribution of male and female frontline workers just before the pandemic, we investigate essential workers’ opportunities to work remotely by comparing the social characteristics of frontline and remote essential workers, documenting their residential and work geographies, and assessing the commuting patterns that link them. By comparing the commutes of men and women who are frontline workers from four race/ethnicity groups: Black, Latinx, Asian, and White, in New York City, the central city for the New York metropolitan area, one of America’s most racially segregated municipalities [35], the spatial analysis adds crucial information about gendered and racialized inequalities and points to the geographical factors that determine them.
The analysis extends the current and rapidly growing literature about commuting and geographies of frontline and remote work during the pandemic [4,10,11,12,15,36] in three directions. By investigating the social and geographical characteristics of frontline workers and their commutes, we concentrate on a group who was less able to adjust their work locations and travel to pandemic conditions, complementing research that focuses on workers who worked remotely [18,37,38]. We evaluate commuting disadvantage for frontline workers by a spatial analysis that documents their residential locations, their commuting modes and times, and the relationship between commuting time and wages. Finally, the analysis incorporates an intersectional perspective that takes account of gender and race/ethnic segmentation in the labor market.
2. Methods and Materials
2.1. Study Area: New York City
The analysis focuses on New York City for three reasons. Services dominate the New York City economy, where opportunities for remote work were distributed unevenly across the large financial, retail, accommodation and food, health care and social services, and entertainment sectors. While highly valued workers in sectors such as finance mostly worked remotely, workers in other sectors, such as retail and health care, were either deemed essential frontline workers or laid off [7]. With the densest and most widely used public transportation system in the United States, New York City is often cited as a model of sustainable transportation. By examining the geographies of frontline workers in New York City, we learn about the challenges facing frontline workers who rely on transit even during a pandemic. Finally, New York City was the epicenter of the pandemic in North America between March 2020 and June 2020, and it adopted strict stay-at-home and essential work orders very early in the pandemic. Examining commuting in New York City provides detailed information about the gender, race, and class inequalities of remote and frontline work.
Reviewing some of the state and city orders affecting frontline workers and the availability of public and private transportation sets the stage for this study. On 20 March 2020, New York State issued a stay-at-home order that required all residents, except those in essential industries, to stay home [39]. The list of essential industries was very short; health care operations and essential infrastructure that included utilities such as public transportation. Retail businesses selling groceries, food stuffs, pharmaceutical and medical products, and other goods deemed essential stayed open with capacity limits. On the same day, the state required masks to be worn on all public and private transportation carriers. In New York City, where additional cleaning protocols reduced the frequency of buses and subway service, the subway started a nightly shut down on 6 May 2020. On 8 June 2020, New York City entered Phase 1 of reopening, allowing all retail and wholesale trade, construction, manufacturing, and agriculture workplaces to reopen fully, and on 17 May 2021, the subway system resumed 24-h service and night bus service was reduced.
Stay at home orders reduced mobility precipitously in the city, with subway use declining by more than 90% [12]. Transit ridership has never returned to pre-pandemic levels, hovering between 60 percent and 70 percent of pre-pandemic bus and subway ridership in November 2022 [40]. We document the commuting patterns of frontline workers and assess how their wages and commuting times intersect among workers differentiated by gender, race, and ethnicity.
2.2. Defining Essential and Frontline Workers
In the U.S., the terms “essential” and “frontline” workers came to the forefront as federal, state, and local governments formulated lockdown and stay-at-home policies in response to COVID-19. The designation “essential” refers to people employed in industries vital for maintaining societal health, well-being, and political–economic relations. According to the U.S. Department of Homeland Security, essential workers “protect their communities, while ensuring continuity of functions critical to public health and safety, as well as economic and national security [41]”. They provide health care, education, and transportation services; maintain infrastructure; supply food; sustain digital information networks; and manufacture products.
Within the broad category of essential workers, an important distinction exists between frontline workers and those who can work remotely. To be considered a frontline worker, the worker must be engaged in work that is performed in person at a worksite. For example, all employees of a hospital work in an essential industry, but only some employees, such as nurses, orderlies, physicians, and cleaners who must perform their work in the hospital, are frontline workers. The hospital accountant who can work from home is employed in an essential industry but is NOT a frontline worker.
Identifying remote and frontline essential workers is challenging. Little data is available on the social and geographical characteristics of the workforce deemed essential during the pandemic and who among that group worked on-site or remotely. Much of the data that we have about work during the pandemic [3] comes from national samples that do not reveal detailed local patterns. Therefore, to identify potential frontline and remote essential workers in New York City, we follow the method developed by Blau et al. [2] that uses Census microdata collected before the pandemic to characterize essential workers and to distinguish between those who were likely to work on-site or remotely. Frontline workers are identified in two stages:
- Essential industries, as listed by the U.S. Department of Homeland Security [41], are identified based on detailed NAICSP industry codes. Essential industries include health care, manufacturing, transportation, education, etc. Construction was considered an essential industry in New York City, although many construction sites shut down for short periods in March 2020.
- For people employed in essential industries, frontline workers are identified based on occupation. Workers in occupations in which less than a third of all workers can work from home [34] are classified as frontline workers.
It is important to note that our research and research findings only consider workers employed in industries designated as “essential” early in the pandemic. Those employed in sectors like entertainment and tourism that mainly shut down during that time, are not included. Within the essential workforce, we draw a distinction between frontline workers and the remainder of essential workers who were able to work remotely. Thus, in discussing the results, the term “frontline workers” refers only to frontline workers employed in essential industries. Similarly, “remote workers” describes those employed in essential industries who worked remotely.
We acknowledge that identifying essential and frontline workers is challenging and potentially problematic. We use relatively broad industrial and occupational codes to designate frontline workers; however, the opportunity to work remotely varies within each category. Additionally, during the pandemic, definitions of essential workers varied among states and municipalities; some states did not adopt stay-at-home policies and therefore had no need to define essential workers. Even at the federal level, the definitions put forth by the U.S. Department of Homeland Security were only advisory. Moreover, in states like New York that designated essential workers, policies about frontline work changed over time. For example, primary and secondary teachers mainly worked remotely through the first year or so of the pandemic, then shifted to in-person instruction. These changes clearly affect the gender composition of the frontline workforce. For this research, we focus on the early period of the pandemic and consider education workers to be part of the remote essential workforce.
2.3. Data
Our analysis draws on the combined ACS 2015–2019 Public Use Microdata Sample (PUMS) data for New York City, labeled as PUMS 2019. Collected by the U.S. Bureau of Census, the PUMS data are individual records that provide detailed information for each sampled individual including the following variables that were used in this study: industry of employment and occupation, earnings, typical hours and weeks of work, commuting time, and usual mode of transportation, along with information about social characteristics such as sex and race/ethnicity group. In this analysis, the sample consisted of New York City residents who reported working in the past year and whose earnings from wages and salary income or self-employment were greater than zero. Hourly wage was estimated by dividing earnings by weeks worked by typical hours worked per week. Each sampled individual is assigned a person weight that is used in all analyses to ensure the results represent population-level characteristics and associations.
The PUMS data allow us to specify the residential location of each worker. In this instance, workers are assigned to one of 55 Public Use Microdata Areas (PUMAs) in New York City. PUMAs correspond approximately to Community Districts and range in size from less than 900 acres to almost 15,000 acres, with populations exceeding 100,000. Due to privacy and confidentiality restrictions, the data are only readily available at the coarse PUMA scale; therefore, we are unable to analyze in detail the neighborhoods where frontline workers live and their proximity to transportation, jobs, and health and social services.
2.4. Methods
To identify essential workers, we followed the procedure discussed earlier that uses NAICS industry codes to designate people employed in industries classified as essential. Focusing on essential workers only, the next step was to identify frontline workers based on 4-digit, 2018 occupation codes. Essential workers who were not classified as frontline, or who reported working from home, are referred to as remote workers. To examine disparities in frontline work by gender, race/ethnicity, and class, we include descriptive tabulations and a logistic regression analysis with frontline worker (Yes = 1) as the outcome variable. Predictor variables include sex (Female = 1), Black (non-Latinx Black = 1), Asian (non-Latinx Asian = 1), Latinx (Latinx = 1), and log of hourly wage. These analyses focus on essential workers only and identify characteristics of those who were likely to work on-site (frontline) versus those who could work remotely.
To examine and compare the residential locations of essential workers employed frontline with those employed remotely, we map the residential concentration, by PUMA, for each group. As a measure of residential concentration, we use the location quotient, a ratio that compares the proportion of frontline workers who live in a PUMA to the PUMA’s proportion of the total resident workforce. Specifically, the location quotient for frontline workers in PUMA i equals: ), where Ai equals the number of frontline workers living in PUMA i; Ti equals the total number of workers living in PUMA i; and n is the number of PUMAs. A value of 1 indicates that the proportion of frontline workers residing in a PUMA equals the area’s share of the total resident workforce. Values greater than one show residential concentration of frontline workers while values less than 1 indicate show lack of concentration—i.e., frontline workers’ share of the PUMA’s resident workforce is less than frontline workers’ city-wide share.
We investigated frontline workers’ commute modes and the time spent commuting in two stages. A descriptive analysis is conducted to analyze differences in commute time and transit use across gender and race/ethnicity groups of frontline workers. To investigate the complex associations between commute times and hourly wages among frontline workers, we create wage/commute time typologies [33] that show the concentration of workers in various combinations of hourly wages and commute times. Hourly wages, shown on the vertical axis, are categorized into quartiles, and commuting time (horizontal axis) into five categories: up to 15 min, 16–30 min, 31–45 min, 46–60 min, and more than 60 min. Commute time categories are arrayed in reverse order so that commute time advantage increases along the axis. The value (quotient) in each cell of the typology measures a group’s representation in that category—i.e., the group’s proportion of workers in that category divided by the corresponding proportion of the total workforce. Quotient values greater than one show concentration, and values less than one indicate that the group is underrepresented. Focusing on essential workers, the typology is first constructed for all frontline, essential workers (compared to all workers), and then separately for frontline workers differentiated by gender and race/ethnicity. These typologies reveal which groups of frontline essential workers are most concentrated in disadvantaged commutes characterized by low wages and long travel times to the work site.
3. Results
3.1. Who Are Frontline Workers?
Essential industries employed slightly more than 2,800,000 workers, almost 70 percent of New York City’s resident workforces just prior to the pandemic (Table 1). Numbering more than 1,500,000, frontline workers were a significant share of the total workforce in New York City, accounting for more than one in three resident workers (37.42%). The data show that the remainder of the City’s workforce is divided equally between essential workers who could work remotely (31.62%) and those employed in industries that were not considered essential (30.96%).
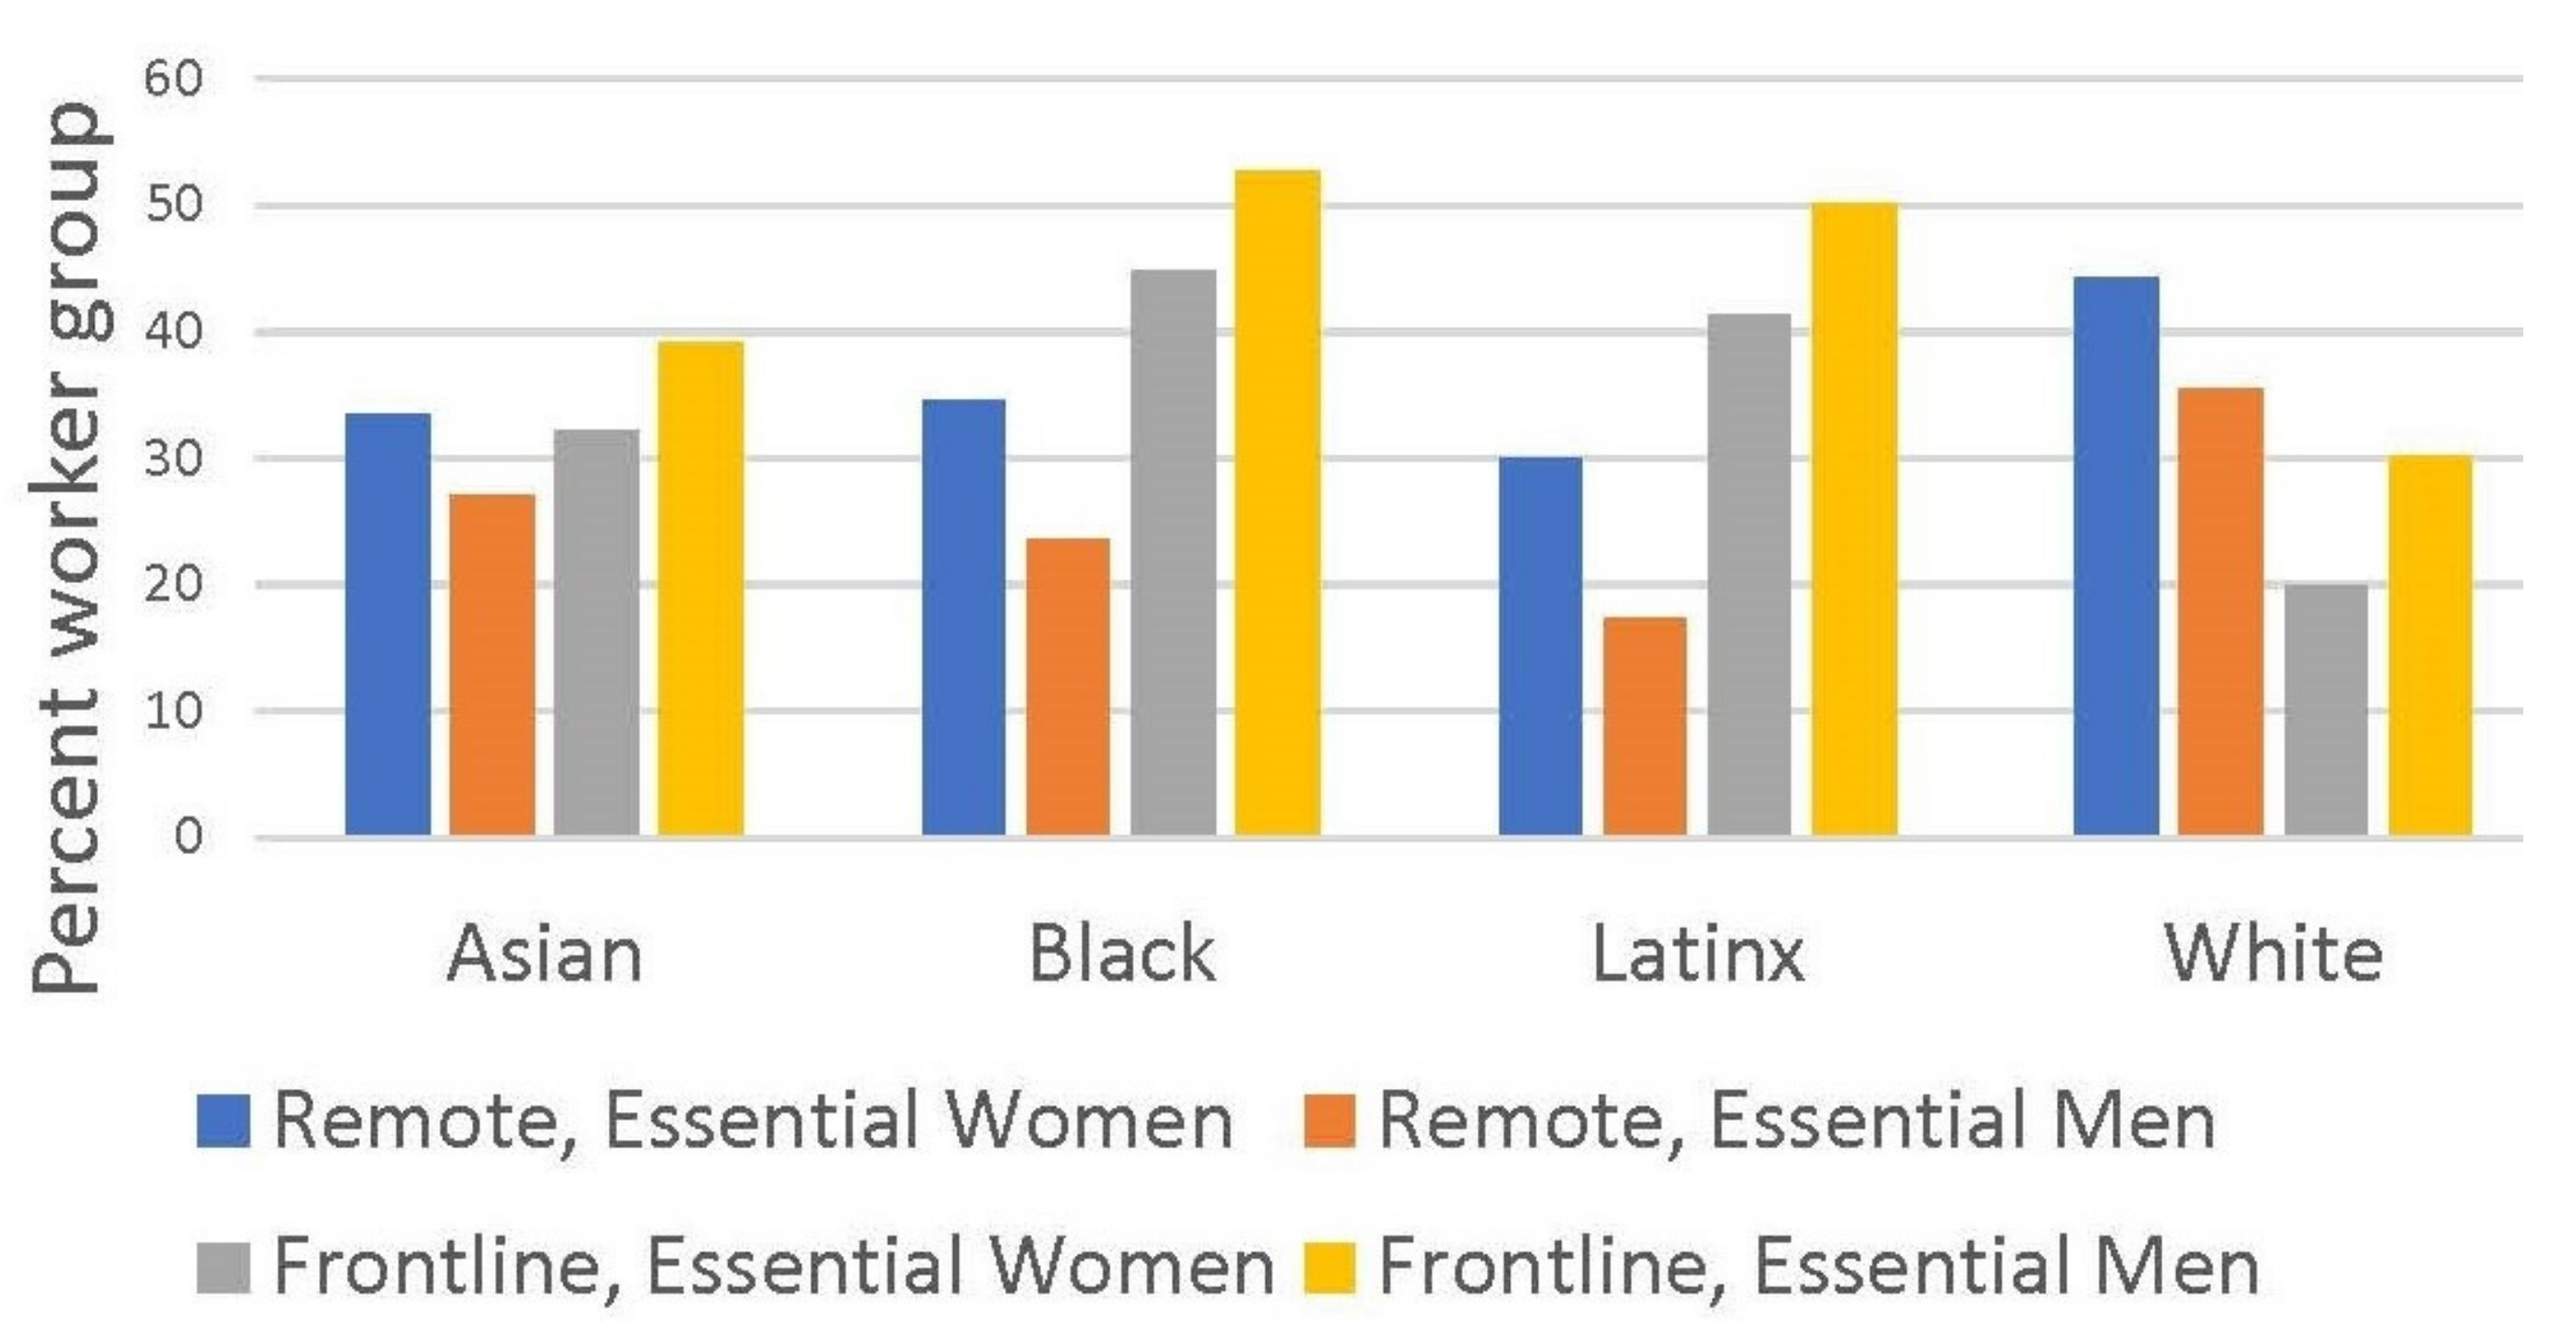
The overall share of frontline workers is substantial, but it masks racial differences in frontline employment (Figure 1). In New York City, the data indicate that higher percentages of minority workers were putting themselves at risk to do their jobs on site during the pandemic than White workers. Minorities are more likely to be frontline workers than Whites, by a large margin. Where more than 50% of Black men are frontline workers, only 30% of White men have frontline jobs. There are equally large gaps in the percentages of frontline workers by race/ethnicity group for women; about 45% of Black women are frontline workers compared with only 20% of White women.
Men predominate among frontline workers in every race/ethnicity group. This is consistent with our definition of frontline work that includes transportation and construction and excludes education, a female-dominated industry. The gender disparity in frontline work varies, with the largest gender gap, 10.7%, for White workers and smaller disparities for Latinx, Black, and Asian workers of 8.7%, 7.9%, and 6.9%, respectively. For remote essential jobs, women outnumber men in every race/ethnicity group, with large gender disparities of 12.7% and 11.1% for Latinx and Black workers, respectively.
The odds ratios estimated in a logistic regression model that examines the combined associations between gender, race/ethnicity, and hourly wage and the likelihood that an essential worker is a frontline worker highlight gender and race/ethnic disparities. With an odds ratio of 0.49, women essential workers are half as likely as their male counterparts to work frontline (Table 2). At the same time, Black and Latinx essential workers are more than twice as likely to work on site as compared to White essential workers, with odds ratios of 2.24 and 2.41, respectively. The disparity is somewhat smaller for Asian workers, but even they are 60 percent more likely to work in frontline jobs than similar White workers. As expected, hourly wages are inversely associated with frontline work. Low-wage essential workers are much more likely to be required to work on site than those with higher wages, even when gender and race/ethnicity are controlled. Overall, the chances of being a frontline worker in New York City are higher for low-wage, minority, and male essential workers.
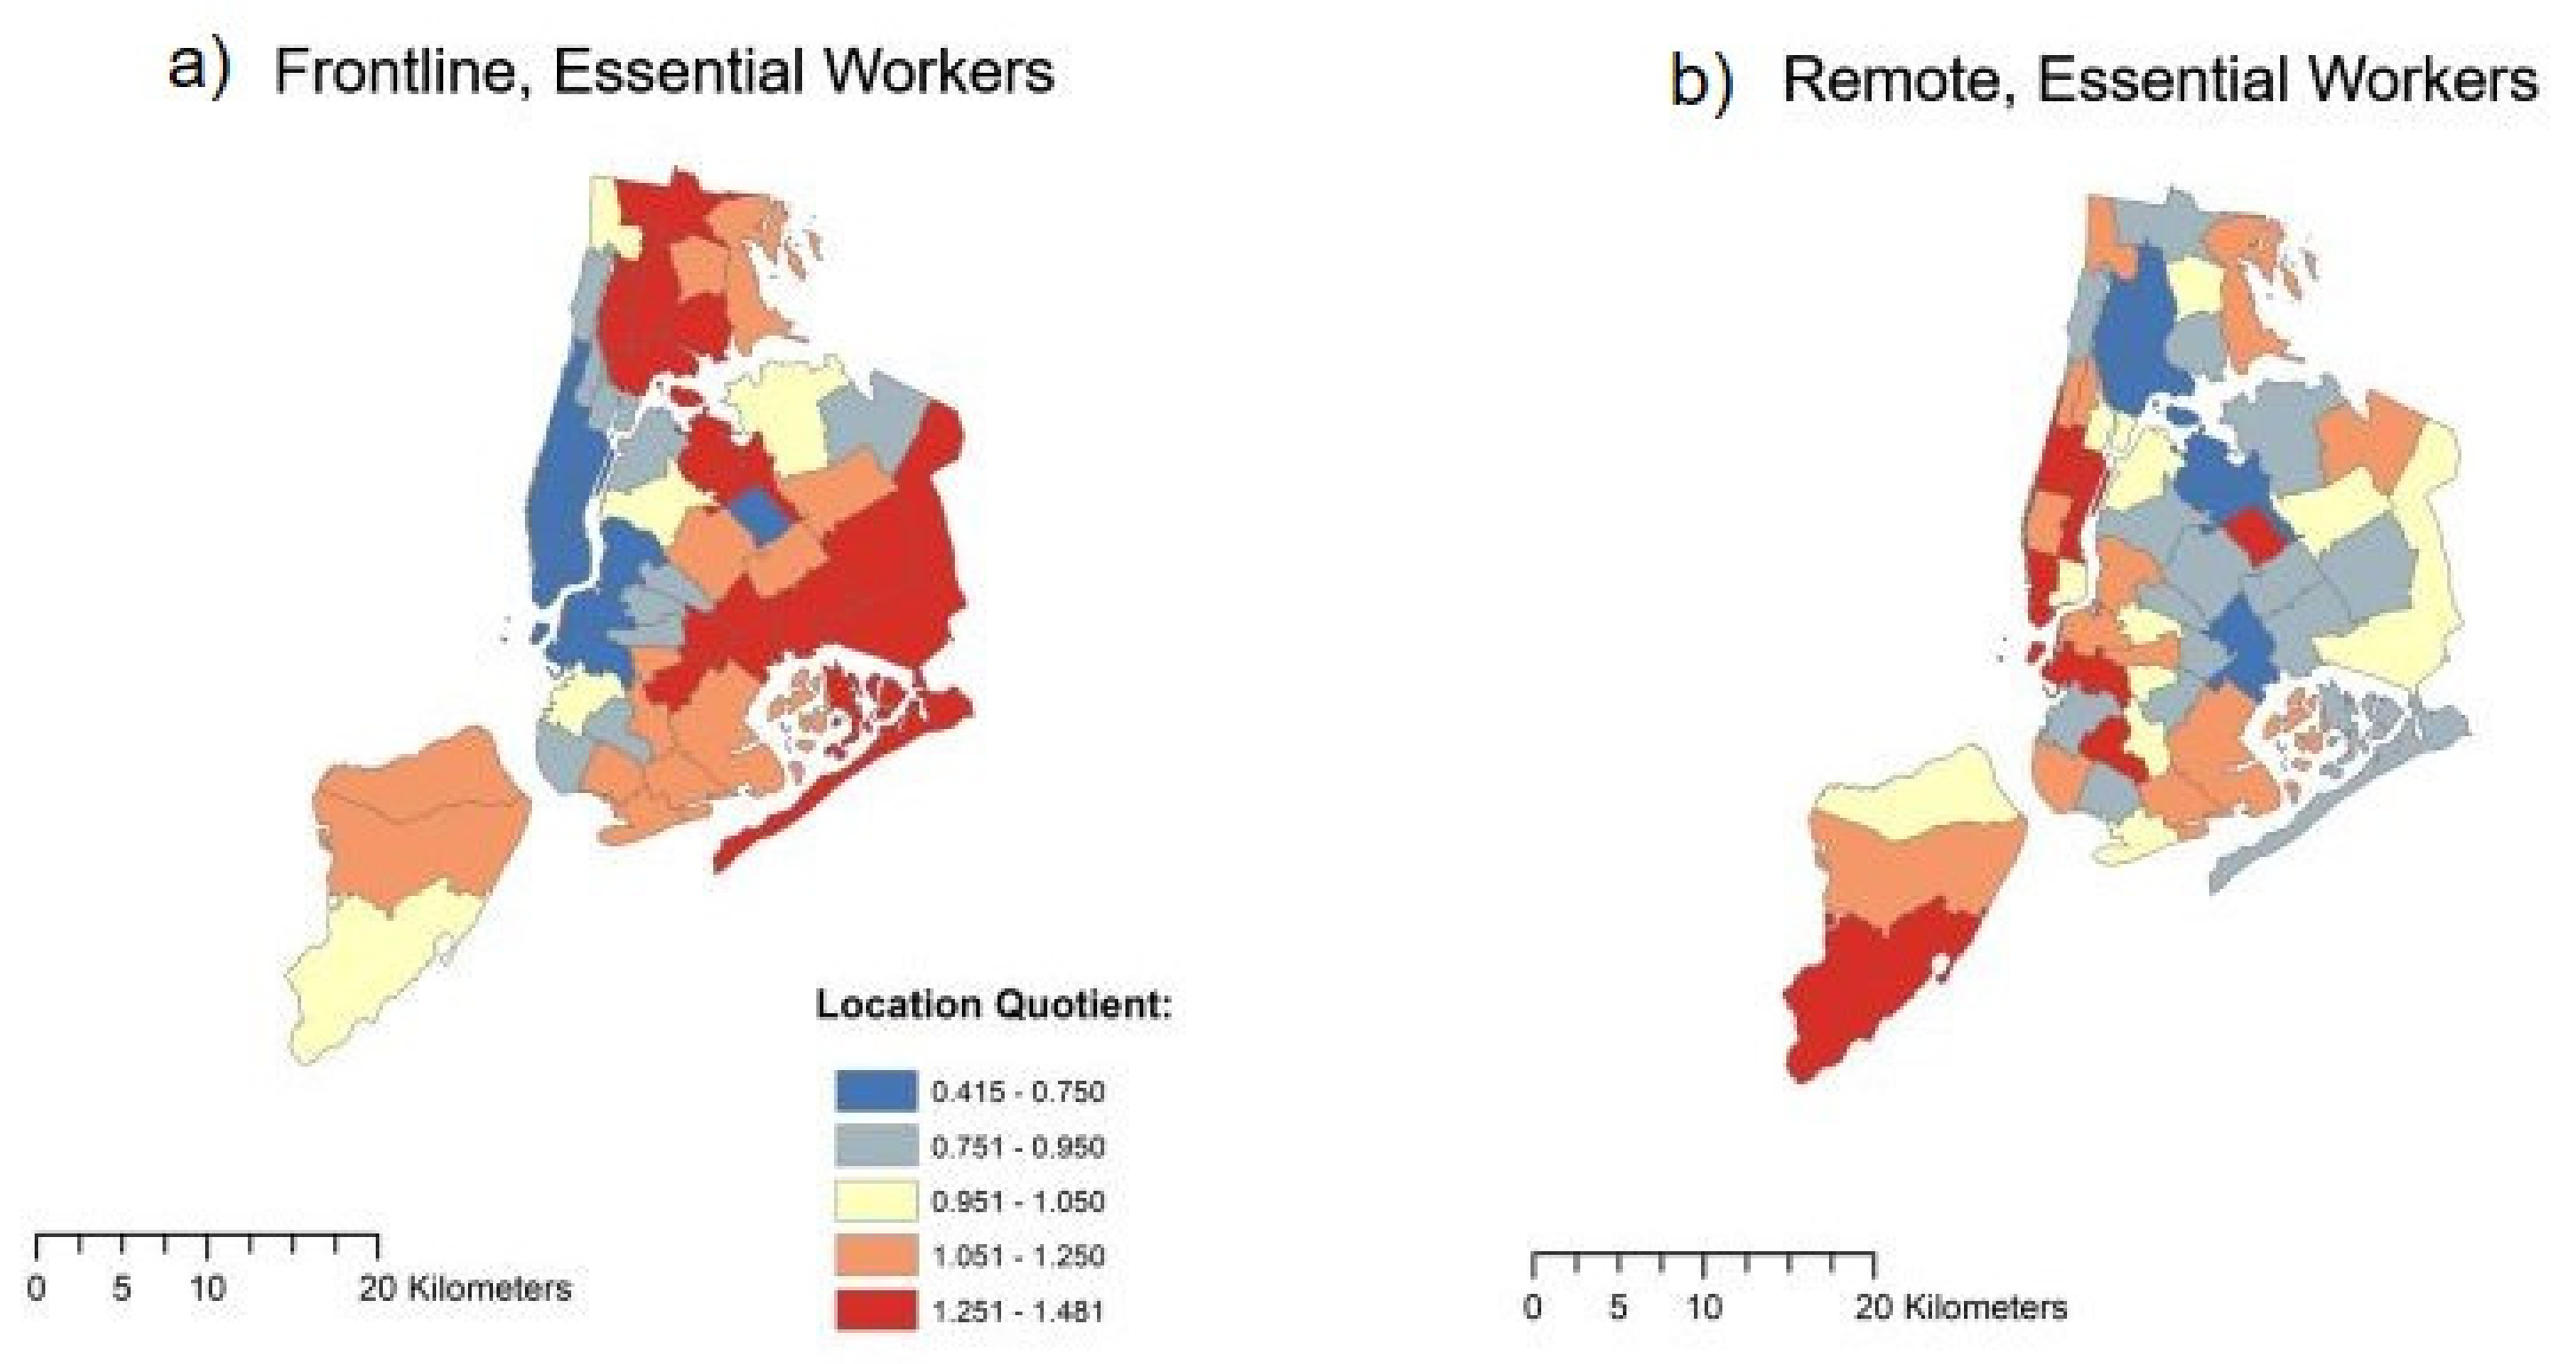
The residential locations of essential workers employed on site differ from those who work remotely. Frontline workers are concentrated in far-flung districts of New York City, whereas remote essential workers are more likely to live in central locations (Figure 2a). The location quotients show that frontline workers are concentrated in distant areas of Queens, Bronx, and Brooklyn (Figure 2a). Many of these areas are at the ends of long subway lines, or distant from the nearest subway line, and bus service in these areas can be slow, unreliable, and often involves a mode change between bus and subway [42].
In contrast, the residential locations of essential workers who can work remotely (Figure 2b) are concentrated in Manhattan, particularly lower Manhattan, and the Upper East and West Sides. Residential concentrations also exist in western Brooklyn, in neighborhoods like Brooklyn Heights. These are affluent areas located nearby the large concentrations of job sites in lower and central Manhattan. The City’s hub and spoke subway lines converge in these areas, so access to transit is convenient and trips are short. For some workers, walking and biking to work are feasible. An additional concentration of remote essential workers exists in southwestern Staten Island, a relatively affluent area, where average commute times are long. For those workers, the opportunity to work remotely results in substantial savings in commute time and cost.
3.2. Commutes of Frontline Workers
The impacts of gender and racial differences in transit use are evident in frontline workers’ mean commuting times. As expected, male frontline workers commute longer times than women frontline workers (Table 3). Minority frontline workers also commute longer times than White frontline workers, with Black workers of both sexes reporting the longest travel times.
Gender differences in commuting time vary among race/ethnicity groups. As reported in earlier analyses of New York City [32,33], Black workers have the smallest gender disparity in average commuting time, approximately one minute (Table 3). Black women who are frontline workers commute almost as long on average as their male counterparts. For Latinx frontline workers, men commute approximately 2.5 min more than women on average. Only Asian and White workers have gender disparities in travel time exceeding four minutes, 4.89 and 4.11 min, respectively.
Differences in transit use likely contribute to the gender and race/ethnic inequalities in commute time. Transit is crucial for Black and Latinx frontline workers of both sexes to get to their jobs, and is used by more than half of them (Figure 3). Although used less by Asian and White workers, transit is still an important commuting mode for these workers. Gender strongly influences frontline workers’ transit use. For each race/ethnicity group, women in frontline jobs use transit more than male frontline workers, although the magnitude of the gender gap varies by race/ethnicity (Figure 3). The biggest gender gap is apparent for White and Asian workers. While approximately half of White and Asian women who are frontline workers commute on transit, less than 40% of their male counterparts use this mode. Black and Latinx men and women both rely more on transit than either Whites or Asians. Black and Latinx men’s high use of transit reduces the gender gap, which is smaller for Black and Latinx workers than for White and Asian workers.
3.3. Commuting Disadvantage: Wages and Commuting Time
To evaluate commuting advantage and disadvantage, we created typologies examining how hourly wages and commuting time covary, first for all frontline workers (Figure 4), then for groups of frontline workers defined by gender and race/ethnicity (Figure 5). In the typologies, the upper right cell (quadrat) identifies commuting advantage—high wages and short commutes. Frontline workers in this category have commuting times of 15 min or less and hourly wages in the highest quartile. The lower left-hand cell identifies commuting disadvantage. Wages for workers in this cell are low, in the bottom quartile of the wage distribution, and their commuting times are long, over an hour. Each cell of the typology is shaded according to its relative concentration (quotient) of workers: red colors indicate that workers are overrepresented in that category compared to the overall workforce, and blue tones indicate that workers are underrepresented.
The typology for all frontline workers (Figure 4) indicates that wages for frontline workers are lower than for all workers in New York City, a trend also reported by Stringer [7]. Frontline workers are underrepresented in all cells with above-average wages and concentrated in cells with below-average wages. The degree of under-representation is higher for the top wage quartile than for the upper-middle quartile. At the other end of the wage distribution, the concentrations tend to be higher for the lowest wage quartile than for the lower middle quartile, indicating that frontline workers are over-represented most in the lowest wage quartile.
Despite their low wages, some frontline workers have long commutes of over an hour. The concentration (quotient) values indicate that for workers with below-average wages, the percentages of frontline workers commuting more than an hour are almost the same as the percentages for the entire workforce. However, low-wage workers are strongly concentrated in commutes of 45 min to an hour. For all other commuting time categories, the quotients are above 1.0 for frontline workers who have below-average wages, indicating their concentration in jobs that afford shorter commute trips. The typology confirms that frontline workers are clearly disadvantaged by low wages, although there is no distinct trend in commute time.
Commuting advantage and disadvantage differ by frontline workers’ gender and race/ethnicity (Figure 5). White frontline workers of both sexes enjoy a commuting advantage. They are overrepresented in jobs in the top wage quartile that involve short travel times to work. Similarly, White men and women frontline workers are underrepresented among those experiencing commuting disadvantage, that is, in low-wage jobs with long commuting times.
For Black men who are frontline essential workers, commuting disadvantage is the norm (Figure 5). They are strongly underrepresented in jobs in the highest wage quartile, and commute trips of 45 min or more are common. Commuting disadvantage is even more pronounced for Black women, who are over-represented in frontline jobs associated with below-average wages and long commuting times.
The commuting situations of Latinx frontline workers are similar to those of Black workers, but with a more pronounced concentration in low-wage jobs and less evidence of commuting time disadvantage. Latinx workers are concentrated in commuting disadvantage situations with below-average wages and commuting times that range up to an hour. Compared with Black frontline workers, more Latinx frontline workers of both sexes have short commutes; however, Latinx workers, especially women, are clustered more in below-average wage quadrats than any other ethnicity/race group. Although Latinx workers’ wage disadvantage stands out, the data also show a gender disparity, with Latinx women much more concentrated than men in jobs in the lowest quartile of hourly wages and requiring commutes of over an hour. Among gender/race groups, Latinas are the most concentrated in that category (quotient = 1.56), followed by Black women (quotient = 1.42). Both groups of women frontline workers are approximately 50% more likely than the entire resident workforce to hold jobs that involve very long commutes and low hourly wages.
As with Black and Latinx frontline workers, Asian workers are overrepresented in low-wage jobs, although they are also more concentrated than either group of workers in jobs in the highest wage quartile (Figure 5). In the quadrat with the highest average wages and commuting times of no more than 15 min, the quotients of 0.48 and 0.29 for Latinx men and women, and 0.49 and 0.47 for Black men and women, compare unfavorably with values of 0.75 and 1.04 for Asian men and women in the same situation. There is also evidence of gender disparity among Asian workers, as women’s and men’s disparate quotient values show overrepresentation of Asian women in frontline jobs with low wages and commuting times that exceed an hour (quotient = 1.27), and underrepresentation of Asian male workers (quotient = 0.83).
Comparing women across the four race/ethnicity groups underscores the commuting advantage of White women with respect to commute time. White female frontline workers have jobs close to home. They are the only frontline essential workers concentrated in the lowest commuting time category across the wage spectrum (Figure 5). Asian women come closest of all other female frontline worker groups to enjoying the same commuting advantage. The quotients indicate that Asian women are over-represented in most of the short commuting time quadrats. The low wages of Latinx women mean that they are over-represented only in low wage and short commute quadrats. As the mirror image of White female frontline workers, Black women are under-represented across the wage categories for the shortest commuting times.
4. Discussion
This analysis has underscored the importance of frontline, essential workers in the urban economy. In New York City, a global financial and producer services center, frontline workers comprise more than a third of the total resident workforce, according to definitions of frontline work that prevailed in the early phase of the COVID-19 pandemic. Frontline work is a major source of employment for minority men and women, employing half or more of Black and Latinx workers living in the city. Confirming the findings of other recent studies, our results indicate that Black and Latinx essential workers had less opportunity than others to work remotely [7,43]. The health and wellbeing of these frontline workers, and their commuting challenges, have been critical issues during the pandemic, when their essential contributions to the urban economy were finally unveiled and made starkly apparent to all urban residents [44].
The data also highlight key gender disparities in the frontline, essential workforce. Reflecting their concentration in sectors like manufacturing, transportation, and construction, men predominate among frontline essential workers, as was found in a recent, pioneering national study that used the same methodology [2]. As the pandemic went on, changing government policies added new sectors, notably primary and secondary education, to the frontline workforce, which made it more evenly balanced by gender. However, even using our restrictive definition of frontline, essential workers, our results show gender disparities in labor market outcomes and commuting trips. Women frontline workers are more concentrated than men in low-wage jobs that afforded limited economic compensation for traveling to work during the pandemic, revealing women frontline workers’ economic precarity, as noted in other recent studies [45]. The findings also highlight women’s greater reliance on public transit for their work trips, which heightened their commuting challenges. During the pandemic, frontline workers who depended on transit struggled with disrupted subway and bus services that often lengthened their commutes [46].
Our analysis also shows important differences in the residential geographies and average commute times of frontline and remote essential workers. Compared with essential workers who could work remotely, frontline workers were more likely to live on the edges of the city, where transit service is slow and often involves mode changes. In contrast, the map of remote workers’ residential locations shows high concentrations in centrally located neighborhoods in Manhattan and Brooklyn that are close to workplaces and public transit opportunities. Thus, paradoxically, workers living in the most accessible neighborhoods often could work remotely, while many workers living in peripheral neighborhoods had to work on-site and faced long commutes. Geographical challenges were especially significant for Black and Latinx frontline workers, whose long commute times indicate that racial segregation and associated income segregation isolated minority frontline workers far from workplaces and convenient rapid transit.
The race and ethnic inequalities in commuting disadvantage we have observed underscore white privilege. Black and Latinx frontline workers experience commuting disadvantage more than Asian or White frontline workers. Black workers commute the longest times and are strongly concentrated in long commutes to low-wage jobs. There is little gender difference in Black men’s and women’s commuting times, although long commutes intersect with poorly paid employment more strongly for Black women. For Latinx frontline workers, our results show high segmentation in low-wage jobs, but little association with commuting time. Thus, commuting disadvantage for Latinx frontline workers is primarily rooted in their low wages, as seen in research nationally [47] and for all Latinx workers in the New York metropolitan region [48]. At the same time, our findings show that Latinx women who hold frontline jobs are highly concentrated in low-wage, long-commute positions, evidence that they, along with Black women, face strong commuting disadvantage. In contrast, White frontline workers, both men and women, are more likely to enjoy commuting advantage, as evident in their concentration in jobs with above-average wages and short commute times. White women’s tendency to work close to home sets them apart from Asian, Latinx and Black women who also hold frontline jobs. Regardless of their wages, White women are over-represented in frontline jobs that involve short commute times, a commuting advantage that is not shared with women from the other race/ethnicity groups. These findings mirror those uncovered for the New York metropolitan region [32,33].
The uneven distribution of commuting (dis)advantage between men and women across ethnicity/race group is consistent with the broader literature on changes in daily mobility during the pandemic in New York City and elsewhere [12,15,16,17]. That literature reveals wide class and race/ethnic inequalities in mobility change among urban neighborhoods in response to stay-at-home policies and other pandemic restrictions, as mobility declined less among low-income groups. Our findings suggest that those changes may, in part, be rooted in labor market segmentation within the essential workforce, as men and women of color, earning low wages and living in peripheral neighborhoods, predominated in frontline work. This research also underlines the value of an intersectional analysis of employment during the pandemic to take account simultaneously of gender and race/ethnicity. Gender differences in frontline employment and commuting cannot be evaluated separately from the effects of race/ethnicity.
Along with the empirical findings, this research emphasizes the importance of analyzing place of work as a central dimension of urban labor markets and broader economic geographies. The past two decades have witnessed a steady increase in remote telework, enabled by digital technologies, which is re-making the geographical separation of home and work that emerged during the industrial revolution [49]. The COVID-19 pandemic fueled the growth of remote work, as those who could work at home were urged to do so. As remote work expands, our findings emphasize that a substantial proportion of essential jobs cannot be done remotely, exposing frontline workers to the costs, stresses, and risks of daily commuting trips [9,12]. In New York City, the workers who performed those jobs were not representative of the City’s overall resident workforce. Rather, they were disproportionately men and women of color, many of whom worked in low-wage jobs with long commuting trips. As the pandemic subsides, evidence is mounting that the trend towards remote work will continue, as some workers embrace the flexibility of working from home and as employers reduce costs by eliminating or downsizing workspaces [5]. This research suggests that such a shift will be uneven and unequal by race, ethnicity, and gender, rather than contributing to enhanced mobility justice. Given this, we support the call [44] for increased attention to the changing meanings of the commute in post-pandemic times.
The findings raise questions for future research. Having documented commuting advantage and disadvantage among frontline workers, additional research is needed to specify the effects of residential location and commute mode. While we recognize that the two are closely related, since transit service is more frequent and more reliable at central locations than in the peripheral areas where so many frontline workers live, it is crucial to evaluate their separate effects to avoid the well-intended calls for frontline workers to drive to work that occurred during the COVID-19 pandemic. The definitions of essential and frontline work that underpin our empirical analysis also warrant more investigation. Such definitions are socially constructed and contested. The definitions we used follow national criteria in the early period of the pandemic, but definitions changed over time. As remote work expands, it will be important to develop definitions of frontline work that are appropriate for non-pandemic times. For example, many workers in tourism, retail, and recreation sectors must work on-site; however, they were omitted from our definition due to the focus on essential workers during the pandemic. Investigating economic, social, and geographical dimensions of that wider frontline group would facilitate analyses of this crucial segment of the workforce. Our research is also constrained by the limited availability of fine-grained spatial and temporal data on the residential locations, daily routines, and well-being of frontline essential workers. Detailed surveys and daily mobility studies [50] for the pandemic period are important for understanding pandemic frontline workers’ social and geographical patterns in more detail.
5. Conclusions
The transformations of urban geographies discussed by Scott [1] accelerated during the pandemic. As digital technologies disseminated rapidly across many economic sectors, the divisions between remote workers and frontline workers took on added weight and significance, and employers relied on workers’ cognitive and social skills to innovate and adapt under unprecedented circumstances. Our results show that in New York City, frontline workers comprised more than one third of the resident workforce and even higher percentages of Black and Latinx workers. Rarely rewarded with high wages, frontline workers, especially minority workers, used public transit to commute. Concentrated in peripheral areas with poor transit service, many frontline workers endured long commuting trips that compounded the risks and stresses associated with frontline work. Minority workers of both sexes experienced commuting disadvantage, with Black frontline workers being the most disadvantaged, over-represented among workers commuting long times while earning low wages. The commuting advantage enjoyed by White frontline workers stands out, underlining the privilege of New York City’s White residents. The findings confirm the value of a spatial analysis of inequality, especially for understanding the nature and causes of social inequalities in mobility.
Author Contributions
Conceptualization, S.M. and V.P.; methodology, S.M. and V.P.; software, S.M.; formal analysis, S.M.; data curation, S.M.; writing—original draft preparation, V.P. and S.M.; writing—review and editing, S.M. and V.P. All authors have read and agreed to the published version of the manuscript.
Funding
The APC was funded by York University.
Institutional Review Board Statement
Not applicable.
Informed Consent Statement
Not applicable.
Data Availability Statement
The data that support this study are publicly available at the U.S. Census Bureau web site at: https://www.census.gov/programs-surveys/acs/microdata.html (accessed on 6 February 2023).
Conflicts of Interest
The authors declare no conflict of interest.
References
- Scott, A.J. A world in emergence: Notes toward a resynthesis of urban-economic geography for the 21st century. Urban Geogr. 2011, 32, 845–870. [Google Scholar] [CrossRef]
- Blau, F.D.; Koebe, J.; Meyerhofer, P.A. Who are the essential and frontline workers? Bus. Econ. 2021, 56, 168–178. [Google Scholar] [CrossRef] [PubMed]
- Dalton, M.; Groen, J.A. Telework during the pandemic. Mon. Labor. Rev. 2022, 3, 1–15. Available online: https://0-www-jstor-org.brum.beds.ac.uk/stable/10.2307/48658255 (accessed on 24 October 2022).
- Cockayne, D. The feminist economic geographies of working from home and “digital by default” before, during, and after COVID-19. Can. Geogr. 2021, 65, 499–511. [Google Scholar] [CrossRef] [PubMed]
- Hostettler Macias, L.; Ravalet, E.; Rérat, P. Potential rebound effects of teleworking on residential and daily mobility. Geogr. Compass 2022, 16, e12657. [Google Scholar] [CrossRef]
- Scott, D.M.; Dam, I.; Wilton, R.D. Investigating the effects of social influence on the choice to telework. Environ. Plann. A 2012, 44, 1016–1031. [Google Scholar] [CrossRef]
- Stringer, S. New York City’s Frontline Workers; Office of the New York City Comptroller: New York, NY, USA, 2020. Available online: https://comptroller.nyc.gov/reports/new-york-citys-frontline-workers/ (accessed on 1 November 2021).
- Halvorsen, A.; Wood, D.; Jefferson, D.; Stasko, T.; Hui, J.; Reddy, A. Examination of New York City Transit’s bus and subway ridership trends during the COVID-19 pandemic. Transp. Res. Rec. 2021. [Google Scholar] [CrossRef]
- Kaufman, S.M.; Moss, M.L.; McGuinness, K.B.; Cowan, N.R.; Rudner, C.E.; Schwartz, S.I.; Wu, H.L. Transportation during Coronavirus in New York City; NYU Wagner Rudin Center for Transportation Planning: New York, NY, USA, 2020. [Google Scholar]
- Barbieri, D.M.; Lou, B.; Passavanti, M.; Hui, C.; Hoff, I.; Lessa, D.A.; Sikka, G.; Chang, K.; Gupta, A.; Fang, K.; et al. Impact of COVID-19 pandemic on mobility in ten countries and associated perceived risk for all transport modes. PLoS ONE 2021, 16, e0245886. [Google Scholar] [CrossRef] [PubMed]
- Beck, M.J.; Hensher, D.A.; Nelson, J.D. Public transport trends in Australia during the COVID-19 pandemic: An investigation of the influence of bio-security concerns on trip behaviour. J. Transp. Geogr. 2021, 96, 103167. [Google Scholar] [CrossRef] [PubMed]
- Sy, K.T.L.; Martinez, M.E.; Rader, B.; White, L.F. Socioeconomic disparities in subway use and COVID-19 outcomes in New York City. Am. J. Epidemiol. 2021, 190, 1234–1242. [Google Scholar] [CrossRef] [PubMed]
- Eisenmann, C.; Nobis, C.; Kolarova, V.; Lenz, B.; Winkler, C. Transport mode use during the COVID-19 lockdown period in Germany: The car became more important, public transport lost ground. Transp. Policy 2021, 103, 60–67. [Google Scholar] [CrossRef] [PubMed]
- Zhang, N.; Wei, J.; Wang, P.; Dung, C.-H.; Zhao, P.; Leung, K.; Su, B.; Cheng, R.; Li, Y. Changes in local travel behaviour before and during the COVID-19 pandemic in Hong Kong. Cities 2021, 112, 103139. [Google Scholar] [CrossRef]
- Hu, S.; Chen, P. Who left riding transit? Examining socioeconomic disparities in the impact of COVID-19 on ridership. Transp. Res. Part D Transp. Environ. 2021, 90, 102654. [Google Scholar] [CrossRef]
- Lou, J.; Shen, X.; Niemeier, D. Are stay-at-home orders more difficult to follow for low-income groups? J. Transp. Geogr. 2020, 89, 102894. [Google Scholar] [CrossRef] [PubMed]
- Kar, A.; Le, H.T.; Miller, H.J. What is essential travel? Socioeconomic differences in travel demand in Columbus, Ohio, during the COVID-19 lockdown. Ann. Am. Assoc. Geogr. 2022, 112, 1023–1046. [Google Scholar] [CrossRef]
- Palm, M.; Allen, J.; Liu, B.; Zhang, Y.; Widener, M.; Farber, S. Riders who avoided public transit during COVID-19: Personal burdens and implications for social equity. J. Am. Plan Assoc. 2021, 87, 455–469. [Google Scholar] [CrossRef]
- Brough, R.; Freedman, M.; Phillips, D.C. Understanding socioeconomic disparities in travel behavior during the COVID-19 pandemic. J. Reg. Sci. 2021, 61, 753–774. [Google Scholar] [CrossRef]
- Chang, S.; Pierson, E.; Koh, P.W.; Gerardin, J.; Redbird, B.; Grusky, D.; Leskovec, J. Mobility network models of COVID-19 explain inequities and inform reopening. Nature 2021, 589, 82–87. [Google Scholar] [CrossRef]
- Hu, L. Gender differences in commuting travel in the US: Interactive effects of race/ethnicity and household structure. Transportation 2021, 48, 909–929. [Google Scholar] [CrossRef]
- Feng, Z.; Boyle, P. Do long journeys to work have adverse effects on mental health? Environ. Behav. 2014, 46, 609–625. [Google Scholar] [CrossRef]
- Lowe, K.; Mosby, K. The conceptual mismatch: A qualitative analysis of transportation costs and stressors for low-income adults. Transp. Policy 2016, 49, 1–8. [Google Scholar] [CrossRef]
- Assoumou Ella, G. Gender, mobility, and COVID-19: The case of Belgium. Fem. Econ. 2021, 27, 66–80. [Google Scholar] [CrossRef]
- Crane, R.; Takahashi, L. Sex changes everything: The recent narrowing and widening of travel differences by gender. Public Works Manag. Policy 2009, 13, 328–337. [Google Scholar] [CrossRef]
- Kwon, K.; Akar, G. Have the gender differences in commuting been shrinking or persistent? Evidence from two-earner households in the US. Int. J. Sustain. Transp. 2021, 16, 1121–1130. [Google Scholar] [CrossRef]
- Blau, F.D.; Kahn, L.M. The gender wage gap: Extent, trends, and explanations. J. Econ. Lit. 2017, 55, 789–865. Available online: http://0-www-jstor-org.brum.beds.ac.uk/stable/2117795 (accessed on 15 March 2021). [CrossRef]
- Sivak, M. Female drivers in the United States, 1963–2010: From a minority to a majority? Traffic Inj Prev. 2013, 14, 259–260. [Google Scholar] [CrossRef]
- US Department of Transportation. Office of Highway Policy Information. 2022. Available online: https://www.fhwa.dot.gov/ohim/onh00/bar8.htm (accessed on 15 November 2022).
- Blumenberg, E.; Schouten, A.; Brown, A. Who’s in the driver’s seat? Gender and the division of car use in auto-deficit households. Transp. Res. A-Pol. 2022, 162, 14–26. [Google Scholar] [CrossRef]
- Gilow, M. “It’s work, physically and logistically”: Analyzing the daily mobility of employed mothers as Domestic Mobility Work. J. Transp. Geogr. 2020, 85, 102693. [Google Scholar] [CrossRef]
- Preston, V.; McLafferty, S. Revisiting gender, race and commuting in New York. Ann. Assoc. Am. Geogr. 2016, 106, 300–310. [Google Scholar] [CrossRef]
- McLafferty, S.; Preston, V. Who has long commutes to low-wage jobs? Gender, race, and access to work in the New York Region. Urban Geogr. 2019, 9, 1270–1290. [Google Scholar] [CrossRef]
- Dingel, J.I.; Neiman, B. How many jobs can be done at home? J. Public Econ. 2020, 189, 104235. [Google Scholar] [CrossRef]
- Logan, J.R.; Stults, B. The Persistence of Segregation in the Metropolis: New Findings from the 2020 Census. Diversity and Disparities Project; Brown University: Providence, RI, USA, 2021; Available online: https://s4.ad.brown.edu/Projects/Diversity (accessed on 15 November 2022).
- Jiao, J.; Azimian, A. Exploring the factors affecting travel behaviors during the second phase of the COVID-19 pandemic in the United States. Transp. Lett. 2021, 13, 331–343. [Google Scholar] [CrossRef]
- Dunatchik, A.; Gerson, K.; Glass, J.; Jacobs, J.A.; Stritzel, H. Gender, parenting, and the rise of remote work during the pandemic: Implications for domestic inequality in the United States. Gend. Soc. 2021, 35, 194–205. [Google Scholar] [CrossRef] [PubMed]
- Moens, E.; Lippens, L.; Sterkens, P.; Weytjens, J.; Baert, S. The COVID-19 crisis and telework: A research survey on experiences, expectations and hopes. Eur. J. Health Econ. 2022, 23, 729–753. [Google Scholar] [CrossRef] [PubMed]
- New York State Comptroller. Impact of the COVID-19 Pandemic on Subway Ridership in New York City. 2022. Available online: https://www.osc.state.ny.us/reports/osdc/impact-covid-19-pandemic-subway-ridership-new-york-city (accessed on 22 November 2022).
- Metropolitan Transit Authority. Day-by-Day Ridership Numbers. 2022. Available online: https://new.mta.info/coronavirus/ridership (accessed on 22 November 2022).
- US Department of Homeland Security (DHS). Advisory Memorandum on Identification of Essential Critical Infrastructure Workers during COVID-19 Response; US Department of Homeland Security (DHS): Washington, DC, USA, 19 March 2020. [Google Scholar]
- Ley, A. A Long, Slow Slog to Get to Work. The New York Times, 2 June 2022; p. A18. [Google Scholar]
- Asfaw, S. Racial and ethnic disparities in teleworking due to the COVID-19 pandemic in the United States: A mediation analysis. Int. J. Environ. Res. Public Health 2022, 19, 4680. [Google Scholar] [CrossRef] [PubMed]
- Plyushteva, A. Essential workers pandemic mobilities and the changing meaning of the commute. Geogr. J. 2022, 188, 459–463. [Google Scholar] [CrossRef]
- González-Sánchez, G.; Olmo-Sánchez, M.I.; Maeso-González, E. Challenges and strategies for post-COVID-19 gender equity and sustainable mobility. Sustainability 2021, 13, 2510. [Google Scholar] [CrossRef]
- Goldbaum, C. Subway Shutdown: New York Closes System for First Time in 115 Years. The New York Times, 7 May 2020, p. A14. Available online: https://www.nytimes.com/2020/05/06/nyregion/nyc-subway-close-coronavirus.html (accessed on 16 November 2022).
- Mora, M.T.; Davila, A. The Hispanic-White Wage Gap Has Remained Wide and Relatively Steady: Examining Hispanic-White Gaps in Wages, Unemployment, Labor Force Participation, and Education by Gender, Immigrant Status and Other Subpopulations; Economic Policy Institute: Washington, DC, USA, 2018. Available online: https://eric.ed.gov/?id=ED593384 (accessed on 20 January 2022).
- McLafferty, S.; Preston, V. Spatial mismatch and labor market segmentation for African-American and Latina women. Econ. Geogr. 1992, 68, 406–431. [Google Scholar] [CrossRef]
- Villeneuve, P.; Rose, D. Gender and the separation of employment from home in metropolitan Montreal, 1971–1981. Urban Geogr. 1988, 9, 155–179. [Google Scholar] [CrossRef]
- Huang, J.; Kwan, M.P. Uncertainties in the assessment of COVID-19 risk: A study of people’s exposure to high-risk environments using individual-level activity data. Ann. Am. Assoc. Geogr. 2022, 112, 968–987. [Google Scholar] [CrossRef]
Figure 1.
Remote and frontline essential workers by gender and race/ethnicity group.

Figure 2.
Residential locations of (a) frontline and (b) remote essential workers by PUMA based on location quotients.
Figure 2.
Residential locations of (a) frontline and (b) remote essential workers by PUMA based on location quotients.

Figure 3.
Percent of frontline workers commuting by transit by gender and race/ethnicity.

Figure 4.
Wage and commute time typology for frontline workers.

Figure 5.
Typologies of commuting time categories (horizontal axis) by hourly wage quartiles (vertical axis) for frontline workers by gender and race/ethnicity.
Figure 5.
Typologies of commuting time categories (horizontal axis) by hourly wage quartiles (vertical axis) for frontline workers by gender and race/ethnicity.


Table 1.
Essential and non-essential workers living in New York City.
| Number of Workers (est) | Percent of Total (est) | |
|---|---|---|
| Total | 4,081,238 | 100% |
| Non-essential | 1,263,392 | 30.96% |
| Essential | 2,817,846 | 69.04% |
| Frontline | 1,527,060 | 37.42% |
| Remote | 1,290,786 | 31.63% |
Table 2.
Logistic regression estimates for predicting frontline work vs. remote work (reference value), essential workers only.
Table 2.
Logistic regression estimates for predicting frontline work vs. remote work (reference value), essential workers only.
| Odds Ratio ** | 95% Confidence Interval (95%) | |
|---|---|---|
| Woman * | 0.497 | 0.494–0.500 |
| Log hourly wages | 0.565 | 0.563–0.567 |
| Latinx | 2.415 | 2.400–2.432 |
| Black | 2.237 | 2.221–2.252 |
| Asian | 1.619 | 1.607–1.632 |
| Constant | 6.000 | 5.925–6.078 |
* Reference values are man and white. **All odds ratios are significant, p < 0.01.
Table 3.
Commuting time (mean min.) for frontline workers by gender and race/ethnicity.
| Average Commuting Time (min) | Gender Difference | ||
|---|---|---|---|
| Men | Women | ||
| Asian | 33.42 | 28.53 | 4.89 |
| Black | 35.95 | 34.84 | 1.11 |
| Latinx | 32.21 | 29.89 | 2.32 |
| White | 32.56 | 28.45 | 4.11 |
Disclaimer/Publisher’s Note: The statements, opinions and data contained in all publications are solely those of the individual author(s) and contributor(s) and not of MDPI and/or the editor(s). MDPI and/or the editor(s) disclaim responsibility for any injury to people or property resulting from any ideas, methods, instructions or products referred to in the content. |
© 2023 by the authors. Licensee MDPI, Basel, Switzerland. This article is an open access article distributed under the terms and conditions of the Creative Commons Attribution (CC BY) license (https://creativecommons.org/licenses/by/4.0/).
Share and Cite
MDPI and ACS Style
McLafferty, S.; Preston, V. Geographies of Frontline Workers: Gender, Race, and Commuting in New York City. Sustainability 2023, 15, 3429. https://0-doi-org.brum.beds.ac.uk/10.3390/su15043429
AMA Style
McLafferty S, Preston V. Geographies of Frontline Workers: Gender, Race, and Commuting in New York City. Sustainability. 2023; 15(4):3429. https://0-doi-org.brum.beds.ac.uk/10.3390/su15043429
Chicago/Turabian StyleMcLafferty, Sara, and Valerie Preston. 2023. "Geographies of Frontline Workers: Gender, Race, and Commuting in New York City" Sustainability 15, no. 4: 3429. https://0-doi-org.brum.beds.ac.uk/10.3390/su15043429
Note that from the first issue of 2016, this journal uses article numbers instead of page numbers. See further details here.