

TecSB: An Open Web Tool of Energy Efficiency and Solar Energy Integration in Mexican Buildings


1
Tenologico de Monterrey, Escuela de Ingeniería y Ciencias, Ave. Eugenio Garza Sada 2501, Monterrey 64849, NL, Mexico
2
Tecnologico de Monterrey, Escuela de Ingeniería y Ciencias, Vía Atlixcáyotl 5718, Reserva Territorial Atlixcáyotl, Puebla 72453, PUE, Mexico
*
Author to whom correspondence should be addressed.
Sustainability 2023, 15(4), 3630; https://0-doi-org.brum.beds.ac.uk/10.3390/su15043630
Submission received: 30 December 2022
/
Revised: 6 February 2023
/
Accepted: 13 February 2023
/
Published: 16 February 2023
(This article belongs to the Special Issue Sustainable Approaches to Reduce Building Energy Consumptions)
Abstract
:There is a need for stakeholders in the construction sector to evaluate energy efficiency and renewable energy generation alternatives appliable to buildings at early design stages. In this regard, public and private organizations have developed tools to compare different options. It was observed that when the objective was to create nearly Zero Energy Buildings (nZEB), the number of tools was still scarce. With this aim, this work presents a new, free digital tool that can predict, among others, energy consumption, energy generation, emissions savings, and payback time. For this purpose, different alternatives applicable to the roof, such as phase change material (PCM), insulation, and reflective paint, as well as to window-to-wall ratios (WWR), with four different glass technologies, can be evaluated. Furthermore, four renewable energy systems were available for comparison: the solar thermal collector (ST), photovoltaic (PV), flat hybrid solar collector (PVT), and low-concentration parabolic solar collector (LCPVT). Our tool was developed based on the results of transient dynamic building simulations of both residential and non-residential building models located in the hot semi-arid conditions of Monterrey, Mexico. Among the results, the small impact of using only reflective paint, the need to combine PCM with insulating material to obtain the best energy savings, and the large impact on emissions savings when using an LCPVT stand out.
1. Introduction
Sprawling urbanization is stressing the urban environment and natural ecosystems. Moreover, this stress is exacerbated by the effects of climate change. It is known that worldwide, cities consume over 78% of global energy and generate over 60% of greenhouse gas emissions [1]. Even though in 2020, the direct and indirect emissions from buildings decreased due to the COVID-19 pandemic, building sector emissions have been consistently increasing by 1% per year since 2010 [2]. Furthermore, this scenario is expected to worsen with the increase in population, the growing access to energy in developing countries, and the expansion of built-up areas, with greater use of air conditioning systems due to the increase in temperatures [3]. In this context, solutions proposed by the construction sector should seek to mitigate climate change by integrating both energy efficiency measures and clean energy generation.
The combination of these strategies is seen as the best mechanism for driving change in the construction industry in both developed and developing countries [4]. However, to be truly effective, one cannot lose sight of the differences in energy use between the two strategies. On the one hand, developing countries (OECD) have managed to decrease energy consumption in buildings by 3% over the last ten years, while developing countries (non-OECD) have increased energy consumption by 42% since 2000 [5]. Even with these generalities in the behavior between countries, individual behaviors stand out. That is the case in Mexico because, unlike the remaining OECD countries, it has maintained a steady building energy consumption growth of 10% over the last ten years [6]. For this reason, any solution proposed must respond to the local character of each country without losing sight of the global objectives.
Without losing sight of the above, one of the concepts that integrate energy generation with efficient buildings is nearly Zero Energy Buildings (nZEB) [7]. In these, having achieved less required energy for operation and having implemented cost-effective energy efficiency measures, it is possible to think about changing the source of energy generation from non-renewable to renewable and, specifically, to energy generated in the building itself [8]. Here, the idea of energy efficiency takes on great relevance, as it is key to achieving objectives related to the sustainability of buildings. Additionally, not only using different practical measures, such as the optimal design of the building envelope [9] or efficient Heating, Ventilation, and Air Conditioning (HVAC) systems [10], but placing the concept within the political agenda, as in the case of the Energy Efficiency First Principle in Europe, is important [11]. The latter particularly promotes solutions that regulate energy demand as long as they are more cost-effective than energy infrastructure investments. However, to answer this challenge, stakeholders involved in making decisions regarding the design and construction of a building must have sufficient information to allow them to combine the best energy efficiency practices and renewable energy technologies.
The aforementioned becomes even more relevant when the design is in its initial stages since this allows timely decisions to be made that can avoid unnecessary additional costs in the future. This is when the simulation of buildings becomes important since it allows different scenarios to be compared to finally choose the best option. However, according to the US Department of Energy, this strategy is applied to only 20% of new buildings [12]. One of the factors that most influences the application of this strategy is the need for advanced technical knowledge and great expertise in the use of the programs. Therefore, the availability of simple and easy-to-use simulation tools remains an area of opportunity.
Looking at the tools that have been developed, with a focus on either energy efficiency strategies applied in building, renewable energy, or both, different software was found around the world (Table 1). In Europe, as part of their energy policy, several countries promote the use of tools developed by governments to promote energy-efficient buildings. This is the case in Spain with Calener-VYP software, used for the energy rating of residential buildings, which, when compared to other software, presented very good results [13]. The limitation of this tool is that it is only available to select Spanish climates. Along the same line, the United States has developed a wide variety of tools, such as Green Energy Compass and RESNET. The first, highlighted for its ease of use, allows government agencies to promote district-scale energy projects. The second seeks through a system of points to define an energy efficiency standard in residential buildings leading to Net Zero Homes [14]. Chen et al. [15] developed an evaluation tool to help the designers to determine nZEB in China. They implemented a demonstrative case to observe the best strategies to improve the performance of external windows and use intelligent lighting controlled by zones for the city of Guangzhou. The EDGE International Building Certification has a free online app available where the parameters cataloged in the certification can be calculated for approval. Even though the tool is mainly used by raters and builders, it can also be used for academic and professional purposes by different stakeholders. One of its great limitations is that it generates the baseline according to the construction characteristics of the country where the app is being used [16]. In this same sense, in Germany, the Passive House Standard has its own evaluation tool, the Passive House Planning Package. This tool plays a key role in the certification process, but to receive the correct results, it is necessary to invest in many hours of training, so inexperienced users would be very limited [17]. Focusing on renewable energy, there are RETScreen from Canada and HOMER from the USA. The first provides detailed energy, cost, financial, and emissions analysis; the second is an optimization tool for renewable energy systems. Both are usually used together with excellent results if the user has experience using the software [18]. Australia has its own residential building assessment system and relies on four different tools, the NatHERS rating tools [19], whose goal is to enforce the National Building Code (NCC).
With these tools, the annual energy behavior of buildings can be predicted, and currently, after years of using the platforms, governments have taken a step forward by analyzing the data collected, allowing the stakeholders to make better decisions regarding the construction of buildings [20]. Unlike the previous tools, ZEBRA is a tool developed in the United Kingdom with the intention of simulating design alternatives for zero-carbon buildings by combining energy efficiency and renewable energy generation strategies. With a primary pedagogical purpose, this tool needs approximately 33 inputs to generate a reliable building model. Among its drawbacks, the options for energy efficiency measures are limited; for example, implementing phase change materials in the envelope is not available, and energy generation is only calculated by photovoltaic systems [21]. In Mexico, there are two building assessment tools developed in relation to energy performance. In the first ones, “Herramienta NOM-008-ENER-2001” for non-residential buildings and “Herramienta NOM-020-ENER-2010” for residential buildings, it is possible to compare the projected building with a reference one with the aim of calculating the energy budget framed within national regulations. One of the great limitations, despite the ease of use, is the need to previously know the regulations to understand the tool [22]. The second tool, “Ener-Habitat”, compares the thermal performance of the roof and wall construction systems of a building envelope in the climatic conditions of the main cities of the Mexican Republic, but the type of materials that can be evaluated is limited [23].
Based on the above, it was found that access to easy-to-use energy simulation tools with the option of evaluating innovative materials for energy efficiency design and renewable energy technologies continues to be limited. Additionally, in Mexico to date, there is not a free tool available to evaluate the environmental and economic aspects of design alternatives that lead to nearly Zero Energy Buildings. Therefore, the aim of this paper is to present a free digital building simulation tool (TecSB) that evaluates: (1) different energy efficiency scenarios in roofs and windows and (2) the solar energy generation strategies on-site for residential and non-residential buildings in Monterrey, Mexico. Additionally, the users can evaluate the results from an environmental aspect, identifying the saved greenhouse gas emissions and, from the economic aspect, the possibility to compare the payback times. The energy efficiency measures available in the tool focus on evaluating roof and window alternatives. This is due to the high solar radiation that the roof receives throughout the year and the large energy gain/losses that can occur through the windows, so improving the design of this part of the envelope can have a high impact on the final energy consumption of the building [24]. The tool was created with the purpose of empowering communities, government, and final users to select not only the best design option leading to nZEB but also to evaluate alternatives for buildings retrofits. The TecSB tool was programmed “in house” with software that was freely available online using the results of validated dynamic energy simulations that were carried out with more specialized programs such as Design Builder and TRNSYS, which are described below.
2. Materials and Methods
The methodological process carried out was divided into two main parts. Firstly, the data to develop the digital tool was generated from building energy simulations with specialized software; second, based on the results of the first stage, the digital tool (TecSB) was developed to be available online (Figure 1).
2.1. Simulation Validation
In a previous work [25], the simulation process for a single zone was validated with the BESTEST benchmark case 600 FF of the ANSI/ASHRAE 140-001 Standard [26]; the result had an error rate of less than 1%. The software used for the simulation was Design Builder (V6.1.8.021), which is specialized software for transient energy simulations based on the Energy Plus simulation engine. Complex models can be implemented in it, and one of its greatest advantages is its graphical interface for making 3D models. The extensive results section compares the performance of different design alternatives [27]. Additionally, in the same previous study, an experimental validation with two identical experimental chambers was carried out. The experimental data were compared to the numerical simulations, obtaining a Root-mean-square error of 0.26 °C and a Root-mean-square-percentage error of 1%. With these validations, excellent matching with the real building data was demonstrated, allowing for the extrapolation of results for the developed tool. Regarding the verification of the solar generation technologies, the hybrid solar LCPVT system was considered in this study. The results were compared with those obtained by Acosta-Pazmiño et al. [28]. The case under analysis focused on a transient simulation of a sports and wellness center in Monterrey developed in the TRNSYS environment. The maximum percentage differences between solutions were about 1.3 and 1.2% for the thermal and electrical energy yields, respectively.
2.2. Data Generated from Simulations
2.2.1. Weather Conditions
The tool was developed to evaluate different scenarios of energy efficiency and power generation under the climatic conditions of the city of Monterrey, which is one of the most important commercial and industrial capitals of Mexico. The location of Monterrey is given by its latitude of 25.65° N and longitude of −100.29° W (Figure 2); additionally, its altitude is 534 m above sea level. In general, Mexico divides its weather in to nine types, placing Monterrey in a dry climate. To be more specific, this city is recognized as a warm steppe dry climate, Bsh by Köppen [29], with higher cooling demands. The parameters that define its climatic conditions are an annual average temperature and relative humidity of 22.7 °C and 63.8%, respectively. The coldest month is December, with an average temperature of 6 °C and temperatures below 0 °C. The hottest month is June, with an average temperature of 20 °C and temperatures above 42 °C. Regarding solar radiation, the Global Horizontal Average Hourly radiation ranges from 347 to 511 Wh/m2 for a typical year [30].
For the energy simulations carried out to generate the base information of the tool, we worked with EPW climate files. These contained information from 2003 to 2017 and statistically show the behavior of a typical year in Monterrey.
2.2.2. Energy Use Intensity by Buildings
The normalized energy consumptions were obtained from transient building energy simulations. First, the typical consumption of a base case was determined, and later, the base case was improved by adding new layers of materials on the roof of the model. The models generated for the study were two mono-zone buildings: one for a residential building and another for a non-residential building (Figure 3). The two models have the same area of 56 m2 (7 × 8 m) and a total height of 3 m. The windows of the residential and non-residential buildings were south-oriented. The only differences between the two models were the building occupancy hours and window-to-wall ratio. The non-residential building was modeled with only one window of 6 × 1.50 m, while the residential model had two windows of 1.50 × 1.50 m. The activity schedule simulated was based on the typical building type, as shown in Table 2.
Regarding the construction base materials, the walls were composed of 0.0025 m thick gypsum board on the outside and inside that was covered by a layer of 0.1 m thick burnt clay bricks. The roof was composed of 0.01 m thick cement mortar on the outside and, on the inside, a 0.15 m thick concrete slab and 0.01-m of thick gypsum mortar. The window was made of 6 mm thick clear single glass. The selected options correspond to the national regulations for the building envelope in Mexico [32,33], and their thermal resistances are shown in Table 3. These mandatory regulations in Mexico for new buildings and renovations seek to limit heat gain through the envelope in residential and non-residential buildings when typical Mexican construction systems are applied.
As mentioned above, the energy efficiency measures focused on improving the building envelope, specifically the roof and the windows. For this, it was decided to combine different materials selected in function for availability in the national market, cost, and thermal properties. For the roof, insulating materials, reflective paint (RP), and Phase Change Material (PCM) were chosen (Table 4). The first due to its high capacity to slow the thermal wave due to its small thermal conductivity [34], the second due to its high reflectance and, consequently, the possibility of avoiding overheating [35], and the last due to its high capacity for latent heat storage [36]. The insulating materials that were evaluated were: Extruded Polystyrene panel (XPS), which, being an insulating material with the possibility of getting wet, is ideal for installation in the external envelope of buildings; Rock Wool panel (LDR) panel, which, being composed mainly of mineral and inorganic materials, guarantees good thermal and acoustic behavior; and finally, Expanded Polystyrene panel (EPS) which is a spongy, extra light plastic material. Reflective paint has a highly reflective coating based on acrylic resins; its common use in Mexico is as an application over the waterproofing asphalt membrane layer. Regarding the PCMs, the material used in the platform was a macroencapsulated inorganic salt ready for construction. In addition, PCM used for building envelopes has a melting point temperature close to the comfort zone, especially when it is applied to the layers closest to the interior building, which allows for keeping the temperature constant while the phase change is taking place.
Regarding glazing technologies, four different types of glass were compared. These were selected because they are the most common in local construction and because of their high thermal response [42]. Window performance was characterized primarily by its overall heat transfer coefficient (U-Factor), Solar Heat Gain Coefficient (SHGC), and Visible Transmittance (VT). In the case of this research, tinted, reflective, and low-emissivity glasses were the options evaluated (Table 5). Furthermore, two different window-to-wall ratios (WWR) for a south-oriented transparent wall were evaluated (40% and 100%). Finally, the strategies applied on the roof and those on the windows were utilized in five types of buildings: office, hospital, restaurant, educational, and residential, originating 122 simulations that generated the necessary information for the development of the platform (Figure 4).
2.2.3. Energy Generation by Solar Technology
This section covers the amount of solar energy that can be transformed into electricity and heat. For this, four technologies were evaluated: photovoltaic panels (PV), solar thermal collectors (ST), flat hybrid solar collectors (PVT), and low-concentration parabolic solar collectors (LCPVT). Photovoltaic panels can generate electrical energy through the separation of electrons due to the energy received from the photons that make up the sun’s rays. Solar thermal collectors can capture solar radiation and transform it into thermal energy to heat a fluid. Hybrid solar collectors counteract some of the disadvantages of photovoltaic panels and thermal solar collectors. They have the versatility to produce electrical energy and thermal energy simultaneously. In order to compare the results of the different generation systems, it was assumed in the simulations carried out prior to the platform that all the systems would have a DC-AC conversion efficiency of 92% and the area per panel was 3 m2, except for LCPVT which was 4.5 m2. Finally, for the thermal energy generation systems, the storage capacity was 50 L for each m2 of the collector. In addition, for simulations, a panel inclination of 24.4° and a north-south orientation were considered.
In order to compare the results of the different generation systems, it was considered in the simulations carried out prior to the platform that all the systems would have a concentration ratio (CR) of 1, apart from the LCPVT solar system, which has a CR of 14.8. The area per panel was 3 m2 for PV and PVT systems, while the thermal and LCPVT collectors had an installation area of 4.5 m2. For the thermal energy generation systems (ST and LCPVT), the storage capacity was 50 L for each m2 of the collector, and a panel inclination of 25.4° north-south oriented was considered. Finally, Table 6 shows the annual average thermal and electrical efficiencies of each system, as well as the rated efficiencies used for all technologies under analysis.
The energy simulations were carried out to determine the normalized annual production of energy (electrical and thermal) of each of the selected technologies. Figure 5 shows the simplified simulation scheme of a hybrid LCPVT collector in the TRNSYS simulation studio. Red lines represent hot water and blue lines cold water.
2.3. TecSB Sustainable Building Calculator
The TecSB Sustainable Building Calculator is a free virtual platform that evaluates energy efficiency measures applicable to the roof and windows of buildings and the possibility of on-site energy generation. The tool is designed to be applied to residential and non-residential buildings located in the city of Monterrey, Mexico. The data collected from the steps above were used as base information to extrapolate the results. Later, the environmental impact was estimated, and the cost and payback time were calculated, according to the electricity tariff for the region.
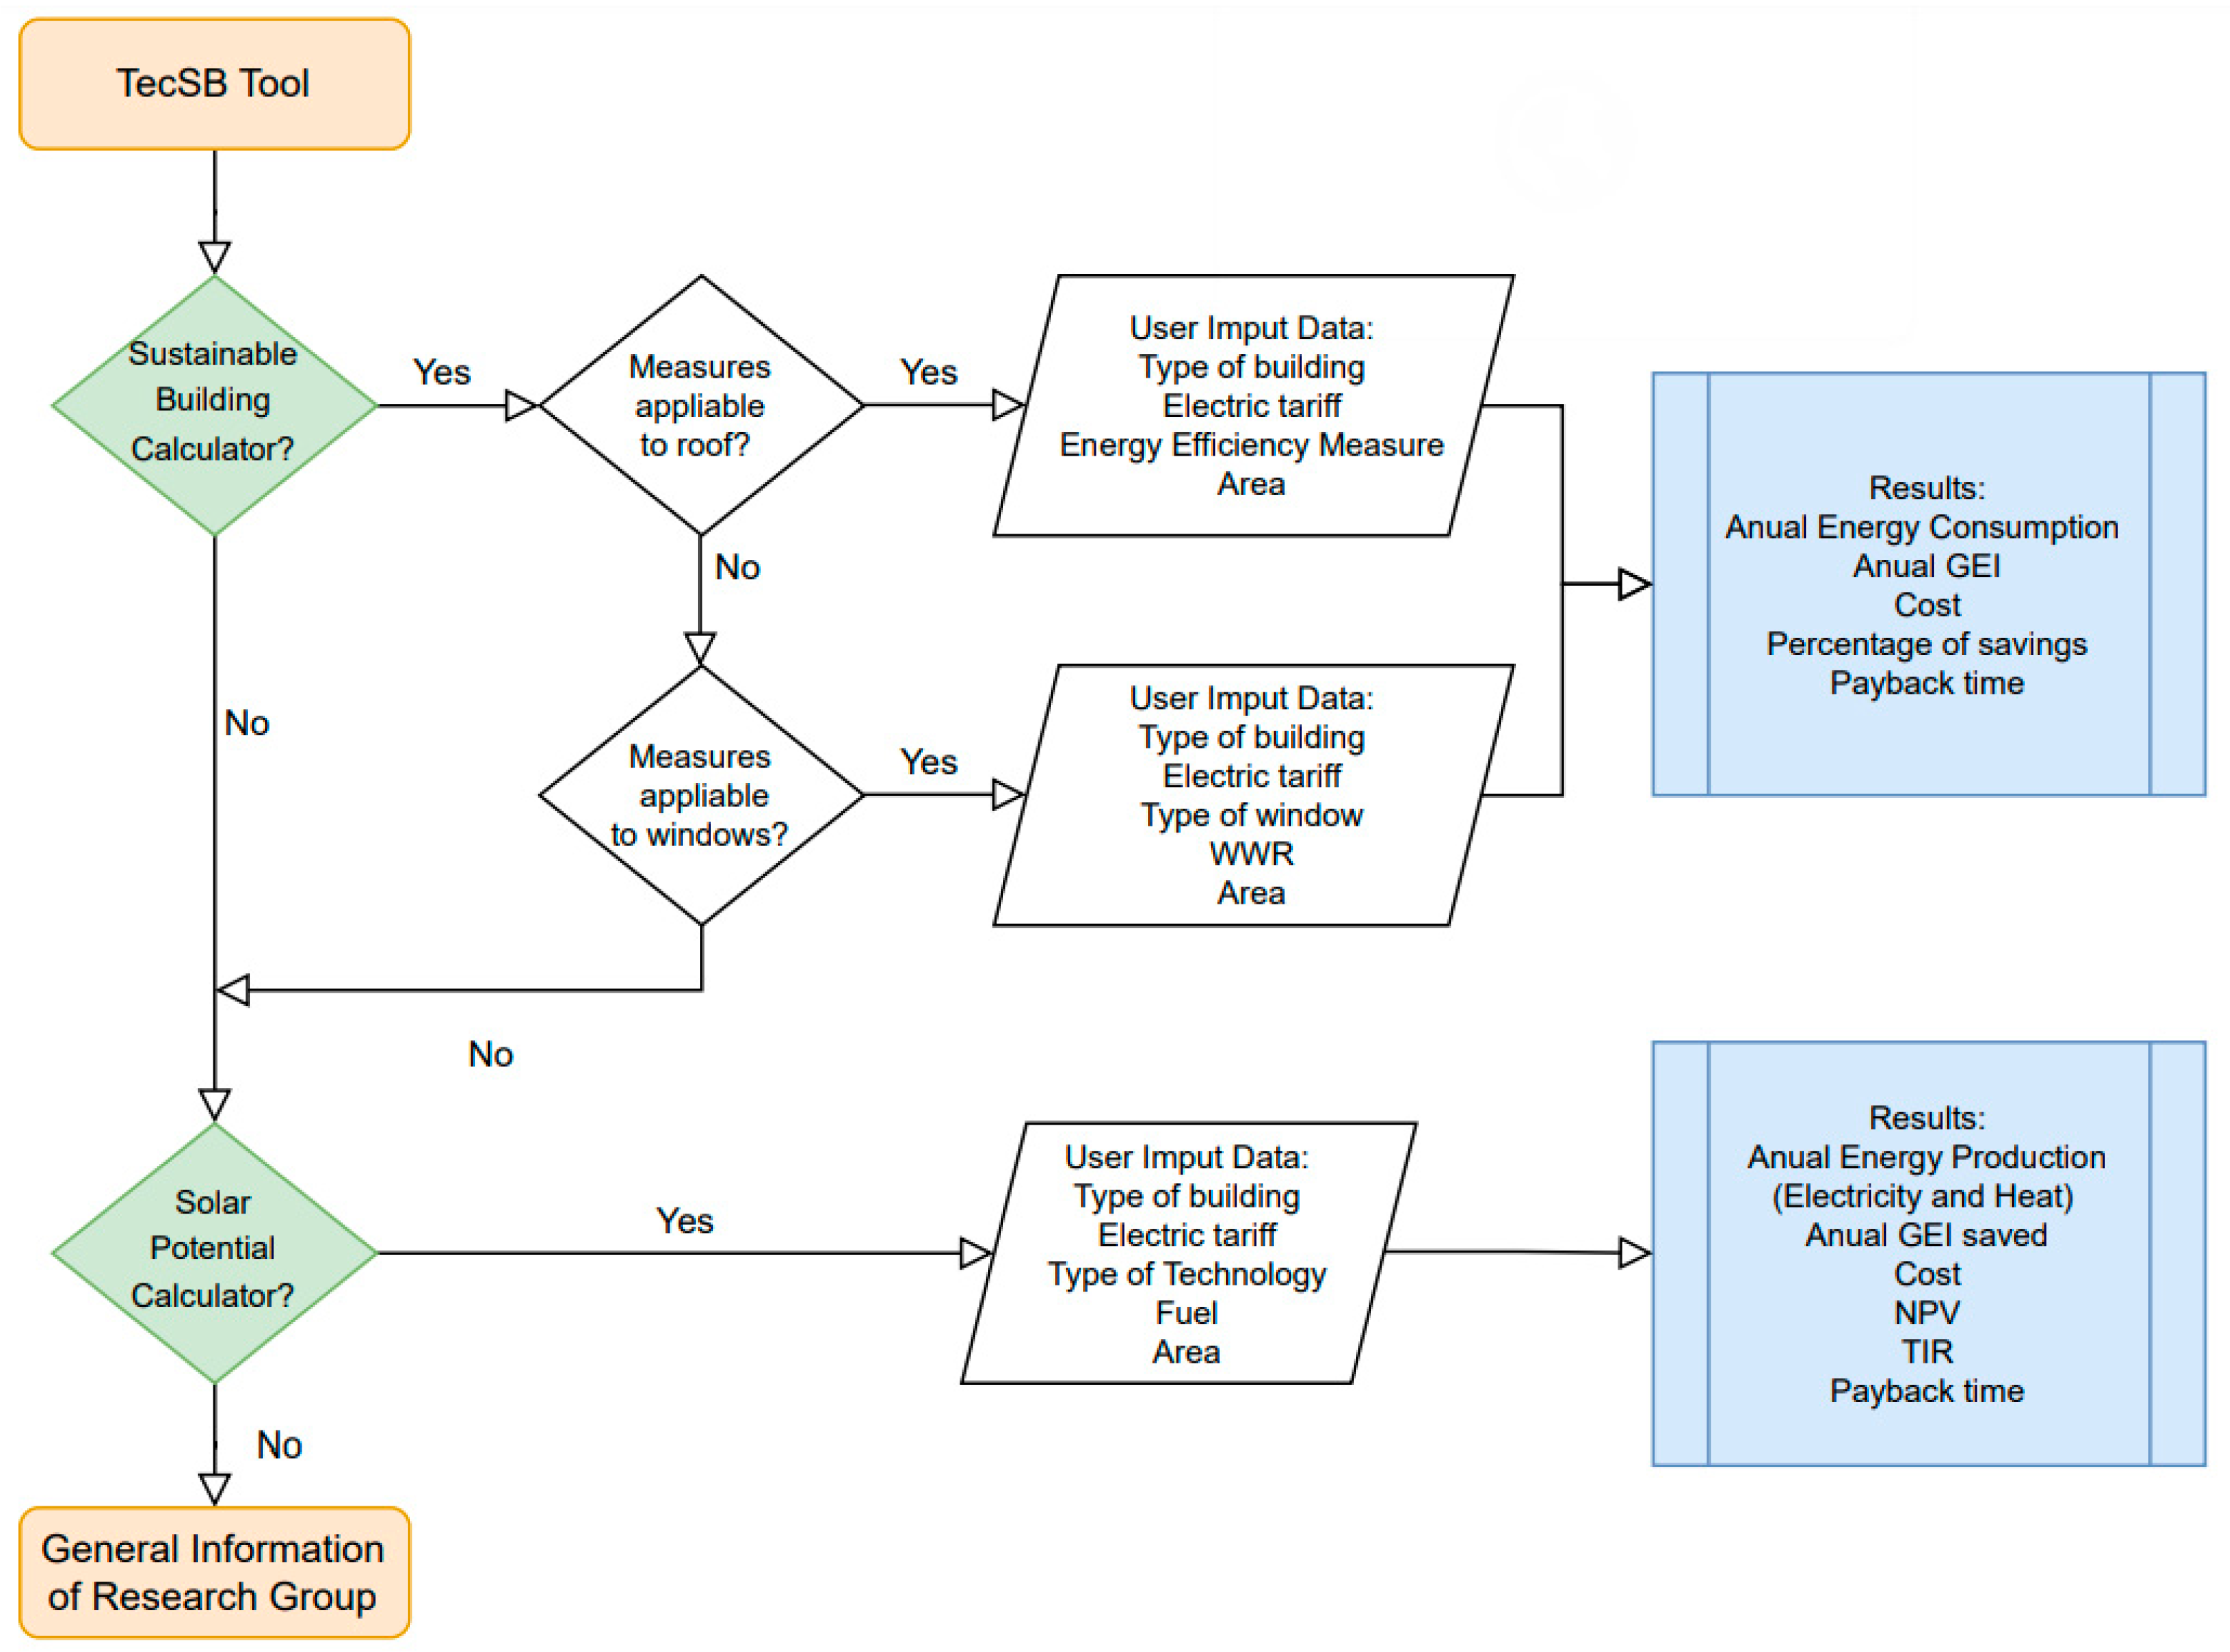
For easy user understanding, the TecSB is separated into “Sustainable Buildings” and “Solar Potential” calculators (Figure 6). The Sustainable Building Calculator has three main sections; this work focused on the second and third sections only. The second section, called Application of Technologies on Roofs, allows the users to evaluate different technologies in roofs, and the last section, called Application of Technologies in Windows, evaluates technologies in windows. These two sections were designed in the same way. Depending on the evaluation the user wants to perform, the following input data must be entered: type of building, energy tariff, type of glazing, south window-to-wall ratio, and roof area. After the user enters the input data, the tool internally multiplies the base case EUI by the area of the building to be evaluated and compares it with the result of the same procedure but with the improved case (where the energy efficiency measure has been applied).
The Solar Potential Calculator identifies the annual energy production for the available technologies. The user should select the type of building, the type of electricity tariff, the fuel used for the generation of heat that would be deployed, and, finally, the roof area to be evaluated. The tool multiplies the normalized annual production of energy (electrical and thermal) by the area to obtain the annual energy production according to the selected technology.
Based on the energy consumption analysis, it is possible to perform an economic impact study to establish the payback time and cost savings. To obtain more accurate results, four different types of CFE (Federal Electricity Commission) tariff [44] are available within the tool; two for residential use (DAC and 1C), one for commercial use (PDBT), and another for industrial use (GDMTH). Once the above results have been calculated and the energy tariff has been selected, it is possible to calculate the Payback Time (PBT) by using Equation (1), [45]:
where:
- IF = Inflation rate;
- d = Discount rate;
- co = Initial investment;
- CS = Annual monetary savings.
Another objective of the platform is to deliver an estimated value of the equivalent tons of carbon dioxide emitted (tCO2e) by each type of building and identify the savings in emissions by implementing one of the energy efficiency measures. For this, the energy consumption between 2018 and 2019 for four non-residential buildings and during 2019 for one residential building was monitored. The idea was to determine the consumption pattern and establish a percentage of annual consumption for electrical and thermal energy (Table 7). Additionally, a carbon emissions factor was determined based on the type of fuel used to generate energy in the region. For electricity, the factor was 0.000057704 tCO2e/kWh, and for heat, it was 0.00062806 tCO2e/kWh [46]. Then, the Total Carbon Intensity was calculated with Equation (2).
Total Carbon Intensity = %Electricity × 0.000057704 + %Heat × 0.00062806
Finally, TecSB uses the Total Carbon Intensity (tCO2e/kWh) calculated by building type, the Energy Use Intensity (kWh/m2) from the simulations, and the area (m2) indicated by the user to determine the impact on emissions. The calculation process is carried out for both the base case and the generated scenario; this identifies the impact of the case under study. The results lead the user to be able to relate the reduction in energy consumption with a reduction in the greenhouse gases generated. In addition, the tool provides a visual and numerical relationship between the amount of greenhouse gases saved and the equivalent that a typical departmental unit of the city of Monterrey would emit.
3. Results
The results are divided into two sections. First, the possibility of decreasing energy consumption by analyzing the reduction of the thermal load through the envelope; and second, the energy generated from different solar technologies. In order to compare the results corresponding to each section, a building with a roof area of 300 m2 was simulated on the platform. In the case of the energy efficiency measures applied to the roof, the results were always compared to a base case without any strategy applied. That is, the characteristic of the model with the applied technology only differs from the base model in the application of the technology to be evaluated. On the other hand, for energy generation from solar technologies, the roof area was the one that defined the guideline in the calculations.
3.1. Different Building Envelopes on Different Types of Buildings
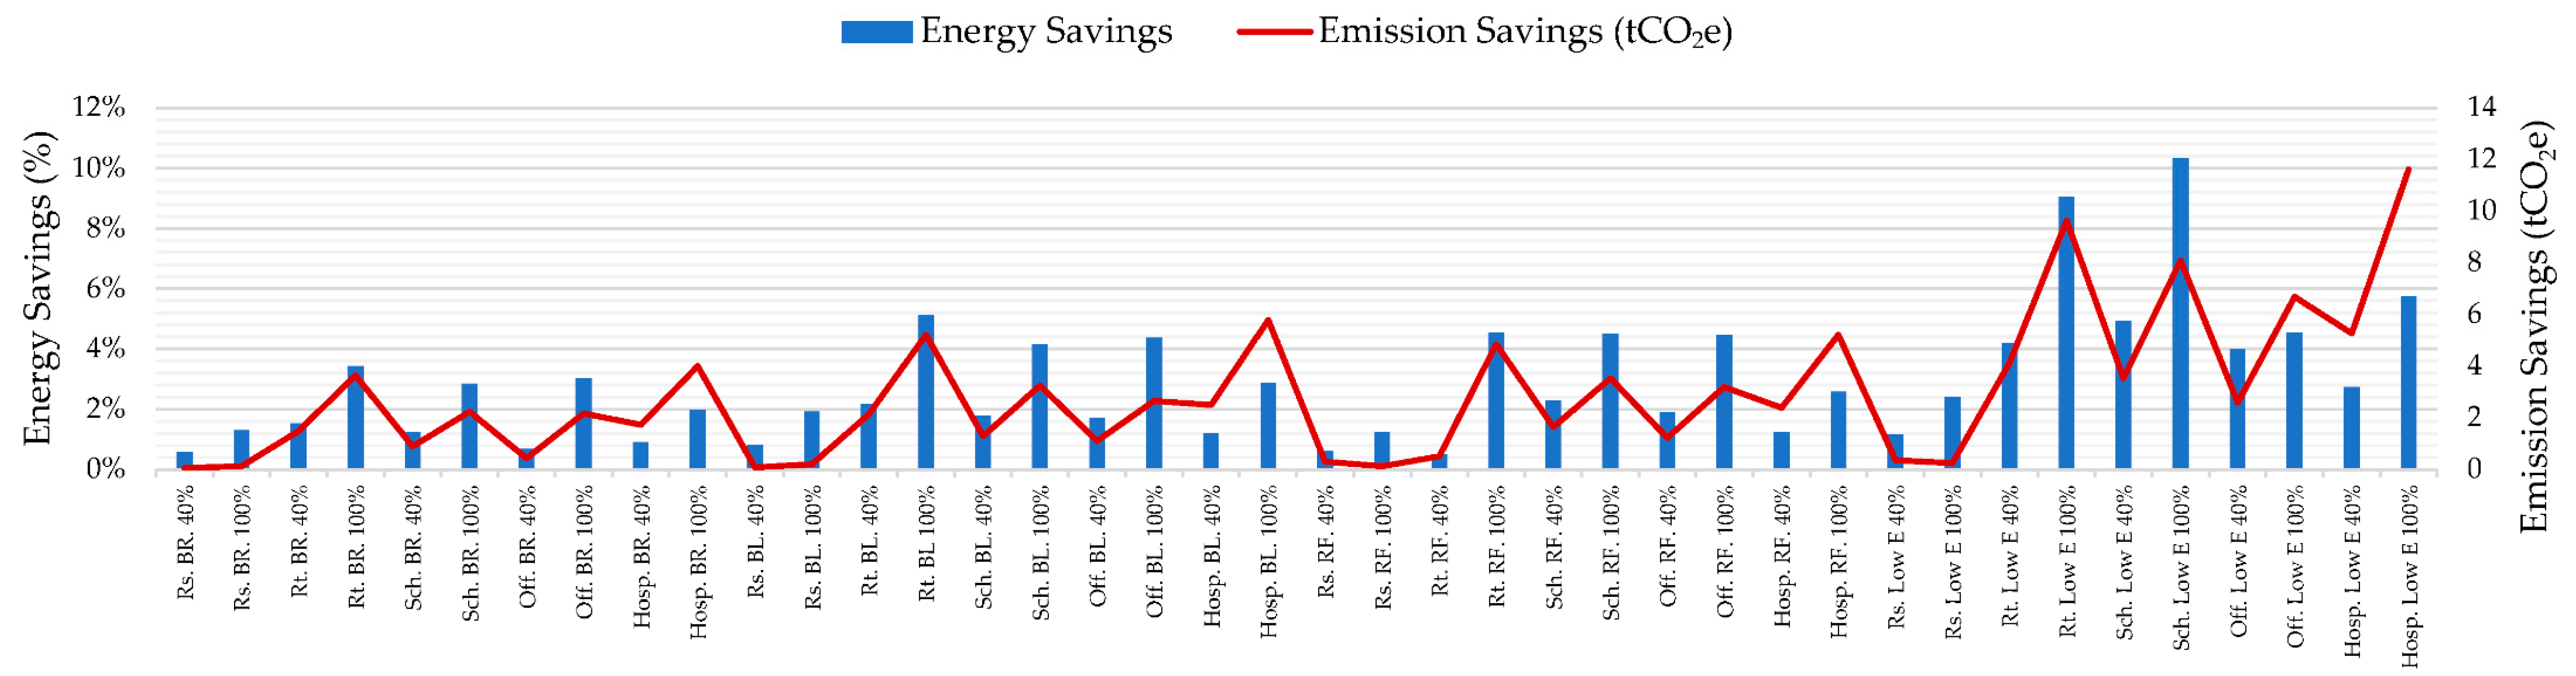
Figure 7 shows the energy (%) and emission (tCO2e) savings when different energy efficiency measures are applied to the roof of different types of buildings. The best result for any type of building was when PCM was combined with XPS insulation and reflective paint, with a maximum energy saving of 19.31% for the residential building. In contrast, it could be seen that the lowest energy savings for any type of building, between 0.21% and 0.51%, occurred when reflective paint was applied as the only measure of efficiency. In general, the best result was always for residential buildings, except in the cases where only reflective paint was used and when PCM with reflective paint was evaluated. It was also observed that having lower solar gains due to lower WWR in the south facade had a positive influence on energy savings. When the non-residential buildings were compared, it was observed that the building with the greatest energy savings was always the restaurant, except in the cases of only PCM and PCM with reflective paint, as before. The building that regularly had the lowest savings was the hospital. It is believed that this large difference was due to the fact that the restaurant was closed on Sundays while the hospital worked on weekends with a split air conditioner operating schedule. Regarding emission savings, it is noteworthy that the hospital always had the highest savings for any efficiency strategy that had been applied. Being a building with high energy consumption, one percentage point of energy savings is equivalent to much more energy saved than any other type of building. This leads to much higher emissions savings compared to any other type of building.
Regarding the behavior of the envelope materials, alone or combined, some results stand out. The lowest energy savings occurred when only reflective paint was applied. Insulating materials without combination with any other strategy represented savings between 5.51% and 15.53%, with the XPS having the best results. This result shows that although the difference between the resistance is more than double, as in the case of EPS and XPS, in addition to corroborating that it is important to include materials with high thermal resistance, it does not represent significant savings. In the cases evaluated, the maximum difference between applying EPS and XPS was 2.06%. The combination of reflective paint with XPS was improved at the end than when the first was combined with LDR or EPS, increasing energy savings between 1.16% and 3.06%. The same happened when PCM was combined with the insulating materials. The combination of PCM and XPS presented between 1.02% and 3.29% more savings compared to the other two insulators.
Figure 8 shows the results obtained regarding energy (%) and emissions (tCO2e) savings when the base glazing of the model was replaced by a more efficient one. It was observed that, in all cases, greater energy savings were achieved when the efficiency strategy was applied in a 100% WWR. This is because when the energy consumption of the base case at 40% WWR is compared with that of 100% WWR, the latter is much higher. Therefore, by implementing an energy efficiency strategy in the case of 100% WWR, the impact achieved will be higher in percentage than the result of the 40% WWR case. If the energy savings are compared by type of glass, the results are obvious: Double Low E presented the greatest savings for any type of building. Comparing the results for the different WWRs, it was observed that in the case of 40% WWR, the greatest energy savings for reflective glass and Low E was when they were applied to schools, with 2.28% and 4.93%, respectively. When bronze or blue tint were applied, the best result was obtained for the restaurant, 1.42% and 2.17%, respectively. When the 100% WWR case was analyzed, the greatest energy savings were obtained by schools with Low E, 10.32%. The second-best performance was for restaurants, with 3.42%, 5.12%, and 4.55% when bronze tinted, blue tinted, and reflective windows were applied, respectively. Regarding emissions savings, the performance was the same as the roof efficiency measures. The hospital, with 100% WWR, was the one that obtained the best savings, between 4.01 and 11.6 tCO2e.
Another parameter that the TecSB tool shows is the payback time. Table 8 and Table 9 show the results for the different measures applied in the different types of buildings with two electricity tariff options. As expected, the payback was always lower when the electricity tariff was more expensive. In the case of the strategies applied to the roof, insulation presented the lowest payback values. Of the three options, EPS presented the lowest values for all cases, thus making it the best in residential buildings and hospitals. When the PCM was applied as an isolated measure, the payback time was greater than 6 years; for schools, it was the worst case at 19.33 years. This is because this is an emerging technology with very high prices, and in the case of Mexico, it is an imported product. When PCM is combined with insulating materials, the economic result can be more attractive, as in the case of the hospital, where the payback time was 3.39 years. The combination of the three main strategies showed the best results for residential buildings, between 2.80 and 3.04 years. This suggests that this can be a very good option when looking for strategies to apply on roofs.
In the case of the efficiency measures applied to windows, it was observed that in the residential case, the minimum payback time was 30 years, which is why it is not recommended for this type of building (Table 9). Similarly, Low E double glass could only be an alternative for hospitals with 100% WWR because it has a payback time of close to 10 years; for other buildings, it was greater than this, so it is not recommended. The best results were for blue and bronze tint, with a payback time of 1.14 years for the first applied in the office and 3.18 years for the second applied in the hospital, both with 100% WWR.
3.2. Heat and Power Generation
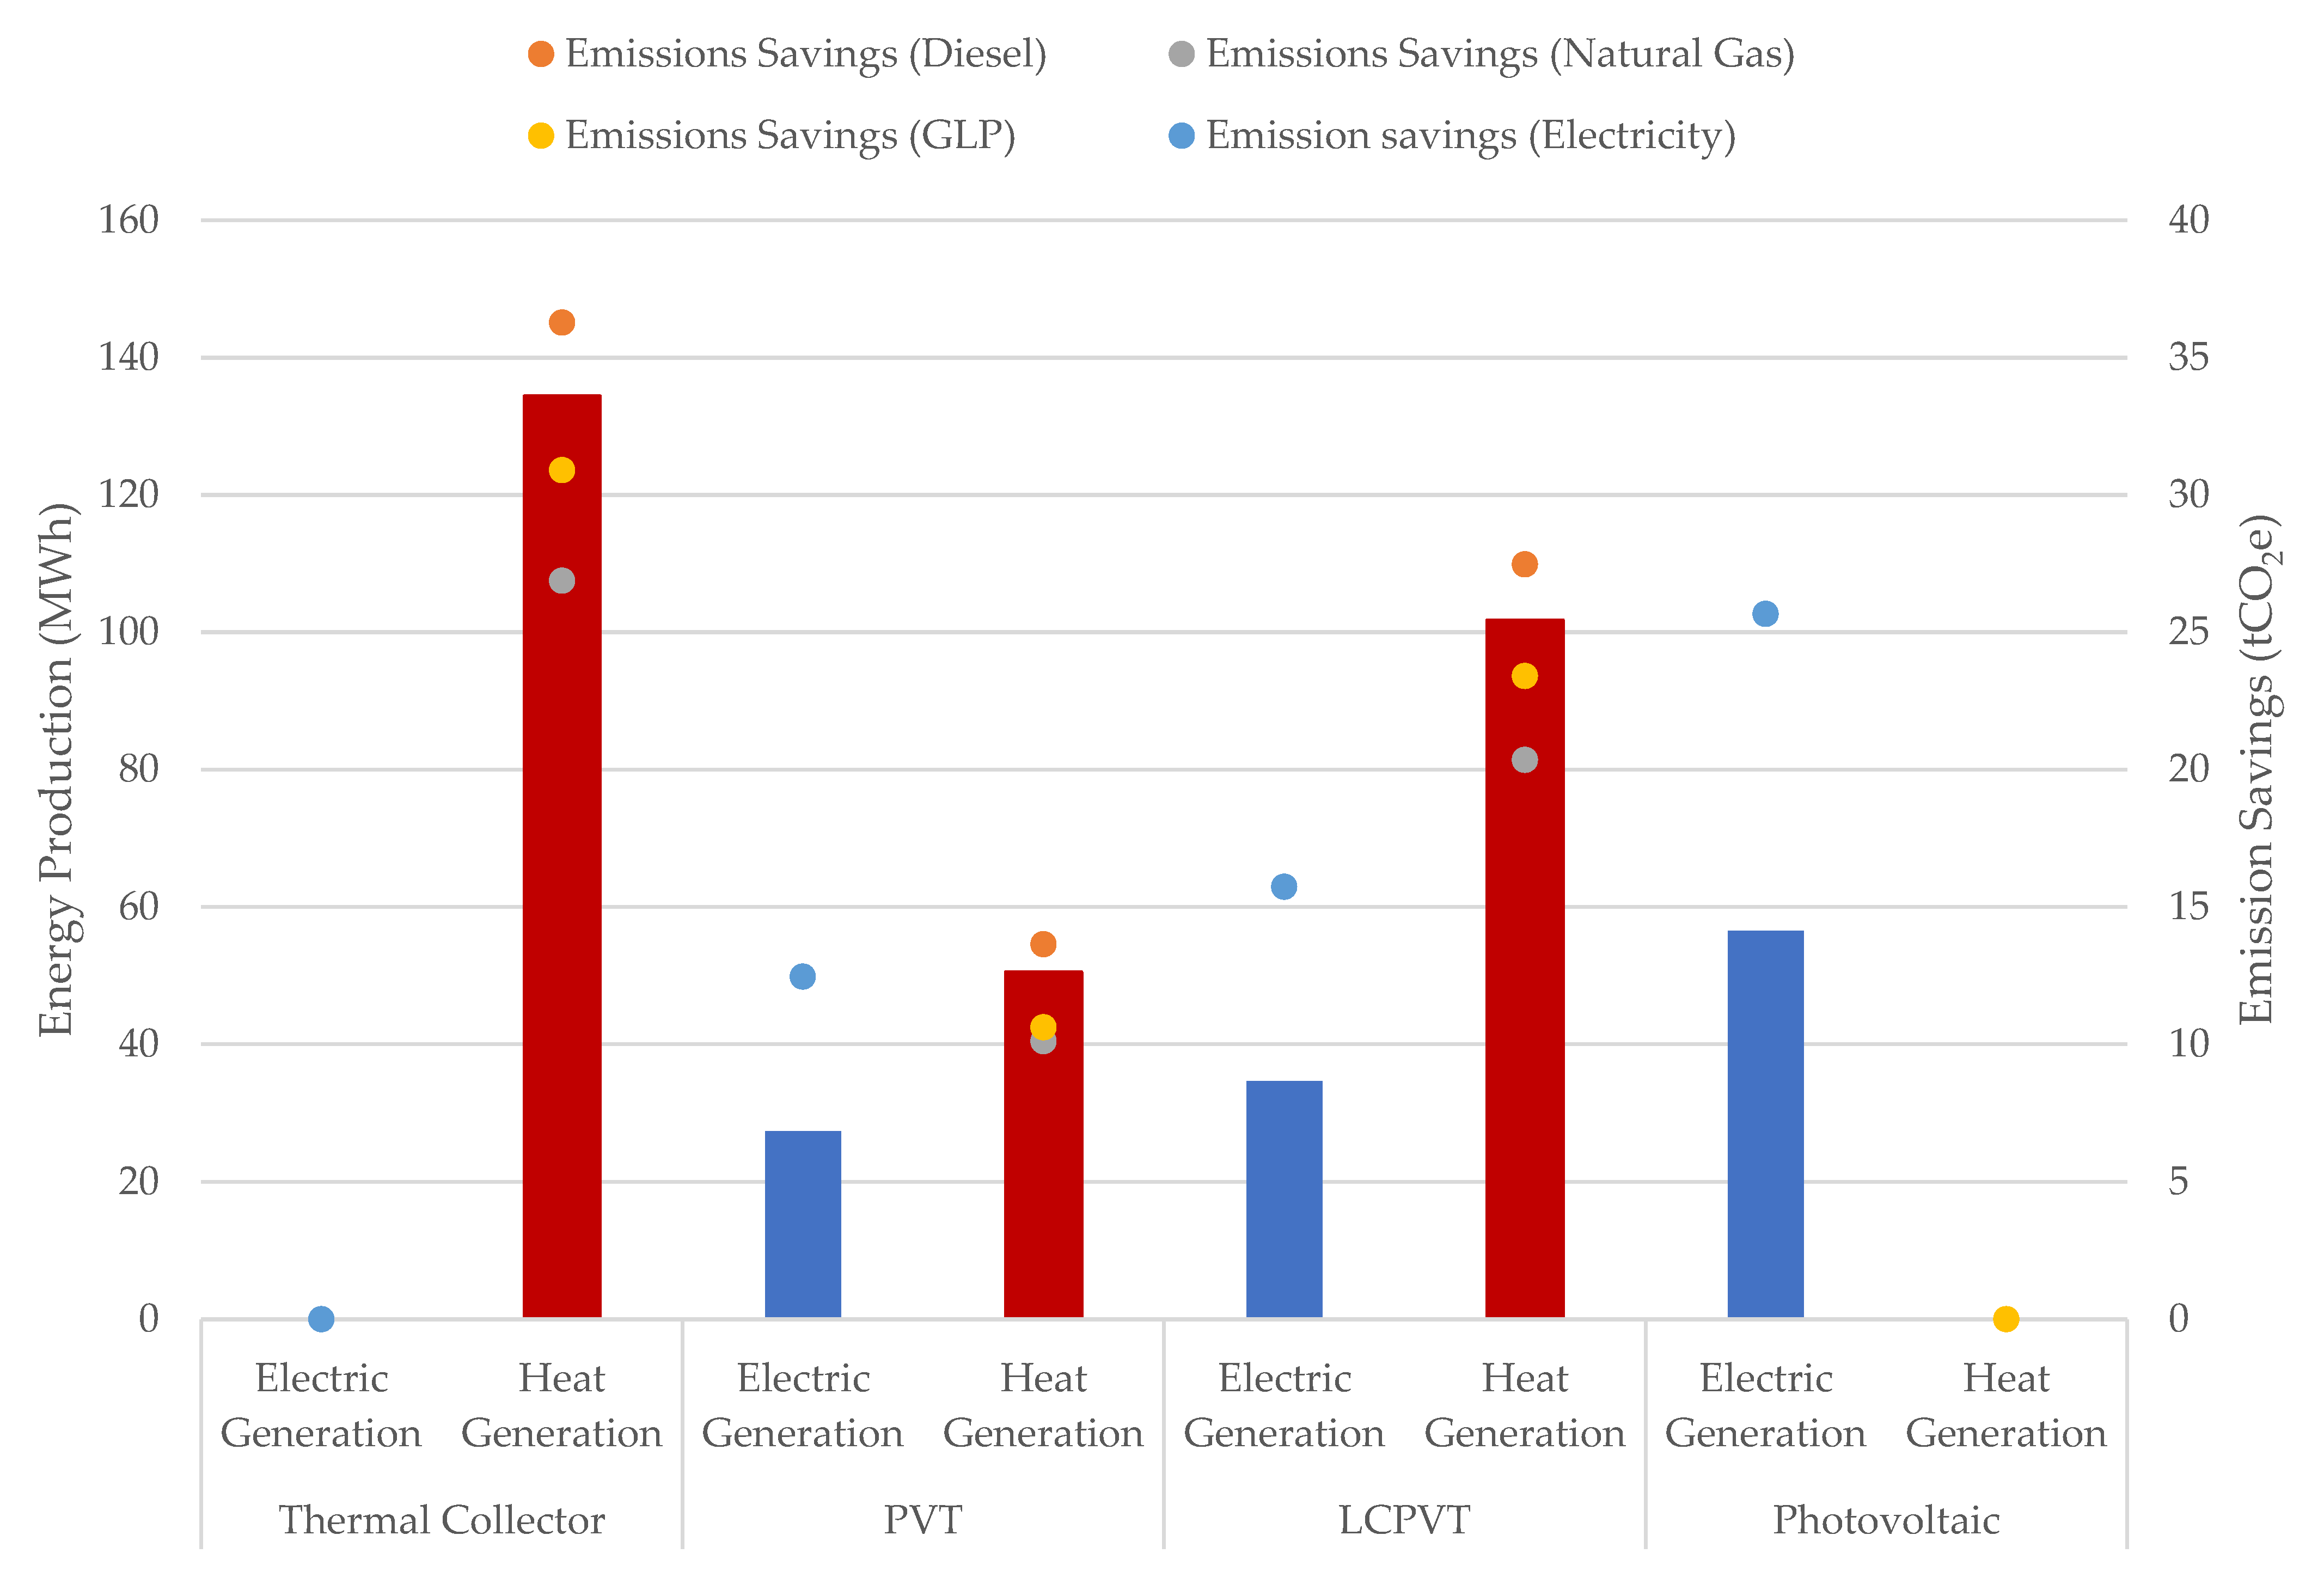
When power and heat generation by technology type is analyzed, it is important to remember how the technologies under study work. The thermal energy generated by the thermal collector was high above hybrid collectors, 83.86 MWh more than PVT and 32.61 MWh more than LCPVT. The same occurred with the PV system; it generated more electrical energy, 29.12 MWh more than PVT and 21.89 MWh more than LCPVT. Although these technologies generate more energy than hybrid collectors, they are limited to a single type of energy, either electrical or thermal. When the two technologies that generate both electrical energy and thermal energy were evaluated, outstanding behavior of LCPVT was observed, with 51.25 MWh more thermal energy and 7.23 MWh more electrical energy, compared to PVT (Figure 9).
Regarding emission savings, the results depended on the fuel being replaced (in the case of thermal energy) and on the electricity tariff. It was observed that when the generation of thermal energy displaced the use of Liquefied Gas (GLP), higher emissions savings were obtained. Presenting the lowest emission savings, diesel and finally Natural Gas (GN) followed. Finally, the results for the payback time when applying these technologies are presented in Table 10. It was observed that the best results occurred when GN was displaced. When compared by technology, PVT always obtained values greater than 12 years. In contrast, the best results were obtained for LCPVT applied to the residential building with a DAC tariff and diesel fuel, with a value of 3.16 years.
3.3. Case Study: Hospital San José
As a case study, the Hospital San José del Tecnológico de Monterrey was selected. It was founded in 1969, and it is one of the world-class healthcare providers in Latin America. This building has a total roof area of 5169 m2, of which only 4530 m2 was used for the case study applying energy efficiency and energy generation measures (Figure 10). This was due to the geometric configuration of the buildings and the possible generation of shadows. Due to its characteristics of use, this building consumes both electrical and thermal energy. For a better analysis of the final results and accuracy compared to the real-world situation, the energy consumed in the year 2019 for the area evaluated was obtained. The energy consumed was 3,931,663 kWh of electricity and 2,799,833 kWh of heat from natural gas. For the economic evaluation, it was necessary to select an electricity tariff; in this case, the one that fit best was PDBT, with a value of 0.16 USD/kWh.
With the input data, area, and electricity tariff, each of the energy efficiency options applicable to the roof was calculated in the tool. Then, with the same area and selection of the type of fuel to be replaced, the four possible energy generation options were evaluated. Finally, since the actual building has a very different WWR from the options available in the tool, it was decided not to perform the window comparison.
When evaluating the energy efficiency options, it was observed that energy consumption without applying any technology (base case of the tool) differed by only 1.62% from the real consumption of the building; this result allowed the continuation of the analysis. Figure 11 shows the results of the percentage energy savings when the different passive measures were applied and in red the possible variation of 1.62%. It was observed that the combination of PCM and insulation gave better results than PCM with reflective paint. This leads to recommending the use of PCM only when combined with insulation material since PCM alone does not provide a significant amount of energy savings. Similarly, the best results were those where the three strategies were combined, 6.80, 5.76, and 5.55% when PCM was combined with reflective paint with XPS, LDR, and EPS, respectively. These latter results were just 0.01% higher than when the combination did not include reflective paint, suggesting that reflective paint does not significantly affect the final energy performance. Furthermore, as observed in Table 9, including reflective paint would reduce the payback time by approximately one month. For this reason, it was decided that the best strategy applicable to the hospital is to use PCM with XPS insulation, obtaining a saving of 6.79%, which is 267,136 kWh in one year. Finally, the negative result when only reflective paint was applied could mean a need for more energy when this measure is applied, for example, in winter.
Figure 12 shows the energy generation and emission savings if all four available solar technologies were implemented. In the case of the thermal collector, 82.68% of the annual heat needed could be supplied. In the same way, with the PV system, 24.79% of the electrical energy consumed annually could be deferred. Of the hybrid collectors, LCPVT represents the best result, supplying 15.19% of the electrical energy and 62.61% of the heat needed. Further, the emissions saved, 621.5 tCO2e, are well above the ST and the PV system, with 462.6 and 442.1 tCO2e, respectively. In the same way, the return on investment of this technology, 8.61 years, is well below the other ST, 19.61 years, and PVT, 24.57 years, and only slightly above the PV system, 5.27 years (Table 10).
4. Discussion
After performing a parametric comparison between the different measures of energy efficiency and energy generation for the different types of buildings using the TecSB tool, certain results stand out. Residential buildings obtained better savings possibilities than non-residential ones. After carrying out a detailed analysis of the differences between the models, it was observed that the occupancy, the building operating schedules, and the WWR changed notably. The latter seems to benefit the performance of residential buildings as it is much lower than in commercial buildings, thus limiting solar gains. When non-residential buildings were compared, in general, the restaurant and the hospital had the highest and lowest savings, respectively. Among those, two aspects could change this behavior. On the one hand is the occupancy density, which is more than ten times higher for the restaurant than for the hospital. On the other hand is the difference in occupancy hours, as the restaurant was closed one full day of the week. This reveals the impact limiting the occupancy hours and the number of people can have on the final energy savings. Thus, it is more important to reduce the number of hours of building occupancy than the number of people who can stay there.
Regarding the specific use of materials, the use of reflective paint as an energy efficiency measure was observed to have a very low impact. This result shows a balance between the benefit of applying it in summer (higher solar irradiation) and the hindrance of applying it in winter (lower solar irradiation). Therefore, for a climate like the one studied, it may not be the best option. In the same way, when the performance of the different insulating materials was analyzed, it was observed that materials with a thermal resistance twice as high (i.e., XPS) increased savings by only a little more than 2%. When analyzed from the economic point of view, the material with the lowest thermal resistance (EPS) has a payback time of almost half compared to the one with the highest thermal resistance. In this case, it is suggested to analyze the life cycle of the material as an additional aspect for final decision-making.
When the replacement of windows with more efficient ones was evaluated, the most remarkable aspect observed was the importance of implementing efficiency measures in buildings with a high percentage of WWR. Due to the high energy consumption of buildings with 100% WWR, applying some of the measures proposed in windows could mean doubling the energy savings compared to applying the same measure in a building with 40% WWR. Additionally, very attractive payback times were obtained for 100% WWR buildings, such as the blue tinted glass case for offices, with a payback of 1.14 years.
Regarding energy generation, and from an environmental impact approach, substituting diesel gas consumption with renewable heat generation technologies is what produced the greatest savings in emissions. Therefore, the importance of using this type of system when a building consumes this fuel stands out. When comparing the different types of possible technologies to be implemented, LCPVT performance has a higher impact. In sum, the generation of electricity and heat through LCPVT can save more emissions than the thermal collector, PVT, and PV system at 16.04%, 39.63%, and 40.60% more, respectively. If it is compared based on the energy generated, the results may be different; for instance, the electricity generation of LCPVT is 20.85% higher than PVT and 38.70% less than PV. Additionally, for heat generation, LCPVT produced 50.37% more heat than PVT but 24.27% less than ST. From the economic point of view, the payback time of LCPVT is greater than that of ST, which suggests that it is necessary to evaluate in detail the type of building where it will be implemented.
Finally, the Hospital Case Study under analysis shows us the importance of having energy tools and models to generate predictions and make the best decisions. It is worth remembering that this tool was designed for construction stakeholders, which would allow them an easy and free way to compare different construction alternatives and the integration of renewable sources with some limitations that cannot be left aside. Among them, the tool considers a base model with very specific characteristics: constructive, architectural, and operational, among others. In addition, the tool was designed for a specific climate that represents the environmental conditions of the metropolitan area of Monterrey, Mexico. Despite these considerations, the tool is able to produce good results for the annual energy consumption/production, costs, and environmental impact when active or passive alternatives for a specific area are implemented.
5. Conclusions
In this work, the need to develop a free access digital tool to evaluate energy efficiency strategies applied to the building envelope (roof and windows) and energy generation from renewable sources was identified. For this reason, the TecSB tool with these characteristics was developed, available for residential and non-residential buildings in Monterrey, Mexico. Transient thermal simulations were carried out on a base model that allowed data extrapolation with some limitations. The TecSB tool enables users to compare and analyze the energy, cost, and environmental impact for different scenarios. Finally, it was used to evaluate strategies for a real case allowing observation of its usefulness. After an exhaustive discussion, the conclusions are listed below:
- The best strategy, from the energy point of view, applied to the roof was the combination of PCM, insulating material, and reflective paint. The use of PCM was only recommended if combined with insulating material. Only applying reflective paint did not result in significant savings.
- The payback time for insulating materials was always the lowest due to their high availability in the market. When PCM was evaluated, the payback time notably increased because it is an imported product; even so, there were results with a payback time of fewer than three years.
- The options for windows were not beneficial, neither thermally nor economically, for residential buildings, and, in the case of non-residential buildings, the result was much more effective when the WWR was 100%.
- Among the possibilities of substituting fuels to generate thermal energy with some of the available technologies, substituting diesel with LCPVT resulted in the greatest emission savings.
- The use of the tool was demonstrated by analyzing a real building (hospital) as a case study. An energy saving of 6.79% was obtained when PCM and XPS insulation were applied to the roof. In addition to the possibility of supplying 15.19% of the demand for electrical energy and 62.61% of the heat if an LCPVT system is installed covering the 4530 m2 of the roof.
The developed tool is unique to Mexico and represents a step forward that allows stakeholders to make early decisions to design with principles of energy sustainability and energy generation from clean sources.
Author Contributions
All authors conducted this study. Conceptualization, C.G.-R.; Methodology, C.G.-R., C.I.R.-S. and M.G.-R.; investigation, C.G.-R. and C.I.R.-S.; data curation, C.G.-R. and M.G.-R.; writing—original draft preparation, C.G.-R., C.I.R.-S. and M.G.-R.; writing—review and editing, C.G.-R., C.I.R.-S. and M.G.-R.; supervision, C.I.R.-S. and M.G.-R.; project administration, C.I.R.-S. and M.G.-R.; funding acquisition, C.I.R.-S. and M.G.-R. All authors have read and agreed to the published version of the manuscript.
Funding
This research was funded by the Google-ICLEI Action Fund (Gobiernos Locales para la Sostenibilidad) and the Tecnologico de Monterrey Challenge-Based Research Funding Program.
Institutional Review Board Statement
Ethical review and approval were waived for this study due to no personal identities being involved or reported.
Informed Consent Statement
Informed consent was obtained from all subjects involved in the study.
Data Availability Statement
The data sets supporting the reported results can be made available upon request to the authors.
Acknowledgments
Thanks to NRGY Solutions Inc. for providing us with the PCM films. Further, we would like to acknowledge Estrellita Valencia for her contribution to the validation section of the LCPVT system.
Conflicts of Interest
The authors declare no conflict of interest.
References
- Urbanization—Our World in Data. Available online: https://ourworldindata.org/urbanization (accessed on 11 October 2022).
- International Energy Agency. Tracking Buildings 2020—Analysis. 2020. Available online: https://www.iea.org/topics/buildings (accessed on 1 November 2021).
- International Energy Agency (IEA). Available online: https://www.iea.org/reports/buildings (accessed on 3 October 2022).
- Al-Rakhami, M.; Gumaei, A.; Alsanad, A.; Alamri, A.; Hassan, M.M. An Ensemble Learning Approach for Accurate Energy Load Prediction in Residential Buildings. IEEE Access 2019, 7, 48328–48338. [Google Scholar] [CrossRef]
- González-Torres, M.; Pérez-Lombard, L.; Coronel, J.F.; Maestre, I.R.; Yan, D. A review on buildings energy information: Trends, end-uses, fuels and drivers. Energy Rep. 2022, 8, 626–637. [Google Scholar] [CrossRef]
- SENER. Balance Nacional de Energía. 2020. Available online: https://www.gob.mx/cms/uploads/attachment/file/707654/BALANCE_NACIONAL_ENERGIA_0403.pdf (accessed on 3 October 2022).
- Nearly Zero-Energy Buildings. Available online: https://energy.ec.europa.eu/topics/energy-efficiency/energy-efficient-buildings/nearly-zero-energy-buildings_en (accessed on 11 October 2022).
- Kurnitski, J.; Allard, F.; Braham, D.; Goeders, G.; Heiselberg, P.; Jagemar, L.; Kosonen, R.; Lebrun, J.; Mazzarella, L.; Railio, J.; et al. How to define nearly net zero energy buildings nZEB-REHVA proposal for uniformed national implementation of EPBD recast. REHVA J. 2011, 48, 6–12. [Google Scholar]
- Kumar, D.; Alam, M.; Memon, R.A.; Bhayo, B.A. A critical review for formulation and conceptualization of an ideal building envelope and novel sustainability framework for building applications. Clean. Eng. Technol. 2022, 11, 100555. [Google Scholar] [CrossRef]
- Dobiás, J.; Macek, D. Leadership in Energy and Environmental Design (LEED) and its impact on building operational expenditures. Procedia Eng. 2014, 85, 132–139. [Google Scholar] [CrossRef] [Green Version]
- Mandel, T.; Pató, Z.; Broc, J.-S.; Eichhammer, W. Conceptualising the energy efficiency first principle: Insights from theory and practice. Energy Effic. 2022, 15, 41. [Google Scholar] [CrossRef]
- Oliveira, S.; Marco, E.; Gething, B. Energy Modelling in Architecture: A Practice Guide; RIBA Publishing: London, UK, 2020. [Google Scholar] [CrossRef]
- Carpio, M.; Martín-Morales, M.; Zamorano, M. Comparative study by an expert panel of documents recognized for energy efficiency certification of buildings in Spain. Energy Build. 2015, 99, 98–103. [Google Scholar] [CrossRef]
- HERS Raters—RESNET. Available online: https://www.resnet.us/raters/hers-raters/ (accessed on 11 October 2022).
- Chen, S.; Zhao, L.; Zheng, L.; Bi, G. A rapid evaluation method for design strategies of high-rise office buildings achieving nearly zero energy in Guangzhou. J. Build. Eng. 2021, 44, 103297. [Google Scholar] [CrossRef]
- Rahmadyani, H.; Suhendri. Energy Efficient Low-Cost Housing in Ho Chi Minh using EDGE Buildings. IOP Conf. Series Earth Environ. Sci. 2020, 532, 012018. [Google Scholar] [CrossRef]
- Kang, Y.; Ma, N.; Bunster, V.; Chang, V.W.-C.; Zhou, J. Optimizing the Passive House Planning Package simulation tool: A bottom-up dynamic approach to reduce building performance gap. Energy Build. 2022, 276, 112512. [Google Scholar] [CrossRef]
- Salehin, S.; Ferdaous, M.; Chowdhury, R.M.; Shithi, S.S.; Rofi, M.B.; Mohammed, M.A. Assessment of renewable energy systems combining techno-economic optimization with energy scenario analysis. Energy Energy 2016, 112, 729–741. [Google Scholar] [CrossRef]
- Building Rating Tools|YourHome. Available online: https://www.yourhome.gov.au/buy-build-renovate/building-rating-tools (accessed on 6 November 2022).
- James, M.; Ambrose, M.; Lane, B.; Wright, A. The NatHERS dataset: An exploration of its content, provenance, and usefulness in the characterization of new residential building. Energy Procedia 2017, 121, 142–149. [Google Scholar] [CrossRef]
- Fosas, D.; Mitchell, R.; Nikolaidou, E.; Roberts, M.; Allen, S.; Walker, I.; Coley, D. Novel super-reduced, pedagogical model for scoping net zero buildings. Build. Environ. 2022, 208, 108570. [Google Scholar] [CrossRef]
- Herramienta Cálculo NOM-008|Comisión Nacional para el Uso Eficiente de la Energía|Gobierno. Available online: https://www.gob.mx/conuee/acciones-y-programas/herramienta-calculo-nom_008 (accessed on 11 October 2022).
- Ener-Habitat. Available online: http://www.enerhabitat.unam.mx/Cie2/ (accessed on 11 October 2022).
- Sadineni, S.B.; Madala, S.; Boehm, R.F. Passive building energy savings: A review of building envelope components. Renew. Sustain. Energy Rev. 2011, 15, 3617–3631. [Google Scholar] [CrossRef]
- Mousavi, S.; Gijón-Rivera, M.; Rivera-Solorio, C.; Rangel, C.G. Energy, comfort, and environmental assessment of passive techniques integrated into low-energy residential buildings in semi-arid climate. Energy Build. 2022, 263, 112053. [Google Scholar] [CrossRef]
- Henninger, R.H.; Witte, M.J. EnergyPlus Testing with ANSI/ASHRAE Standard 140-2001 (BESTEST). U.S. Department of Energy. 2004. Available online: www.gard.com (accessed on 2 November 2021).
- DesignBuilder. DesignBuilder Software Ltd—Home. Available online: https://designbuilder.co.uk/ (accessed on 28 November 2021).
- Acosta-Pazmiño, I.; Rivera-Solorio, C.; Gijón-Rivera, M. Energetic and Economic Analyses of an LCPV/T Solar Hybrid Plant for a Sports Center Building in Mexico. Energies 2020, 13, 5681. [Google Scholar] [CrossRef]
- Reyes, R.V. Modificaciones al Sistema de Clasificación Climática de Köppen: Para Adaptarlo a las Condiciones de la República Mexicana. Enriqueta García. 2004. Available online: https://www.academia.edu/12911044/Modificaciones_al_sistema_de_clasificaci%C3%B3n_clim%C3%A1tica_de_K%C3%B6ppen_para_adaptarlo_a_las_condiciones_de_la_Rep%C3%BAblica_Mexicana_2004_Enriqueta_Garc%C3%ADa (accessed on 16 November 2021).
- Liggett, R.; Milne, M. Climate Consultant. Monterrey; UCLA Energy Design Tools Group: Los Angeles, CA, USA, 2020. [Google Scholar]
- Inegi. Climas. Available online: https://www.cuentame.inegi.org.mx/territorio/climas.aspx?tema=T (accessed on 30 November 2022).
- NOM 020 ENER2011. Eficiencia Energética en Edificaciones. Envolvente de Edificios para Uso Habitacional. Secretaría de Energía and Comité Consultivo Nacional de Normalización para la Preservación y Uso Racional de los Recursos Energéticos: Mexico City, Mexico, 2011.
- NOM 008 ENER 2001. Eficiencia Energética en Edificaciones, Envolventes de Edificios no Residenciales. Secretaría de Energía and Comité Consultivo Nacional de Normalización para la Preservación y Uso Racional de los Recursos Energéticos: Mexico City, Mexico, 2001.
- Kumar, D.; Alam, M.; Zou, P.X.W.; Sanjayan, J.G.; Memon, R.A. Comparative analysis of building insulation material properties and performance. Renew. Sustain. Energy Rev. 2020, 131, 110038. [Google Scholar] [CrossRef]
- Hernandez-Perez, I.; Alvarez, G.; Xaman, J.; Zavala-Guillen, I.; Arce, J.; Sima, E. Thermal performance of reflective materials applied to exterior building components—A review. Energy Build. 2014, 80, 81–105. [Google Scholar] [CrossRef]
- Liu, L.; Hammami, N.; Trovalet, L.; Bigot, D.; Habas, J.-P.; Malet-Damour, B. Description of phase change materials (PCMs) used in buildings under various climates: A review. J. Energy Storage 2022, 56, 105760. [Google Scholar] [CrossRef]
- Owens Corning. FOAMULAR ® 250 Product Data Sheet; Owens Corning: Toledo, OH, USA, 2001. [Google Scholar]
- Placas de Lana de Roca—Rolan. Available online: https://www.rolan.com/placas-de-lana-de-roca/#1511758387490-cad25595-b02c (accessed on 6 November 2022).
- Poliestirenos|Placa de EPS. Available online: https://poliestirenosmexico.com/productos/placa-de-eps (accessed on 6 November 2022).
- TOP Wall® 19 Litros|Undefined|Comex. Available online: https://tienda.comex.com.mx/producto/impermeabilizantes/19A0284300 (accessed on 6 November 2022).
- Infinite R Phase Change Material|Infinite R Phase Change Material. Available online: https://infiniterpcm.com/home (accessed on 6 November 2022).
- Hee, W.J.; Alghoul, M.A.; Bakhtyar, B.; Elayeb, O.; Shameri, M.A.; Alrubaih, M.S.; Sopian, K. The role of window glazing on daylighting and energy saving in buildings. Renew. Sustain. Energy Rev. 2015, 42, 323–343. [Google Scholar] [CrossRef]
- Catalogo de productos de Vitro Vidrio Arquitectónico|Undefined|Vitro. Available online: https://www.vitroglazings.com/media/a44dozdb/catalogo-vitro-vidrio-arquitectonico-2019.pdf (accessed on 6 November 2022).
- Comisión Federal de Electricidad (CFE). Tarifas-Negocios. 2022. Available online: https://app.cfe.mx/Aplicaciones/CCFE/Tarifas/TarifasCRENegocio/Tarifas/PequenaDemandaBT.aspx (accessed on 14 February 2022).
- Kalogirou, S. Solar Energy Engineering Processes and Systems, 2nd ed.; Elsevier: Amsterdam, The Netherlands, 2013. [Google Scholar]
- Diario Oficial de la Federación (DOF). Available online: https://dof.gob.mx/nota_detalle_popup.php?codigo=5406149 (accessed on 2 December 2022).
Figure 1.
Detail of back information for TecSB building energy tool.

Figure 2.
Weather classification in Mexico, and Monterrey’s location. Adapted from [31].
Figure 2.
Weather classification in Mexico, and Monterrey’s location. Adapted from [31].

Figure 3.
Building simulation models. (a) Residential model, and (b) Non-residential model.

Figure 4.
Combination of scenarios generated for building energy analysis.

Figure 5.
Simulation studio for TRNSYS, hybrid LCPVT collector modeling.

Figure 6.
Flow Chart of TecSB tool.

Figure 7.
Energy and emission savings for different energy efficiency measures applied to roofs of buildings.
Figure 7.
Energy and emission savings for different energy efficiency measures applied to roofs of buildings.

Figure 8.
Energy and emission savings for different energy efficiency measures applied to windows of buildings.
Figure 8.
Energy and emission savings for different energy efficiency measures applied to windows of buildings.

Figure 9.
Energy production and emission savings for different solar energy generation technologies.
Figure 9.
Energy production and emission savings for different solar energy generation technologies.

Figure 10.
Aerial view of the San José hospital in Monterrey.

Figure 11.
Energy savings for all passive technologies applied to the opaque envelope in the Hospital San José.
Figure 11.
Energy savings for all passive technologies applied to the opaque envelope in the Hospital San José.

Figure 12.
Energy production and emission savings for all solar technologies applied to the hospital.
Figure 12.
Energy production and emission savings for all solar technologies applied to the hospital.


Table 1.
Comparison of different building tools developed around the world.
| Software/Tool | Applicable in | Initiative | Focus On | Main Users | Type of Access |
|---|---|---|---|---|---|
| Calener VYP | Spain | Government | Energy Efficiency in Buildings | Raters, Government | Free |
| Green Energy Compass | USA | Private | Renewable energy infrastructure | Government agencies | Paid |
| RESNET | USA | Not-for-profit corporation | Net-Zero Energy Homes | Raters, providers, builders | Free |
| Academic tool developed in China | China | Academic | Net-Zero Energy Buildings | Academic | - |
| EDGE Buildings | World | Private | Zero Carbon Buildings | Raters, Builders | Free |
| Passive House standard | Germany-World | Independent Research Institute | Energy Efficiency in Buildings | Raters, Builders | Paid |
| RETScreen | Canada-World | Government | Renewable energy management | Designers, Government | Paid |
| HOMER | USA-World | Private | Hybrid Power system | Designers, builders | Paid |
| NatHERS rating tools | Australia | Government | Energy Efficiency in Buildings | Raters, Builders | Free |
| ZEBRA | UK | Academic | Zero Carbon Design | Academic | - |
| NOM 008 ENER 2001 NOM 020 ENER 2010 | Mexico | Government | Energy Efficiency in Buildings | Raters, designers, builders | Free |
| Ener-Habitat | Mexico | Academic | Energy Efficiency in Buildings | Designers, Builders | Free |
Table 2.
Occupancy, activity schedule, and equipment in buildings.
| Type of Building | Occupancy Density (People/m2) | Schedule | Power Density (W/m2) |
|---|---|---|---|
| Residential 1 | 0.0530 | Weekdays fractioned | 5.00 |
| Office | 0.0890 | Weekdays fractioned | 11.77 |
| Hospital | 0.0700 | Weekdays and weekends fractioned | 10.0 |
| Restaurant | 0.7535 | Weekdays and Saturday | 10.0 |
| Educational | 0.2034 | Weekdays | 4.74 |
1 Residential with computers ON.
Table 3.
Thermal properties of the base case model.
| Partition | Thickness (m) | R Value (m2K/W) | SHGC | VT (%) |
|---|---|---|---|---|
| Roof | 0.175 | 0.350 | - | - |
| Floor | 0.200 | 0.353 | - | - |
| Walls | 0.150 | 0.365 | - | - |
| Window | 0.006 | 0.173 | 0.85 | 0.88 |
Table 4.
Thermal properties of roof materials selected.
| Material | Thermal Conductivity (W/mK) | R Value (m2K/W) | Emittance | Melting Temperature (°C) | Latent Heat (kJ/kg) |
|---|---|---|---|---|---|
| Insulation 1: XPS [37] | - | 1.41 | - | - | - |
| Insulation 2: LDR [38] | - | 0.74 | - | - | - |
| Insulation 3: EPS [39] | - | 0.65 | - | - | - |
| Reflective paint [40] | 0.29 | - | 0.89 | - | - |
| PCM [41] | 0.54 | - | - | 21 | 200 |
Table 5.
Thermal and optical properties of glazing systems selected. Data from [43].
Table 5.
Thermal and optical properties of glazing systems selected. Data from [43].
| Glass | Thickness (m) | U-Factor (W/m2K) | SHGC | VT (%) |
|---|---|---|---|---|
| Bronze tinted (BR) | 0.006 | 5.801 | 0.633 | 53 |
| Blue tinted (BL) | 0.006 | 5.801 | 0.532 | 68 |
| Reflective (RF) | 0.006 | 4.975 | 0.608 | 50 |
| Double Low E | 0.006 | 1.345 | 0.217 | 42 |
Table 6.
Annual average thermal/electrical efficiencies, module efficiencies, and conversion efficiencies of the solar technologies.
Table 6.
Annual average thermal/electrical efficiencies, module efficiencies, and conversion efficiencies of the solar technologies.
| Average Annual Thermal Efficiency (%) | Average Annual Electrical Efficiency (%) | Rated Electrical Efficiency (%) | DC-AC Conversion Efficiency (%) | |
|---|---|---|---|---|
| PV | - | 13 | 18 | 92 |
| ST | 58 | - | - | - |
| PVT | 35 | 10.5 | 15 | 92 |
| LCPVT | 38 | 8 | 22.5 | 92 |
Table 7.
Consumption pattern and total carbon intensity per type of building.
| Residential | Restaurant | Office | School | Hospital | |
|---|---|---|---|---|---|
| % Electricity | 75 | 54 | 100 | 100 | 77 |
| % Heat | 25 | 46 | 0 | 0 | 23 |
| Total Carbon Intensity (tCO2e/kWh) | 0.00058 | 0.00060 | 0.00057 | 0.00057 | 0.00058 |
Table 8.
Payback time for different energy efficiency measures applied to roofs of buildings.
| R.P. | XPS | LDR | EPS | R.P. + XPS | R.P. + LDR | R.P. + EPS | PCM | PCM + R.P. | PCM + XPS | PCM + LDR | PCM + EPS | PCM + XPS + R.P. | PCM + LDR+ R.P. | PCM + EPS + R.P. | ||
|---|---|---|---|---|---|---|---|---|---|---|---|---|---|---|---|---|
| Rs. | 1C | 9.39 | 1.98 | 1.61 | 1.18 | 2.23 | 1.91 | 1.5 | 16.55 | 16.29 | 7.41 | 7.99 | 7.93 | 7.57 | 8.15 | 8.1 |
| DAC | 3.56 | 0.67 | 0.54 | 0.39 | 0.76 | 0.65 | 0.5 | 6.95 | 6.82 | 2.73 | 2.97 | 2.95 | 2.8 | 3.04 | 3.02 | |
| Off. | GDMTH | 11.38 | 5.22 | 4.3 | 3.2 | 5.81 | 5.03 | 4.0 | 18.98 | 18.94 | 12.1 | 12.68 | 12.54 | 12.34 | 12.94 | 12.81 |
| PDBT | 5.14 | 2.17 | 1.77 | 1.29 | 2.44 | 2.09 | 1.64 | 9.4 | 9.37 | 5.51 | 5.82 | 5.74 | 5.64 | 5.96 | 5.89 | |
| Hosp. | GDMTH | 8.0 | 2.05 | 1.67 | 1.22 | 2.3 | 1.98 | 1.56 | 14.26 | 14.15 | 7.86 | 8.32 | 8.22 | 8.02 | 8.49 | 8.41 |
| PDBT | 3.46 | 0.81 | 0.66 | 0.48 | 0.92 | 0.79 | 0.61 | 6.68 | 6.61 | 3.39 | 3.61 | 3.56 | 3.47 | 3.69 | 3.65 | |
| Rt. | GDMTH | 7.81 | 2.81 | 2.27 | 1.66 | 3.15 | 2.67 | 2.1 | 17.94 | 17.56 | 8.76 | 9.24 | 9.14 | 8.93 | 9.43 | 9.33 |
| PDBT | 3.36 | 1.13 | 0.9 | 0.66 | 1.27 | 1.07 | 0.84 | 8.78 | 8.55 | 3.82 | 4.06 | 4.01 | 3.91 | 4.15 | 4.1 | |
| Sch. | GDMTH | 10.26 | 4.11 | 3.38 | 2.5 | 4.6 | 3.97 | 3.15 | 19.33 | 19.35 | 11.25 | 11.87 | 11.74 | 11.48 | 12.12 | 12.0 |
| PDBT | 4.56 | 1.68 | 1.37 | 1.0 | 1.9 | 1.62 | 1.27 | 9.61 | 9.62 | 5.07 | 5.39 | 5.33 | 5.19 | 5.52 | 5.46 |
Table 9.
Payback time for different energy efficiency measures applied to windows of buildings.
| BR. | BL. | RF. | Low E | ||||||
|---|---|---|---|---|---|---|---|---|---|
| 40% | 100% | 40% | 100% | 40% | 100% | 40% | 100% | ||
| Rs. | 1C | 66.79 | 50.4 | 71.51 | 53.95 | 76.48 | 60.06 | 103.03 | 87.55 |
| DAC | 44.78 | 30.35 | 49.14 | 33.36 | 53.81 | 39.59 | 79.5 | 64.4 | |
| Off. | GDMTH | 33.21 | 11.98 | 27.31 | 2.82 | 24.62 | 13.02 | 44.91 | 23.38 |
| PDBT | 19.05 | 5.45 | 14.8 | 1.14 | 12.98 | 6.0 | 28.35 | 15.55 | |
| Hosp. | GDMTH | 14.31 | 7.41 | 16.6 | 8.79 | 16.25 | 8.99 | 32.57 | 20.65 |
| PDBT | 6.7 | 3.18 | 7.99 | 3.84 | 7.79 | 3.93 | 18.58 | 10.43 | |
| Rt. | GDMTH | 16.19 | 8.15 | 18.77 | 9.72 | 39.95 | 9.69 | 37.13 | 23.5 |
| PDBT | 7.76 | 3.53 | 9.27 | 4.29 | 24.28 | 4.28 | 22.05 | 12.24 | |
| Sch. | GDMTH | 22.24 | 11.62 | 25.15 | 13.6 | 20.75 | 12.05 | 39.18 | 25.45 |
| PDBT | 11.43 | 5.3 | 13.33 | 6.31 | 10.48 | 5.49 | 23.66 | 13.54 | |
Table 10.
Payback time for different solar technologies applied to residential and industrial buildings.
Table 10.
Payback time for different solar technologies applied to residential and industrial buildings.
| Solar Technologies for Power and Heat Generation | |||||
|---|---|---|---|---|---|
| Fuel | Electricity Tariff | ST | PVT | LCPVT | PV |
| Diesel | - | 3.46 | - | - | - |
| GN | - | 19.61 | - | - | - |
| GLP | - | 3.9 | - | - | - |
| Diesel | 1C | - | 17.1 | 4.12 | - |
| DAC | - | 12.85 | 3.16 | - | |
| GDMTH | - | 17.74 | 4.26 | - | |
| PDBT | - | 14.67 | 3.58 | - | |
| GN | 1C | - | 33.31 | 12.7 | - |
| DAC | - | 19.65 | 6.51 | - | |
| GDMTH | - | 36.34 | 14.19 | - | |
| PDBT | - | 24.57 | 8.61 | - | |
| GLP | 1C | - | 18.26 | 4.53 | - |
| DAC | - | 13.48 | 3.4 | - | |
| GDMTH | - | 19.01 | 4.7 | - | |
| PDBT | - | 15.51 | 3.89 | - | |
| - | 1C | - | - | - | 9.54 |
| DAC | - | - | - | 3.63 | |
| GDMTH | - | - | - | 11.63 | |
| PDBT | - | - | - | 5.27 | |
Disclaimer/Publisher’s Note: The statements, opinions and data contained in all publications are solely those of the individual author(s) and contributor(s) and not of MDPI and/or the editor(s). MDPI and/or the editor(s) disclaim responsibility for any injury to people or property resulting from any ideas, methods, instructions or products referred to in the content. |
© 2023 by the authors. Licensee MDPI, Basel, Switzerland. This article is an open access article distributed under the terms and conditions of the Creative Commons Attribution (CC BY) license (https://creativecommons.org/licenses/by/4.0/).
Share and Cite
MDPI and ACS Style
Godoy-Rangel, C.; Rivera-Solorio, C.I.; Gijón-Rivera, M. TecSB: An Open Web Tool of Energy Efficiency and Solar Energy Integration in Mexican Buildings. Sustainability 2023, 15, 3630. https://0-doi-org.brum.beds.ac.uk/10.3390/su15043630
AMA Style
Godoy-Rangel C, Rivera-Solorio CI, Gijón-Rivera M. TecSB: An Open Web Tool of Energy Efficiency and Solar Energy Integration in Mexican Buildings. Sustainability. 2023; 15(4):3630. https://0-doi-org.brum.beds.ac.uk/10.3390/su15043630
Chicago/Turabian StyleGodoy-Rangel, Caribay, Carlos. I. Rivera-Solorio, and Miguel Gijón-Rivera. 2023. "TecSB: An Open Web Tool of Energy Efficiency and Solar Energy Integration in Mexican Buildings" Sustainability 15, no. 4: 3630. https://0-doi-org.brum.beds.ac.uk/10.3390/su15043630
Note that from the first issue of 2016, this journal uses article numbers instead of page numbers. See further details here.