Article

Water Conservation and Ecological Water Requirement Prediction of Mining Area in Arid Region Based on RS-GIS and InVEST: A Case Study of Bayan Obo Mine in Baotou, China

1
School of Resources and Architectural Engineering, Gannan University of Science and Technology, Ganzhou 341000, China
2
School of Energy and Environment, Inner Mongolia University of Science and Technology, Inner Mongolia Autonomous Region, Baotou 014010, China
3
Ganjiang Innovation Academy, Chinese Academy of Sciences, Ganzhou 341000, China
*
Author to whom correspondence should be addressed.
Sustainability 2023, 15(5), 4238; https://0-doi-org.brum.beds.ac.uk/10.3390/su15054238
Submission received: 23 December 2022 / Revised: 20 February 2023 / Accepted: 23 February 2023 / Published: 27 February 2023

Abstract

:
The overexploitation of mineral resources in northwestern China has resulted in severe ecological degradation and even desertification in certain mining areas. To support ecological restoration in these arid mining regions, we conducted a study on water conservation and ecological water demand using Bayan Obo as a case study. Based on remote sensing, geographic information systems, and the Integrated Valuation of Ecosystem Services and Trade-offs InVEST model, our study found that the mining area has lost its capacity for water production, with the water source conservation showing negative values. In addition, precipitation levels are far lower than evapotranspiration, making it difficult to retain precipitation. We predicted ecological water demand for the planning years (2025, 2030, and 2035) by combining qualitative and quantitative forecasting methods, with 2019 serving as the base year. The results indicated a downward trend in natural ecological water demand, while artificial ecological water demand exhibited the opposite trend. Changes in natural grassland and artificial green areas in the mining region were identified as the main drivers of changes in ecological water demand.

1. Introduction

Water is a crucial resource for human survival and development, playing a significant role in various sectors, including industry, agriculture, and daily life, and contributing to economic growth [1]. However, despite the increasing demand for water due to the continuous advancement of society and the economy, the allocation and utilization of water resources have primarily focused on production and consumption, with limited consideration given to the allocation of ecological water demand [2]. According to recent statistics, domestic water consumption accounted for 14.5% of total water consumption in China, while industrial and agricultural production water consumption accounted for 81.4% in 2019. In contrast, artificial ecological environment water supply accounted for only 4.1% of total water consumption, with an increase of 2.1% compared to 2010 [3,4]. The disregard for ecological water demand has resulted in various ecological issues, including vegetation degradation, land desertification, and declining lakes. This traditional water use system is no longer sustainable for green development (Li et al., 2021). Therefore, it is essential to consider ecological water demand when managing and planning regional water resources. In mining areas, water conservation and ecological water demand are major challenges that have affected normal production and daily life [5]. Mining activities in these areas have caused environmental damage, such as soil destruction and vegetation reduction, which has decreased the water conservation capacity of mining areas. Furthermore, the issue of water scarcity in arid regions has made water usage in mining areas even more critical, hindering their development and expansion. The concept of ecological water demand, also known as ecological environmental water demand, has been gradually developed since the 1940s [6]. From the 1990s to the beginning of the 21st century, large-scale research on ecological water demand has been a worldwide hot topic, representing mainly the essential refinement of the concept of ecological water demand and the development of related theories and methods [7]. In recent years, studies on ecological water demand have become more in-depth and comprehensive, particularly for basins, rivers, lakes, natural vegetation, and cities, using appropriate methods to estimate the ecological water demand of the study area to ensure the stable functioning of the regional ecosystem. For instance, Zhang et al. [8] optimized water resource allocation schemes to eliminate the contradiction between the economic and ecological water demand of Heihe River Basin (HRB) in northwest China. Sajedipour et al. [9] estimated the environmental water demand of Bakhtegan Lake in Iran using ecological methods, and Zhang et al. [10] calculated the ecological water demand of urban rivers using a hydrological model. Chi et al. [11] estimated the ecological water demand of natural vegetation in the Ergune River basin in Northeast China from 2001 to 2014. Despite many studies demonstrating that optimal allocation of water resources based on ecological water demand could effectively solve the ecological problems caused by water scarcity in the ecological environment, the ecological water demand in arid mining areas has received less attention [12,13]. The ecological water demand in arid mining areas is characterized by high demand, significant seasonal variability, rapid changes in land use, scarce surface water, and deep groundwater levels [12,14].
The Bayan Obo mining area is the world’s largest rare earth mining site. The exploitation of its mineral resources has caused certain damages to the local ecological environment [15,16,17,18]. Thus, it is urgent to restore the damaged environment. However, the area faces severe water scarcity due to its geographical location and climatic conditions. Insufficient water supply and prolonged drought have hindered vegetation restoration and impeded the ecological restoration process. To date, no research has been conducted on the ecological water demand of the Bayan Obo mining area, and no allocation system based on ecological water demand has been established to ensure water resource sustainability.
Therefore, we conducted a comprehensive investigation of the natural conditions and socio-economic situation of the Bayan Obo mining area and collected background data on vegetation, land use, and water resources to analyze the current water resources situation. We divided the ecological water demand in the mining area into natural and artificial ecological water demand, taking into account the actual situation. To calculate the ecological water demand and water conservation, we utilized the Integrated Valuation of Ecosystem Services and Trade-offs (InVEST) model and the vegetation evapotranspiration method based on the Penman–Monteith model, using remote sensing images, meteorological data, and land-use data from the mine area from 1990–2020. Furthermore, we employed qualitative and quantitative forecasting methods to predict the ecological water demand in 2025, 2030, and 2035 for the Bayan Obo mining area. The objectives of this study were: (1) to calculate the ecological water demand of the Bayan Obo mining area and analyze the characteristics of the changes in ecological water demand over many years; (2) to predict the future ecological water demand of the Bayan Obo mining area, clarify the future trend, and provide ideas for the optimal allocation of water resources in the mining area (Figure 1). It is worth noting that no previous research has been conducted on the ecological water demand of the Bayan Obo mining area, and the allocation of water resources system based on ecological water demand guarantee has not been considered.

2. Materials and Methods

2.1. Study Area

The Bayan Obo mining area is a municipal district in Baotou, Inner Mongolia Autonomous Region [19]. Figure 2 shows the geographical location of the study area. The Bayan Obo mining area is located in a temperate continental climate zone with obvious inland semi-arid climate characteristics. The annual average precipitation is 249.4 mm and evaporation is 2732.5 mm.
The Bayan Obo mining area is characterized by extremely scarce surface water and groundwater resources, as well as low precipitation levels. While there are a few seasonal river gullies within the mine area that flood during the wet season, the arid climate and pronounced wet season drainage have prevented the development of a significant flowing surface water system in the region. Groundwater in the area is not replenished by surface water and relies on atmospheric precipitation and groundwater recharge, resulting in a nearly horizontal water table that typically reaches its highest level in July and August.

2.2. Data Sources

This study used remote sensing images and a digital elevation model with a spatial resolution of 90 m, which were obtained from the Geospatial Data Cloud (https://www.gscloud.cn/, accessed on 30 December 2021). The extent of the Bayan Obo mining area was extracted using ArcGIS 10.7 based on the digital elevation model data. Daily meteorological data from 1990 to 2020, including maximum and minimum temperature, mean temperature, mean wind speed, sunshine hours, mean relative humidity, minimum relative humidity, precipitation, and actual evapotranspiration, were obtained from the Chinese Meteorological Data Network (http://data.cma.cn, accessed on 30 December 2021) at the nearest meteorological station in the study area, Damao banner meteorological station. The land-use remote sensing data were obtained from the Resource and Environmental Science and Data Centre (https://www.resdc.cn, accessed on 30 December 2021).

2.3. InVEST Model

The Integrated Valuation of Ecosystem Services and Trade-offs (InVEST) model is a collaborative effort between Stanford University, the Nature Conservancy (TNC), and the World Wide Fund for Nature (WWF). Its purpose is to offer decision-makers a scientific foundation for evaluating the advantages and consequences of human activities by modeling the changes in the quality and value of ecological service systems under various land-cover scenarios.

2.3.1. Water Yield

Water production was simulated using the InVEST model (version 3.8.4). Based on the hypothesis of hydrothermal coupling balance and the annual average precipitation data, the water production evaluation model determines the annual water yield Y x of each grid unit x in the study area. The calculation Equation (1) of the water production model is as follows:
Y x = ( 1 A E T x P x ) P x
In the equation, A E T x represents the annual actual evapotranspiration of grid unit x , and P x represents the annual precipitation of grid unit x .

2.3.2. Water Conservation Model

Water conservation is calculated using an extended model based on water yield. The Equations (2) and (3) of the water conservation model are as follows:
W C x = Y x O R x
O R x = P x C x
In the equation, W C x represents the water conservation of grid unit x , Y x represents the water yield of grid unit x , O R x represents the annual surface runoff of grid unit x , P x represents the average annual precipitation of grid unit x , and C x represents the surface runoff coefficient of grid unit x . The values of woodland, grassland, water body, construction land, and unused land were 0.0229, 0.1827, 0.9, 0.6, and 0.5, respectively, which were obtained from the InVEST model (version 3.8.4).

2.4. Natural Ecological Water Demand Model

The natural ecological water demand was mainly calculated for natural vegetation. The total ecological water demand (EWR) for natural vegetation was calculated using the area quota method, which determines the ecological water demand quota by multiplying the ecological water demand per unit area with the vegetation area [20]. The potential evapotranspiration of vegetation was used as the ecological water demand quota. Since long-term field observations were difficult to conduct, indirect calculations were made using the vegetation evapotranspiration method, as shown in Equation (5).
E W R = i = 1 n E T c × A i
E T c = E T 0 × K c
where EWR is the total ecological water use of natural vegetation, m3; Ai is the area of vegetation type i, km2; ETc is the ecological water use quota for plants, mm; ET0 is the daily potential evapotranspiration of plants, mm/day; Kc is the crop coefficient for the corresponding type of plant.

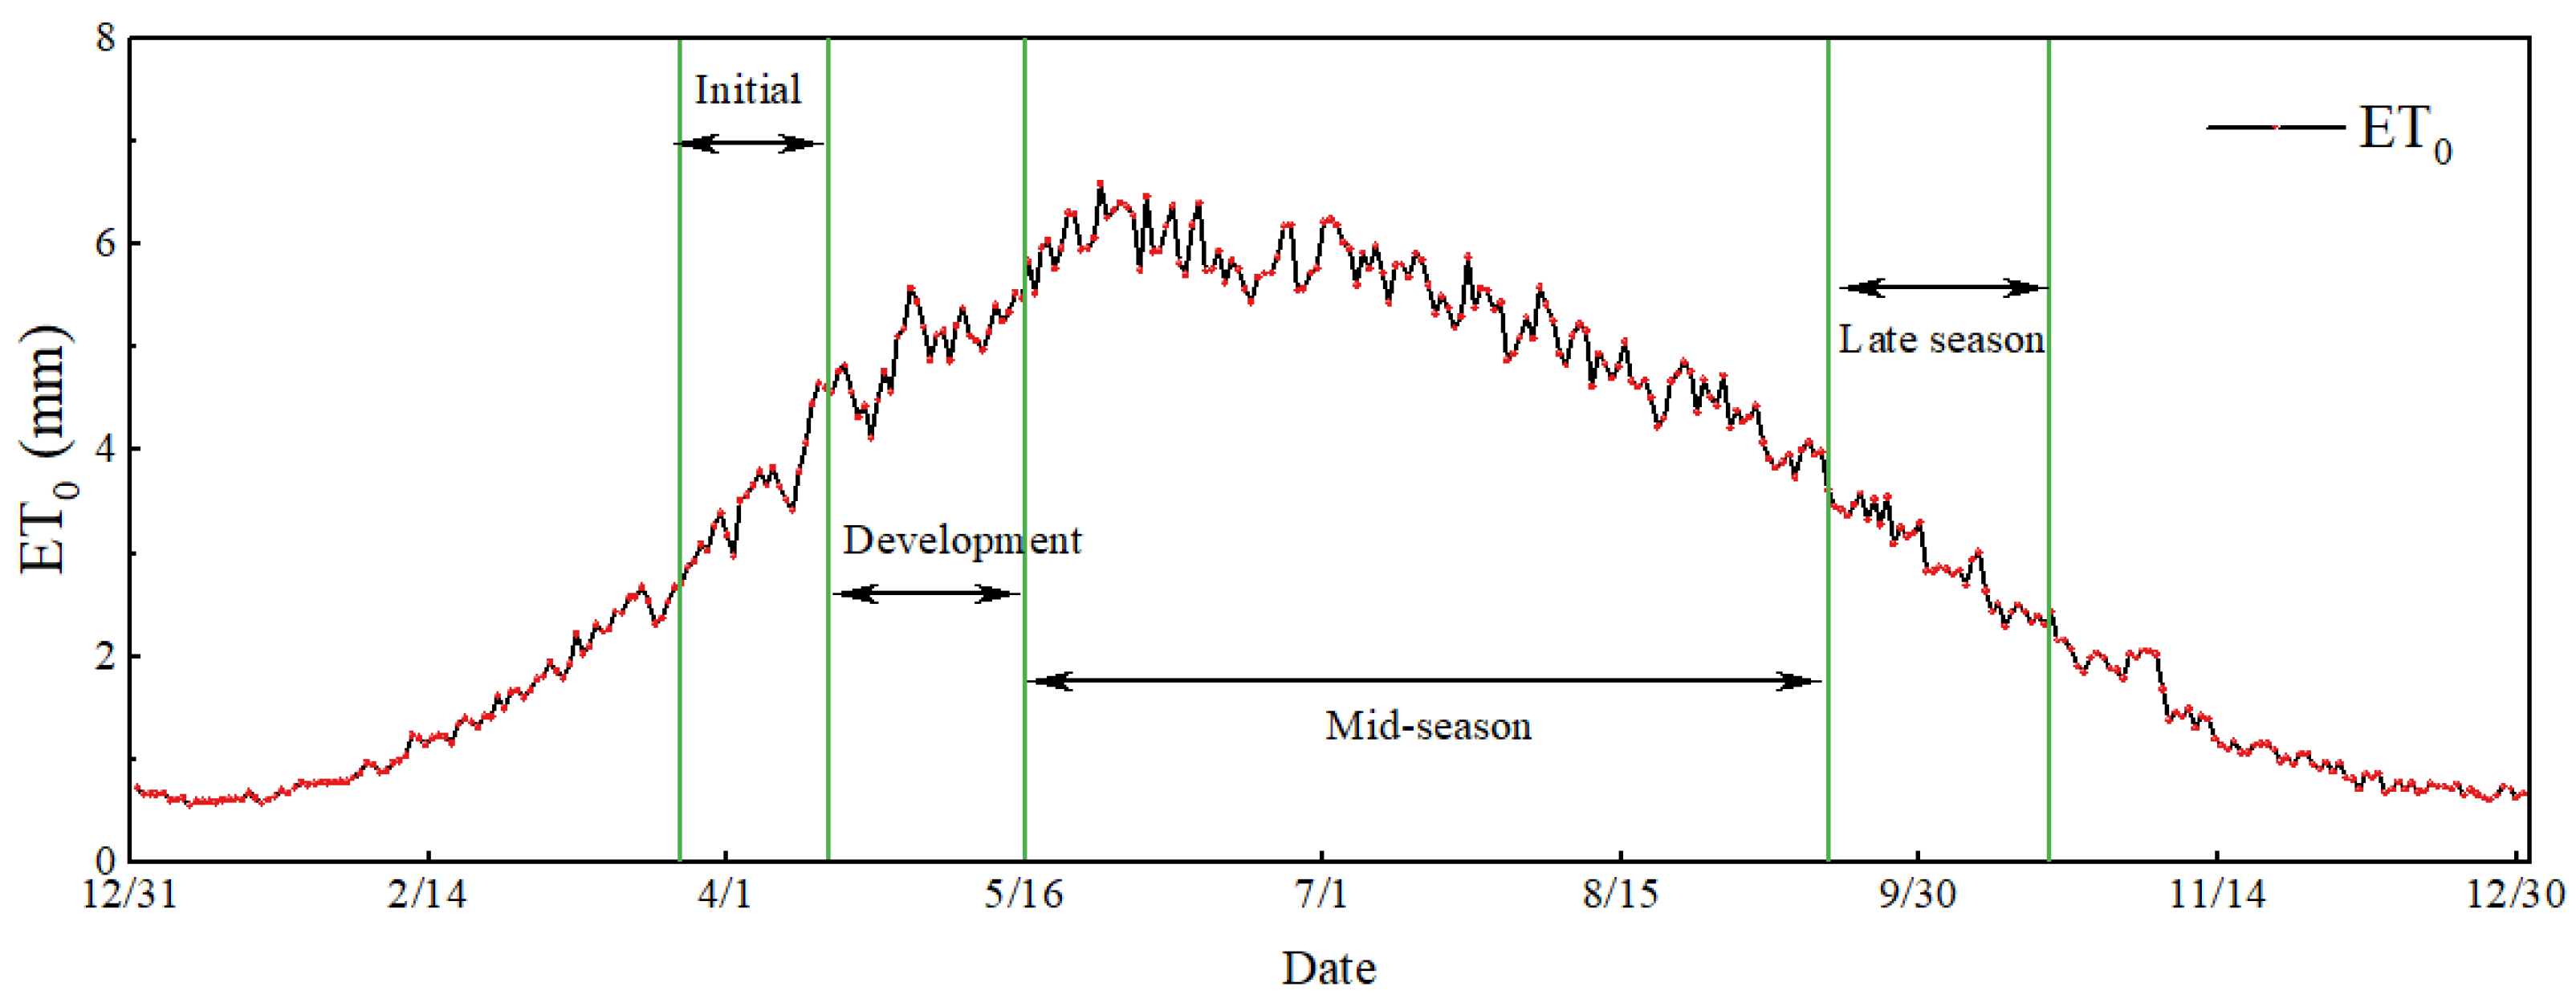
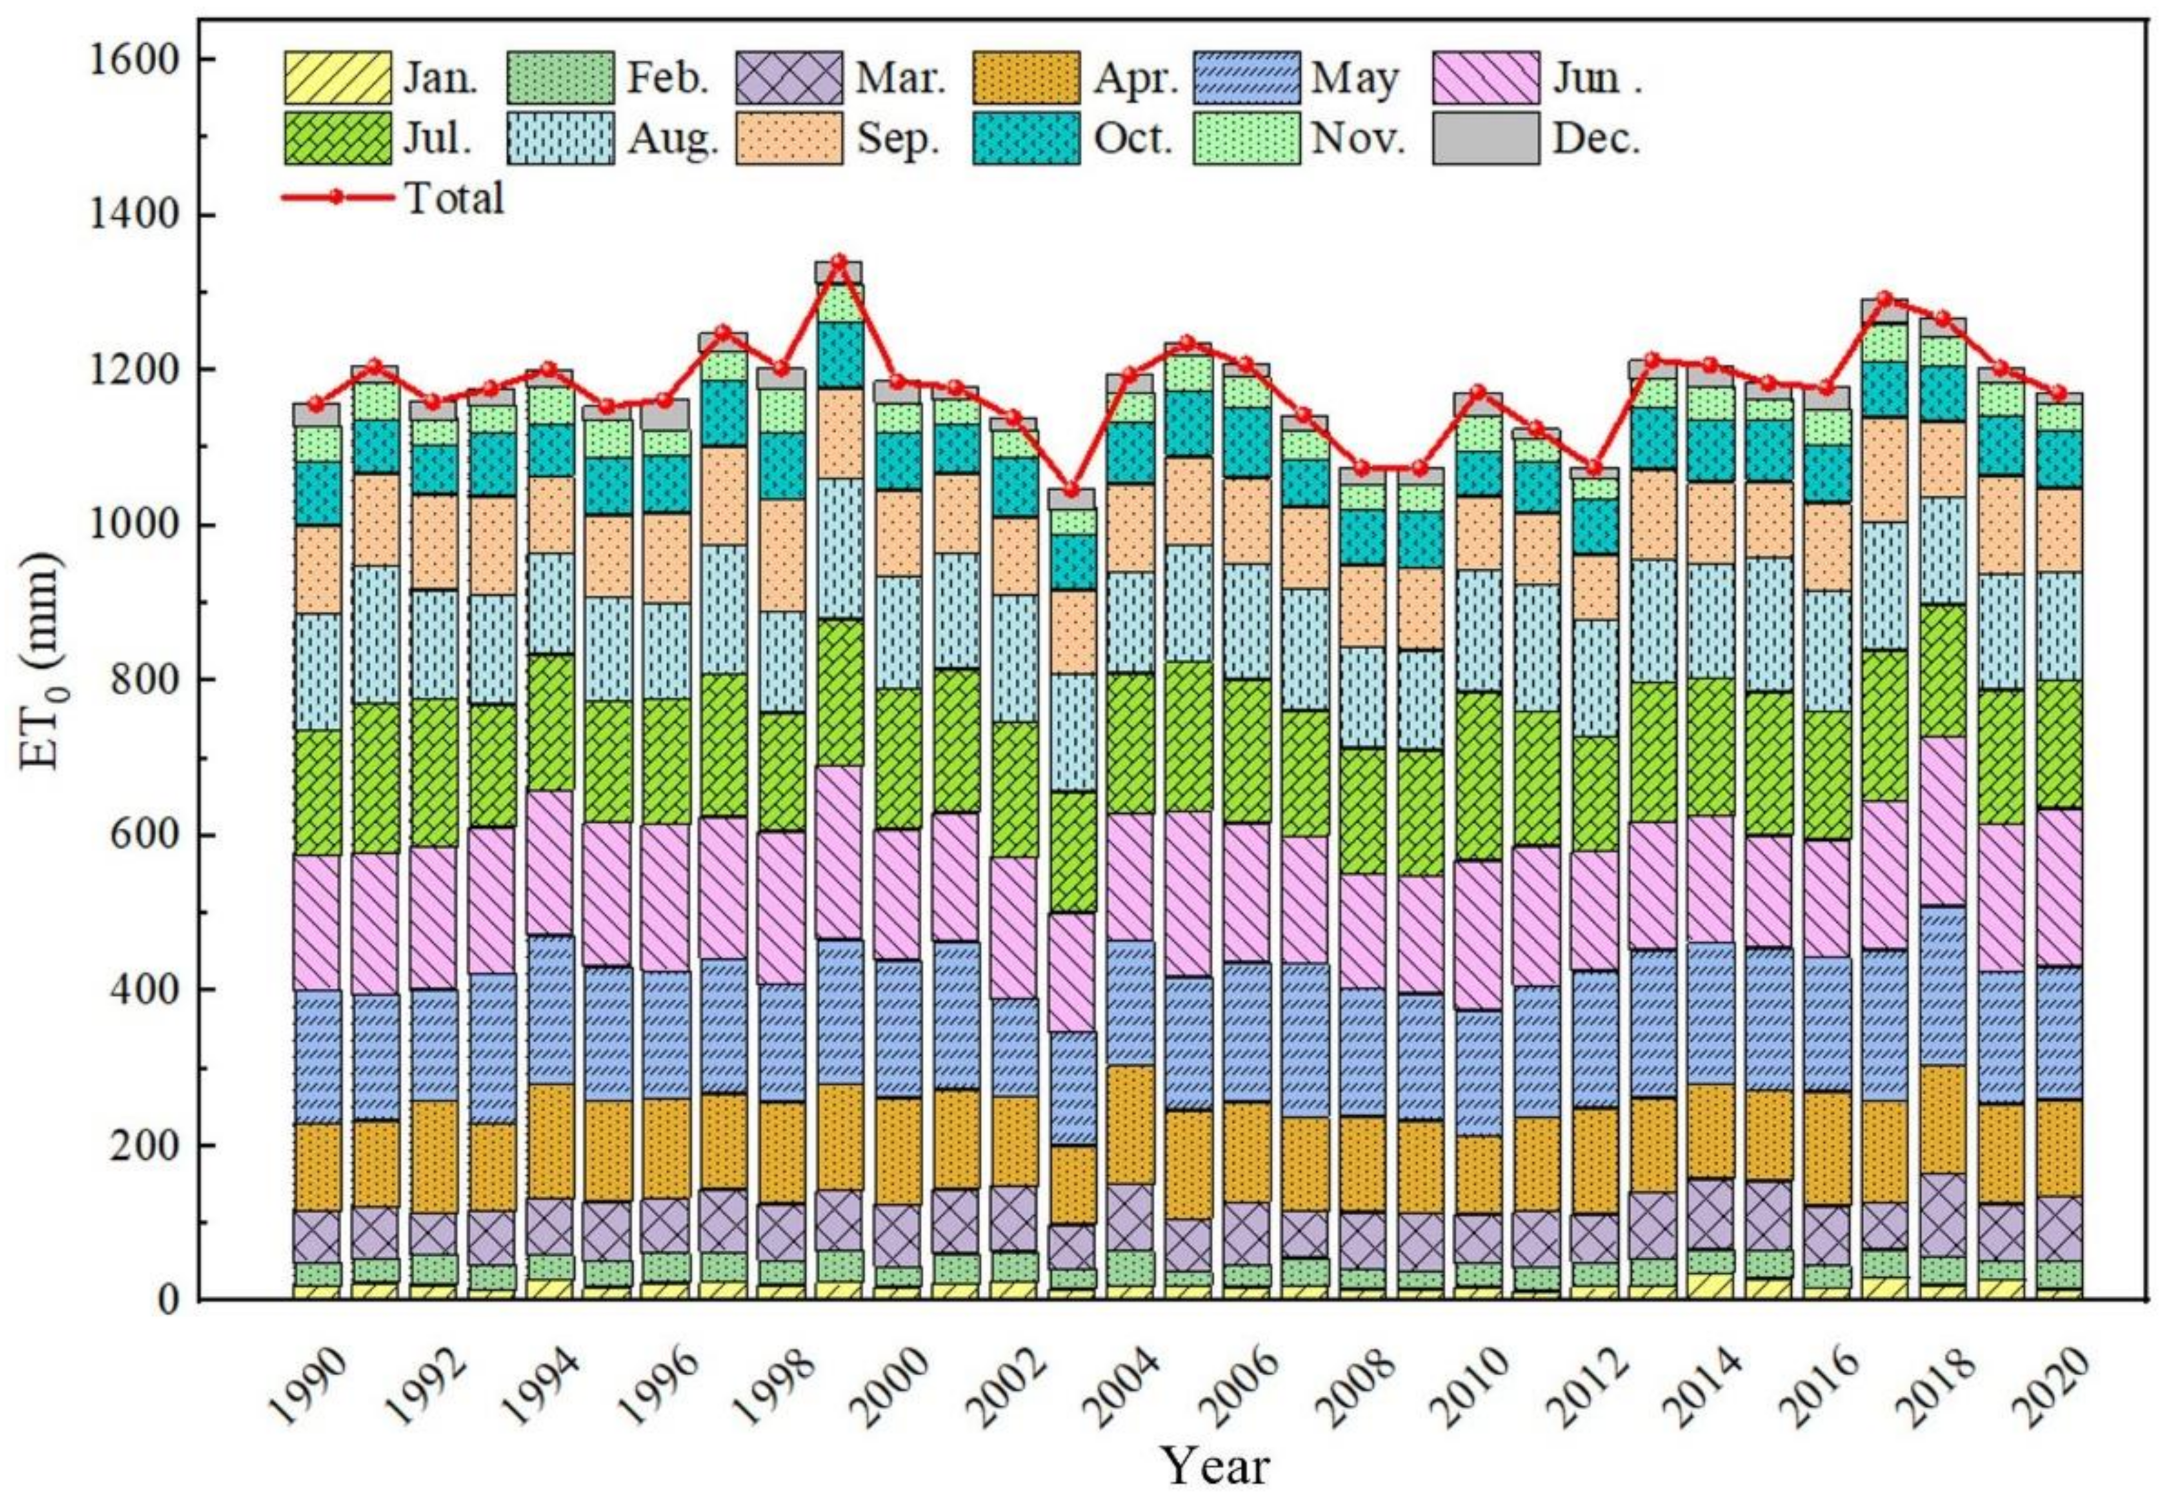
2.4.1. Reference Plant Evapotranspiration

Reference plant evapotranspiration (ET0) was calculated using the Penman–Monteith model recommended by the World Food and Agriculture Organization (FAO) and was given by Equation (6) [20,21,22].
E T 0 = 0.408 Δ ( R n G ) + γ 900 T m e a n + 273 u 2 ( e s e a ) Δ + γ ( 1 + 0 . 34 u 2 )
where ET0 is the potential evapotranspiration rate, mm/day; ∆ is the slope of the saturation water pressure curve, kPa/°C; Rn is the net surface radiation, MJ/(m2·day); G is the soil heat flux, MJ/(m2·day); γ is the wet and dry gauge constant, kPa/°C; Tmean is the mean daily temperature, °C; u2 is the wind speed at a height of 2 m, m/s; es is the saturation water pressure, kPa; ea is the actual water pressure, kPa.

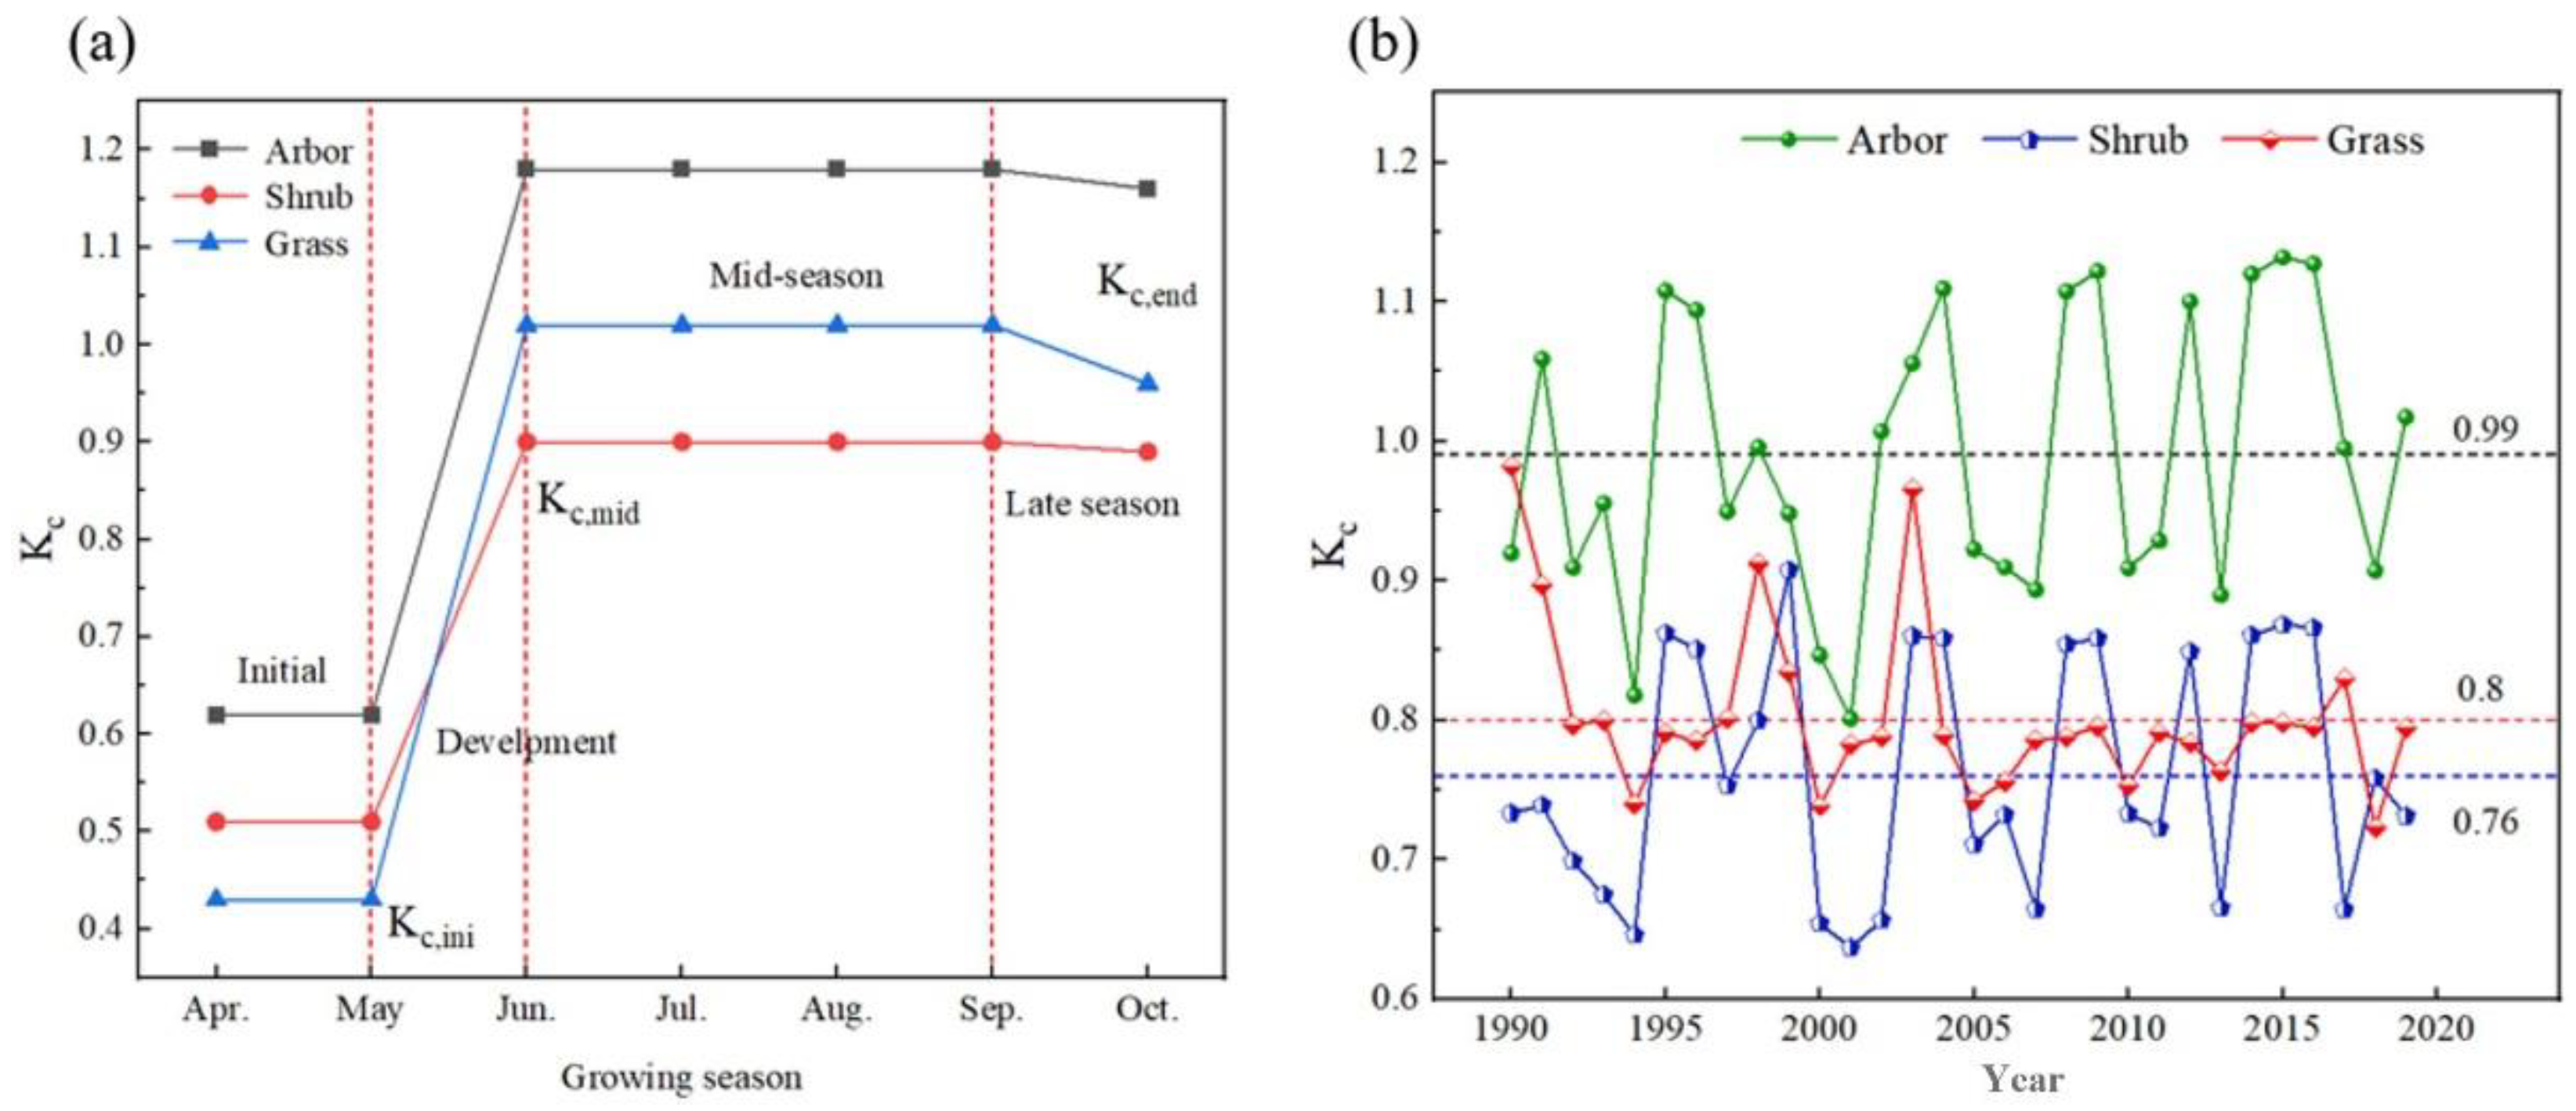
2.4.2. Growing Season Plant Coefficient

The plant coefficient (Kc) reflects the water demand and evaporation characteristics of the plant. In this study, the plant growing season was specifically divided into the situations in Table S1 based on the actual growth of arbors, shrubs, and grassland in the study area. Kc can be calculated using linear interpolation for the developmental and late growth stages, so only three values of Kc,ini, Kc,mid, and Kc,end need to be calculated.
Kc, ini is mainly determined by the time interval between soil wetting, the degree of wetting and the evaporation capacity of the atmosphere [23,24]. Precipitation data from weather stations were used to calculate the wetting time for initial growth stages from 1990 to 2020. Average potential evapotranspiration (ET0) for each vegetation type during the initial growth phase was calculated. Kc,ini for each vegetation type was then determined from wetting time and mean ET0, using Figure S1 in the FAO-56 document as reference.
Kc,mid and Kc,end are calculated by Equations (7) and (8). These two equations are specific adjustments for climatic conditions where the minimum relative humidity (RHmin) in the study area is not equal to 45% or the mean two-minute wind speed (u2) is not equal to 2.0 m/s.
K c , m i d = K c , m i d ( T a b ) + [ ( 0.04 u 2 2 ) 0.004 ( R H m i n 45 ) ] ( h 3 ) 0.3
K c , e n d = K c , e n d ( T a b ) + [ ( 0.04 u 2 2 ) 0.004 ( R H m i n 45 ) ] ( h 3 ) 0.3
where the values of Kc,mid(Tab) and Kc,end(Tab) are determined by referring to FAO-56 document. The values of Kc,mid(Tab) for arbors, shrubs, and grassland in this study were 1.0, 0.8, and 0.95, respectively, and the values of Kc,end(Tab) were 1.0, 0.8, and 0.9, respectively.

2.4.3. Area of Various Vegetation

Figure 3 displays the land-use changes in the Bayan Obo mining area from 1990 to 2020, with a spatial resolution of 30 m. Table S2 summarizes the areas of the three vegetation types, which were determined using ArcGIS 10.7 and linear interpolation.

2.5. Artificial Ecological Water Demand Calculation Model

Based on the conditions observed in the Bayan Obo mining area, the projected water demand for artificial ecology encompasses the water demand for artificial green spaces, as well as the water demand for artificial lakes.

2.5.1. Ecological Water Demand in Artificial Green Land

The ecological water demand of the artificial green land was calculated using the fixed amount method, as shown in Equation (9).
W G r a s s = q G r a s s × A G r a s s
where the WGrass is the ecological water demand of the green land, m3; qGrass is the green land irrigation quota, m3/m2; AGrass is the area of the green land, m2.
The total area of artificially constructed green areas in 2019 in the Bayan Obo mine was 2.60 × 10⁶ m2. According to the industry water use standard of Inner Mongolia Autonomous Region in China, the irrigation rate for grass in the gardening industry was 0.02 m3/ (m2 day) and 0.015 m3/ (plant day) for street trees (DB15/T 385-2020). As the green vegetation in the Bayan Obo mine area was mainly grass, the irrigation quota for green areas was 0.02 m3/ (m2 day), and the ecological water demand for green areas was calculated according to the standard of irrigation six times a month.

2.5.2. Ecological Water Demand in Artificial Lakes

The ecological water demand of artificial lakes is composed of lake seepage and evaporation, with the former being negligible due to topographic and geological reasons. Therefore, in this study, the ecological water demand of artificial lakes in the Bayan Obo mining area was estimated based on evaporation. The Penman method [25] was used to calculate the evaporation rate from the lakes, with Equations (10)–(11) as follows:
W = E 0 × A 0
E 0 = 700 T m / ( 100 A ) + 15 ( T T d ) ( 80 T )
where W is the ecological water requirement of the lake, m3; E0 is the evaporation rate of the water body, mm/day; A0 is the area of the artificial lake, m2; Tm = T + 0.06 h, h is the altitude, m; T is the average temperature, °C; A is the latitude of the location, °; Td is the average dew point temperature, °C.

2.6. Ecological Water Demand Prediction Model

2.6.1. Qualitative Prediction

The Markov model [26] was used for qualitative predictions. This model predicts the potential future state of a system based on its current state and the trend of state transitions, achieved by building a system of differential equations expressed as x(k) = P(1)k [27]. The Markov chain involves determining the initial state based on data, calculating the transition probability matrix, and identifying the initial state vector to obtain the prediction results. In this study, the Markov qualitative prediction was obtained using MATLAB 2020b software.
Following the calculation process of the Markov model and the results of the ecological water demand of natural vegetation in the Bayan Obo mining area from 1990 to 2019, the initial state vector of the ecological water demand of arbors, grassland, and total natural vegetation was determined as P0 = (1, 0) and the initial state vector of the ecological water use of shrubs as P0 = (0, 1), and the transfer probability matrix of each type was calculated by the program as:
P T r e e s = [ 9 / 13 4 / 13 2 / 5 3 / 5 ] P S h r u b s = [ 5 / 11 6 / 11 5 / 17 12 / 17 ] P G r a s s = [ 5 / 12 7 / 12 1 / 2 1 / 2 ] P T o t a l = [ 4 / 11 7 / 11 8 / 17 9 / 17 ]

2.6.2. Quantitative Prediction

Quantitative predictions were conducted using the grey model, which is a forecasting method based on grey system theory [28]. Grey systems are situated between white systems (where all information within the system is completely known) and black systems (where all information within the system is completely unknown to the outside world). This means that there are both known and unknown pieces of information within the system and that there are uncertain relationships between the factors within the system [29]. The grey model is a mathematical model for forecasting that requires only a small amount of information. The commonly used model is the GM (1.1) model, which requires relatively few data and influence factors and is easy to calculate. The GM (1.1) model is obtained by establishing an exponential differential equation based on the original data [30,31]. Prediction results need to be tested for accuracy, and the model’s accuracy is commonly assessed by the small error probability P and the mean squared error ratio C, as shown in Table S3.

2.6.3. Quota Method Forecasting

The forecast of artificial ecological water demand was based on the fixed-rate method, estimating projections from changes in the area of artificial green space and artificial lakes in the planning year.

2.7. Statistical Analysis

According to the accuracy of 30 m, the area of three vegetation types in each year was extracted through ArcGIS 10.7. On this basis, linear interpolation and polynomial fitting methods were used to obtain various vegetation areas from 1990 to 2020. When determining the value of plant coefficient Kc from 1990 to 2019, the average values of Kc,ini, Kc,mid, and Kc,end for each year are taken as the Kc of corresponding plants. In GM (1,1) prediction, the results need to be tested for accuracy.

3. Results and Discussion

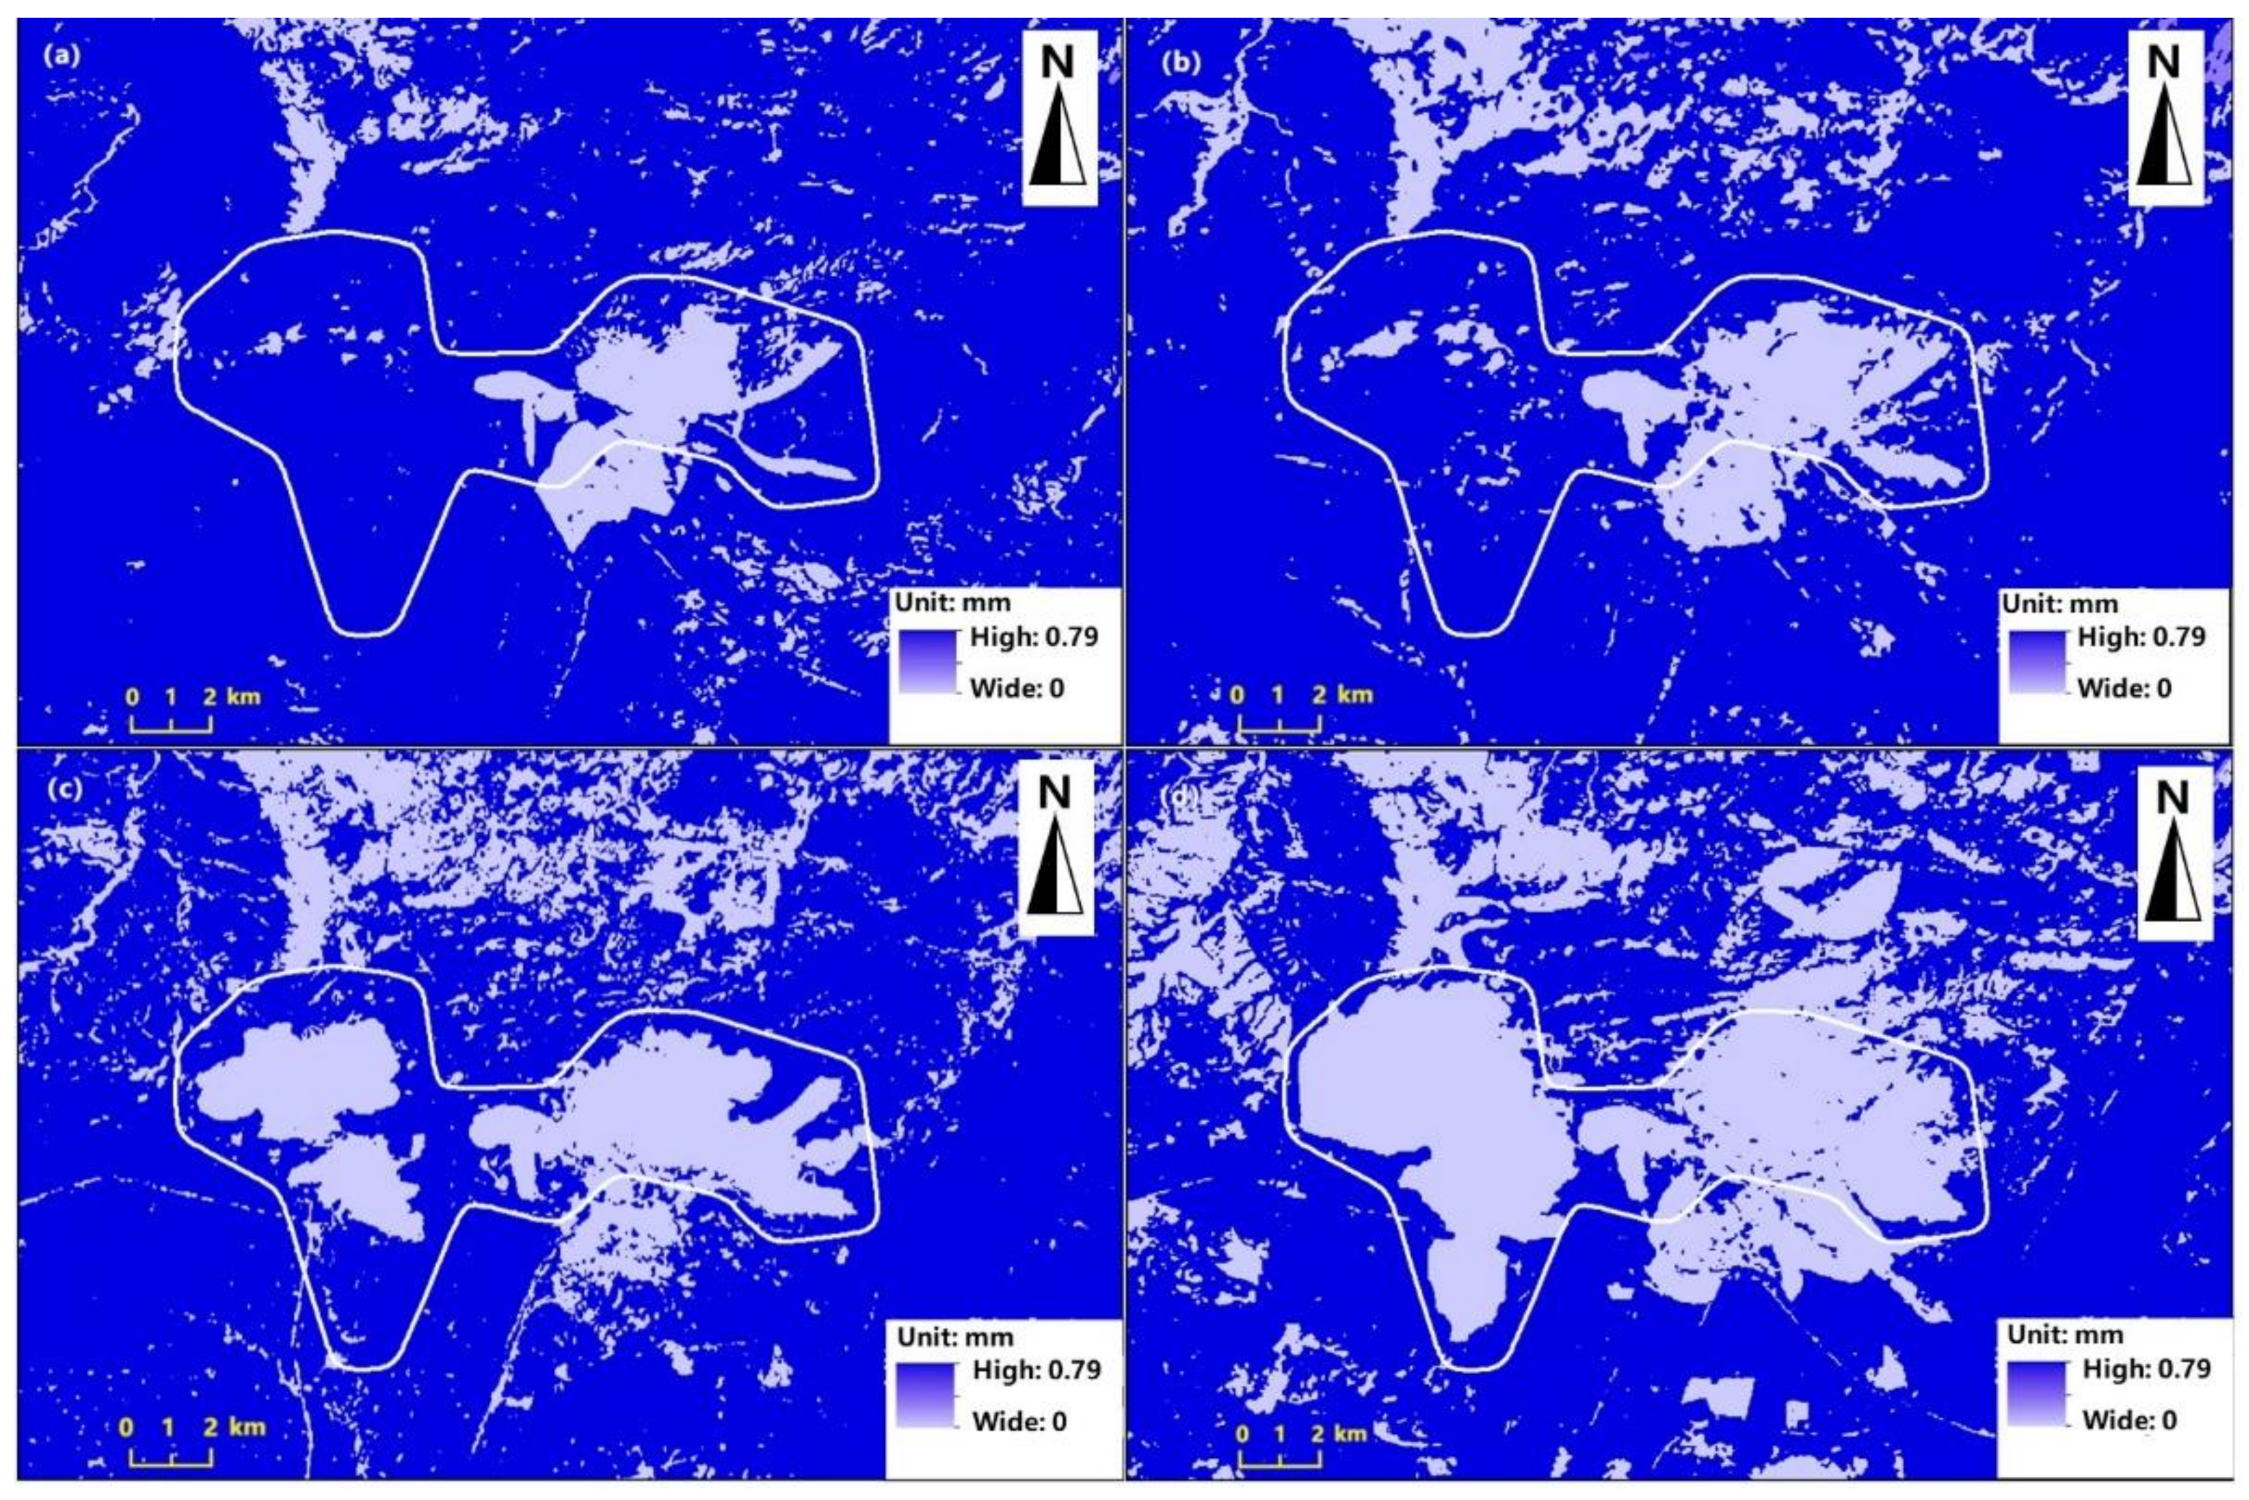
3.1. Water Yield and Water Conservation in the Bayan Obo Mine

Based on the model, we obtained the spatial distribution diagrams of annual water yield (Figure 4) and water conservation (Figure 5) of the Bayan Obo Mine from 1990 to 2020. The spatial distribution diagram of water yield shows a distinct boundary, and it is evident that the maximum water yield depth is below 1 mm, with a part of the mine losing its water yield capacity. With time, this area has expanded, and most of the region has lost its vegetation cover, resulting in the loss of its water production function. The negative water conservation value is closely related to the region’s climate, with low temperatures, little rainfall, droughts, and winds. The precipitation is considerably lower than the evapotranspiration, making it challenging to retain precipitation. As a result, the water conservation ability is close to zero.
Based on the water yield and conservation statistics of the Bayan Obo Mine, a significant downward trend was observed in both. The loss of water per square kilometer from 1990 to 2020 was 429.83 m3, with an annual loss of 14.33 m3 (Table 1). At this rate, the water yield in the mine is projected to be completely depleted in 14 years. This trend will exacerbate the already severe drought in the region, hindering efforts to restore vegetation.

3.2. Estimation of the Ecological Water Demand in the Bayan Obo Mining Area

3.2.1. Estimation of the Natural Ecological Water Demand

The variation of daily average ET0 of vegetation in the Bayan Obo mining area from 1990 to 2020 is illustrated in Figure 6. The average daily ET0 of plants in the mining site fluctuated from 0.55 to 6.59 mm, exhibiting seasonal variation characteristics. ET0 was lower in winter and higher in summer, which corresponded to the evaporation pattern of the mining area. The primary contributing factors were the rising summer temperature and sunshine hours [32,33,34]. During the vegetation growth period, ET0 of plants indicated a clear upward trend in the early and developing growth stages, reaching a peak value in the early mid-growth stage, gradually declining around 10 July, and experiencing a significant drop upon entering the late growth stage. ET0 values for non-growing vegetation remained largely unchanged, increasing mainly with rising temperature.
The average annual ET0 values in the mine area from 1990 to 2020 exhibited fluctuating variations, ranging from approximately 1000 to 1350 mm, as shown in Figure 7. The annual average ET0 was 1179.5 mm, with the lowest value recorded in 2003 at 1046.8 mm and the highest value in 1999 at 1339.5 mm. The months of May, June, and July had the highest ET0 values in all years, while April and August had lower ET0 values, consistent with the overall ET0 variation during the vegetation growing season.
The growing season vegetation coefficient (Kc) values and the average Kc values by year for the different vegetation types are presented in Figure 8a,b, respectively. As depicted in Figure 8a, the Kc values for arbors, shrubs, and grasslands in the Bayan Obo mining area exhibited overall consistent variations, and their change curve was consistent with that of the broad vegetation coefficient curve. However, the Kc values did not show a significant decrease in the late growth period of each vegetation, which may be attributed to the meteorological and climatic conditions of the mine. As the temperature of the mining area remained stable in August, September, and early October and decreased suddenly in mid-October, the vegetation rapidly entered the late growth stage. During this time, there was no significant change in vegetation height and little variation in wind speed and minimum relative humidity, resulting in insignificant Kc decline for each plant during the late growth period.
Furthermore, as depicted in Figure 8b, the variations in Kc values by year from 1990 to 2020 in the Bayan mining area are illustrated. The Kc values of all three vegetation types exhibited the same fluctuating trend, which was primarily caused by the meteorological conditions in each year. The average Kc value during the growing season was employed as the Kc value of the vegetation for each year to compute the ecological water demand. From 1990 to 2020, the Kc value for arbors oscillated around 0.99, while the average Kc values for grassland and shrubs were 0.8 and 0.76, respectively. These values were relatively close to one another.
Based on the calculated ET0 values for each year, as well as the Kc values of the three types of plants and the corresponding vegetation area, the ecological water demand of natural vegetation in the Bayan Obo mining area was calculated from Equations (4) and (5), as shown in Table S4. The natural ecological water demand in the mining area ranged from 1.48 × 10⁸ m3 to 2.30 × 10⁸ m3, with the highest value in 1990 and the lowest value in 2018. The ecological water demand of grassland was the highest over the 30-year period at 2.24 × 10⁸ m3 in 1990 and the lowest at 1.43 × 10⁸ m3 in 2018. The average natural ecological water consumption in the Bayan Obo mining area over the 30-year period was 1.81 × 10⁸ m3, with the average ecological water consumption of arbors, shrubs, and grassland being 1.46 × 10⁶ m3, 4.48 × 10⁶ m3, and 1.75 × 10⁸ m3, respectively. Based on the average value, the ecological water demand of grassland was closer to the total natural ecological water demand than that of arbors and shrubs.
Plant trees on area was the main reason for the change in natural ecological water demand in the mining area. It could also be found that the ecological water demand of arbors had tended to increase since 2005. This was because the afforestation measures increased the area of arbors in the mine area to enhance ecological protection.
Figure 9 depicts the proportion of total natural ecological water demand by the three vegetation types in the Bayan Obo mining area. Grassland ecological water demand constituted the primary natural ecological water demand in the mine area, accounting for 96−97%, whereas shrubs and arbors accounted for 3%, mainly because grassland was the dominant vegetation type in the mining area. The formula for calculating the ecological water demand of vegetation reveals that the ecological water demand of vegetation is mainly related to the area of vegetation, climatic conditions, and water demand characteristics of vegetation [35]. For the three vegetation types in the Bayan Obo mining area, they were essentially under the same climatic conditions. By computing the Kc of the three plants, their similar water demand characteristics were discovered, which made the vegetation area the primary reason for the natural ecological water demand’s change in the mining area. Additionally, it was observed that the ecological water demand of arbors had tended to increase since 2005, mainly due to the afforestation measures increasing the arbors’ area in the mining area to enhance ecological protection.

3.2.2. Estimations of the Artificial and Total Ecological Water Demand

Artificial ecological water demand in the Bayan Obo mining area consists of artificial green land and artificial lake ecological water demand. According to Equations (9)–(11), the ecological water demand of artificial green land and artificial lake in the base year (2019) in the Bayan Obo mining area is 3.74 × 10⁶ m3 and 9.7 × 10⁴ m3, respectively.
The artificial ecological water demand in the Bayan Obo mining area comprises the ecological water demand of artificial green land and artificial lake. According to Equations (9)–(11), the ecological water demand of artificial green land and artificial lake in the base year (2019) of the Bayan Obo mining area is 3.74 × 10⁶ m3 and 9.7 × 10⁴ m3, respectively.
Table 2 shows the calculation results of the total ecological water demand in the base year (2019) of the Bayan Obo mining area. The total ecological water demand in the mining area was 1.58 × 10⁸ m3, of which the natural ecological water demand was 1.54 × 10⁸ m3, accounting for 97.47% of the total. The artificial ecological water demand accounted for only 2.53% of the total ecological water demand, which was mainly due to the fact that the artificial ecosystem was built in the urban area of the Bayan Obo mining area, which only occupied 3% of the total area of the mining area. The rest of the area was covered by large areas of natural forest and grass vegetation, which resulted in a large proportion of the natural ecological water demand in the mining area.

3.3. Ecological Water Demand Prediction

3.3.1. Prediction of Natural Ecological Water Demand

Qualitative Prediction
The Markov chains method was utilized for prediction and the predicted ecological water demand states and probabilities for each type of vegetation in the Bayan Obo mining area in 2025, 2030, and 2035 were presented in Table S5. The results indicated that the ecological water demand states for all types of natural vegetation and total vegetation water demand in the mining area were predicted to decline. The probability of a reduction in total vegetation in 2025, 2030, and 2035 was 119 out of 207. The likelihood of a decrease in ecological water demand for arbors was 668 out of 1247 in 2025 and 15 out of 28 in both 2030 and 2035, indicating a slight increase in probability. The probability of a decline in ecological water demand for shrubs was 4297 out of 6614 in 2025 and 102 out of 157 in both 2030 and 2035. In contrast, the likelihood of a reduction in ecological water demand for grassland was 7 out of 13 in 2025, 2030, and 2035. Although the ecological water demand status of arbors in the planning year was projected to decrease, the probability was low and similar to the probability of an increase. Hence, it could not be directly deemed as decreasing in each planning year and required consideration in combination with the quantitative prediction results.
Quantitative prediction
In this study, the prediction of GM (1,1) was carried out through the use of a MATLAB program. Based on the calculation results of water demand for arbors, shrubs, grassland, and total natural vegetation in the Bayan Obo mining area from 1990 to 2019, the predicted ecological water demand for each type was obtained as presented in Figure 10. The accuracy of the model was evaluated according to Table S3, and it was found that the accuracy of each prediction was only marginally satisfactory. Given the long original data series and the tendency of fluctuations, the marginal accuracy indicates that the prediction results were effective and the predicted data were credible.
Table S6 presents the ecological water demand of each vegetation type in the planning year of the Bayan Obo mining area obtained through GM (1,1) quantitative prediction. The total ecological water demand of natural vegetation decreased from 1.54 × 10⁸ m3 in the base year to 1.31 × 10⁸ m3 in 2035, representing a decrease of 15.6%. The ecological water demand of shrubs and grassland decreased by 22.1% and 13.2%, respectively. In contrast, the ecological water demand of arbors showed an increasing trend, rising from 2.02 × 10⁶ m3 in the base year to 3.05 × 10⁶ m3 in 2035, which is an increase of 51%.
The quantitative projection for the ecological water demand of arbors did not align with the qualitative projection. This discrepancy was mainly caused by the fact that although the arbors’ ecological water demand showed a decreasing trend from 2014 to 2018, the overall trend was increasing. Consequently, the qualitative prediction results were in a downward state, but the probability of decline was close to the probability of increase, leading to the discrepancy between the qualitative and quantitative prediction results.
The qualitative and quantitative predictions of the total ecological water demand for shrubs, grassland, and vegetation were found to be consistent. Moreover, the more significant the probability of the qualitative state, the more noticeable was the corresponding decreasing trend in the quantitative results and the greater was the magnitude of the decrease. In conclusion, combining both qualitative and quantitative methods was deemed to be a more reasonable and accurate approach for predicting ecological water demand in the planning year.

3.3.2. Predictions of the Artificial and Total Ecological Water Demand

The quota method was employed to predict the artificial ecological water demand, wherein the urban development plan for the Bayan Obo mining area was consulted to estimate the ecological water demand of the artificial green land for the planning year. With the implementation of the mine re-greening project and further urban greening, an increase in the greening rate was anticipated. In light of the current greening rate of 26% in the Bayan Obo mining area in 2019, the greening rate was projected to rise to 28% in 2025, 32% in 2030, and 38% in 2035, resulting in corresponding green space areas of 2.8 × 10⁶ m2, 3.2 × 10⁶ m2, and 3.8 × 10⁶ m2, respectively (refer to Table S7). The ecological water demand of the base year was utilized to calculate the green land irrigation quota for the planning year. Consequently, the ecological water demand of artificial green land in 2025, 2030, and 2035 was projected to be 4.03 × 10⁶ m3, 4.61 × 10⁶ m3, and 5.47 × 10⁶ m3, respectively.
The ecological water demand of the artificial lakes in the Bayan Obo mining area is relatively small, representing only 2.5% of the mining area’s total artificial ecological water demand. Moreover, no planning has been made for the area of artificial lakes in the mining area, and the evaporation rate of the lakes is minimally affected by meteorological conditions. Therefore, the ecological water demand for artificial lakes in the planning year was estimated to be approximately 9.7 × 10⁴ m3, based on the base year.
Overall, the predicted total ecological water demand for the Bayan Obo mining area in 2025, 2030, and 2035 is expected to be 1.50 × 10⁸ m3, 1.43 × 10⁸ m3, and 1.37 × 10⁸ m3, respectively (refer to Table 3). The prediction reveals that the future ecological water demand of the Bayan Obo mining area will exhibit a declining trend, primarily due to the significant decrease in natural ecological water demand. This decline is mainly attributed to the continuous decrease of the natural vegetation area in the Bayan Obo mining area from 1990 to 2019, and it is anticipated that the natural vegetation area will continue to decrease to some extent in the future under natural conditions, resulting in a reduction in water demand. In contrast, the artificial ecological water demand is expected to increase due to the ongoing mine area re-greening project, which is continuously carried out, resulting in the expansion of the artificial green area, and accordingly, an increase in the artificial ecological water demand.

4. Conclusions and Suggestions

In this study, we have calculated and analyzed the water conservation and ecological water requirements for the Bayan Obo mining area. The mining area has lost its capacity for water production, resulting in negative water source conservation, and precipitation levels are far lower than evapotranspiration, making it difficult to retain precipitation. The total ecological water demand for 2019 was calculated to be 1.58 × 10⁸ m3, with natural ecological water demand accounting for 97.47% at 1.54 × 10⁸ m3 and artificial ecological water demand accounting for 2.53% at 3.84 × 10⁶ m3, mainly concentrated in the urban area. The ecological water demand for the Bayan Obo mining area in the planning year was predicted through qualitative, quantitative, and quota methods. In 2025, 2030, and 2035, the total ecological water demand decreased by 5.06%, 9.49%, and 13.29%, respectively, compared to the base year, with the natural ecological water demand decreasing by 5.19%, 9.74%, and 14.29%, while the artificial ecological water demand increased by 7.55%, 22.66%, and 45.05%. The ecological environment of drought and water shortage will lead to an increasingly prominent contradiction between the supply and demand of water resources with the continuous improvement of the coverage rate of artificial vegetation. To address the problem of ecological environment water use in arid mining areas, we propose improving the reuse rate of reclaimed water, storing rainwater in reservoir pools, increasing the water supply capacity of the “Diverting Water from the Yellow River into the Bayan Obo” project, and selecting drought-resistant vegetation and water-saving irrigation. The study of ecological water demand is of great significance for the development and utilization of water resources, ecological environment protection, and sustainable development in arid mining areas.
The long-standing mining activities in the Bayan Obo mining area have caused severe damage to the natural vegetation, leading to a decline in the overall ecological water requirement due to a reduction in vegetation cover. In recent times, to sustain the ecological safety of the mining area, enhance the function of the natural ecological landscape, and establish a green environmental protection system, the government of the Bayan Obo mining area has designed and put into effect an all-encompassing ecological restoration plan for the mining area, striving to develop a “green mine”. Here are some suggestions:
(1) Proactive measures will be taken to construct reclaimed water reuse facilities and increase the utilization of reclaimed water. This practice can partially alleviate the shortage of water resources and mitigate environmental pollution resulting from wastewater. Currently, there is a sewage treatment plant in the Bayan Obo mining area. However, given the increase in water consumption, it is essential to augment the sewage treatment capacity and enhance its efficacy. Moving forward, we may consider constructing or renovating sewage treatment facilities to fully utilize reclaimed water for ecological water recharge in the mining area. Moreover, reclaimed water that meets the required standards can be employed for greening purposes in the mining area.
(2) The “Diverting Water from the Yellow River into the Bayan Obo” project aims to transfer water from the Yellow River to the Bayan Obo mining area. The project was successfully completed in October 2009. In the future, we must remain vigilant towards the water transmission capacity of the “Diverting Water from the Yellow River into the Bayan Obo” project. Regular monitoring should be conducted to detect issues such as pipeline aging and damage that may affect water use in the mining area. With the increasing demand for water resources and decreasing water transmission capacity, it may become challenging for the engineering water transmission to satisfy the water consumption needs of mining areas. Therefore, we can implement various water-saving measures to retain and store precipitation, which can significantly enhance the utilization efficiency of rainwater.
(3) When drafting the ecological environment construction plan, it is essential to consider the ecological water demand of the Bayan Obo mining area to optimize the allocation of water resources. In the context of water resource scarcity, it is crucial to fulfill the ecological water demand of urban areas as much as possible to guarantee the sustainable development of urban ecosystem functions and prevent ecological issues such as grassland desertification and artificial lake atrophy. Additionally, selecting drought-resistant vegetation that aligns with the water demand characteristics of plants is necessary. Water-saving irrigation must be employed to ensure optimal plant growth, improve the efficacy of vegetation restoration, and establish a high-quality green mining area.

Supplementary Materials

The following supporting information can be downloaded at: https://0-www-mdpi-com.brum.beds.ac.uk/article/10.3390/su15054238/s1.

Author Contributions

Conceptualization, Q.-Q.W. and Z.W.; Methodology, Q.-Q.W., C.-X.G. and T.Y.; Software, Q.-H.J.; Formal analysis, Y.-Q.L.; Investigation, Q.-Q.W. and T.-T.Z.; Resources, L.W., T.-T.Z., Q.-H.J. and T.Y.; Writing—original draft, Q.-Q.W. and C.-X.G.; Writing—review & editing, Z.W.; Funding acquisition, Z.W. All authors have read and agreed to the published version of the manuscript.

Funding

This research was funded by National key research and development program (2018YFC1802904), the National Science Foundation of China (52264013, 42061049), Inner Mongolia Science &and Technology Plan Program (2019 and 2020), the National Science Foundation of Inner Mongolia (2020MS02005), Inner Mongolia Engineering Research Center of Evaluation and Restoration in the Mining Ecological Environment, the Special Fund for the Transformation of Scientific and Technological Achievements in Inner Mongolia (2019CG062), Jiangxi Provincial Department of Education Scientific and Technological Research Project (GJJ2203605) and the APC was funded by Jiangxi Provincial Department of Education Scientific and Technological Research Project (GJJ2203605).

Data Availability Statement

The remote sensing images are from the Geospatial Data Cloud (https://www.gscloud.cn/). Daily meteorological data is from the Chinese Meteorological Data Network (http://data.cma.cn). The landuse data were obtained from the Resource and Environmental Science and Data Centre (https://www.resdc.cn). The publicly archived datasets analyzed or generated during the study are obtained in Supplementary Materials.

Acknowledgments

The authors sincerely acknowledge the anonymous reviewers for their insights and comments to further improve the quality of the manuscript.

Conflicts of Interest

The authors declare no conflict of interest.

References

  1. Cheng, K.; Fu, Q.; Meng, J.; Li, T.X.; Pei, W. Analysis of the spatial variation and identification of factors affecting the water resources carrying capacity based on the cloud model. Water Resour. Manag. 2018, 32, 2767–2781. [Google Scholar] [CrossRef]
  2. Hu, Q.; Huang, G.H.; Cai, Y.P.; Sun, W. Planning of electric power generation systems under multiple uncertainties and constraint-violation levels. J. Environ. Inform. 2014, 23, 55–64. [Google Scholar] [CrossRef] [Green Version]
  3. Ministry of Water Resources of the People’s Republic of China. China Water Resources Bulletin; China Water & Power Press: Beijing, China, 2010.
  4. Ministry of Water Resources of the People’s Republic of China. China Water Resources Bulletin; China Water & Power Press: Beijing, China, 2019.
  5. Naghdi, S.; Bozorg-Haddad, O.; Khorsandi, M.; Chu, X. Multi-objective optimization for allocation of surface water and groundwater resources. Sci. Total Environ. 2021, 776, 146026. [Google Scholar] [CrossRef]
  6. Armentrout, G.W.; Wilson, J.F. Assessment of low flows in streams in northeastern Wyoming. USGS Water Resour. Investig. Rep. 1987, 4, 533–538. [Google Scholar]
  7. Mei, H.; Yang, X.Y.; Liu, Y.; Du, H. The research progress of ecological water requirement in China and abroad. Procedia Environ. Sci. 2010, 2, 1904–1911. [Google Scholar] [CrossRef] [Green Version]
  8. Zhang, Y.L.; Lu, Y.Y.; Zhou, Q.; Wu, F. Optimal water allocation scheme based on trade-offs between economic and ecological water demands in the Heihe River Basin of Northwest China. Sci. Total Environ. 2019, 703, 134958. [Google Scholar] [CrossRef] [PubMed]
  9. Sajedipour, S.; Zarei, H.; Oryan, S. Estimation of environmental water requirements via an ecological approach: A case study of Bakhtegan Lake, Iran. Ecol. Eng. 2017, 100, 246–255. [Google Scholar] [CrossRef]
  10. Zhang, C.; Wan, Z.Y.; Jing, Z.; Zhang, S.H.; Zhao, Y. Calculation of ecological water requirements of urban rivers using a hydrological model: A case study of Beiyun River. J. Clean. Prod. 2020, 262, 121368. [Google Scholar] [CrossRef]
  11. Chi, D.K.; Wang, H.; Li, X.B.; Liu, H.H.; Li, X.H. Estimation of the ecological water requirement for natural vegetation in the Ergune River basin in Northeastern China from 2001 to 2014. Ecol. Indic. 2018, 92, 141–150. [Google Scholar] [CrossRef]
  12. Huang, F.; Ochoa, C.G.; Chen, X.; Zhang, D.R. Modeling oasis dynamics driven by ecological water diversion and implications for oasis restoration in arid endorheic basins. J. Hydrol. 2020, 593, 125774. [Google Scholar] [CrossRef]
  13. Dévai, G.; Gyöngy, M.; Berta, C.; Bogár, F.; Bogár, I.; Varga, G.; Zoltán, L.; József, S.L.; Somlyai, I.; Nagy, S.A.; et al. Long-term analysis of River Tisza water level data with regard to the ecological water demand of floodplain water bodies. Landscape Environ. 2021, 15, 16–32. [Google Scholar] [CrossRef]
  14. Barton, L.; Flottmann, S.J.; Stefanovia, K.T.; Colmer, T.D. Approaches to scheduling water allocations to kikuyugrass grown on a water repellent soil in a drying-climate. Agric. Water Manag. 2020, 230, 105957. [Google Scholar] [CrossRef]
  15. Wang, L.Q.; Liang, T.; Zhang, Q.; Li, K.X. Rare earth element components in atmospheric particulates in the Bayan Obo mine region. Environ. Res. 2014, 131, 64–70. [Google Scholar] [CrossRef] [PubMed]
  16. Li, K.X.; Liang, T.; Wang, L.Q.; Yang, Z.P. Contamination and health risk assessment of heavy metals in road dust in Bayan Obo Mining Region in Inner Mongolia, North China. J Geogr. Sci. 2015, 25, 1439–1451. [Google Scholar] [CrossRef] [Green Version]
  17. Tian, S.H.; Liang, T.; Li, K.X.; Wang, L.Q. Source and path identification of metals pollution in a mining area by PMF and rare earth element patterns in road dust. Sci. Total Environ. 2018, 633, 958–966. [Google Scholar] [CrossRef] [PubMed]
  18. Wang, Z.; Luo, Y.F.; Zheng, C.L.; An, C.J.; Mi, Z.S. Spatial distribution, source identification, and risk assessment of heavy metals in the soils from a mining region: A case study of Bayan Obo in northwestern China. Hum. Ecol. Risk Assess. 2021, 27, 1276–1295. [Google Scholar] [CrossRef]
  19. Zhou, J.; Wang, X.; Nie, L.; Mckinley, J.M.; Han, Z. Geochemical background and dispersion pattern of the world’s largest REE deposit of Bayan Obo, China. J. Geochem. Explor. 2020, 215, 106545. [Google Scholar] [CrossRef]
  20. Allen, R.G.; Pereira, L.S.; Raes, D.; Smith, M. Crop evapotranspiration: Guidelines for computing crop requirements. In Irrigation and Drainage Paper No. 56; FAO: Rome, Italy, 1998. [Google Scholar] [CrossRef]
  21. Shahid, S. Impact of climate change on irrigation water demand of dry season Boro rice in northwest Bangladesh. Clim. Change 2011, 105, 433–453. [Google Scholar] [CrossRef]
  22. Paredes, P.; Pereira, L.S.; Almorox, J.; Darouich, H. Reference grass evapotranspiration with reduced data sets: Parameterization of the FAO Penman-Monteith temperature approach and the Hargeaves-Samani equation using local climatic variables. Agric. Water Manag. 2020, 240, 106210. [Google Scholar] [CrossRef]
  23. Wang, H.; Li, X.B.; Han, R.B.; Ge, Y.Q. Variability of vegetation growth season in different latitudinal zones of North China: A monitoring by NOAA NDVI and MSAVI. J. Appl. Ecol. 2006, 17, 2236–2240. [Google Scholar]
  24. Chen, C.; He, B.; Guo, L.L.; Zhang, Y.F.; Xie, X.M.; Chen, Z.Y. Identifying critical climate periods for vegetation growth in the northern hemisphere. J. Geophys. Res. Biogeosci. 2018, 123, 2541–2552. [Google Scholar] [CrossRef]
  25. Linacre, E.T. A simple formula for estimating evaporation rates in various climates, using temperature data alone. Agric. Meteorol. 1977, 18, 409–424. [Google Scholar] [CrossRef]
  26. Ethier, S.N.; Kurtz, T.G. Markov processes: Characterization and convergence. Biometrics 1986, 43, 113–122. [Google Scholar] [CrossRef]
  27. Zhang, W.P.; Chen, J.P.; Yu, Q.Q.; Gu, X.L. Corrosion evolution of steel bars in RC structures based on Markov chain modeling. Struct. Saf. 2021, 88, 102037. [Google Scholar] [CrossRef]
  28. Wu, F.; Chen, F.L.; Zhang, Z.J.; Long, A.H.; He, X.L. Water demand forecast in Shihezi City based on the improved grey model. J. Pop. Water Eng. 2020, 31, 76–82. [Google Scholar] [CrossRef]
  29. Yousuf, M.U.; Al-Bahadly, I.; Avci, E. A modified GM(1,1) model to accurately predict wind speed. Sustain. Energy Technol. Assess. 2021, 43, 100905. [Google Scholar] [CrossRef]
  30. Wang, Y.H.; Dang, Y.G.; Li, Y.Q.; Liu, S.F. An approach to increase prediction precision of GM(1,1) model based on optimization of the initial condition. Expert Syst. Appl. 2010, 37, 5640–5644. [Google Scholar] [CrossRef]
  31. Tsai, S.B.; Xue, Y.Z.; Zhang, J.Y.; Chen, Q.; Liu, Y.B.; Zhou, J.; Dong, W.W. Models for forecasting growth trends in renewable energy. Renew. Sust. Energy Rev. 2017, 77, 1169–1178. [Google Scholar] [CrossRef]
  32. Gao, G.; Chen, D.; Ren, G.; Chen, Y.; Liao, Y. Trend of potential evapotranspiration over China during 1956 to 2000. Geogr. Res. 2006, 25, 378–387. Available online: http://d.wanfangdata.com.cn/periodical/dlyj200603002 (accessed on 22 February 2023).
  33. Nan, J.; Xiao, J.; Liu, Z. Research on reference crop evaporation’s variation with time series in Northeast Region. Water Sav. Irrig. 2012, 37, 15–17. Available online: http://www.cnki.com.cn/Article/CJFDTotal-JSGU201201006.htm (accessed on 22 February 2023).
  34. Hu, X.H.; Chen, M.T.; Liu, D.; Li, D.; Jin, L.; Liu, S.H.; Cui, Y.L.; Dong, B.; Khan, S.; Luo, Y.F. Reference evapotranspiration change in Heilongjiang Province, China from 1951 to 2018: The role of climate change and rice area expansion. Agric. Water Manag. 2021, 253, 106912. [Google Scholar] [CrossRef]
  35. Lin, S.; Wang, G.; Hu, Z.; Huang, K.; Sun, J.; Sun, X. Spatiotemporal variability and driving factors of Tibetan plateau water use efficiency. J. Geophys. Res. Atmos. 2020, 125, e2020JD032642. [Google Scholar] [CrossRef]
Figure 1. Technology roadmap.
Sustainability 15 04238 g001
Figure 2. Location of the study area.
Sustainability 15 04238 g002
Figure 3. Land use in the Bayan Obo mining area.
Sustainability 15 04238 g003
Figure 4. Spatial distribution of water yield in the Bayan Obo Mine. (a): 1990, (b): 2000, (c): 2010, (d): 2020.
Sustainability 15 04238 g004
Figure 5. Spatial distribution of water conservation in the Bayan Obo Mine (a): 1990, (b): 2000, (c): 2010, (d): 2020.
Sustainability 15 04238 g005
Figure 6. Changes in average daily potential evapotranspiration from natural vegetation from 1990 to 2020.
Sustainability 15 04238 g006
Figure 7. Monthly mean potential evapotranspiration from natural vegetation from 1990 to 2020.
Sustainability 15 04238 g007
Figure 8. Kc values for different vegetation ((a) mean seasonal variability of Kc for different vegetation types; (b) average Kc variation by year for different vegetation).
Sustainability 15 04238 g008
Figure 9. Percentage of nature ecological water demand of different vegetation.
Sustainability 15 04238 g009
Figure 10. GM (1,1) quantitative prediction. (a) for arbors ecological water demand; (b) for shrubs ecological water demand; (c) for grassland ecological water demand; (d) for total vegetation ecological water demand).
Sustainability 15 04238 g010
Table 1. Water yield and water conservation in the Bayan Obo Mine from 1990 to 2020.
YearWater Yield
(m3)
Volume Per Unit Area
(m3/km2)
Water Conservation
(m3)
Volume Per Unit Area
(m3/km2)
19905.5 × 104619.76−6.96 × 10⁶−7.8 × 10⁴
20004.9 × 104549.79−7.72 × 10⁶−8.7 × 10⁴
20103.6 × 104399.84−10.26 × 10⁶−11.5 × 10⁴
20201.7 × 104189.93−13.01 × 10⁶−14.6 × 10⁴
Table 2. The total ecological water demand in the base year of the Bayan Obo mining area.
Natural Ecological Water Demand
(m3)
Artificial Ecological Water Demand
(m3)
Total Ecological Water Demand
(m3)
ArborsShrubsGrasslandArtificial Green LandArtificial Lake
1.93 × 1062.89 × 1061.50 × 1083.74 × 1069.7 × 104
1.54 × 1083.84 × 1061.58 × 108
Table 3. The total ecological water demand in the planning year.
YearsNatural Ecological Water Demand (m3)Artificial Ecological Water Demand (m3)Total Ecological Water Demand (m3)
ArborsShrubsGrasslandArtificial Green LandArtificial Lake
20252.36 × 1063.32 × 1061.40 × 1084.03 × 1069.7 × 1041.50 × 108
20302.68 × 1063.07 × 1061.33 × 1084.61 × 1069.7 × 1041.43 × 108
20353.05 × 1062.84 × 1061.26 × 1085.47 × 1069.7 × 1041.37 × 108
Disclaimer/Publisher’s Note: The statements, opinions and data contained in all publications are solely those of the individual author(s) and contributor(s) and not of MDPI and/or the editor(s). MDPI and/or the editor(s) disclaim responsibility for any injury to people or property resulting from any ideas, methods, instructions or products referred to in the content.

