
Humor Helps: An Experimental Analysis of Pro-Environmental Social Media Communication


1
Department of Marketing, Faculty of Economics, Management and Accountancy, University of Malta, MSD 2080 Msida, Malta
2
Department of Economics, Faculty of Economics, Management and Accountancy, University of Malta, MSD 2080 Msida, Malta
*
Author to whom correspondence should be addressed.
Sustainability 2023, 15(6), 5157; https://0-doi-org.brum.beds.ac.uk/10.3390/su15065157
Submission received: 17 January 2023
/
Revised: 3 March 2023
/
Accepted: 5 March 2023
/
Published: 14 March 2023
(This article belongs to the Special Issue Consumer Preferences towards Green Consumption)
Abstract
:Communication-based interventions are popular among both governmental and non-governmental organizations in many environmental domains. Yet, studies on the role of humor in social media communication to stimulate pro-environmental behavior have received limited attention. This study employs an experimental approach to assess the effect of using humor (in the form of satirical cartoons) either alongside, or in place of, factual pro-environmental messages in social media communication. It assesses the impact of humor in stimulating a reaction to a pro-environmental message on social media, a share, or a declared intent to change behavior. Our findings reveal that the inclusion of humor elicits a greater response than a factual message alone but that combining a humorous cartoon with a factual text creates the greatest difference. These findings are fairly consistent across six environmental domains and survive formal regression analysis which controlled for the impacts of co-determinants such as age, gender, education, social media engagement, and environmental preferences.
1. Introduction
“Characteristic of an action, speech or writing that induces arousal, comicality, fun and oddity”Definition of Humor, Oxford English Dictionary (2019).
With the escalation of environmental problems such as climate change [1], waste generation [2], urbanization, and air pollution [3], the need to stimulate pro-environmental behavior (PEB) among citizens has become an increasingly important challenge. PEB can be described as intentional and conscious behavior to minimize the negative impacts on the surrounding environment [4,5]. Though there exist different types of interventions that can stimulate such behavior, ranging from legislative change to financial dis/incentives, communication campaigns occupy an important role in the intervention toolkit of governmental and non-governmental organizations, whether used in tandem with other tools or as the main stimulus for behavior change [6]. Indeed, getting communication right has the potential to stimulate voluntary cooperation [7], avoiding the administrative and political burden of introducing more pecuniary interventions [8] and offering positive spill-over effects [9].
The potential of communication to drive change has been accentuated in recent years, with the exponential growth of social media use [10,11,12]. Described as a social infrastructure that facilitates communication, networking, and collaboration [11], the medium allows for more engagement, immediate feedback, and two-way conversations [13], ostensibly decreasing the psychological distance between issues and users [14]. Liking a post fulfills various preferences but it can be a way for users to show support for and engage with a cause [15]. Furthermore, in voluntarily sharing a post, the audience exposes it to their extended network, broadening the organic reach of the communication campaign. Social marketers, non-governmental organizations, non-profits, and activists have taken to this new medium [16,17], with campaigns such as School Strike 4 Climate, #MeToo, the ALS Ice-Bucket Challenge, Black Lives Matter, and Earth Hour being among the notable examples that attempt to raise awareness and drive change [18]. Recent studies on the impact of social media on pro-environmental communication note that digital platforms have been transformational in allowing environmental movements to connect with citizens and leverage the power of information to address complex problems [19]. Social media use provides an opportunity for citizens to voice and document their concerns about environmental issues which mobilizes action and attracts the attention of leaders and politicians [20]. Employing content analysis of social media posts and focus groups with activists and others, Leong and colleagues analyzed the role of social media in creating connective action for social change [21]. They echo this sentiment that social media extends influence on a broader network, empowers more activism, and offers resources for citizens to take control over issues.
Whether content is used for traditional or social media, the typical starting point when crafting environmental communications is to transform scientific evidence into understandable, accessible information. Underlying this process is the commonly held assumption that enhancing environmental knowledge leads to changes in attitudes and subsequently behavior [22]. However, the well-documented knowledge-action gap [23] indicates that the way information is consumed is far more complex [24,25]. For a start, factual information has to compete for attention in a world of information overload. As succinctly put by Nobel Laureate Herbert Simon, a wealth of information creates a poverty of attention [26]. Moreover, it is often argued that communication on issues such as climate change lacks the storytelling narrative that helps elicit an emotional response [27]. Creative and artistic content can often help to inspire action [28].
Of particular relevance to this study is a type of creative content, increasingly popular in advertising [29], which includes humorous text and images. While theories abound as to what type of content creates humor [30], the question that is relevant to this study is whether humor itself helps to stimulate PEB. The theoretical priors that may justify a positive relationship are firstly that content featuring humor is more likely to be noticed [31], secondly that it is more likely to be remembered [32], and thirdly that humor can activate the limbic system, producing positive changes in mood, tension relief, and coping mechanisms [29]. As recently argued [33] fun can be an important element in nudging behavioral change as it makes the adjustment more tolerable. These considerations are sometimes loosely referred to as the “humor effect” [31].
The above considerations would suggest that humor positively stimulates PEB, but there are further insights that could complicate the outcomes. Firstly, humor can interact with diverse attitudes and create different outcomes: the sweet spot of humor versus offense may differ among different people [34]. Secondly, while humor may increase process motivation, the humorous message is more likely to be discounted following exposure to content [35]. In a political parody, humor is often used to discredit some ideology [36], and while the audience may enjoy humorous political content, this does not necessarily persuade them to think differently [37]. Editorial cartoons are often designed to influence the readers in a particular way [38], however, like political satire, they too may induce a passing chuckle rather than a reflection on social issues [39]. In cartoons, the issue is more complex as they combine visuals and captions [40,41]. In his meta-analysis of the effect of humor in advertising, Eisend finds that humor significantly enhances attention, positive affect, and purchase intention but reduces source credibility [31].
A handful of authors have recently explored the use of humor for environmental advocacy. In a multi-modal experiment using sketch comedy, stand-up, and improvisation among undergraduate students, climate change awareness, efficacy belief as well as affect, engagement, and new knowledge were found to be positively impacted [42]. In a case study of anti-littering campaign slogans, a humorous slogan (“waste has no wings”) was more than twice as likely to yield results than an authoritarian message (“pollution prohibited”) [43]. Yet, a systematic narrative review on humor and climate change reveals that humor can also cause paradoxical effects [44].
As can be deduced, while the potential effect of humorous content on PEB has started to receive some attention, results are mixed and the assessment of its use in a social media context is limited [18,43]. Against the backdrop of the urgency of PEB, the potential of the communication-based intervention to stimulate voluntary PEB, and the burgeoning use of social media, this study asks whether using humor in environmental communication enhances social media engagement and pro-environmental behavioral intent. It does so by employing an experimental approach, thereby also contributing to the existing literature by attempting to identify the causal effects of humor with or without accompanying factual information.
2. Materials and Methods
2.1. Context
The study takes place in Malta, a European Union (EU) member state, characterized by high internet penetration and social media use as well as deep environmental challenges.
At the time of the study (2018), 83% of the population were active social media users [45], with 43% being active on a daily basis [46]. Facebook was the most popular medium and just under half (47%) of Facebook users in Malta were female [45]. Social media was also immensely popular among business enterprises, with 73% making use of it—the highest level among EU member states [46]. Local environmental NGOs (ENGOs) made prolific use of social media as a platform to disseminate information, advocate for environmental issues and engage with citizens—including through crowdfunding campaigns on social media [47].
A small island state with one of the highest population densities in the world, Malta faces several environmental problems [48]. Traffic congestion, noise pollution, high rates of waste per capita, overdevelopment, hunting illegalities, and lack of green spaces continue to persist [48]. The State of the Environment Report (2018) highlighted threats to Malta’s biodiversity, a high level of mercury in sea water, and a concerning level of marine litter [49]. Microplastics were recorded to be found in Malta’s most popular beaches with their presence being on the increase. With political cartoons dating back to the nineteenth century [50], it is hardly surprising that satirical cartoons in local newspapers often make reference to issues such as construction, traffic, immigration and littering [51]. The study employs humorous cartoons produced by a Maltese artist and complementary snippets of text drawn from a publication that assembled and discussed these cartoons [48].
2.2. Questionnaire and Embedded Experiment
A survey-based experiment was employed (duration of 5–10 min, distributed on social media) with the questionnaire featuring experiments as well as demographic and attitudinal questions. Upon entering the survey, participants were provided with information about the questionnaire and asked for their consent to participate before being randomly assigned to one of three treatments: text only (T1), cartoon only (T2), and cartoon and text (T3). In all treatments, participants were presented with six consecutive scenarios. The scenarios covered issues that spread across various environmental domains namely traffic, congestion, over-urbanization, litter, waste, and climate change (see Appendix A). Once exposed to the scenario, respondents (in all treatments) were asked to choose whether they would react to the post on Facebook by clicking on one of the emojis (like, love, cry, laugh, angry, or surprise). Participants were then offered the choice of three options: no share, share privately, or share publicly. Finally, participants were asked whether they felt they would be likely to change their behavior with answer options being “Probably not”; “Probably, to be more pro-environmental” or “Probably, to be less pro-environmental”. These choice sets were identical for all participants, in each of the six scenarios and across all three treatments. Participants were blinded to the experimental procedure.
Demographic questions included age, gender, education, and locality of residence. Respondents were also questioned on their involvement in environmental movements, their level of information on environmental issues, and their self-efficacy belief. In order to control for any possible bandwagon effects [52], respondents were also asked about their likelihood to be pro-environmental if others were. In order to generate the necessary data for important co-determinants of behavior, respondents were asked whether they liked satirical cartoons, if they followed local politics, and whether they use social media. To assess their behavior on Facebook specifically, respondents were asked about their tendency to “like” and “share” content on the platform.
In the experimental component of the survey, respondents were asked to react to content as though they had come across it on social media, posted by a source they trust. The questionnaire interface was designed to closely resemble a Facebook post. Respondents were randomly assigned to one of the treatments.
2.3. Hypothesis and Tests
We set out to test whether factual environmental information is likely to generate a social media response if accompanied or replaced by a humorous cartoon. The hypotheses tested were the following;
Hypothesis 0 (H0).
A humorous cartoon creates no significant change in response relative to a factual message.
Hypothesis 1 (H1).
A humorous cartoon creates a greater response than a factual text message.
Hypothesis 2 (H2).
A cartoon combined with a factual text message creates a greater response than a factual message alone.
To capture pro-environmental response, eighteen variables are generated of which six capture the propensity to react to communications in the domains of car pollution, traffic congestion, over-urbanization, litter, waste, and climate change, six capture the propensity to share communications in the same domains, and six capture the intent to change behavior following exposure to communications, once more in the same domains. A treatment variable identifies the group (T1, T2, or T3) to which the participants were assigned, namely text only, cartoon only, and text plus cartoon.
To test the degree of association between these dependent variables and treatment variables, a simple chi-squared test is used. In further analysis, a more formal logistic regression analysis is conducted to estimate a model (Model 1) whereby pro-environmental response (Response) is conceptualized as a function of a constant term, the treatment, and a number of control variables. We also conduct a multinomial logistic regression analysis for the Share variable made up of three categories (no sharing, sharing privately, sharing publicly). Multinomial regression requires selecting a reference category from the dependent variable to facilitate comparison with the other categories [53]. While this choice does not affect the model, it alters the interpretation of the results [54].
Model 1:
where:
Responseki = C + Treatmenti + Controlsi + ϵi
- Response is participants’ self-reported reaction (click on any emoji), intent to share (private or public), and intent to change behavior (positive or negative) across six domains;
- C is a constant term;
- Treatment captures the effect of the treatment condition (T1, T2 or T3) to which participants were assigned;
- Controls is a vector of control variables which includes age, gender, education, as well as aforementioned bandwagon effects, extent of social media engagement, and degree of pro-environmental attitude;
- k indexes domains;
- i indexes participants;
- ε is the disturbance term.
2.4. Data
Following the distribution of the survey link in Facebook groups between May and June 2019, a total of 390 responses were collected. Of these, 200 consented and were usable. In total, 61 participants were allocated to treatment T1, 67 participants to T2, and 72 participants to T3. Table 1 provides a summary of the data for the whole sample and for each of these groups. We note that our sample is female-skewed (63.7%), with an average age of 40 and relatively high level of education, with more than 80% having completed tertiary or post-tertiary levels. The construct for environmental preferences yields a Cronbach’s alpha value of 0.76, indicating high reliability [55]. On social media engagement, we also obtain a relatively high alpha value of 0.71, lending evidence in favor of homogeneity amongst the instruments employed.
The dependent variables for reacting were coded as a binary variable where 0 represents no reaction while 1 represents the decision to click on any of the emojis. The dependent variables for sharing behavior were coded on a 0–2 scale, where 0 represents no sharing, 1 represents sharing privately, and 2 represents sharing publicly. The dependent variable for intent to change behavior was coded as a dummy variable, with 0 representing a lack of intent to behave more pro-environmentally, and 1 representing a willingness to change behavior positively.
3. Results
3.1. Tests of Association
To test whether a humorous cartoon creates a greater pro-environmental response than a factual text message alone and whether the cartoon combined with a factual text message creates a greater pro-environmental response than a factual message alone chi-square tests were employed. Table 2 and Figure 1, Figure 2 and Figure 3 present the results. Testing H0 involved contrasting the outcomes of T1 versus those of T2 and T3 combined. Testing H1 involved contrasting the outcomes of T1 versus T2, whereas H2 compared the outcomes of T1 versus T3.
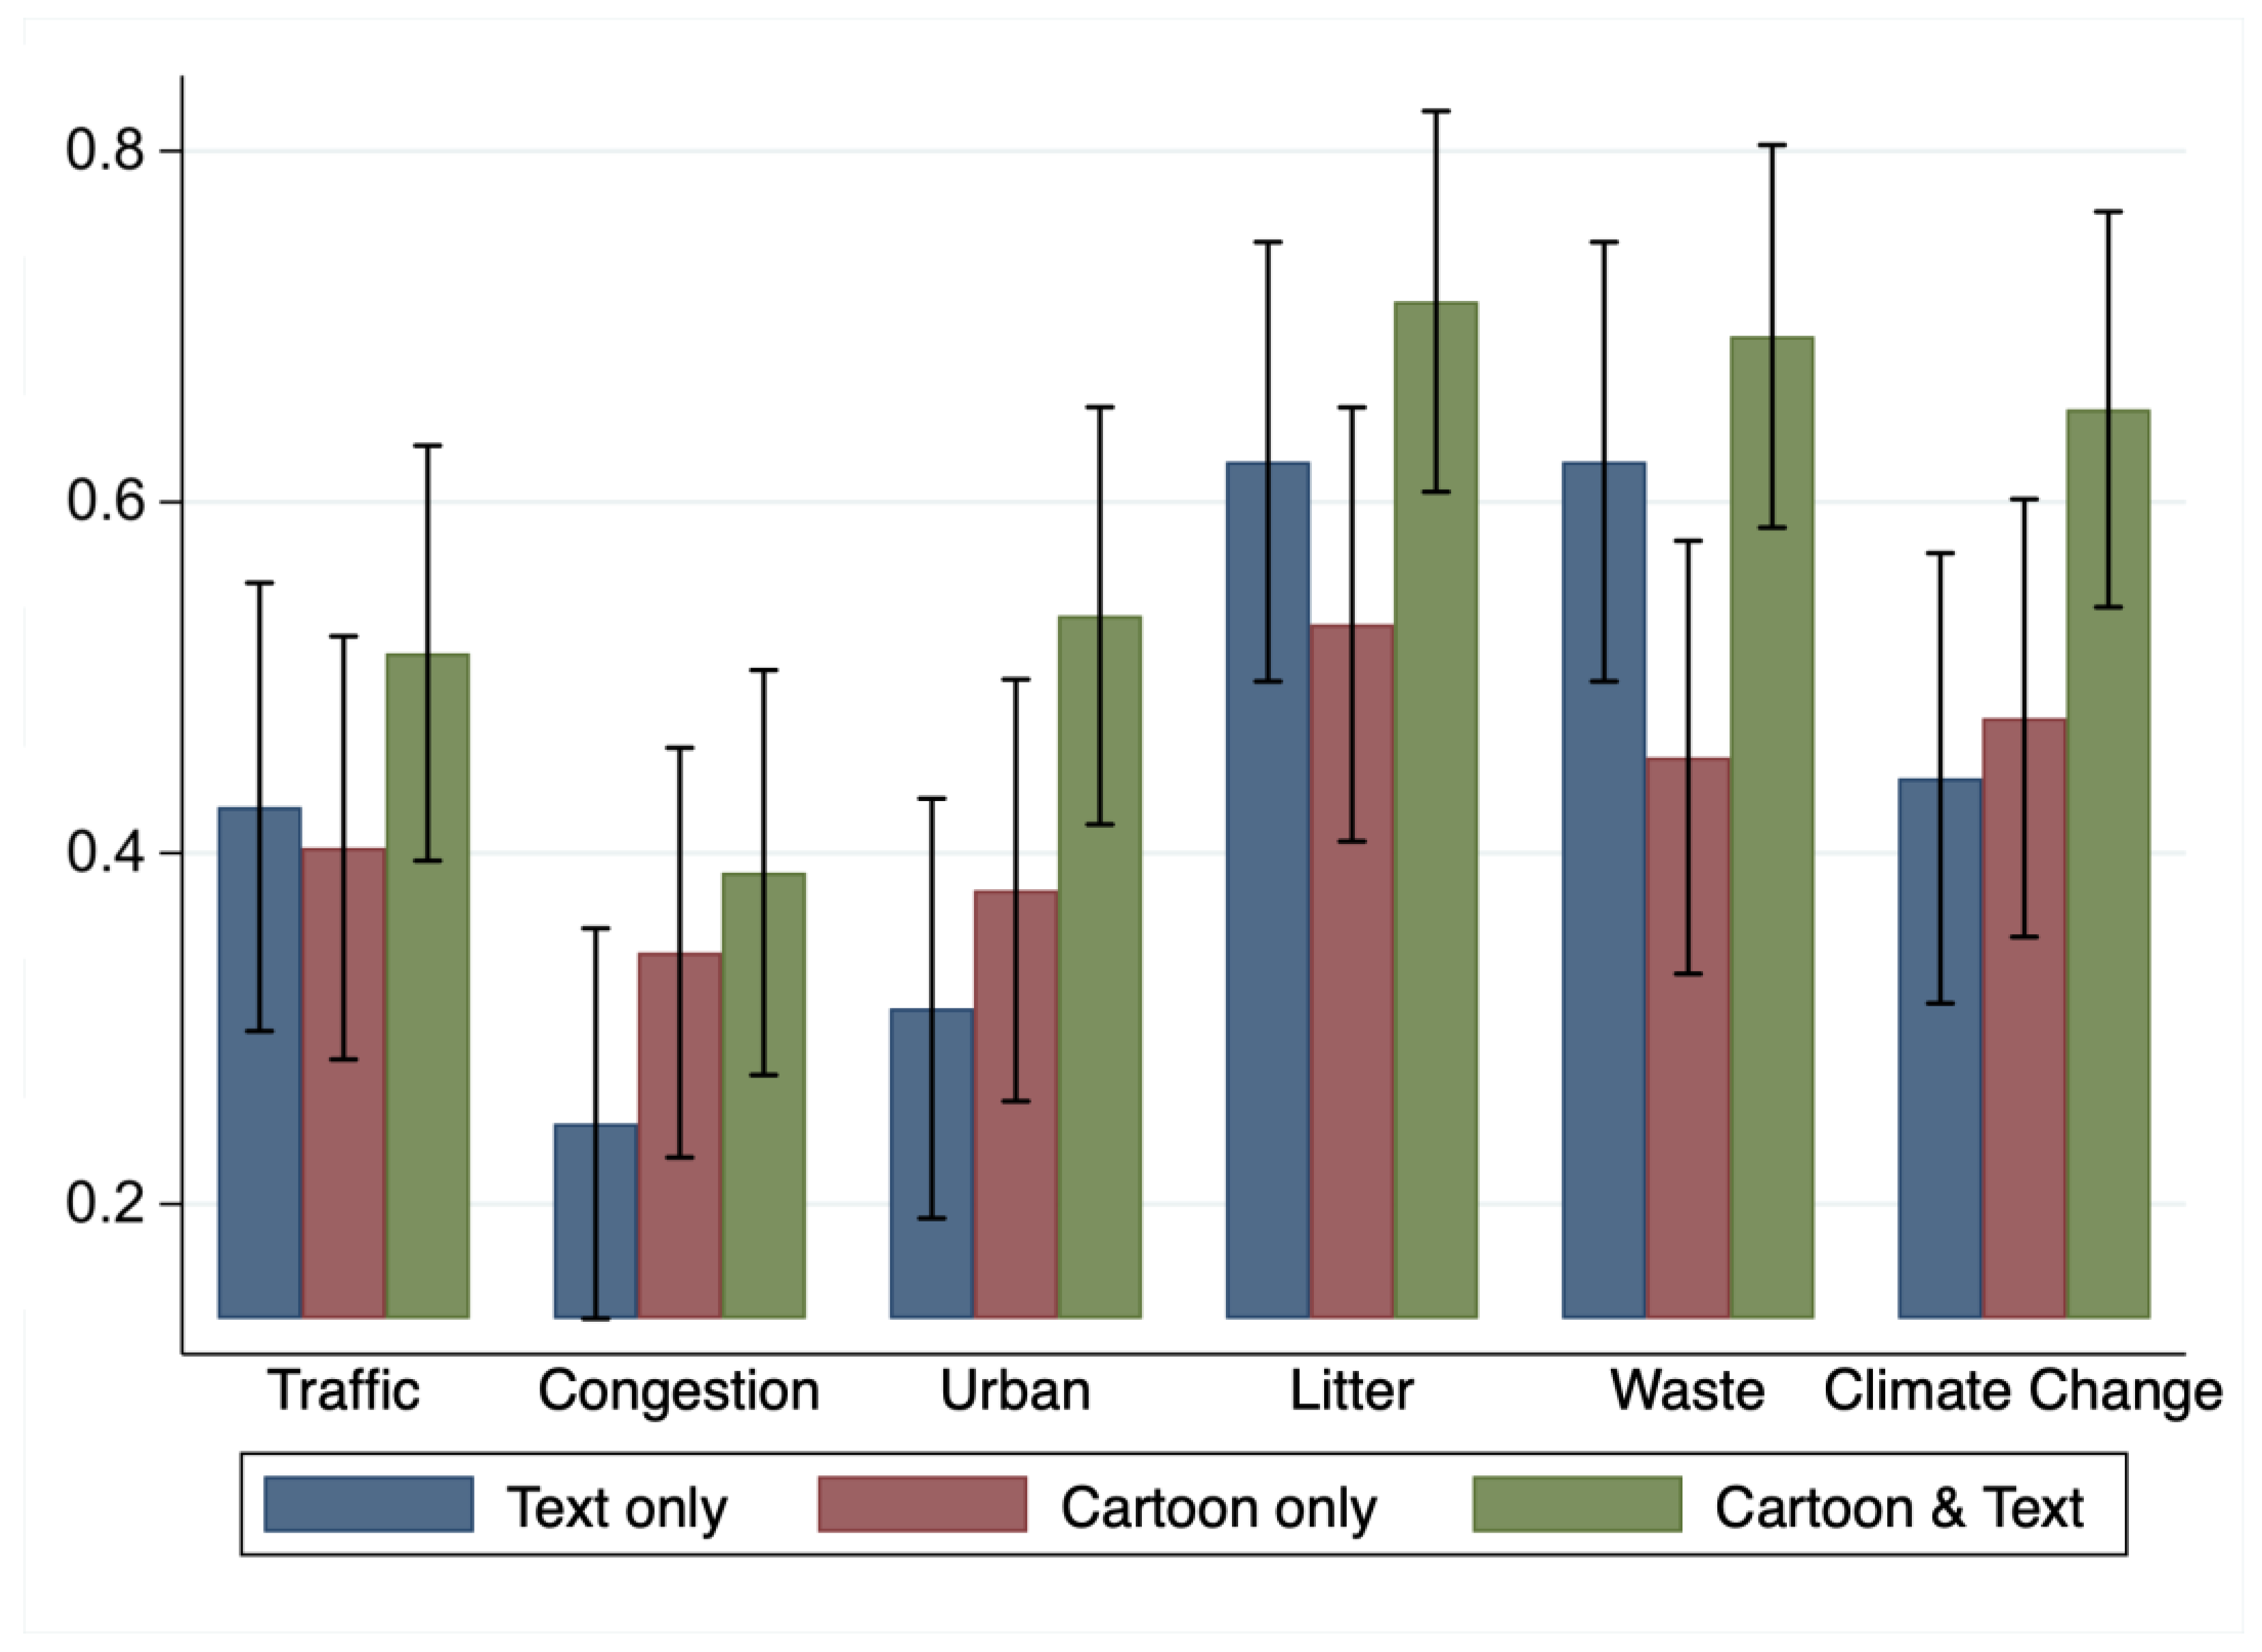
We note that participants’ reaction was strongly associated with the treatment they received: participants shown a humorous cartoon on traffic problems (whether in isolation or jointly with factual text) were more likely to react (by clicking an emoji) than those who were not (p < 0.01). We note the same effect with cartoons on congestion issues (p < 0.01), urbanization issues (p < 0.01), issues of litter (p < 0.01), waste (p < 0.05), and climate change (p < 0.01). We also note significant effects of treatment on the intent to share communications on congestion issues (p < 0.05), urbanization issues (p < 0.05), and waste issues (p < 0.05). Finally, we note a positive effect of cartoons on the intent to behave more pro-environmentally on urban issues (p < 0.05). These results suggest a rejection of H0—a cartoon does seem to have generated a difference in reactions, willingness to share, and, at least in one case, behavioral intent.
In testing H1, our results show that participants in the cartoon only treatment (T2) reacted more than untreated participants (T1) when exposed to traffic-related communications (p < 0.01). Likewise, their propensity to share was stronger when shown congestion communications (p < 0.05), urbanization (p < 0.01), litter (p < 0.05), and climate change communications (p < 0.05). Cartoons or text made no difference in reactions to waste issues. There were also no significant differences between respondents shown text and those shown a cartoon alone in their intent to share the communication or their intent to change behavior by treatment. A humorous cartoon alone stimulates a greater reaction (by way of clicking on an emoji such as like, love, cry, etc.), than text alone, but does not seem to stimulate a greater propensity to share (publicly or privately) or intent to change behavior in the field. These results suggest mixed support for H1.
Finally, to test H2, we examined whether participants shown a cartoon combined with factual text (T3) had significantly different outcomes than participants shown the text only (T1). We find that significantly more individuals reacted to the cartoon plus text in all the experiments, namely on traffic issues (p < 0.01), congestion issues (p < 0.01), urbanization issues (p < 0.01), littering issues (p < 0.01), waste (p < 0.05) and climate (p < 0.05). Furthermore, the combination of factual text and cartoon (relative to text only) yielded more shares on congestion issues (p < 0.05), urbanization issues (p < 0.01), waste issues (p < 0.01), and climate issues (p < 0.05). The cartoon and text combo also yielded a relatively stronger intent to change behavior on urbanization issues (p < 0.01). While these results suggest some support for H2, namely that a cartoon and text combination stimulates more response than a text-only communication, it should be noted that the degree of difference varies by issue and that the difference is more consistently observed when it comes to reacting and sharing the communication, rather than actually changing behavior.
3.2. Formal Analysis
Formally estimating Model 1 allows us to test the effects of the treatment even after controlling for possible co-determinants of outcomes. The results are presented in Table 3, Table 4 and Table 5. Table 3 presents the determinants of the propensity to react to social media communication (by liking or clicking any emoji). The dependent variable is binary (no reaction versus reaction) given that the number of observations was not sufficient to allow regressions for each emoji. Table 4 does the same for the propensity to share (examining both private shares and public shares separately) and Table 5 summarizes the intent to change behavior (no change versus change). We discuss these results in turn. In all instances, the models are estimated under a logit specification.
Our estimates in Table 3 reveal that a key determinant as to whether participants react or not is their degree of social media engagement. For instance, when exposed to litter communication, social media-engaged participants were 3.822 times more likely to react to a post on social media than participants (OR = 3.822, p < 0.01). Similar results are observed on waste (OR = 3.071, p < 0.01), traffic (OR = 2.683, p < 0.01), congestion (OR = 2.238, p < 0.01), climate change (OR = 2.165, p < 0.01) and urbanization (OR = 1.919, p < 0.01). Environmental preferences emerged as another key significant determinant of the likelihood to react to a post. Participants ranking highly in pro-environmental preferences were more likely to react to congestion communication (OR = 1.800, p < 0.01), to litter communication (OR = 1.967, p < 0.05), and to urbanization issues (OR = 1.599, p < 0.1). The higher the education level of the participants, on the other hand, resulted in a significantly lower likelihood to react to congestion communications (OR = 0.526, p < 0.01). Females were around twice as likely to react than males on waste issues (OR = 2.073, p < 0.1).
With these effects accounted for, we turn to our treatment variables. With T1 as the baseline, we find significant effects for respondents treated with cartoon-based messages (T2) in the traffic and urbanization domains, and for respondents treated with cartoons and text messages (T3) in five out of six communication issues. For instance, participants who saw cartoon-based messages in the traffic domain were over five times more likely to react than participants who saw text-only messages (T1) (OR = 5.394, p < 0.01). Similar results were observed for the urbanization issue (OR = 3.016, p < 0.05). Cartoons combined with text again produced even more pronounced effects, with the strongest result registered for the urbanization cartoon where participants were nearly five times more likely to react to combined messages than those who only saw the text (OR = 4.837, p < 0.01). The combination of text and cartoon also yielded higher probabilities of reaction in traffic communication (OR = 3.040, p < 0.05), litter (OR = 2.985, p < 0.05), congestion (OR = 2.738, p < 0.05), climate change (OR = 2.376, p < 0.05), and waste (OR = 1.968, p > 0.1). These results suggest a sound rejection of H0 and support for both H1, namely that a humorous cartoon alone does better than a text message, and for H2 namely that a humorous cartoon combined with a text message creates a greater response than a factual text message alone.
In Table 4a,b we estimate multinomial logit regression on sharing behavior. For each model we report, we ran a Hausman–McFadden test [56] and found evidence supporting the IIA assumption. Table 4a reports the results of our model where the outcome variable is the propensity to share privately (as opposed to not sharing). Once again, we find that participants who are more highly educated are less likely to share privately than not to share at all for almost all communications received. Again, we note that respondents who are typically engaged in social media interactions were significantly more likely to share a traffic or urbanization communication as a private message and that females were less likely to share a message privately (in the urbanization domain). Participants who viewed cartoon-based traffic messages were more than three times more likely to reshare a post privately than those who viewed text-only messages (OR = 3.166, p < 0.1). Participants exposed to both cartoon and a factual text message (T3), were more likely to share the communication whether this related to congestion (OR = 4.778, p < 0.05), urbanization (OR = 4.829, p < 0.05) or climate change (OR = 4.195, p < 0.05). Notably, participants who received a cartoon plus text were 10 times more likely to share a post privately than those who viewed the text alone (OR = 10.075, p < 0.01).
When examining the propensity to share a post publicly we confirm that across all six domains, participants ranking high in social media engagement were significantly more likely to share publicly than not at all (p < 0.01). The degree of environmental preferences mattered only in the urbanization domain such that environmental preferences enhanced the propensity to reshare publicly (OR = 1.684, p < 0.05). In the cases of litter and waste, older participants were 2.6% more likely to share a message publicly (OR = 1.026, p < 0.1), and for traffic, congestion, and urbanization posts, older participants were 3.4%, 3.6%, and 3.3% more likely to publicly reshare a post on Facebook, respectively. When we analyze our treatment variables, we observe that combined text and cartoon messages left a significant effect on the likelihood to reshare publicly in urbanization (OR = 3.676, p < 0.01), waste (OR = 2.216, p < 0.1) and climate change (OR = 2.582, p < 0.05) communications. Together, the results of Table 4a,b suggest that combining a humorous cartoon with a factual text message begets a greater response than a factual message alone (in support of H2). However, there is little evidence that a humorous cartoon alone creates a greater response than a factual text message (H1).
Finally, in Table 5 we present the results of the determinants of intent to change behavior positively. Higher levels of pro-environmental behavioral intent were observed among those engaged in social media in all domains (p < 0.05). Participants ranking high on environmental preferences were significantly more likely to report and intent to modify their behavior with regard to congestion (OR = 1.569, p < 0.1), urbanization (OR = 1.530, p < 0.1), and waste (OR = 1.769, p < 0.05). Older participants were 2.4% more likely than younger participants to declare an intent to behave more pro-environmentally (OR = 1.024, p < 0.1) on congestion issues. In the same domain, education again resulted in a lower intent to change behavior. Females were more likely to state such an intent to modify behavior on issues related to litter, waste, and climate change. An interesting nuance emerges in the estimation of these models, namely that respondents were twice more likely to state that they would modify behavior if they believed that others were doing so (p < 0.05). This bandwagon-type effect emerged in four out of six domains: urbanization (p < 0.05), litter (p < 0.05), waste (p < 0.01), and climate change (p < 0.05).
Focusing on our treatment variables, we once again find that participants exposed to T3 (cartoon and text) were significantly more likely to state an intent to change behavior pro-environmentally. Indeed, they were more than twice as likely to report intent to change behavior following text and cartoon communications on congestion (OR = 2.058, p < 0.1), urbanization (OR = 2.986, p < 0.01), and climate change (OR = 2.560, p < 0.05) domains. A humorous cartoon combined with a factual text message creates a greater response than a factual message alone (in support of H2) but there is no support for the assertion that a humorous cartoon alone creates a greater pro-environmental response than a factual text message (H1).
4. Discussion and Conclusions
Having examined differences in means and formally estimated models of response, we safely reject H0 that a humorous cartoon creates no significant impact on pro-environmental response, at least as measured by liking, sharing, and behavioral intent. We find mixed evidence in support for H1 that a humorous cartoon by itself creates a greater response than a factual text message alone. While this seems true in so far as a cartoon stimulates more emoji clicks than a text, it is not always true for sharing, and certainly has limited impact for intent to change behavior. When presented in isolation, a cartoon alone can simply stimulate a passing chuckle as described by DeSousa and Medhurst [39]. Humor may act as a distraction from the actual environmental issue being presented, suppressing the intended effects [35]. We do however find considerable support for H2, namely that a cartoon combined with a factual text message creates a greater response than a factual message alone. This finding was observed in almost all the experimental issues when it came to reacting with an emoji, in most when it came to sharing content, and in half of them when it came to eliciting an intended behavioral change. Results chime with Streicher [41], who claimed that the caption of a satirical cartoon is what gives the context and meaning to the cartoon. It is the combination of the two that provides for maximum impact: combining the positive effects of humor (attention, memory, emotion) with the possibility of respondents evaluating the issue at hand [57,58].
These results must be considered within the limitations of the study. First, only one form of humor was examined—satirical cartoons. Participants have different “sweet spots” for different kinds of humor [34]. Second, while the main co-determinants of reactions were examined, future research could examine other factors. They include the political preferences of respondents which may play a role in the way satire is perceived. While an attempt was made to collect data on political preferences in this study, most respondents chose not to answer this question. Similarly, neither personality traits nor information on the emotional states of participants were considered. This unobserved heterogeneity is not expected to bias the experimental results (given that respondents were randomly assigned to the treatments), however, data collection on these phenomena in future studies could improve the predictive potential of regression models. Third, the research relies on the statements made by participants about their intent to click an emoji, share, and change behavior. While the intent is often considered to be a sound predictor of actual behavior [59], it is nonetheless a weakness in the study not to observe actual behavior. The shortcoming is less pronounced when it comes to participants’ social media reactions and sharing behavior, given that the experimental presentation was explicitly formulated to look as realistic as possible. The survey-based experiment was viewed by participants on their own devices, allowing a sense of experimental realism [60]. Further research on the subject could assess the effect of humor on actual behavior—both in the short term and in the long term, and whether reacting on social media (liking and sharing) stimulates or crowds out actual behavior. Finally, our study was not representative, suggesting that different groups/sub-populations may yield different outcomes [61]. This is particularly so when it comes to the issue of education: a less educated sample may have different reactions.
Notwithstanding these shortcomings, we believe that this study provides valuable insights into the promise of using humor in pro-environmental social media communication, at a time when environmental intervention is urgently required [1,62]. Social media communication-based intervention is increasingly in use by communicators in both governmental and non-governmental organizations and in many environmental domains. One insight that emerges from this study is that organizations embarking on such campaigns would do well to pre-test messages before rollout. Survey-based experiments like the one employed in this study offer an inexpensive and rapid way to do so. This study assessed the effect of including humorous cartoons alongside—and in place of—factual pro-environmental messages in social media communication, thereby identifying their potential to stimulate engagement through likes, shares (public or private), and intent to change behavior. Our findings reveal that humor alone may not stimulate the kind of reaction desired on social media (a like or a share) but combined with factual information, it helps. This observation is consistent across several domains, for both liking and sharing content, a key metric in measuring the reach of social media communication campaigns. Combining a factual message with a humorous cartoon was also more likely to stimulate a desire to actually change behavior. These findings survived both a simple difference of means analysis as well as formal regression analysis. They offer useful insight to government and non-governmental organizations in the field of PEB: in tandem with factual information, humor helps to stimulate a greater reach on social media as well as a greater intent to change behavior both among those directly reached as well as among others reached through shares.
Author Contributions
Conceptualization, T.B. and M.B.; methodology, T.B., M.B. and G.W.S.; software, G.W.S.; validation, G.W.S.; formal analysis, M.B. and G.W.S.; investigation, T.B.; resources, M.B.; data curation, T.B. and G.W.S.; writing—original draft preparation, T.B.; writing—review and editing, T.B., M.B. and G.W.S.; visualization, G.W.S.; supervision, M.B.; project administration, T.B.; funding acquisition, M.B. All authors have read and agreed to the published version of the manuscript.
Funding
This research received no external funding.
Institutional Review Board Statement
This study followed the University of Malta Research Ethics and Data Protection review procedure Ref. 1496_18042019_Therese Bonnici, submission dated 18 April 2019. Informed consent was obtained from all subjects involved in the study.
Informed Consent Statement
Informed consent was obtained from all subjects involved in the study.
Data Availability Statement
Data available on request.
Acknowledgments
The authors acknowledge Steve Bonello for his kind approval to utilize his cartoons in the research.
Conflicts of Interest
The authors declare no conflict of interest.
Appendix A
In this appendix, we reproduce the materials used in the experimental treatments. The images used are reproduced with permission from Briguglio Marie and Bonello Steve, No Man’s Land, People Place Pollution published by Kite Group, 2018.
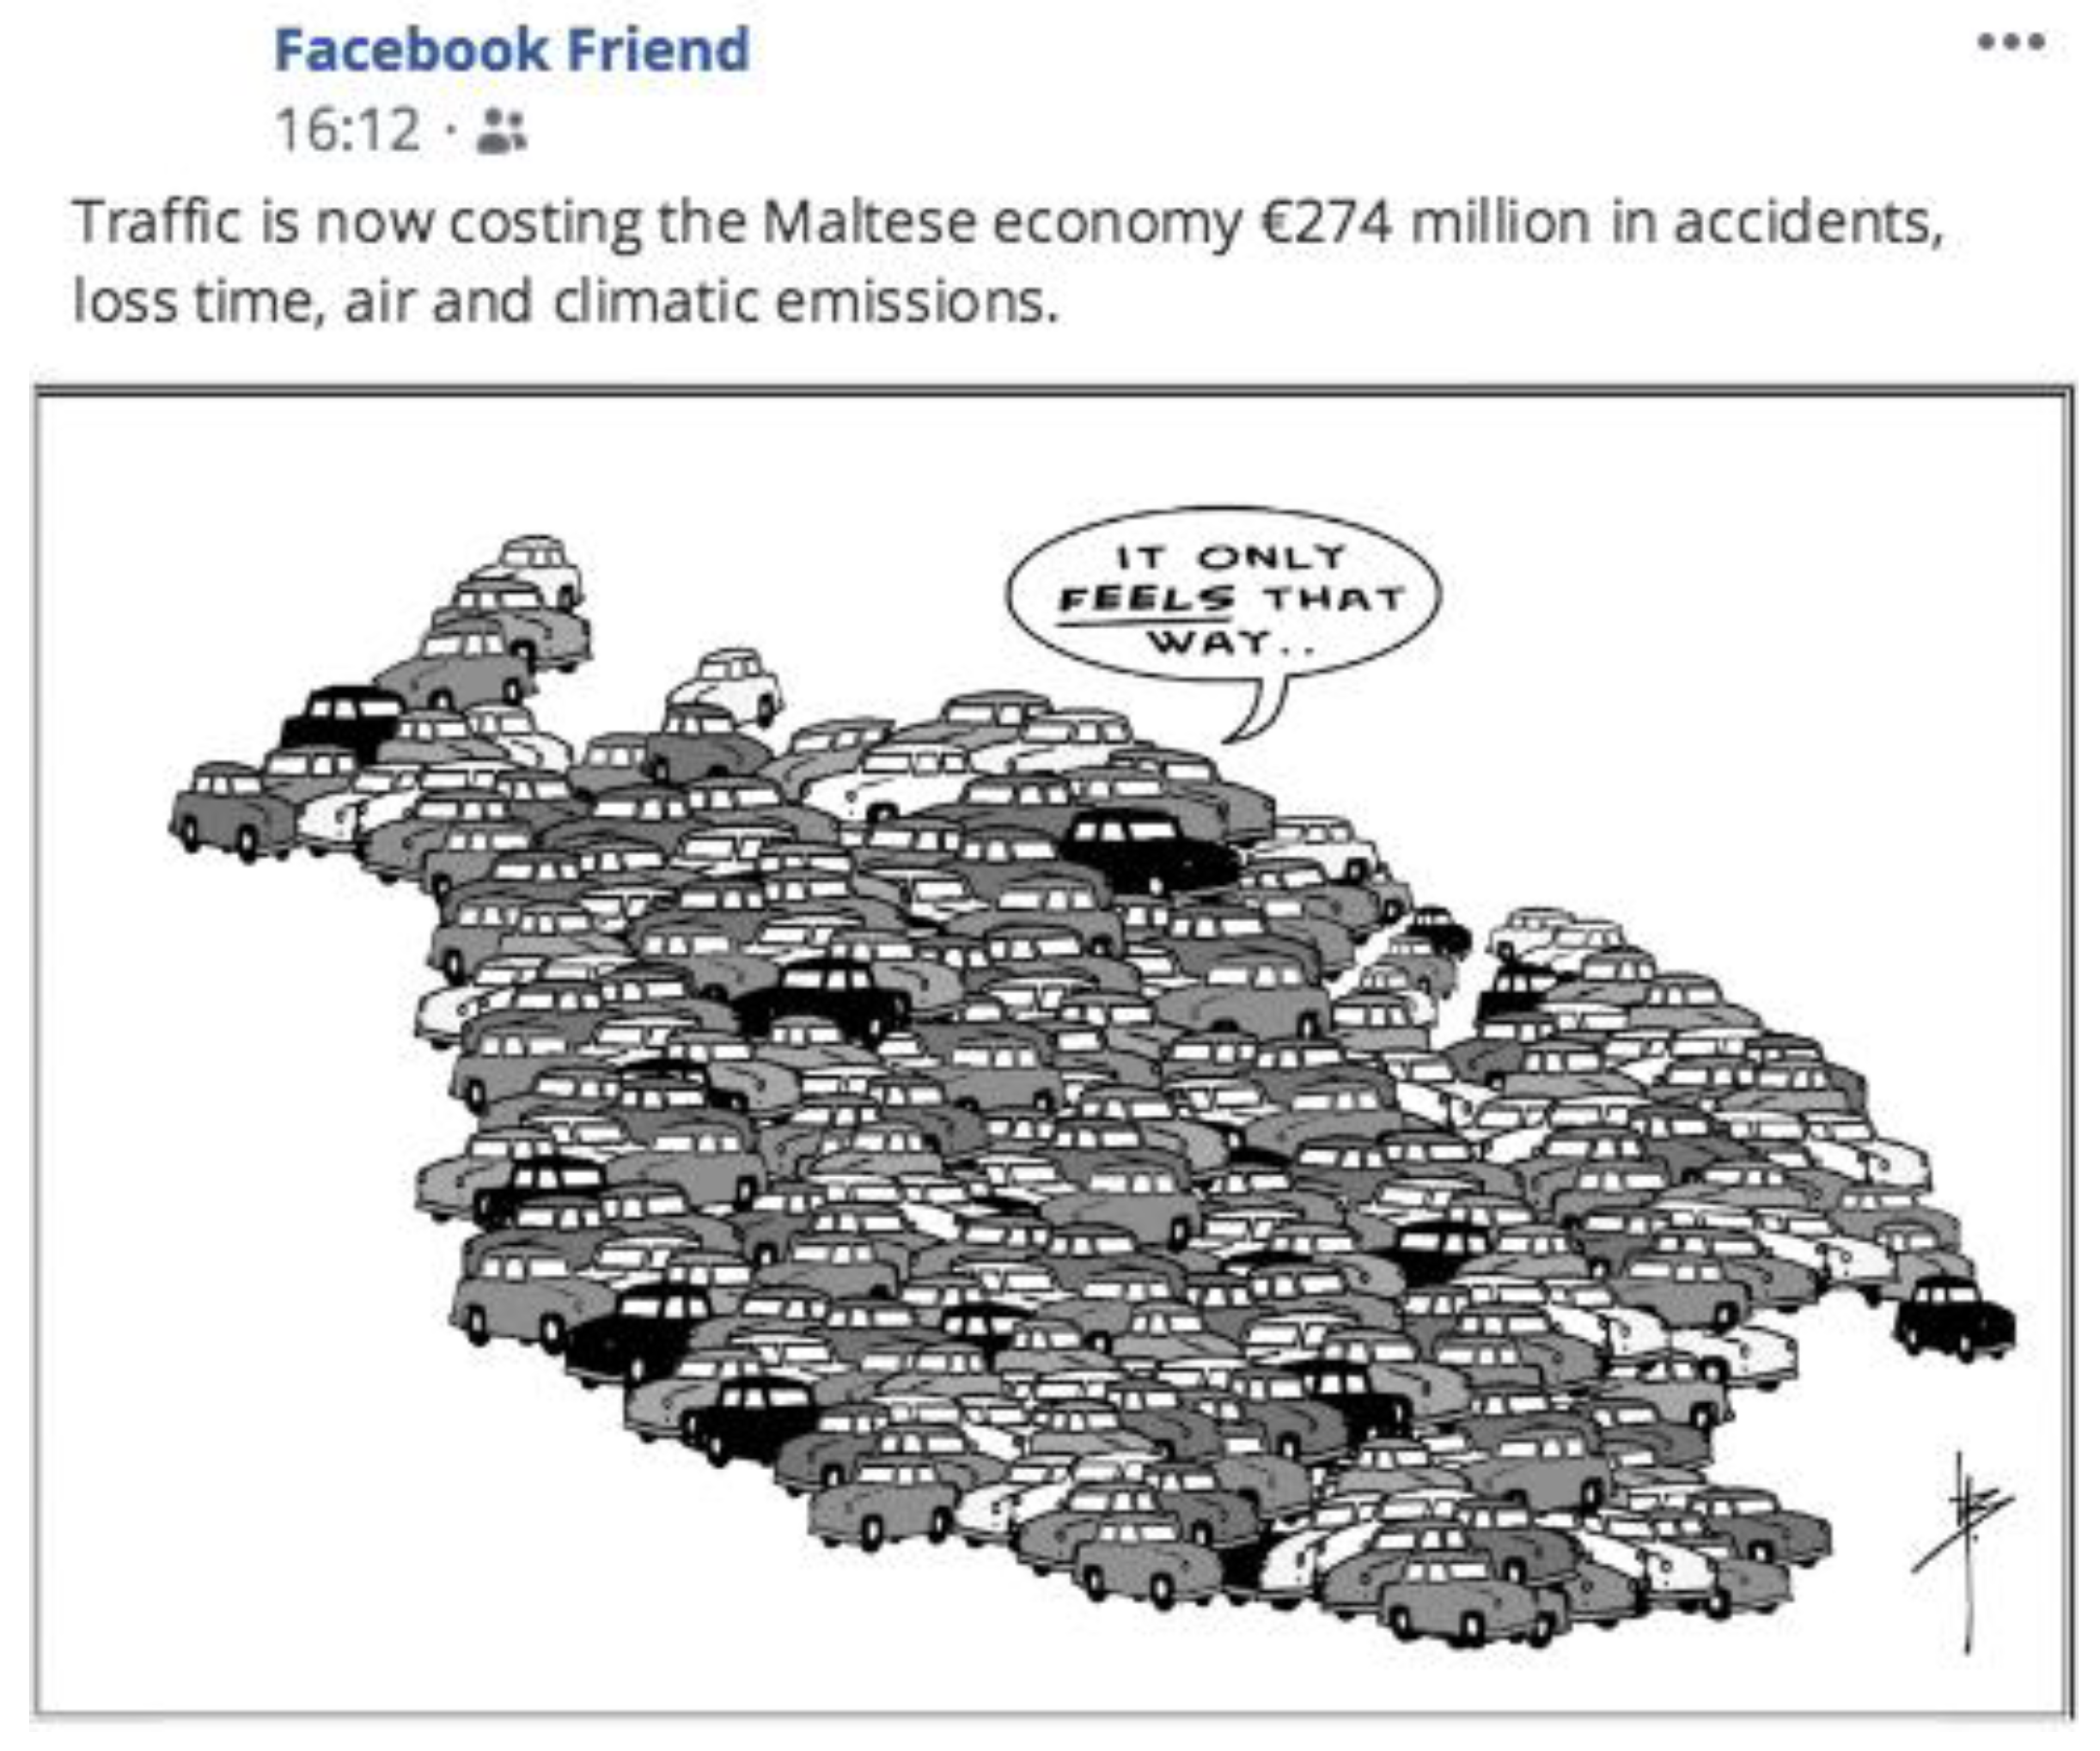
Appendix A.1. Traffic Experiment
Figure A1.
Treatment 1 text relating to traffic issues.

Figure A2.
Treatment 2 cartoon relating to traffic issues.

Figure A3.
Treatment 3 cartoon and text relating to traffic issues.

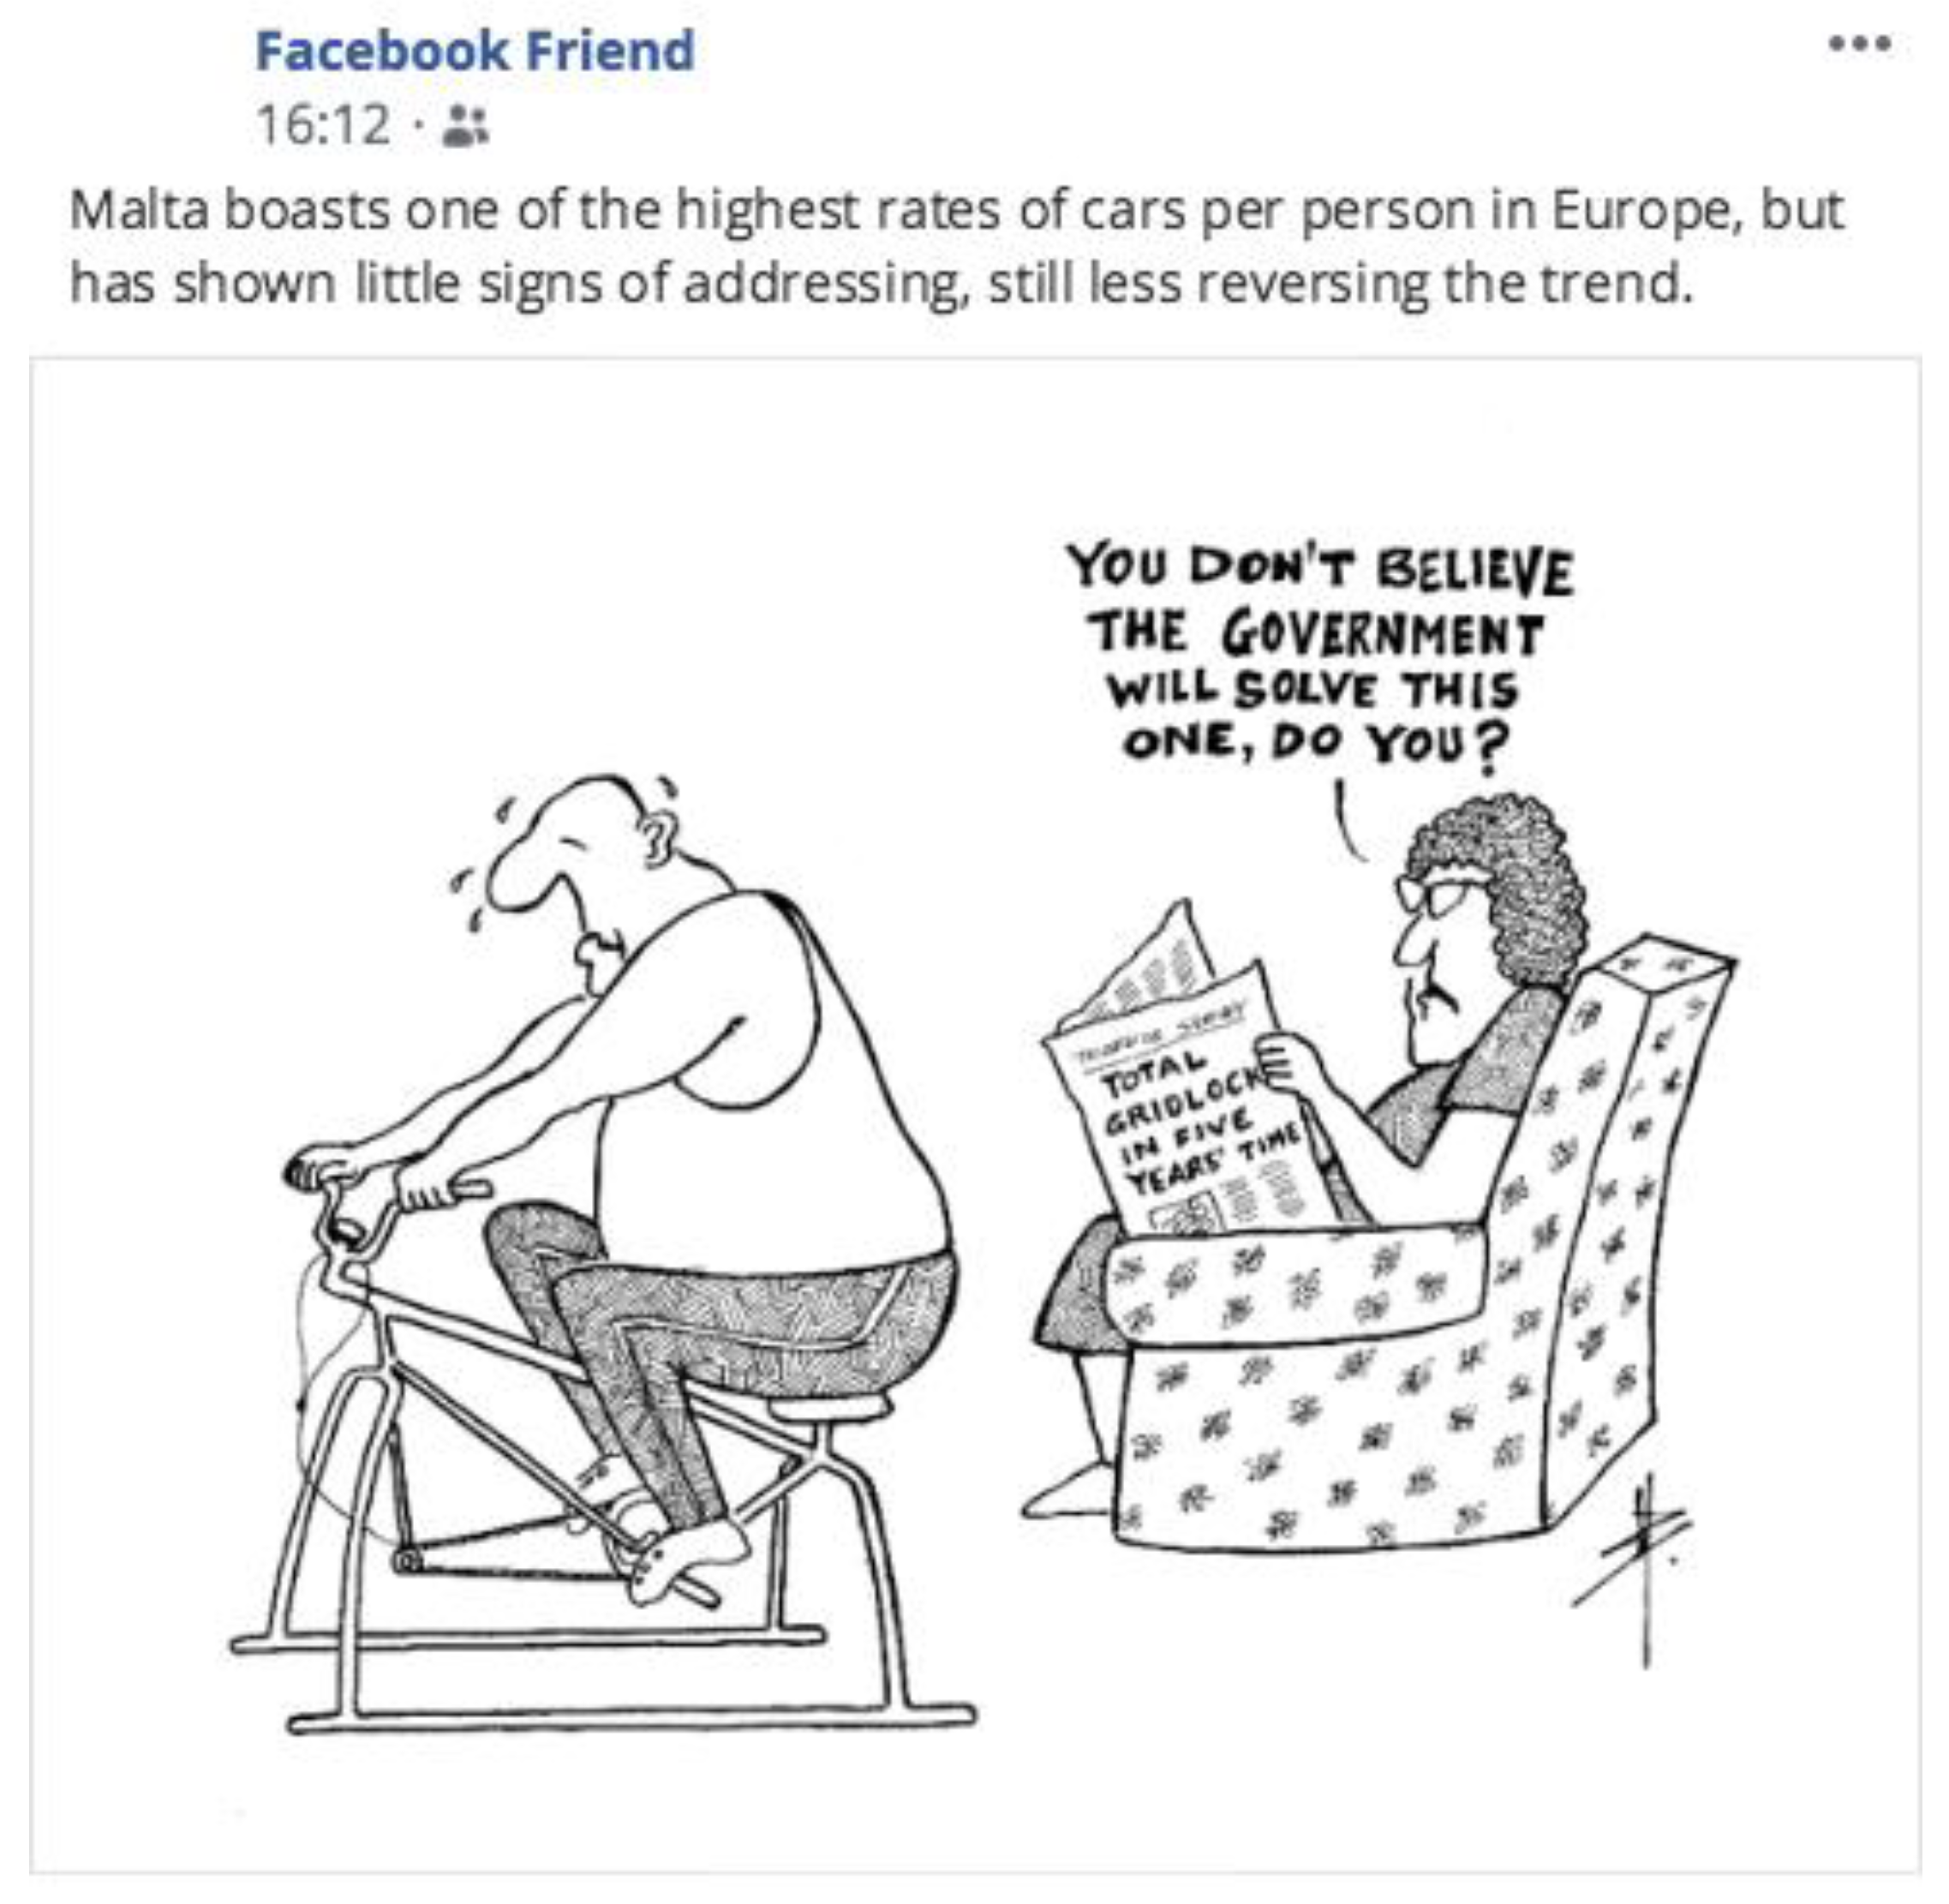
Appendix A.2. Congestion Experiment
Figure A4.
Treatment 1 text relating to congestion issues.

Figure A5.
Treatment 2 cartoon relating to congestion issues.

Figure A6.
Treatment 3 cartoon and text relating to congestion issues.

Appendix A.3. Urbanization Experiment
Figure A7.
Treatment 1 text relating to urbanization issues.

Figure A8.
Treatment 2 cartoon relating to urbanization issues.

Figure A9.
Treatment 3 cartoon and text relating to urbanization issues.

Appendix A.4. Litter Experiment
Figure A10.
Treatment 1 text relating to litter issues.

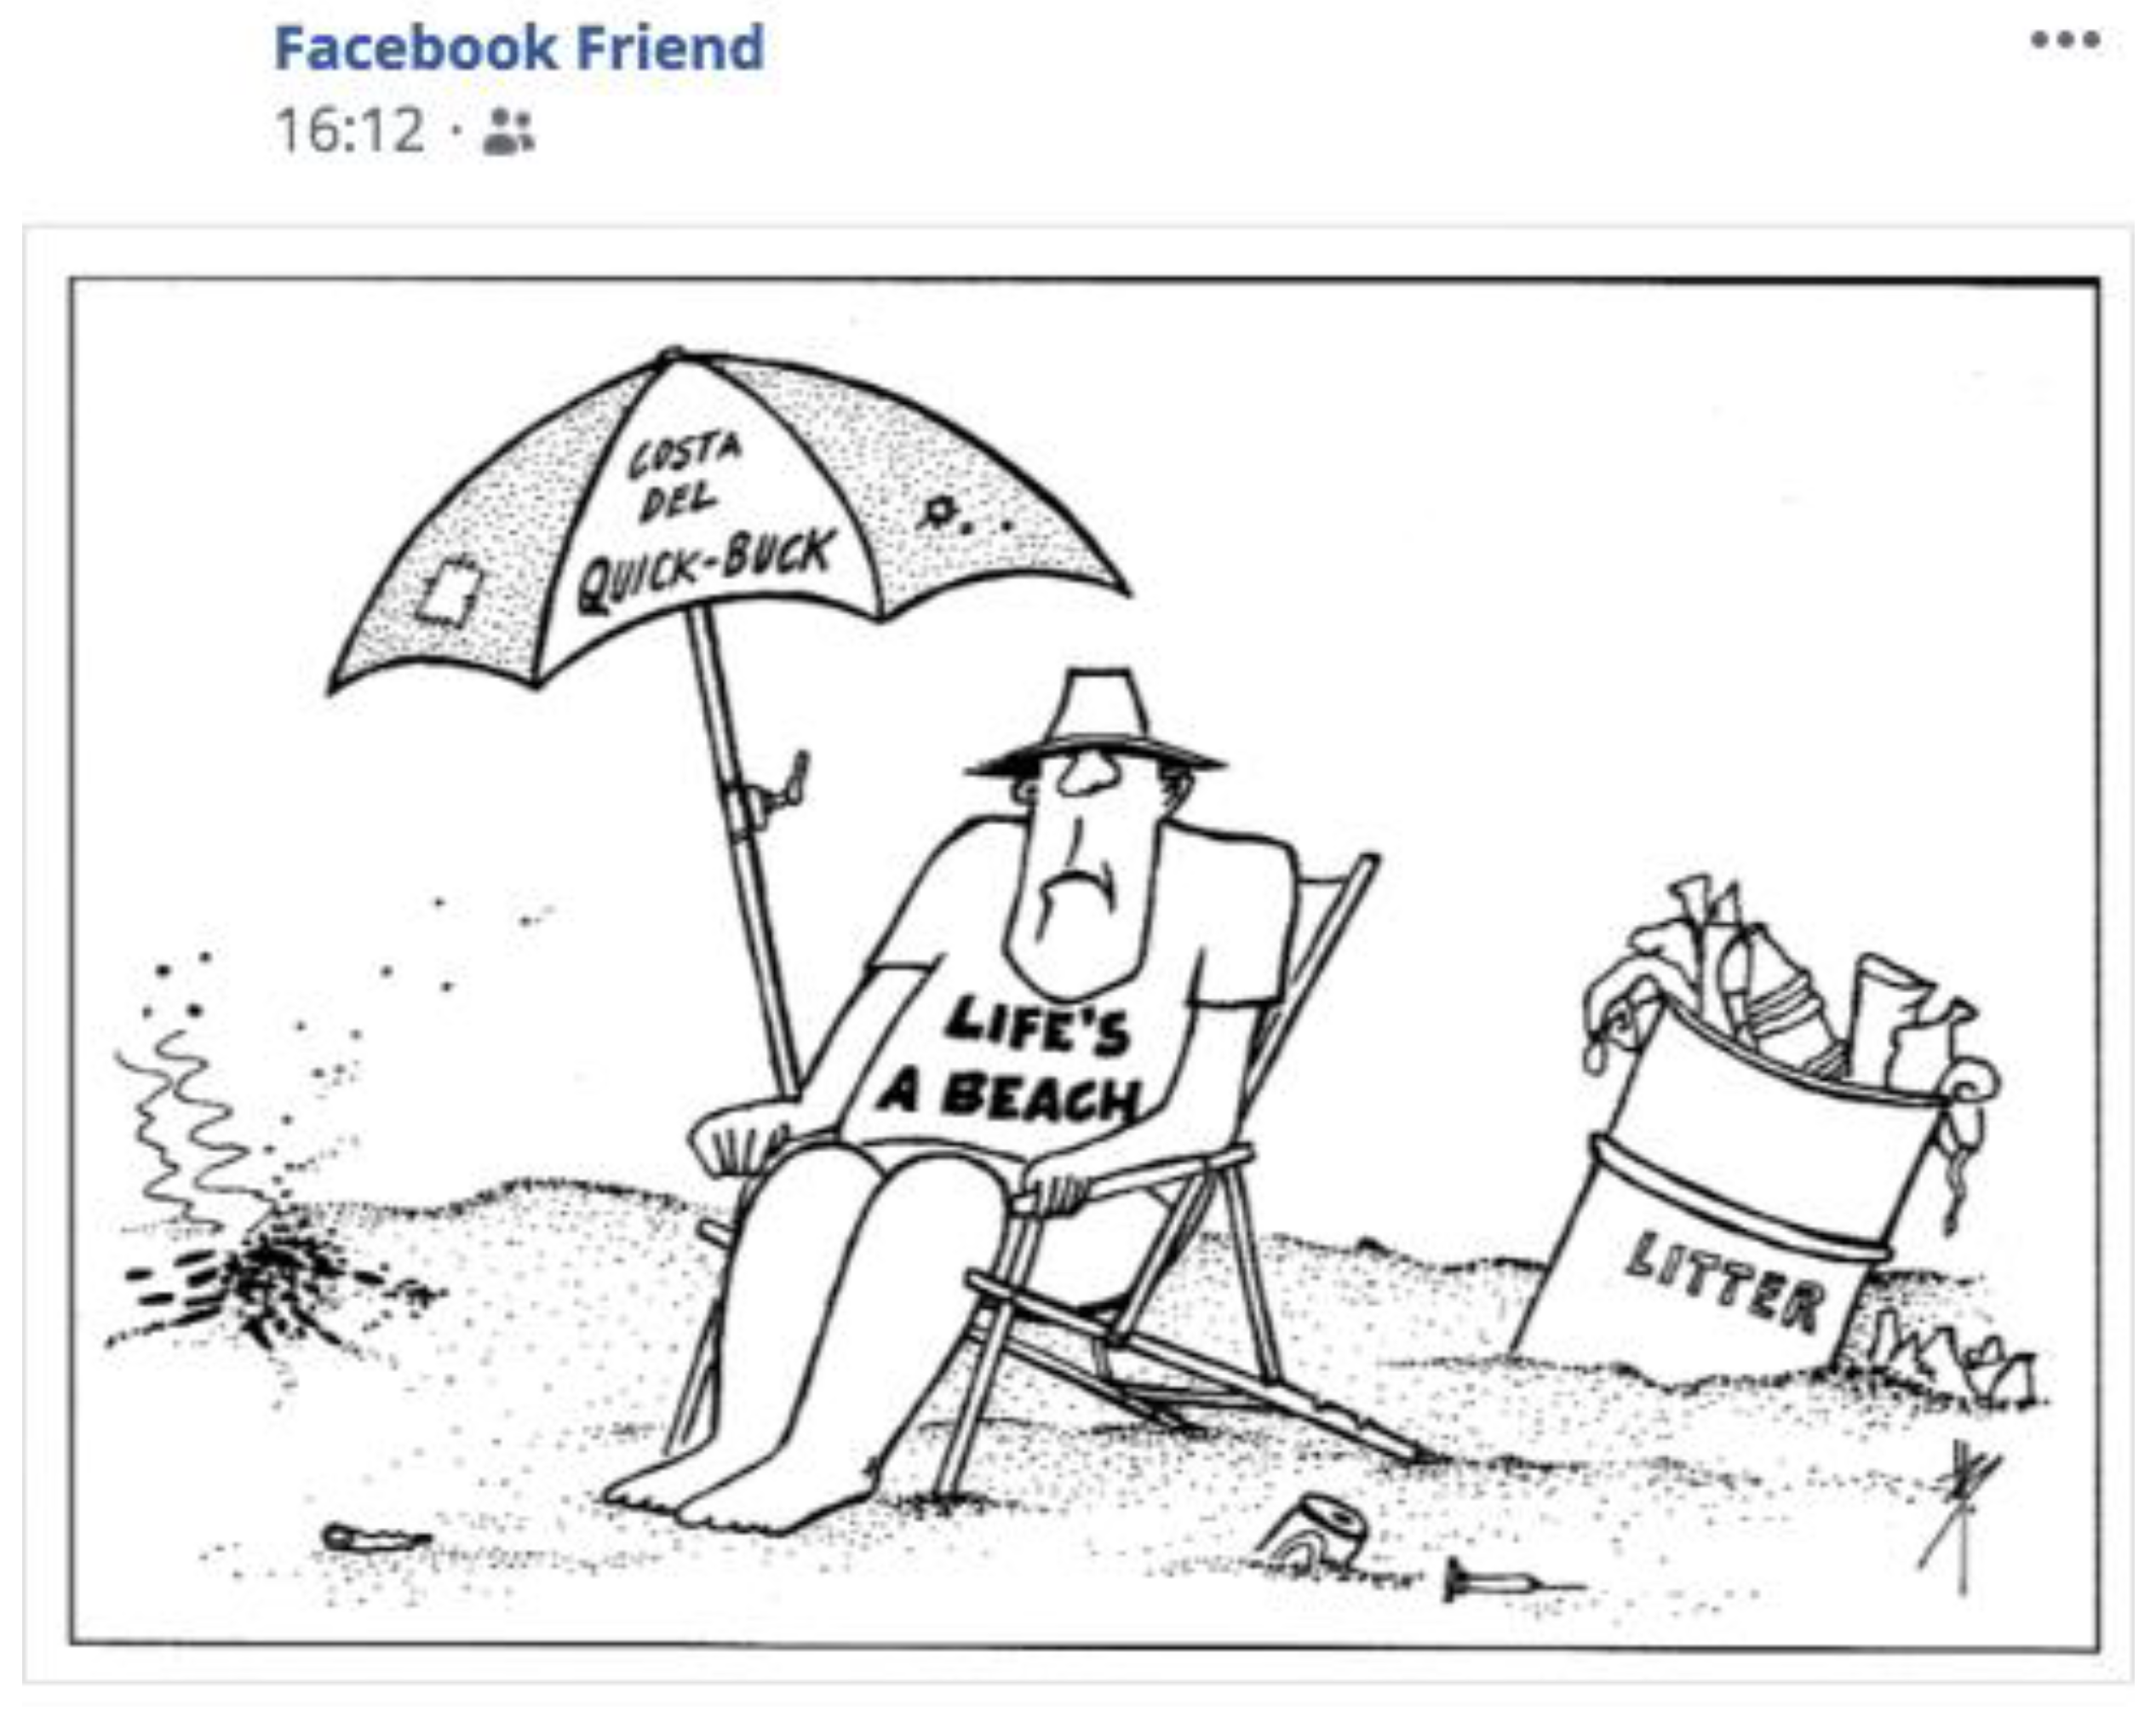
Figure A11.
Treatment 2 cartoon relating to litter issues.

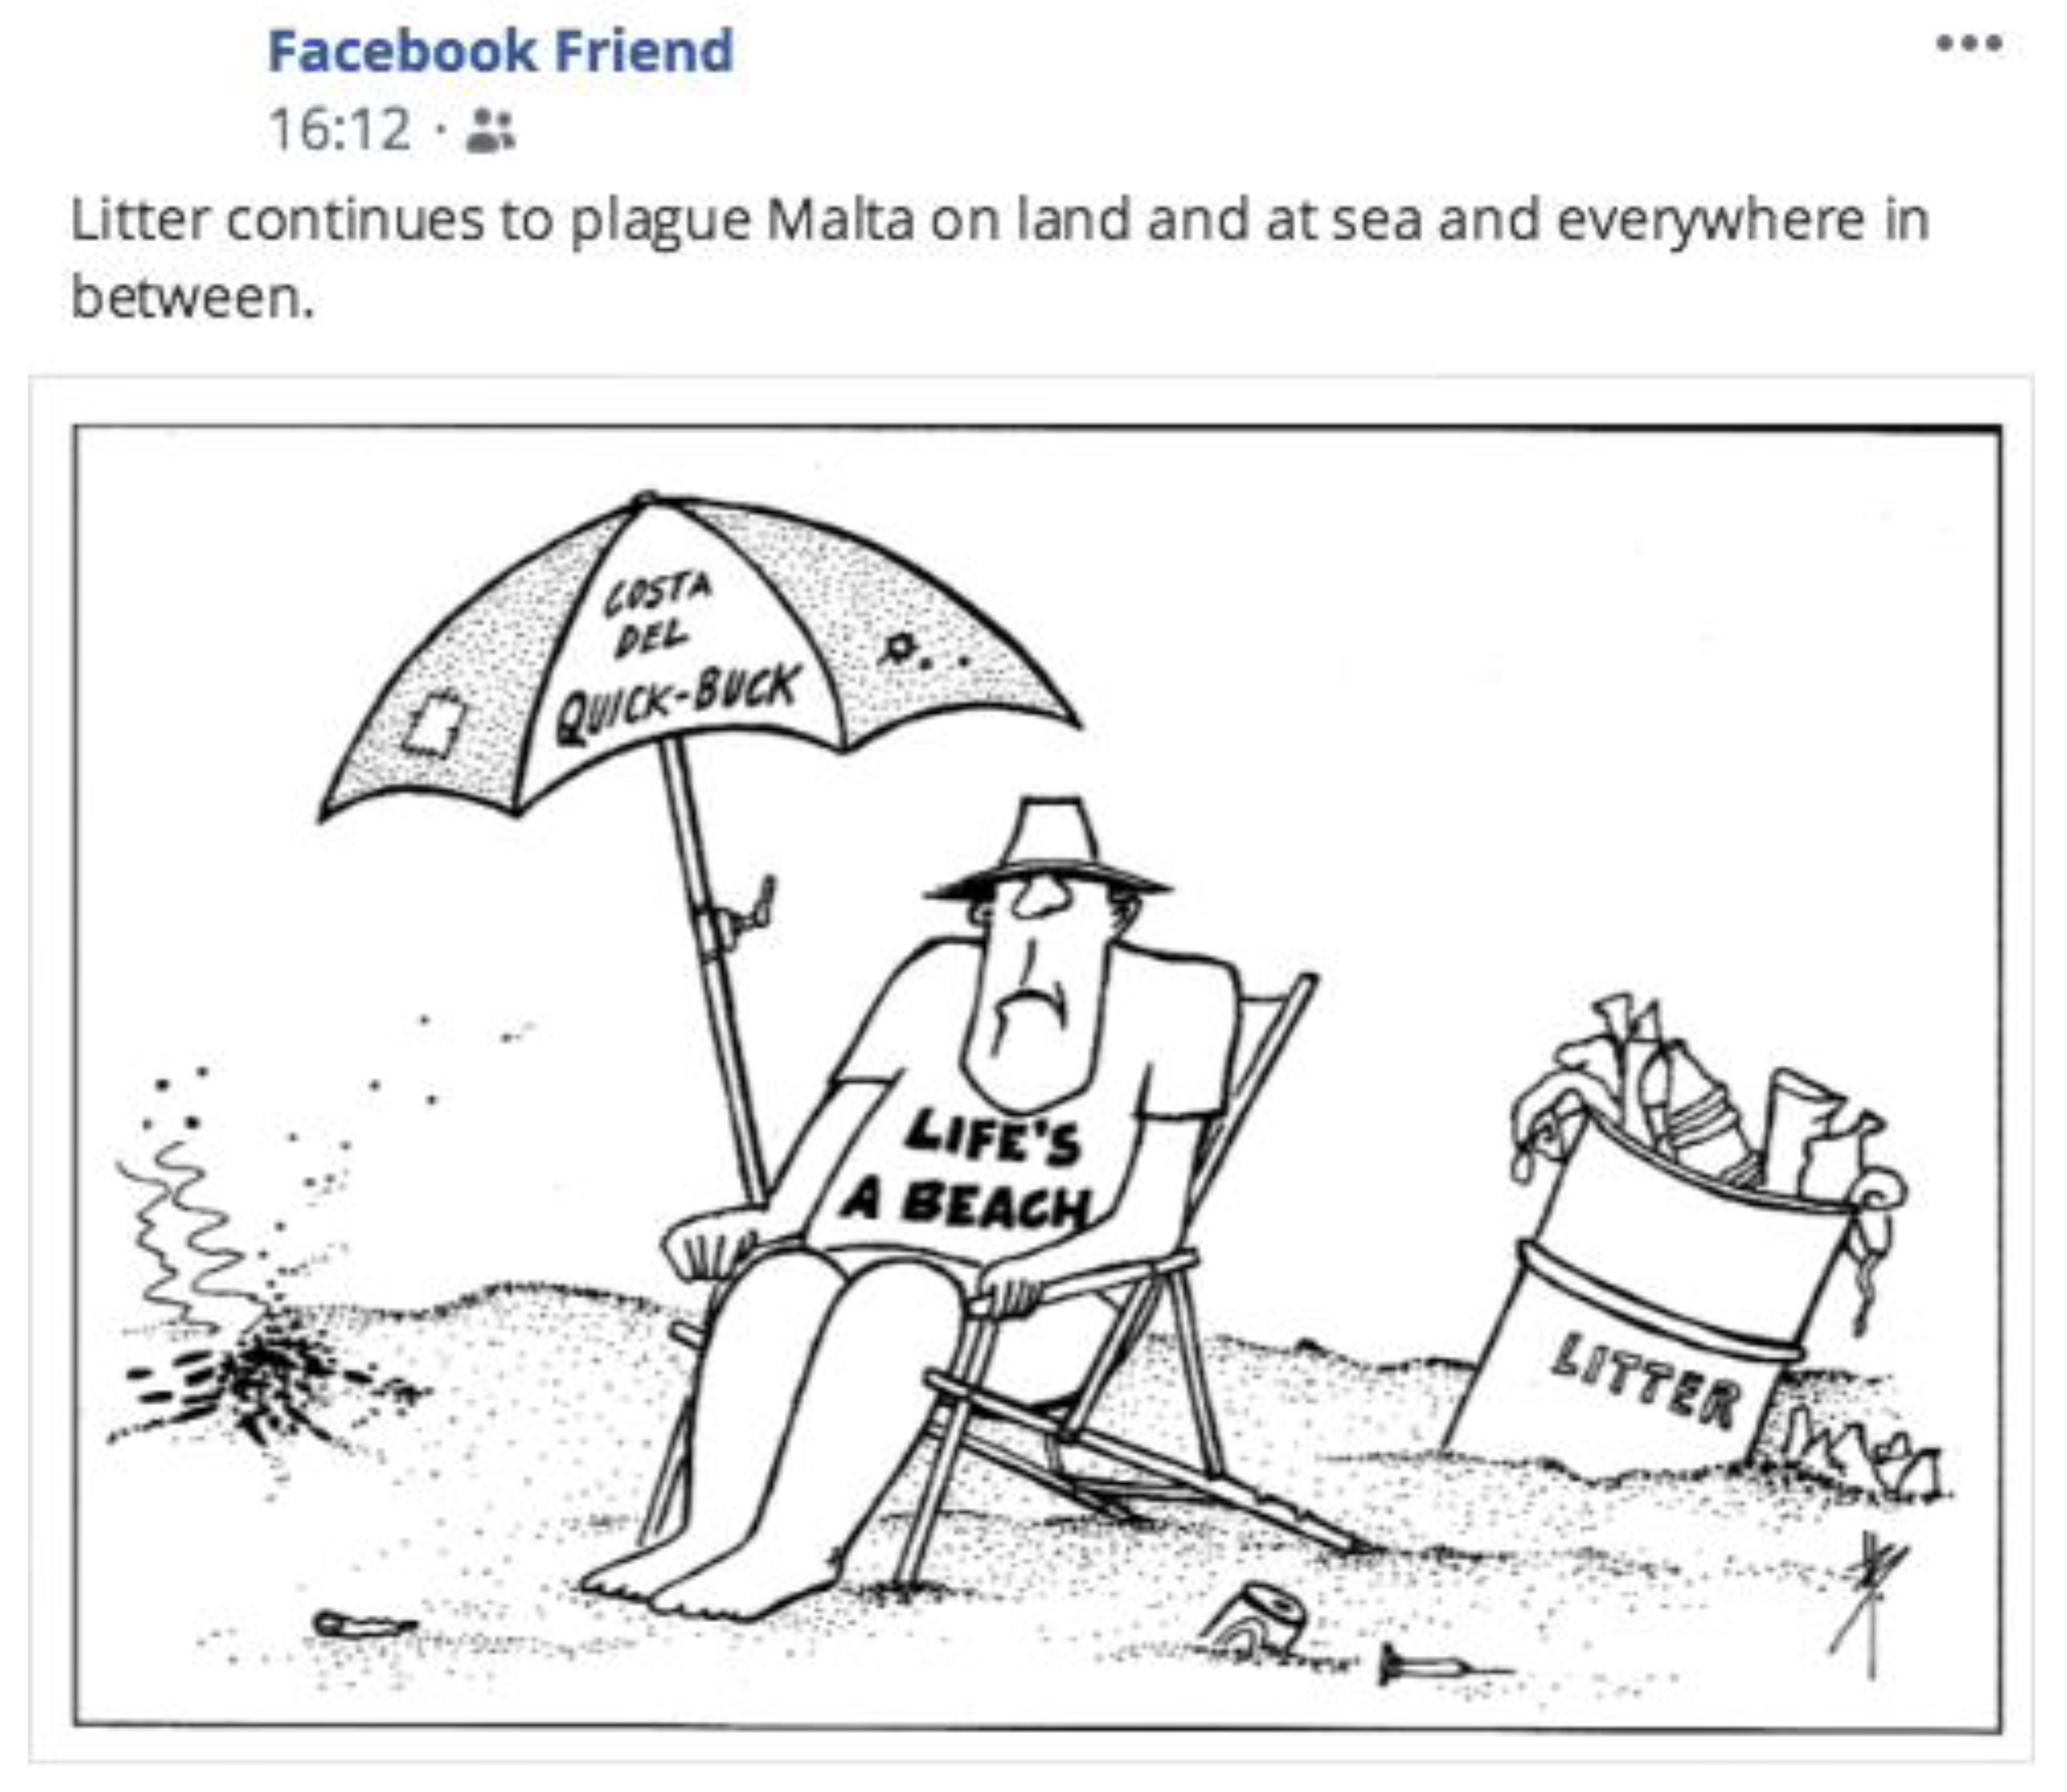
Figure A12.
Treatment 3 cartoon and text relating to litter issues.

Appendix A.5. Waste Experiment
Figure A13.
Treatment 1 text relating to waste issues.

Figure A14.
Treatment 2 cartoon relating to waste issues.

Figure A15.
Treatment 3 cartoon and text relating to waste issues.

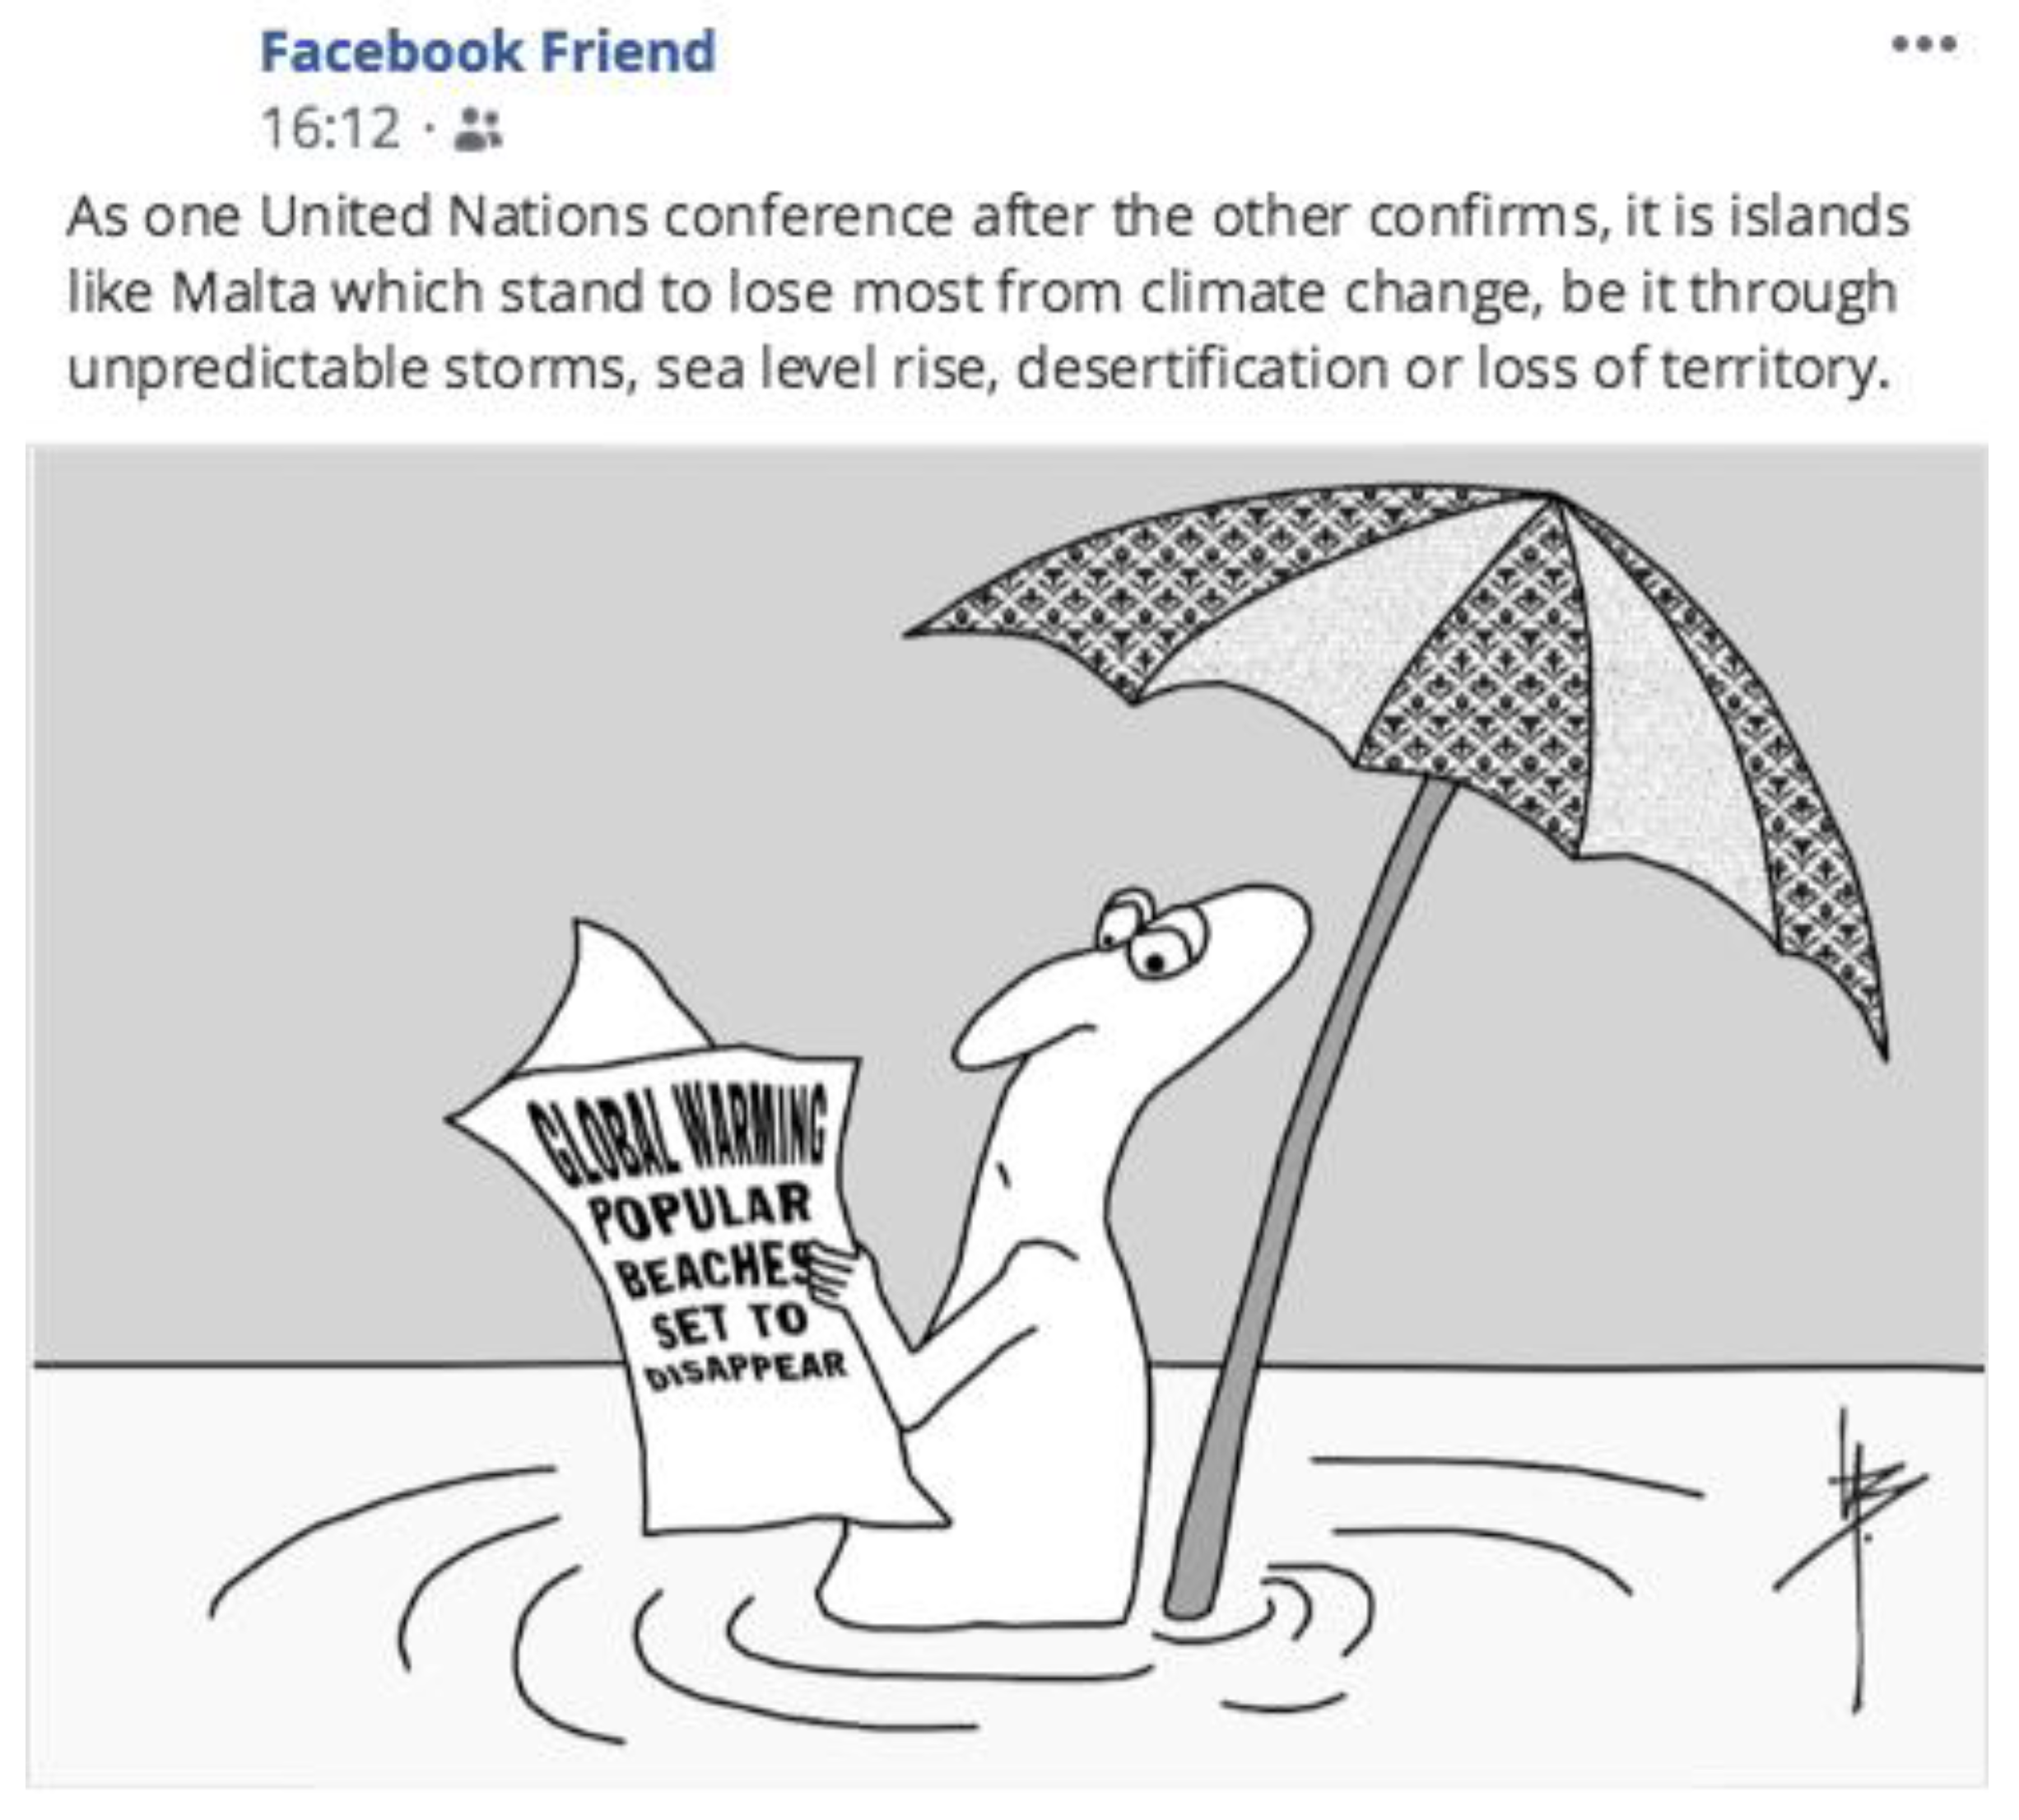
Appendix A.6. Climate Change Experiment
Figure A16.
Treatment 1 text relating to climate change issues.

Figure A17.
Treatment 2 cartoon relating to climate change issues.

Figure A18.
Treatment 3 cartoon and text relating to climate change issues.

References
- IPCC. Global Warming of 1.5 °C: IPCC Special Report on Impacts of Global Warming of 1.5°C above Pre-Industrial Levels in Context of Strengthening Response to Climate Change, Sustainable Development, and Efforts to Eradicate Poverty; Cambridge University Press: Cambridge, UK, 2018. [Google Scholar]
- UNEP. Program Performance Report 2018; UNEP: Nairobi, Kenya, 2019. [Google Scholar]
- European Environment Agency. European Union Emission Inventory Report 1990-2018 under the UNECE Convention on Long-Range Transboundary Air Pollution (LRTAP); Publications Office: Luxembourg, 2020. [Google Scholar]
- Kollmuss, A.; Agyeman, J. Mind the Gap: Why Do People Act Environmentally and What Are the Barriers to pro-Environmental Behavior? Environ. Educ. Res. 2002, 8, 239–260. [Google Scholar] [CrossRef] [Green Version]
- Stern, P.C.; Dietz, T.; Guagnano, G.A. The New Ecological Paradigm in Social-Psychological Context. Environ. Behav. 1995, 27, 723–743. [Google Scholar] [CrossRef]
- Briguglio, M. Household Cooperation in Waste Management: Preferences, Incentives and Promotion. Ph.D. Thesis, University of Stirling, Stirling, UK, 2014. [Google Scholar]
- Briguglio, M.; Delaney, L.; Wood, A. Voluntary Recycling despite Disincentives. J. Environ. Plan. Manag. 2016, 59, 1751–1774. [Google Scholar] [CrossRef]
- Thaler, R.H.; Sunstein, C.R. Nudge: Improving Decisions about Health, Wealth, and Happiness; Yale University Press: New Haven, CT, USA, 2008. [Google Scholar]
- Ostrom, E. Beyond Markets and States: Polycentric Governance of Complex Economic Systems. Am. Econ. Rev. 2010, 100, 641–672. [Google Scholar] [CrossRef] [Green Version]
- Cacciatore, M.A.; Scheufele, D.A.; Corley, E.A. Another (Methodological) Look at Knowledge Gaps and the Internet’s Potential for Closing Them. Public Underst Sci 2014, 23, 376–394. [Google Scholar] [CrossRef]
- Rhee, L.; Bayer, J.B.; Lee, D.S.; Kuru, O. Social by Definition: How Users Define Social Platforms and Why It Matters. Telemat. Inform. 2021, 59, 101538. [Google Scholar] [CrossRef]
- Lamberton, C.; Stephen, A.T. A Thematic Exploration of Digital, Social Media, and Mobile Marketing: Research Evolution from 2000 to 2015 and an Agenda for Future Inquiry. J. Mark. 2016, 80, 146–172. [Google Scholar] [CrossRef] [Green Version]
- Bernhardt, J.; Mays, D.; Hall, A. Social Marketing at the Right Place and Right Time with New Media. J. Soc. Mark. 2012, 2, 130–137. [Google Scholar] [CrossRef]
- Spence, A.; Poortinga, W.; Pidgeon, N. The Psychological Distance of Climate Change. Risk Analy 2012, 32, 957–972. [Google Scholar] [CrossRef] [Green Version]
- Pew Research Center 2019. Available online: https://www.pewresearch.org/fact-tank/2019/04/10/share-of-u-s-adults-using-social-media-including-facebook-is-mostly-unchanged-since-2018/ (accessed on 28 November 2022).
- Bortree, D.; Seltzer, T. Dialogic Strategies and Outcomes: An Analysis of Environmental Advocacy Groups’ Facebook Profiles. Public Relat. Rev. 2009, 35, 317–319. [Google Scholar] [CrossRef]
- Lovejoy, K.; Saxton, G.D. Information, Community, and Action: How Nonprofit Organizations Use Social Media. J. Comput. -Mediat. Commun. 2012, 17, 337–353. [Google Scholar] [CrossRef] [Green Version]
- Fernandez, M.; Piccolo, L.S.G.; Maynard, D.; Wippoo, M.; Meili, C.; Alani, H. Talking Climate Change via Social Media: Communication, Engagement and Behaviour. In Proceedings of the 8th ACM Conference on Web Science, Hannover, Germany, 22–25 May 2016; Association for Computing Machinery: New York, NY, USA; pp. 85–94. [Google Scholar]
- Grasso, M.; Giugni, M. The Routledge Handbook of Environmental Movements; Routledge: Oxford, UK, 2022. [Google Scholar]
- Boulianne, S.; Lalancette, M.; Ilkiw, D. “School Strike 4 Climate”: Social Media and the International Youth Protest on Climate Change. Media Commun. 2020, 8, 208–218. [Google Scholar] [CrossRef]
- Leong, C.; Pan, S.L.; Bahri, S.; Fauzi, A. Social Media Empowerment in Social Movements: Power Activation and Power Accrual in Digital Activism. Eur. J. Inf. Syst. 2019, 28, 173–204. [Google Scholar] [CrossRef]
- Tamar, M.; Wirawan, H.; Arfah, T.; Putri, R.P.S. Predicting Pro-Environmental Behaviours: The Role of Environmental Values, Attitudes and Knowledge. MEQ 2020, 32, 328–343. [Google Scholar] [CrossRef]
- Moser, S.C. Communicating Climate Change: History, Challenges, Process and Future Directions. WIREs Clim. Chang. 2010, 1, 31–53. [Google Scholar] [CrossRef]
- Briguglio, M.; Moncada, S. Environmental Challenges in Malta. In The greening of the Mediterranean; Gale de Oliveira, M.S., Kennet, M., Amaral, S., Tezza, E., Briguglio, M., Salman, D., Eds.; The Green Economics Institute: Reading, UK, 2014; pp. 52–57. [Google Scholar]
- Cheng, T.; Woon, D.K.; Lynes, J.K. The Use of Message Framing in the Promotion of Environmentally Sustainable Behaviors. Soc. Mark. Q. 2011, 17, 48–62. [Google Scholar] [CrossRef]
- Greenberger, M. Computers, Communications, and the Public Interest; Johns Hopkins Press: Baltimore, MD, USA, 1971. [Google Scholar]
- Roosen, L.J.; Klöckner, C.A.; Swim, J.K. Visual Art as a Way to Communicate Climate Change: A Psychological Perspective on Climate Change–Related Art. World Art 2018, 8, 85–110. [Google Scholar] [CrossRef]
- Kaplan, S. Human nature and environmentally responsible behavior. J. Soc. Issues 2000, 56, 491–508. [Google Scholar] [CrossRef]
- Martin, R.A.; Ford, T. The Psychology of Humor: An Integrative Approach, 2nd ed.; Elsevier Science: Amsterdam, The Netherlands, 2018. [Google Scholar]
- Veatch, T.C. A Theory of Humor. Humor Int. J. Humor Res. 1998, 11, 161–215. [Google Scholar] [CrossRef]
- Eisend, M.; Tarrahi, F. The Effectiveness of Advertising: A Meta-Meta-Analysis of Advertising Inputs and Outcomes. J. Advert. 2016, 45, 519–531. [Google Scholar] [CrossRef]
- Carlson, K.A. The impact of humor on memory: Is the humor effect about humor? Humor Int. J. Humor Res. 2011, 24, 21–41. [Google Scholar] [CrossRef]
- Sunstein, C.R. Why Nudge? The Politics of Libertarian Paternalism; Yale University Press: New Haven, CT, USA, 2014. [Google Scholar]
- Navasky, V.S. The Art of Controversy: Political Cartoons and Their Enduring Power; Knopf Doubleday Publishing Group: New York, UY, USA, 2013. [Google Scholar]
- Nabi, R.L.; Moyer-Gusé, E.; Byrne, S. All Joking Aside: A Serious Investigation into the Persuasive Effect of Funny Social Issue Messages. Commun. Monogr. 2007, 74, 29–54. [Google Scholar] [CrossRef]
- D’Errico, F.; Poggi, I. “The Bitter Laughter”. When Parody Is a Moral and Affective Priming in Political Persuasion. Front. Psychol. 2016, 7, 1144. [Google Scholar] [CrossRef] [Green Version]
- Becker, A.B. Applying Mass Communication Frameworks to Study Humor’s Impact: Advancing the Study of Political Satire. Ann. Int. Commun. Assoc. 2020, 44, 273–288. [Google Scholar] [CrossRef]
- Abraham, L. Effectiveness of Cartoons as a Uniquely Visual Medium for Orienting Social Issues. J. Commun. Monogr. 2009, 11, 117–165. [Google Scholar] [CrossRef]
- DeSousa, M.A.; Medhurst, M.J. Political Cartoons and American Culture: Significant Symbols of Campaign 1980. Stud. Vis. Commun. 1982, 8, 84–98. [Google Scholar] [CrossRef] [Green Version]
- Caswell, L.S. Drawing Swords: War in American Editorial Cartoons. Am. J. 2004, 21, 13–45. [Google Scholar] [CrossRef]
- Streicher, L.H. On a Theory of Political Caricature. Comp. Stud. Soc. Hist. 1967, 9, 427–445. [Google Scholar] [CrossRef]
- Boykoff, M.; Osnes, B. A Laughing Matter? Confronting Climate Change through Humor. Political Geogr. 2019, 68, 154–163. [Google Scholar] [CrossRef]
- Hansmann, R.; Steimer, N. A Field Experiment on Behavioural Effects of Humorous, Environmentally Oriented and Authoritarian Posters against Littering. EREM 2016, 72, 35–44. [Google Scholar] [CrossRef]
- Kaltenbacher, M.; Drews, S. An Inconvenient Joke? A Review of Humor in Climate Change Communication. Environ. Commun. 2020, 14, 717–729. [Google Scholar] [CrossRef]
- Datareportal 2018. Available online: https://datareportal.com/reports/digital-2018-malta (accessed on 29 November 2022).
- Eurostat 2020. Available online: https://ec.europa.eu/eurostat/statistics-explained/index.php?title=Passenger_cars_in_the_EU (accessed on 7 January 2023).
- MaltaToday 2019. Available online: http://www.maltatoday.com.mt/news/national/96472/ngos_collected_20000_in_a_single_day_to_challenge_central_link_project (accessed on 27 November 2022).
- Briguglio, M.; Bonello, S. No Man’s Land: People, Place & Pollution; Kite Group: Valletta, Malta, 2018. [Google Scholar]
- Environment & Resources Authority (ERA). State of the Environment Report 2018; Environment & Resources Authority (ERA): Marsa, Malta, 2018. [Google Scholar]
- Manduca, J.; Sammut, J.C. The Pens That Felled The Mighty; Agenda Bookshop: Luqa, Malta, 2009. [Google Scholar]
- Times of Malta. Available online: https://timesofmalta.com/articles/listing/Cartoons/weather/forecast/page:45 (accessed on 7 January 2023).
- Leibenstein, H. Bandwagon, Snob, and Veblen Effects in the Theory of Consumers’ Demand. Q. J. Econ. 1950, 64, 183–207. [Google Scholar] [CrossRef] [Green Version]
- Vieira, A.; Santos, B.; Picado-Santos, L. Modelling Road Work Zone Crashes’ Nature and Type of Person Involved Using Multinomial Logistic Regression. Sustainability 2023, 15, 2674. [Google Scholar] [CrossRef]
- Ragazou, K.; Passas, I.; Garefalakis, A.; Kourgiantakis, M.; Xanthos, G. Youth’s Entrepreneurial Intention: A Multinomial Logistic Regression Analysis of the Factors Influencing Greek HEI Students in Time of Crisis. Sustainability 2022, 14, 13164. [Google Scholar] [CrossRef]
- Cronbach, L.J. Coefficient Alpha and the Internal Structure of Tests. Psychometrika 1951, 16, 297–334. [Google Scholar] [CrossRef] [Green Version]
- Vijverberg, W. Testing for IIA with the Hausman-McFadden Test. IZA Discuss. Pap. Ser. 2011, 5826. [Google Scholar] [CrossRef]
- Spiteri, G.W. Does the Evaluability Bias Hold When Giving to Animal Charities? Judgm. Decis. Mak. 2022, 17, 315–330. [Google Scholar] [CrossRef]
- Hsee, C.K. The Evaluability Hypothesis: An Explanation for Preference Reversals between Joint and Separate Evaluations of Alternatives. Organ. Behav. Hum. Decis. Process. 1996, 67, 247–257. [Google Scholar] [CrossRef]
- Ajzen, I. The Theory of Planned Behavior. Organ. Behav. Hum. Decis. Process. 1991, 50, 179–211. [Google Scholar] [CrossRef]
- Baumgartner, J. Polls and Elections: Editorial Cartoons 2.0: The Effects of Digital Political Satire on Presidential Candidate Evaluations. Pres. Stud. Q. 2008, 38, 735–758. [Google Scholar] [CrossRef]
- Neuman, W.L. Basics of Social Research Methods: Qualitative and Quantitative Approaches, 2nd ed.; Allyn and Bacon: Boston, MA, USA, 2007. [Google Scholar]
- IPCC. Climate Change 2021: The Physical Science Basis; Cambridge University Press: Cambridge, UK, 2021. [Google Scholar]
Figure 1.
Mean reaction (any emoji) by treatment across six issues.

Figure 2.
Mean shares (private or public) by treatment across six issues.

Figure 3.
Mean intent to change behavior by treatment across six issues.


Table 1.
Descriptive data.
| T1 (N = 61) | T2 (N = 67) | T3 (N = 72) | |||||||||
|---|---|---|---|---|---|---|---|---|---|---|---|
| Variable | N | Mean | SD | Min | Max | Mean | SD | Mean | SD | Mean | SD |
| Age | 200 | 39.72 | 13.02 | 16 | 100 | 41.74 | 11.55 | 40.61 | 15.11 | 37.18 | 11.82 |
| Gender | 200 | 0.57 | 0.50 | 0 | 1 | 0.59 | 0.50 | 0.52 | 0.50 | 0.58 | 0.50 |
| Education | 200 | 3.24 | 0.78 | 1 | 4 | 3.34 | 0.68 | 3.18 | 0.85 | 3.19 | 0.80 |
| Environment | 200 | 4.02 | 0.71 | 1 | 5 | 3.99 | 0.72 | 4.06 | 0.75 | 3.99 | 0.66 |
| Social Media | 200 | 3.49 | 0.83 | 1 | 5 | 3.36 | 0.89 | 3.54 | 0.75 | 3.55 | 0.87 |
| Bandwagon | 200 | 0.54 | 0.50 | 0 | 1 | 0.61 | 0.49 | 0.55 | 0.50 | 0.47 | 0.50 |
| React | 200 | 0.74 | 0.44 | 0 | 1 | 0.54 | 0.50 | 0.87 | 0.34 | 0.79 | 0.41 |
| Share | 200 | 0.70 | 0.89 | 0 | 2 | 0.52 | 0.85 | 0.79 | 0.90 | 0.76 | 0.91 |
| Behavioral Intent | 200 | 0.45 | 0.50 | 0 | 1 | 0.43 | 0.50 | 0.40 | 0.49 | 0.51 | 0.50 |
| React | 200 | 0.61 | 0.49 | 0 | 1 | 0.46 | 0.50 | 0.66 | 0.48 | 0.69 | 0.46 |
| Share | 200 | 0.57 | 0.83 | 0 | 2 | 0.48 | 0.83 | 0.49 | 0.79 | 0.71 | 0.86 |
| Behavioral Intent | 200 | 0.33 | 0.47 | 0 | 1 | 0.25 | 0.43 | 0.34 | 0.48 | 0.39 | 0.49 |
| React | 200 | 0.75 | 0.43 | 0 | 1 | 0.56 | 0.50 | 0.81 | 0.40 | 0.86 | 0.35 |
| Share | 200 | 0.78 | 0.90 | 0 | 2 | 0.57 | 0.87 | 0.69 | 0.87 | 1.04 | 0.90 |
| Behavioral Intent | 198 | 0.41 | 0.49 | 0 | 1 | 0.31 | 0.47 | 0.38 | 0.49 | 0.54 | 0.50 |
| React | 200 | 0.75 | 0.44 | 0 | 1 | 0.61 | 0.49 | 0.79 | 0.41 | 0.82 | 0.39 |
| Share | 200 | 0.85 | 0.95 | 0 | 2 | 0.79 | 0.97 | 0.75 | 0.91 | 0.99 | 0.96 |
| Behavioral Intent | 197 | 0.62 | 0.49 | 0 | 1 | 0.62 | 0.49 | 0.53 | 0.50 | 0.71 | 0.46 |
| React | 200 | 0.72 | 0.45 | 0 | 1 | 0.61 | 0.49 | 0.76 | 0.43 | 0.76 | 0.43 |
| Share | 200 | 0.75 | 0.91 | 0 | 2 | 0.62 | 0.92 | 0.61 | 0.87 | 0.97 | 0.90 |
| Behavioral Intent | 199 | 0.59 | 0.49 | 0 | 1 | 0.62 | 0.49 | 0.45 | 0.50 | 0.69 | 0.46 |
| React | 200 | 0.72 | 0.45 | 0 | 1 | 0.59 | 0.50 | 0.76 | 0.43 | 0.79 | 0.41 |
| Share | 199 | 0.83 | 0.93 | 0 | 2 | 0.69 | 0.92 | 0.68 | 0.90 | 1.08 | 0.92 |
| Behavioral Intent | 198 | 0.53 | 0.50 | 0 | 1 | 0.44 | 0.50 | 0.48 | 0.50 | 0.65 | 0.48 |
Table 2.
Chi-square tests of association.
| Domain | Response | Test of H0: T1 vs. T2 and T3 | Test of H1: T1 vs. T2 | Test of H2: T1 vs. T3 |
|---|---|---|---|---|
| No Difference | Cartoon > Text | Cartoon and Text > Text | ||
| Traffic | React | 18.07 *** | 16.38 *** | 9.49 *** |
| Share | 5.24 | 5.22 | 3.33 | |
| Behavior | 0.20 | 0.07 | 1.02 | |
| Congestion | React | 8.41 *** | 5.07 ** | 7.55 *** |
| Share | 4.97 | 2.78 | 6.81 ** | |
| Behavior | 2.81 | 1.45 | 3.09 | |
| Urbanization | React | 17.37 *** | 9.18 *** | 15.17 *** |
| Share | 7.12 ** | 1.71 | 12.06 *** | |
| Behavior | 3.83 ** | 0.63 | 6.69 *** | |
| Litter | React | 8.86 *** | 5.21 ** | 7.45 *** |
| Share | 3.32 | 3.47 | 3.50 | |
| Behavior | 0.00 | 1.11 | 1.23 | |
| Waste | React | 5.07 ** | 3.55 | 3.83 ** |
| Share | 6.88 ** | 2.58 | 12.05 *** | |
| Behavior | 0.33 | 3.61 | 0.75 | |
| Climate Change | React | 7.34 *** | 4.29 ** | 6.38 ** |
| Share | 3.92 | 0.67 | 8.78 ** | |
| Behavior | 2.72 | 0.15 | 5.91 ** |
*** p < 0.01, ** p < 0.05, * p < 0.1.
Table 3.
Propensity to react (logit specification).
| Variables | Traffic | Congestion | Urbanization | Litter | Waste | Climate Change |
|---|---|---|---|---|---|---|
| Age | 0.990 | 1.004 | 0.988 | 0.977 | 0.981 | 0.988 |
| (0.015) | (0.013) | (0.015) | (0.018) | (0.015) | (0.013) | |
| Gender | 0.700 | 0.640 | 0.697 | 1.612 | 2.073 * | 1.052 |
| (0.265) | (0.219) | (0.255) | (0.660) | (0.775) | (0.376) | |
| Education | 1.035 | 0.526 *** | 0.896 | 0.637 | 0.769 | 0.927 |
| (0.262) | (0.121) | (0.220) | (0.185) | (0.184) | (0.206) | |
| Environment | 1.091 | 1.800 *** | 1.599 * | 1.967 ** | 0.996 | 1.193 |
| (0.270) | (0.408) | (0.446) | (0.676) | (0.272) | (0.347) | |
| Social Media | 2.683 *** | 2.238 *** | 1.919 *** | 3.822 *** | 3.071 *** | 2.165 *** |
| (0.641) | (0.466) | (0.469) | (1.113) | (0.776) | (0.496) | |
| Bandwagon | 0.892 | 1.481 | 1.336 | 1.512 | 1.600 | 1.007 |
| (0.351) | (0.500) | (0.480) | (0.592) | (0.591) | (0.344) | |
| T2 | 5.394 *** | 1.938 | 3.016 ** | 2.162 | 1.934 | 1.974 |
| (2.533) | (0.789) | (1.331) | (1.080) | (0.892) | (0.848) | |
| T3 | 3.040 ** | 2.738 ** | 4.837 *** | 2.985 ** | 1.968 | 2.376 ** |
| (1.356) | (1.186) | (2.167) | (1.451) | (0.901) | (1.017) | |
| Constant | 0.054 * | 0.039 ** | 0.055 * | 0.010 ** | 0.104 | 0.113 |
| (0.083) | (0.054) | (0.089) | (0.017) | (0.162) | (0.160) | |
| Observations | 200 | 200 | 200 | 200 | 200 | 200 |
Table presents odd ratios; robust standard errors in parentheses; *** p < 0.01, ** p < 0.05, * p < 0.1.
Table 4.
Propensity to share (multinomial logit specification).
| Variables | Traffic | Congestion | Urbanization | Litter | Waste | Climate Change |
|---|---|---|---|---|---|---|
| (a) Sharing Privately | ||||||
| Age | 0.999 | 1.008 | 0.980 | 0.984 | 1.013 | 0.998 |
| (0.016) | (0.018) | (0.017) | (0.019) | (0.018) | (0.019) | |
| Gender | 0.575 | 0.477 | 0.316 ** | 0.796 | 0.810 | 1.448 |
| (0.269) | (0.245) | (0.146) | (0.438) | (0.413) | (0.719) | |
| Education | 0.780 | 0.320 *** | 0.575 * | 0.589 * | 0.431 *** | 0.554 ** |
| (0.217) | (0.100) | (0.176) | (0.185) | (0.125) | (0.156) | |
| Environment | 0.992 | 1.092 | 1.641 | 1.014 | 1.034 | 0.663 |
| (0.406) | (0.461) | (0.628) | (0.489) | (0.463) | (0.259) | |
| Social Media | 1.988 ** | 1.266 | 1.841 * | 1.491 | 1.530 | 1.697 |
| (0.673) | (0.404) | (0.602) | (0.544) | (0.499) | (0.590) | |
| Bandwagon | 2.019 | 1.630 | 1.482 | 1.815 | 1.682 | 1.226 |
| (1.038) | (0.804) | (0.733) | (1.101) | (0.840) | (0.631) | |
| T2 | 3.166 * | 2.086 | 1.512 | 3.061 | 2.618 | 1.479 |
| (2.211) | (1.669) | (1.004) | (2.721) | (2.413) | (1.019) | |
| T3 | 2.539 | 4.778 ** | 4.829 ** | 3.655 | 10.075 *** | 4.195 ** |
| (1.808) | (3.673) | (3.189) | (3.367) | (8.762) | (2.957) | |
| Constant | 0.019 ** | 0.588 | 0.041 * | 0.117 | 0.070 | 0.466 |
| (0.036) | (1.184) | (0.079) | (0.265) | (0.137) | (0.979) | |
| Observations | 200 | 200 | 200 | 200 | 200 | 200 |
| (b) Sharing Publicly | ||||||
| Age | 1.034 ** | 1.036 ** | 1.033 * | 1.026 * | 1.026 * | 1.020 |
| (0.017) | (0.016) | (0.018) | (0.014) | (0.014) | (0.013) | |
| Gender | 0.584 | 0.714 | 0.975 | 1.759 | 1.206 | 1.269 |
| (0.221) | (0.294) | (0.386) | (0.656) | (0.435) | (0.468) | |
| Education | 0.881 | 0.803 | 0.699 | 0.995 | 0.910 | 0.894 |
| (0.229) | (0.225) | (0.177) | (0.239) | (0.224) | (0.219) | |
| Environment | 0.982 | 1.086 | 1.684 ** | 1.153 | 1.014 | 0.986 |
| (0.332) | (0.334) | (0.436) | (0.343) | (0.282) | (0.294) | |
| Social Media | 4.660 *** | 6.148 *** | 5.249 *** | 4.562 *** | 3.967 *** | 4.385 *** |
| (1.302) | (2.040) | (1.464) | (1.279) | (1.008) | (1.268) | |
| Bandwagon | 1.459 | 0.917 | 0.821 | 1.068 | 0.852 | 0.789 |
| (0.546) | (0.383) | (0.319) | (0.391) | (0.311) | (0.284) | |
| T2 | 1.811 | 0.708 | 1.077 | 0.709 | 0.756 | 0.815 |
| (0.848) | (0.363) | (0.528) | (0.314) | (0.353) | (0.363) | |
| T3 | 1.885 | 1.548 | 3.676 *** | 1.528 | 2.216 * | 2.582 ** |
| (0.892) | (0.774) | (1.781) | (0.623) | (0.969) | (1.136) | |
| Constant | 0.001 *** | 0.000*** | 0.000 *** | 0.000 *** | 0.001 *** | 0.002 *** |
| (0.001) | (0.000) | (0.000) | (0.001) | (0.003) | (0.003) | |
| Observations | 200 | 200 | 200 | 200 | 200 | 199 |
Table presents odds ratios; standard errors in parentheses; *** p < 0.01, ** p < 0.05, * p < 0.1. In each case, we carry out a Hausman–McFadden test and confirm that the IIA assumption is not violated. In the case of T1, T2, and T3, we set “No Sharing” as the base category.
Table 5.
Propensity to change behavior (logit specification).
| Variables | Traffic | Congestion | Urbanization | Litter | Waste | Climate Change |
|---|---|---|---|---|---|---|
| Age | 0.997 | 1.024 * | 1.015 | 0.981 | 0.992 | 0.996 |
| (0.013) | (0.013) | (0.014) | (0.014) | (0.012) | (0.013) | |
| Gender | 1.184 | 0.685 | 1.408 | 3.261 *** | 1.981 ** | 2.003 ** |
| (0.354) | (0.223) | (0.457) | (1.186) | (0.637) | (0.657) | |
| Education | 0.868 | 0.608 ** | 0.696 | 1.013 | 0.781 | 0.718 |
| (0.180) | (0.130) | (0.157) | (0.251) | (0.174) | (0.157) | |
| Environment | 1.422 | 1.569 * | 1.530 * | 1.379 | 1.769 ** | 1.218 |
| (0.329) | (0.385) | (0.354) | (0.456) | (0.406) | (0.304) | |
| Social Media | 1.545 ** | 1.799 *** | 1.699 *** | 2.687 *** | 1.633 ** | 1.904 *** |
| (0.291) | (0.396) | (0.337) | (0.605) | (0.325) | (0.388) | |
| Bandwagon | 1.562 | 1.560 | 2.069 ** | 2.338 ** | 2.436 *** | 2.127 ** |
| (0.477) | (0.510) | (0.674) | (0.845) | (0.819) | (0.690) | |
| T2 | 0.833 | 1.426 | 1.305 | 0.549 | 0.409 ** | 1.078 |
| (0.309) | (0.607) | (0.528) | (0.242) | (0.166) | (0.433) | |
| T3 | 1.389 | 2.058 * | 2.986 *** | 1.544 | 1.388 | 2.560 ** |
| (0.512) | (0.841) | (1.202) | (0.682) | (0.575) | (1.025) | |
| Constant | 0.053 ** | 0.012 *** | 0.012 *** | 0.012 *** | 0.044 ** | 0.059 ** |
| (0.072) | (0.018) | (0.018) | (0.021) | (0.064) | (0.083) | |
| Observations | 200 | 200 | 198 | 197 | 199 | 198 |
Table presents odds ratios; robust standard errors in parentheses; *** p < 0.01, ** p < 0.05, * p < 0.1.
Disclaimer/Publisher’s Note: The statements, opinions and data contained in all publications are solely those of the individual author(s) and contributor(s) and not of MDPI and/or the editor(s). MDPI and/or the editor(s) disclaim responsibility for any injury to people or property resulting from any ideas, methods, instructions or products referred to in the content. |
© 2023 by the authors. Licensee MDPI, Basel, Switzerland. This article is an open access article distributed under the terms and conditions of the Creative Commons Attribution (CC BY) license (https://creativecommons.org/licenses/by/4.0/).
Share and Cite
MDPI and ACS Style
Bonnici, T.; Briguglio, M.; Spiteri, G.W. Humor Helps: An Experimental Analysis of Pro-Environmental Social Media Communication. Sustainability 2023, 15, 5157. https://0-doi-org.brum.beds.ac.uk/10.3390/su15065157
AMA Style
Bonnici T, Briguglio M, Spiteri GW. Humor Helps: An Experimental Analysis of Pro-Environmental Social Media Communication. Sustainability. 2023; 15(6):5157. https://0-doi-org.brum.beds.ac.uk/10.3390/su15065157
Chicago/Turabian StyleBonnici, Therese, Marie Briguglio, and Glen William Spiteri. 2023. "Humor Helps: An Experimental Analysis of Pro-Environmental Social Media Communication" Sustainability 15, no. 6: 5157. https://0-doi-org.brum.beds.ac.uk/10.3390/su15065157
Note that from the first issue of 2016, this journal uses article numbers instead of page numbers. See further details here.