1. Introduction
The causes of traffic accidents can be assigned to three reasons: driver-related, vehicle-related and environment-related critical causes [
1]. According to the Stanford Center for Internet and Society, “ninety percent of motor vehicle crashes are caused at least in part by human error” [
2]. Thus, in order to eliminate driver-related factors, the demands of autonomous driving vehicles have primarily driven the development of ADAS. Furthermore, vehicle-related factors are mainly related to the robustness of vehicle components. For example, if the data coming from the sensors are not accurate or reliable, they can corrupt everything else downstream in ADAS. Finally, environment-related factors also raise challenges for road safety. For example, in a dataset of traffic accidents collected in a Chinese city from 2014 to 2016, approximately 30.5% of accidents were related to harsh weather and illumination conditions [
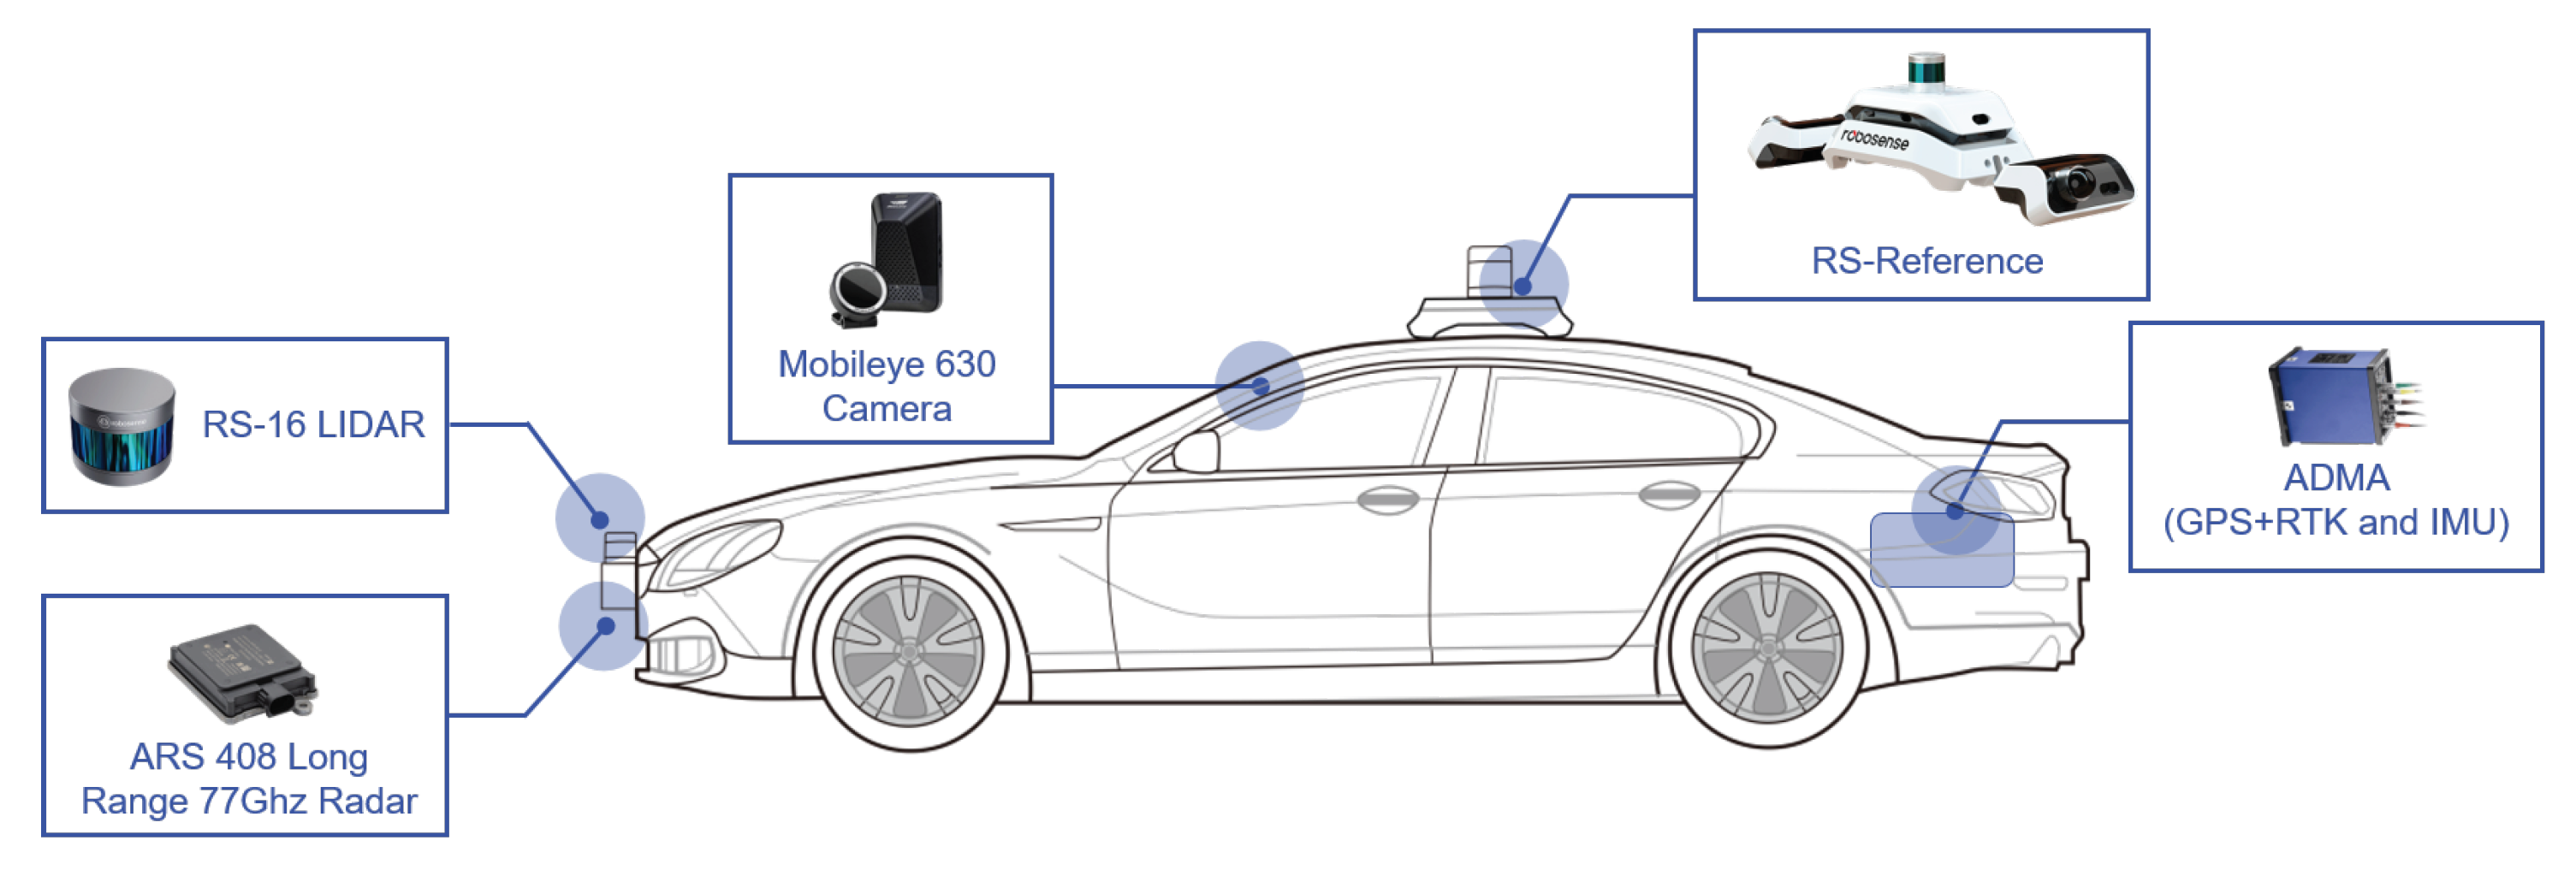
3]. For these reasons, automotive manufacturers are placing a very high priority on the development of safety systems. Therefore, a reliable and safe ADAS can prevent accidents and reduce the risk of injury to vehicle occupants and vulnerable road users. To fulfil this requirement, the sensors must be highly robust and operate in real time while also being able to cope with adverse weather and lighting conditions. As a result, multi-sensor fusion solutions based on Camera, LiDAR and Radar are widely used in higher-level automation driving for a powerful interpretation of a vehicle’s surroundings [
4,
5,
6].
According to road traffic accident severity analysis [
3,
7,
8], late-night and adverse weather accidents are more fatal than other traffic accident factors. Driving at night under low illumination conditions and rainfall proved to be the most important, leading to the highest number of accidents, fatalities and injuries. In the state of the art, some studies have outlined the impact of the aforementioned environmental factors on sensor performance [
9,
10,
11]. For example, for illumination conditions, LiDAR and Radar are active sensors which are not dependent on sunlight for perception and measurements as summarized in [
9]. In contrast, the Camera is a passive sensor affected by illumination, which brings up the problem of image saturation [
12]. The Camera is mainly responsible for traffic lane detection, which is formed by the difference in grey values between the road surface and lane boundary points. Namely, the value of the grayscale gradient varies according to the illumination intensity [
13]. The study of [
14] demonstrated that artificial illumination is a factor in detection accuracy. Meanwhile, object detection used in ADAS is also sensitive to illumination [
15]. Therefore, it is important to build a system with multiple systems without depending on a single sensor.
Unlike the effects produced by illumination, which only have a greater influence on the Camera. the negative effects of rainfall must be taken into account in all vehicle sensors. Rainfall is a frequent adverse condition and it is necessary to consider the impact on all sensors. In [
16], raindrops on the lens can cause noise in the captured image, resulting in poor object recognition performance. Although the wipers eliminate raindrops to ensure Camera perception performance, the sight distance values vary with the intensity of the rainfall to the extent that the ADAS function is suspended [
17]. Furthermore, in other studies and analysis results on the influence of rainfall on the LiDAR used in ADAS, all sensors demonstrate sensitivity to rain. At different rainfall intensities, the laser power and number of point clouds decrease, resulting in reduced object recognition as the LiDAR perception is dependent on the received point cloud data [
18,
19]. This effect is mostly caused by water absorption in the near-infrared spectral band. Some experimental pieces of evidence indicate that rainfall reduces the relative intensity of the point cloud [
10]. Although Radar is more environmentally tolerant than LiDAR, it is subject to radio attenuation due to rainfall [
20]. Compared to normal conditions, the simulation results show that the detection range drops to 45% under heavy rainfall of 150 mm/h [
21]. A similar phenomenon is confirmed in the study of [
22]. A humid environment can cause a water film to form on the covering radome, which can affect the propagation of electromagnetic waves at microwave frequencies and lead to considerable loss [
23]. Meanwhile, the second major cause of Radar signal attenuation is the interaction of electromagnetic waves with rain in the propagation medium. Several studies have obtained quantitative data demonstrating that precipitation generally affects electromagnetic wave propagation at millimetre wave frequencies [
24,
25]. Therefore, the negative impact of rainfall directly affects the recognition capability of the perception system, which results in the ADAS function being downgraded or disabled.
No sensor is perfect in harsh environmental conditions. There are already several scientific studies showing the experimental results of the sensors in different environments and giving quantitative data. However, in most cases, these experiments are carried out at static or indoor conditions [
10,
11,
19,
26,
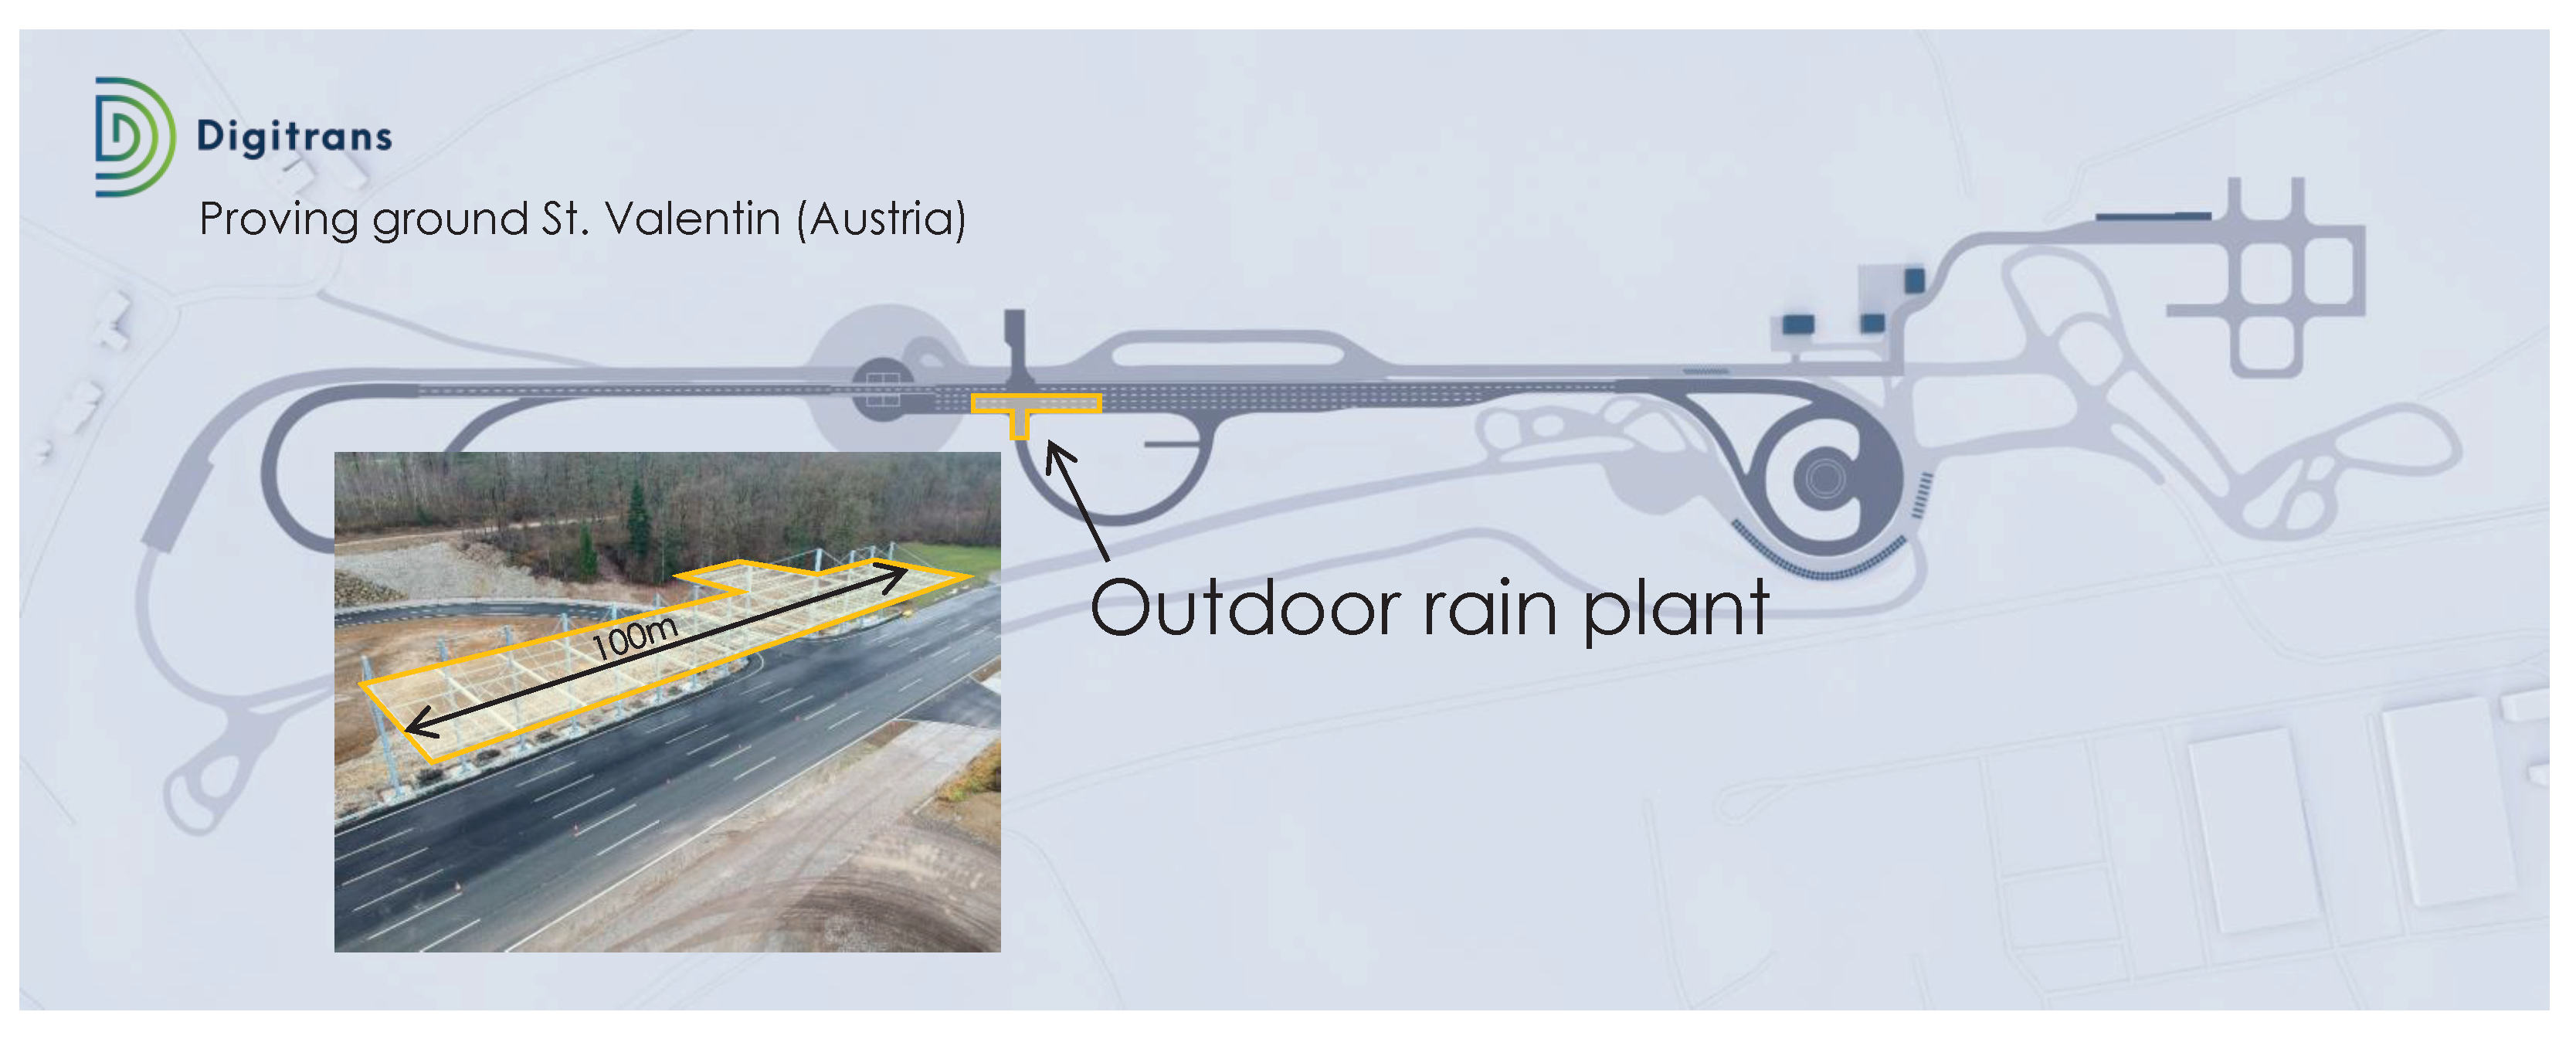
27], which makes it difficult to comprehensively evaluate the performance of the sensor based on these laboratory data alone. This is because for the actual road traffic environment, vehicles equipped with sensors drive dynamically and ADAS is also required to cope with various environmental factors at different speed conditions. To compensate for the limitations of the current implementation, in this study, we design a series of dynamic test cases under different illumination and rainfall conditions. In addition, we consider replicating more day-to-day traffic scenarios, such as cutting in, following and overtaking, rather than a single longitudinal test. The study statistically measures sensor detection data collected from a proving ground for autonomous driving. Thus, a more comprehensive and realistic comparison of experimental data from different sensors in adverse environments can be conducted and we discuss the main barriers to the development of ADAS.
The outline of the subsequent sections of this paper is as follows: The proving ground and test facilities are introduced in
Section 2.
Section 3 presents the methodology for test case implementation.
Section 4 demonstrates the statistics from real sensor measurement and evaluation for main automotive sensors. Limitations of sensors for ADAS are discussed in
Section 5. Finally, a conclusion is provided in
Section 6.
4. Results and Evaluation
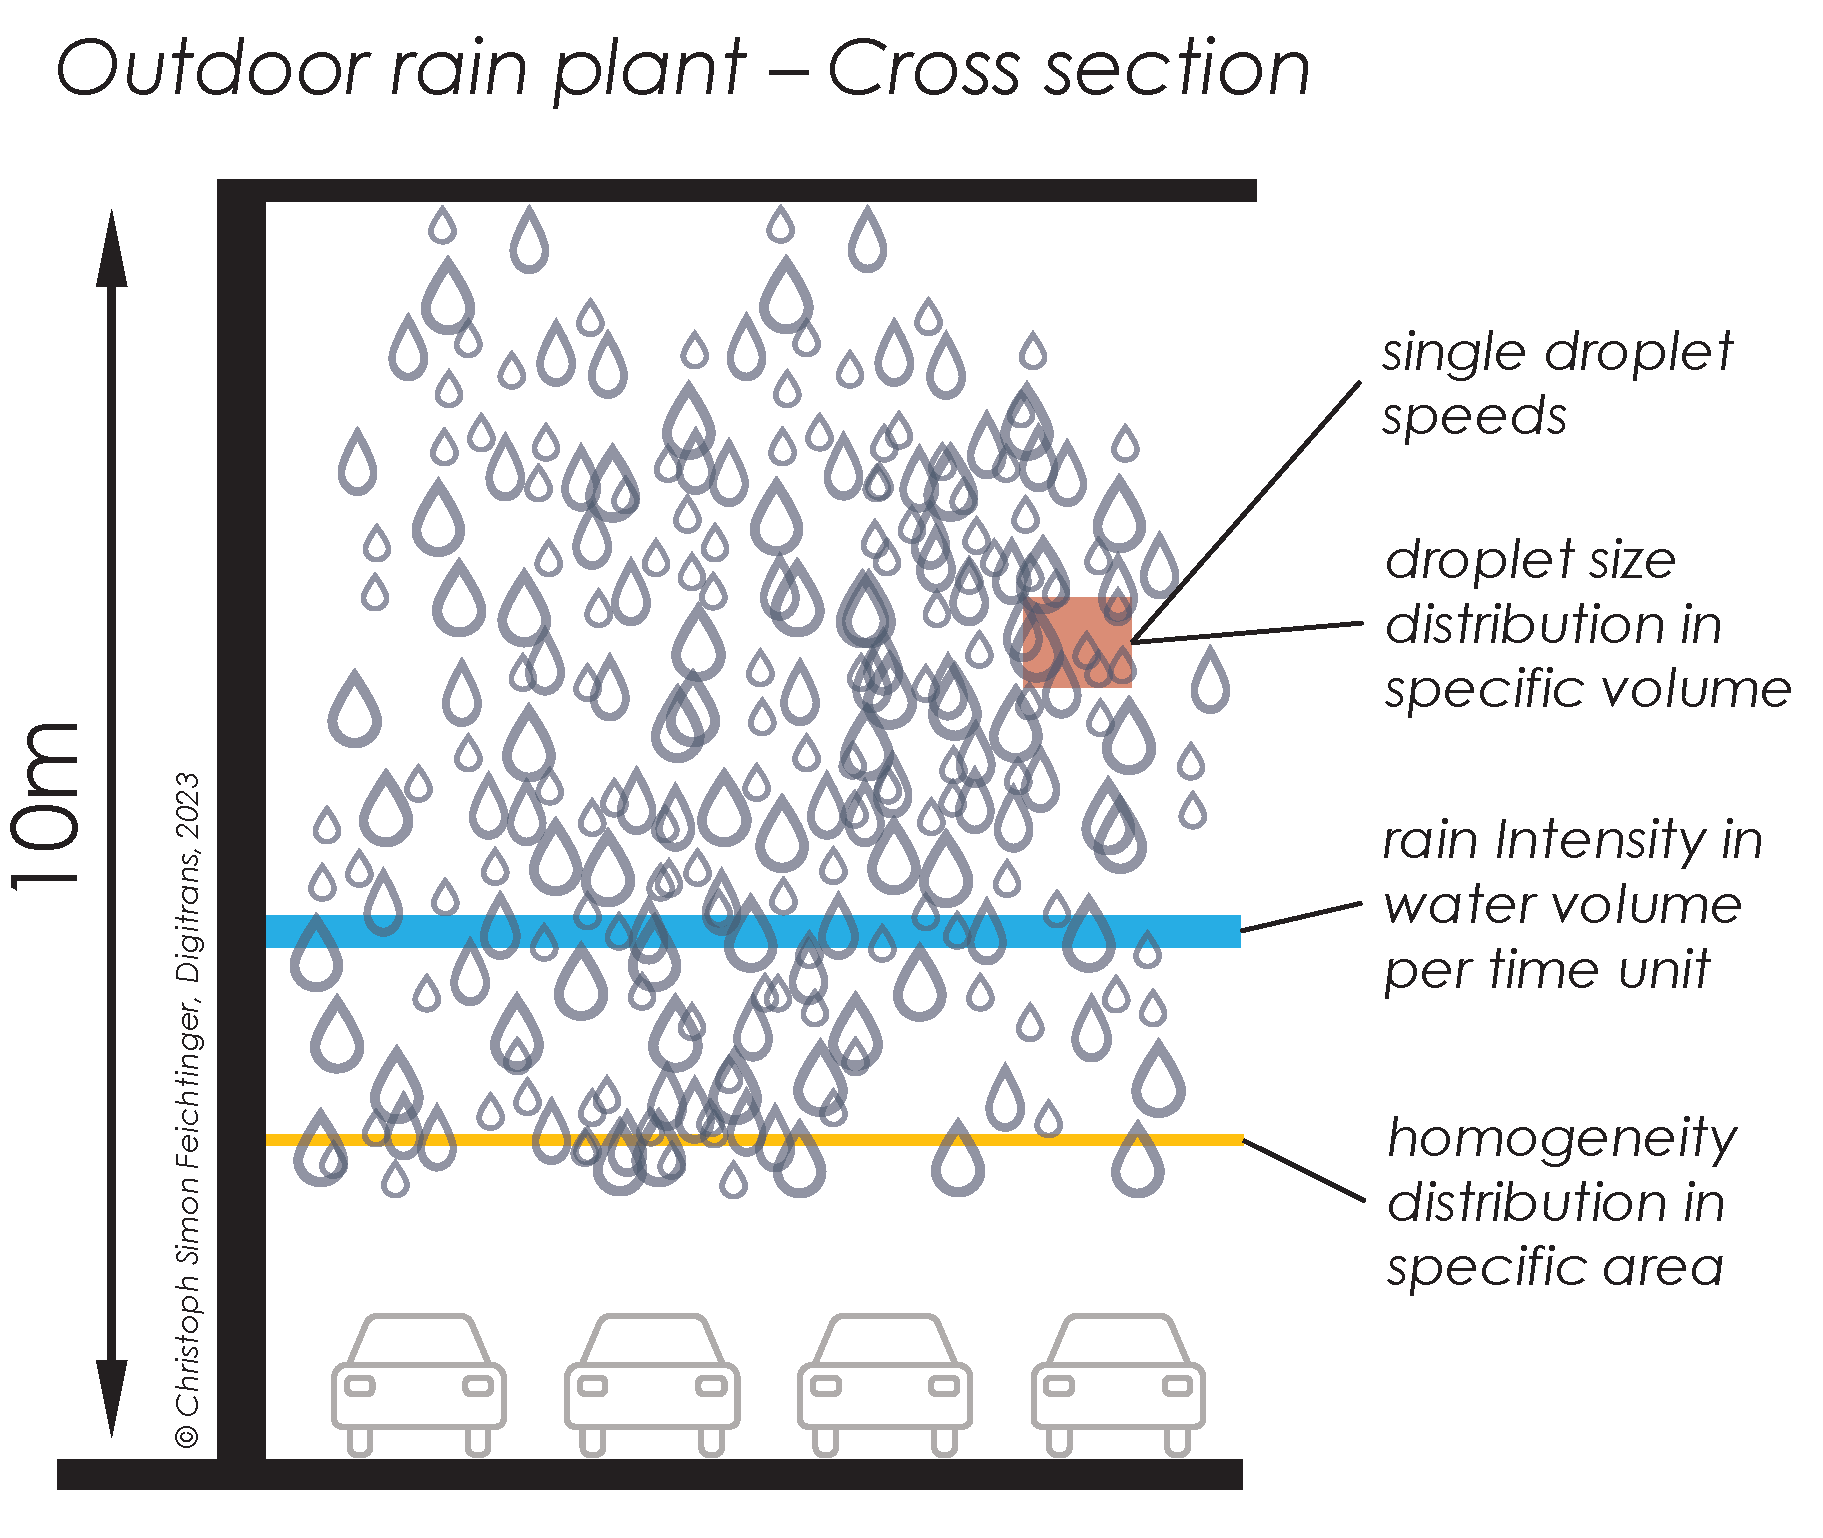
After a series of post-processing work episodes, we collected 278 valid measurement cases, each sensor containing more than 80,000 detection data, which provided the statistics from real sensor measurement and evaluation for main automotive sensors. In this section, we demonstrate the quantitative analysis for each sensor to show the detection performance. Since the distance of the rain simulator is only 80 m, the collected data are filtered based on GPS location information to ensure that all test results are produced within the coverage area of the rain simulator. For rainfall simulation, we split measurement into moderate and heavy rain conditions with intensities of 25 mm/h and 100 mm/h, respectively. Meanwhile, the artificial illumination condition is also considered in our test. Additionally, we also discuss the influence of detection distance on the results. However, due to the rain simulator’s length limitation, environmental factors’ effect on sensor detection is not considered for this part of the presentation of the results. As introduced in
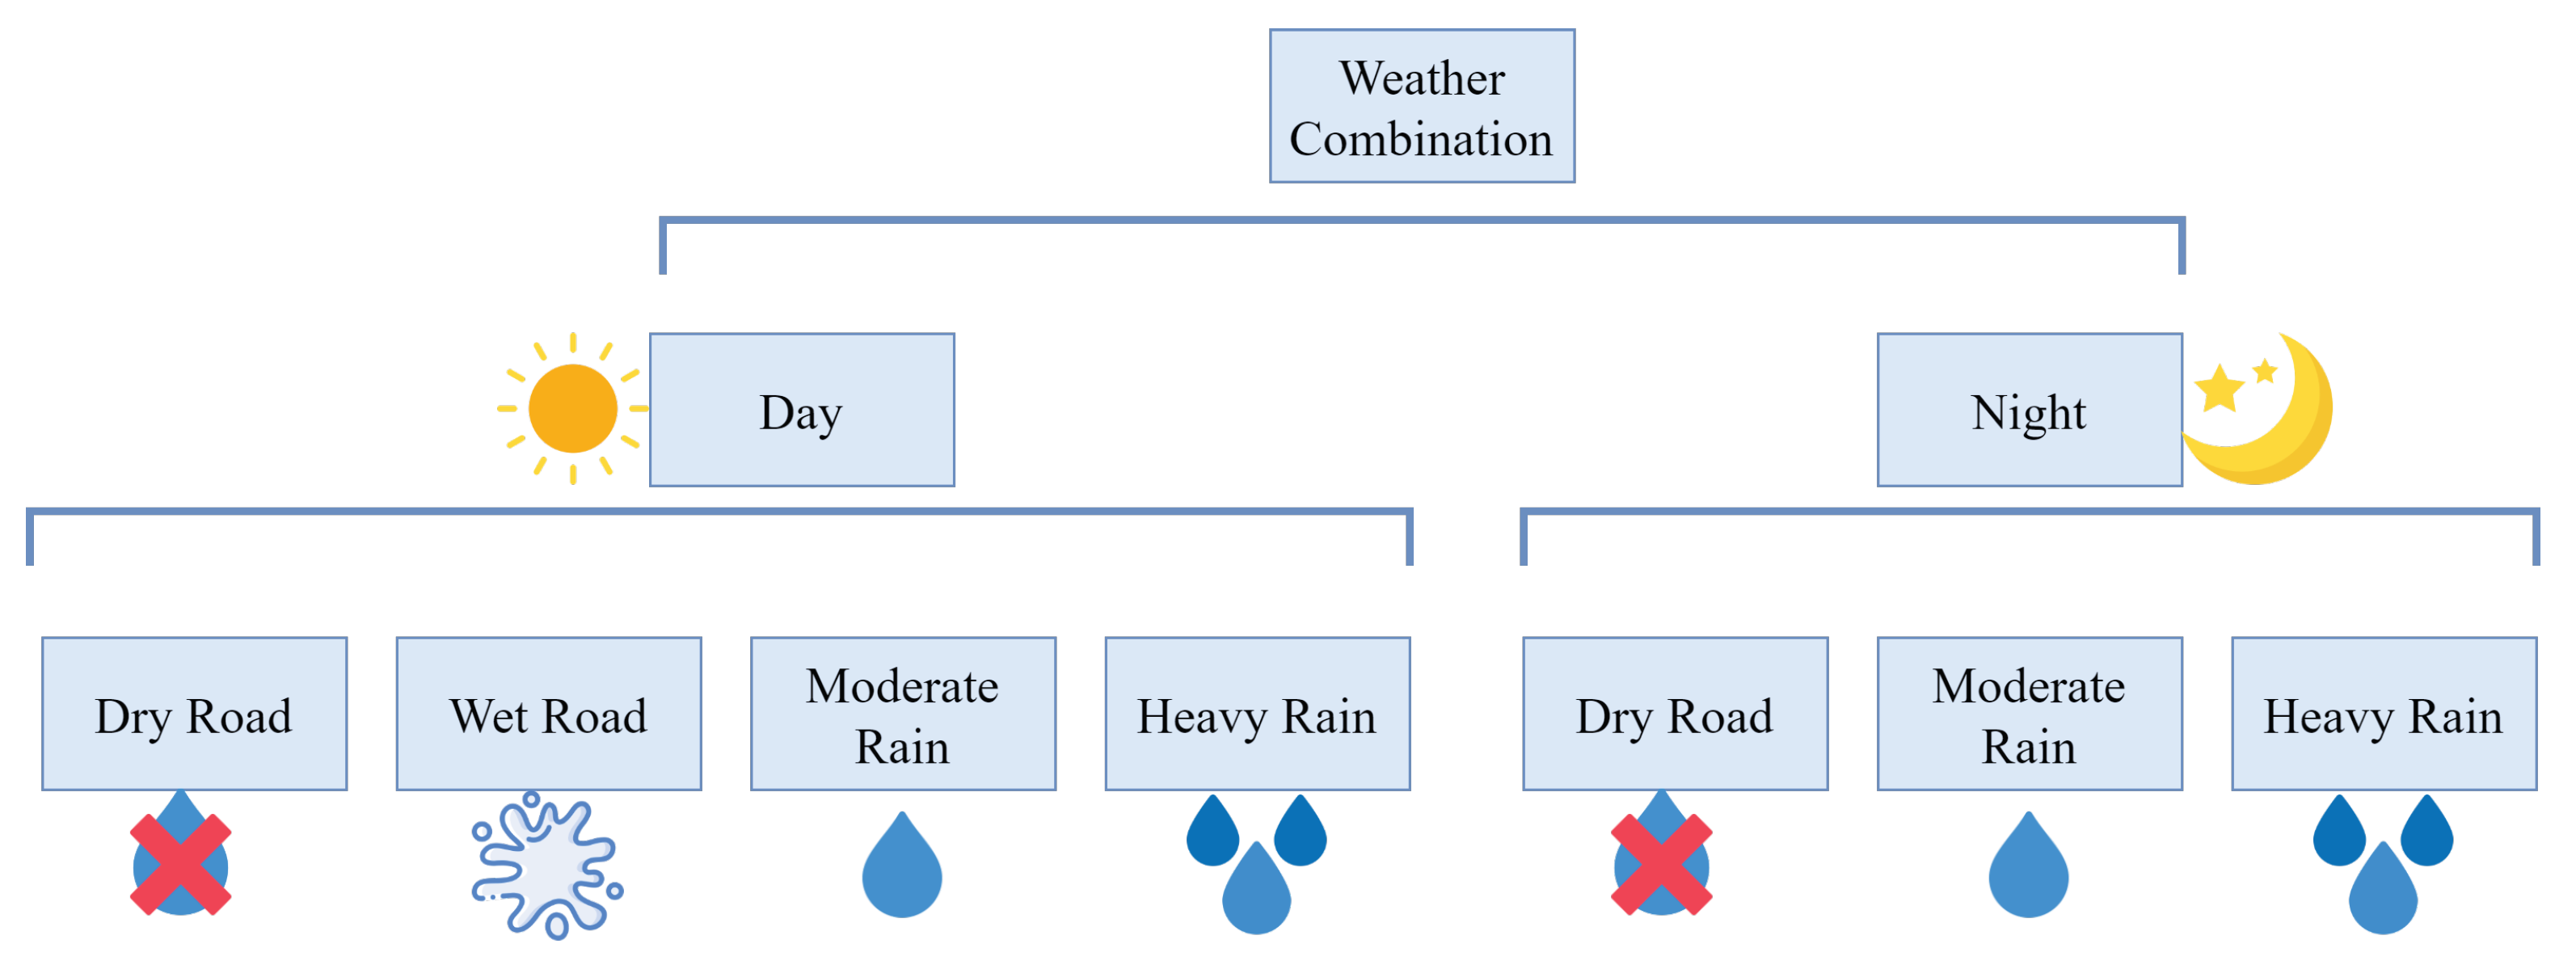
Section 3, the test scenarios have been divided into two parts: daytime and nighttime. The daytime tests are further divided into dry and wet road conditions, as well as moderate and heavy rainfall conditions, which will be simulated using a rain simulator. For the nighttime test, the focus is only on dry road conditions and moderate rainfall, given the test conditions. This approach thoroughly evaluates the systems’ performance under different weather and lighting conditions.
According to the guide to the expression of uncertainty in measurement [
36], the detection error can be defined in Equation (
1), where
can be regarded as the sensor measurement output and the ground truth is labelled
. In addition, the measurement error is denoted as
. After obtaining a series of detection errors for the corresponding sensors, we quantify the Interquartile Range (IQR) of the boxplot and the number of outliers to indicate the detection capability of the sensor.
In this study, our sole focus is on different sensors’ performance of lateral distance detection. This is because autonomous vehicles rely on sensors to detect and respond to their surroundings and lateral distance detection is essential in this process. An accurate lateral detection enables the vehicle to maintain a safe and stable driving path, which is critical to ensuring the safety of passengers and other road users compared to longitudinal detection-related functions. By continuously monitoring the vehicle’s position in relation to its lane and the surrounding vehicles, an autonomous vehicle can make real-time adjustments to its driving path and speed to maintain a safe and stable driving experience. This information is also used by the vehicle’s control systems to make decisions about lane changes, merging and navigating curves and intersections. A typical example is used in Baidu Apollo, the world’s largest autonomous driving platform, providing trajectory planning via EM planner [
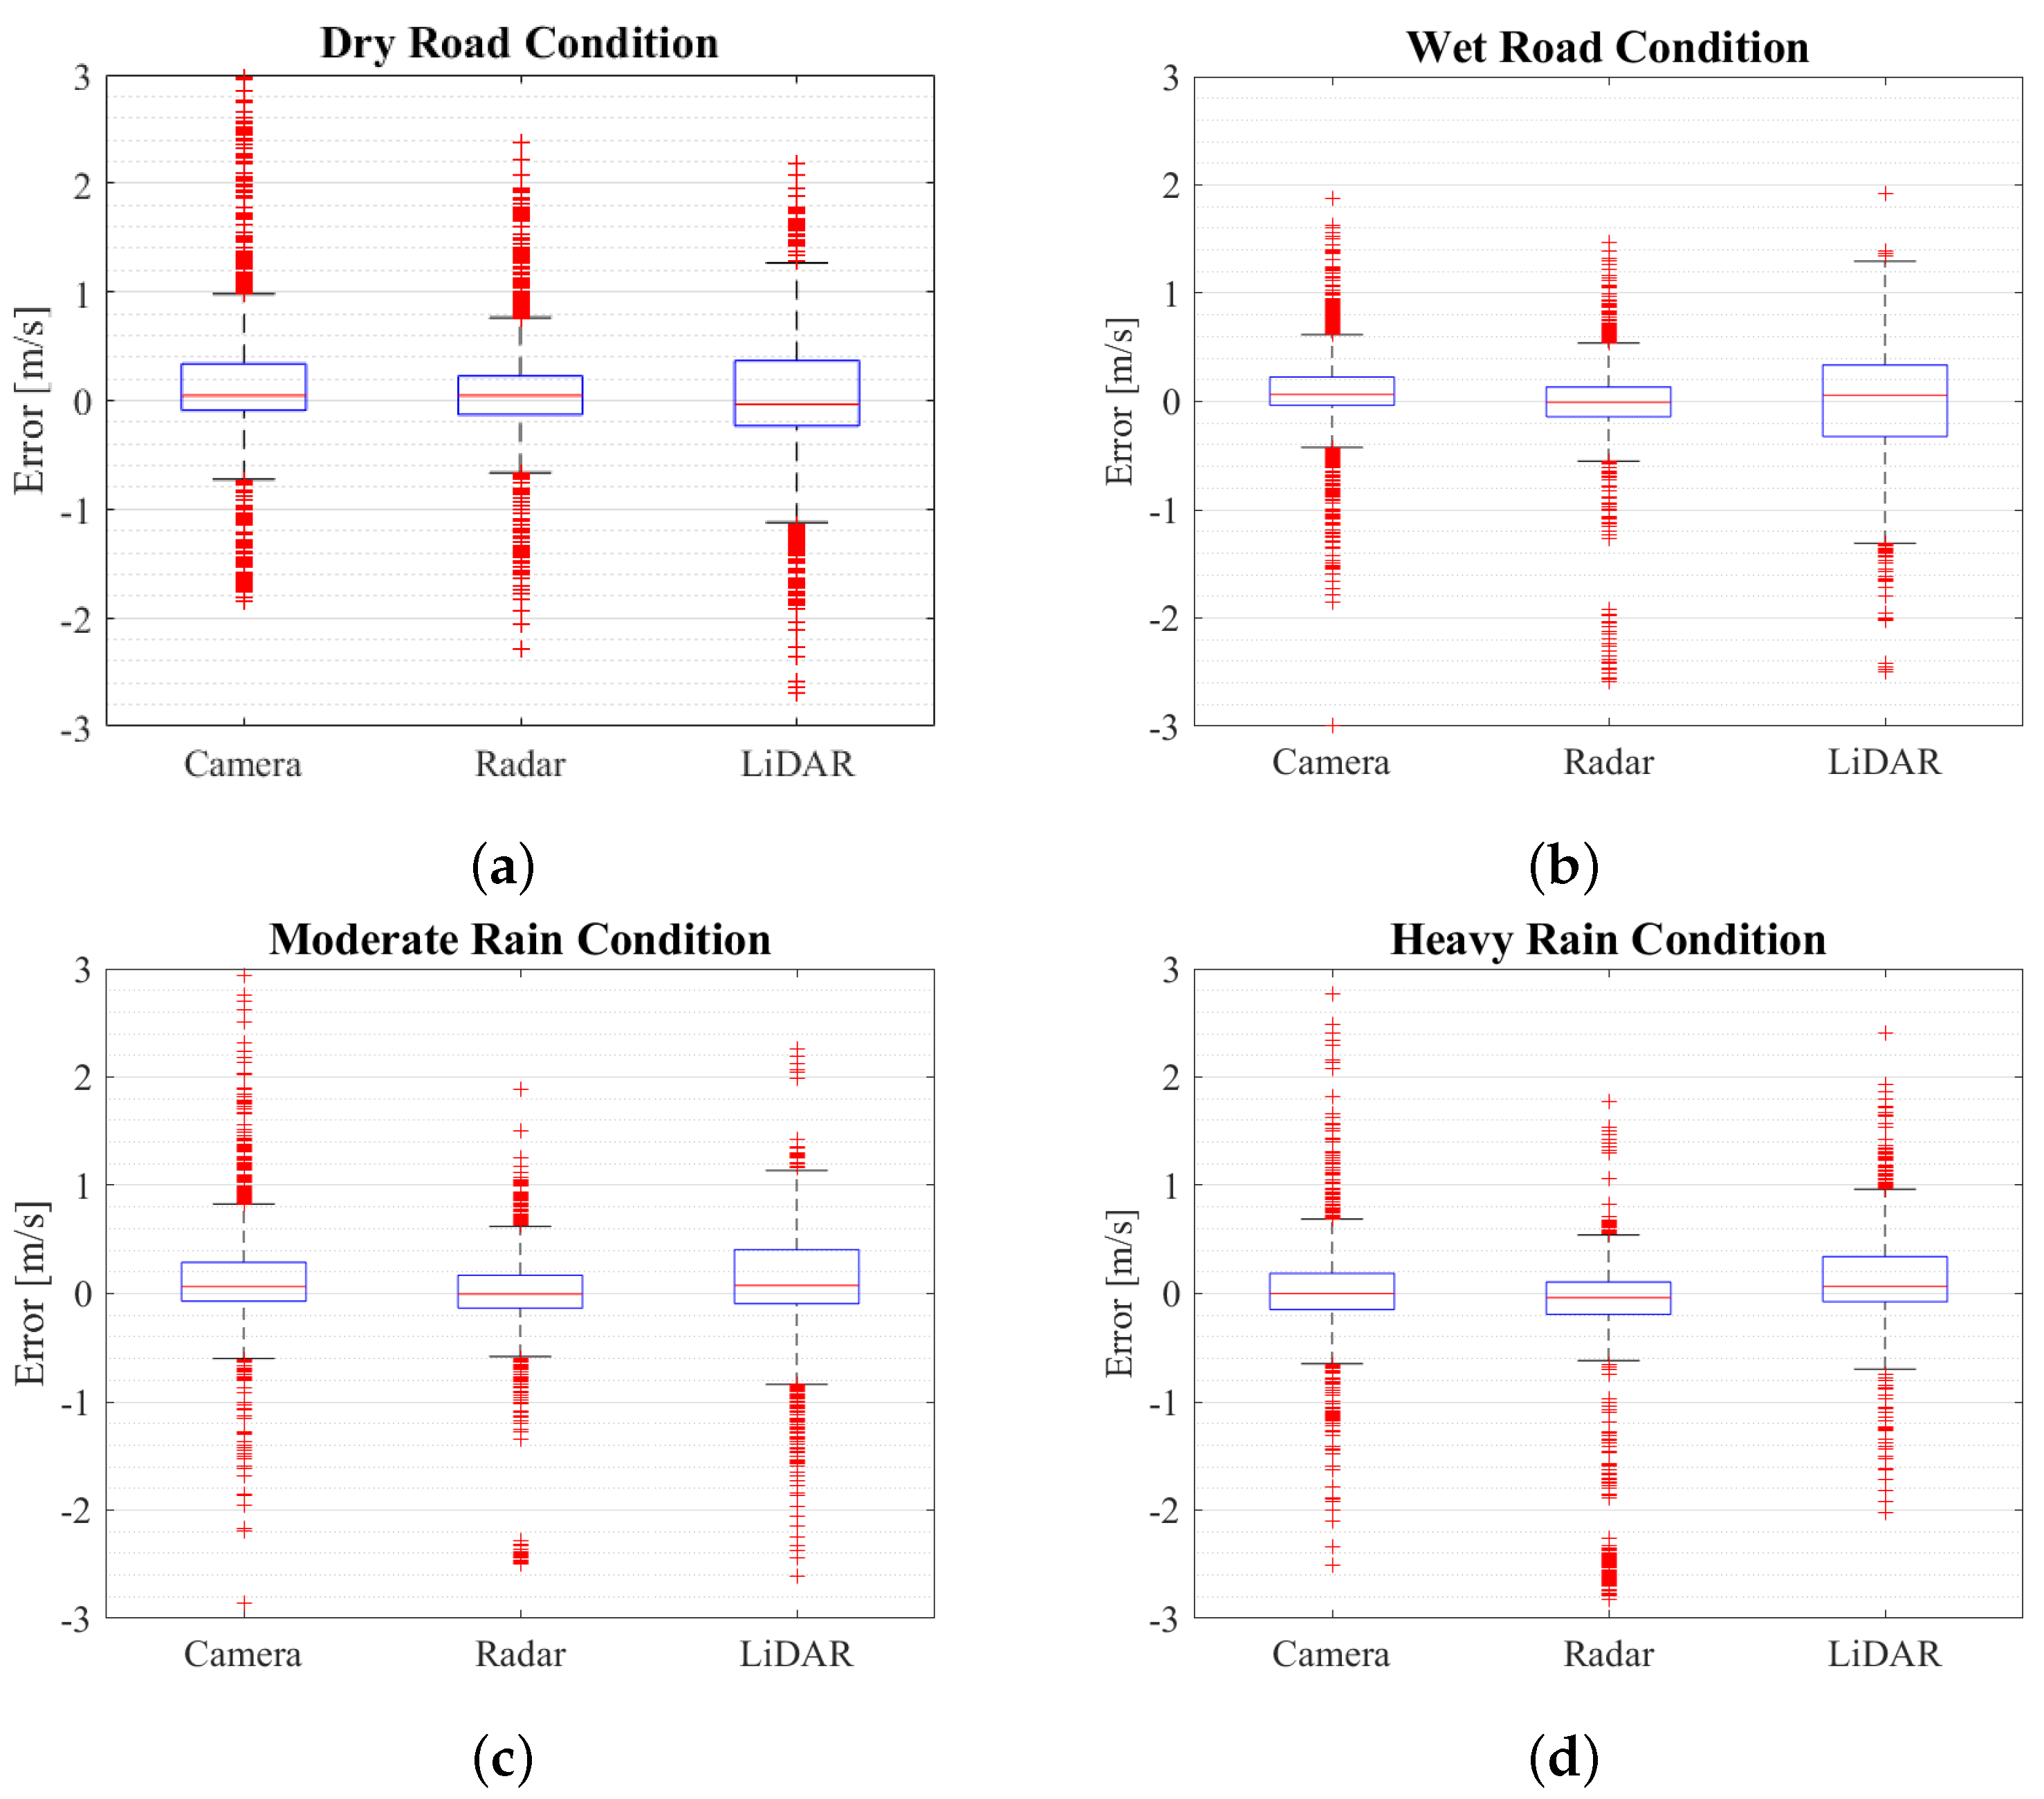
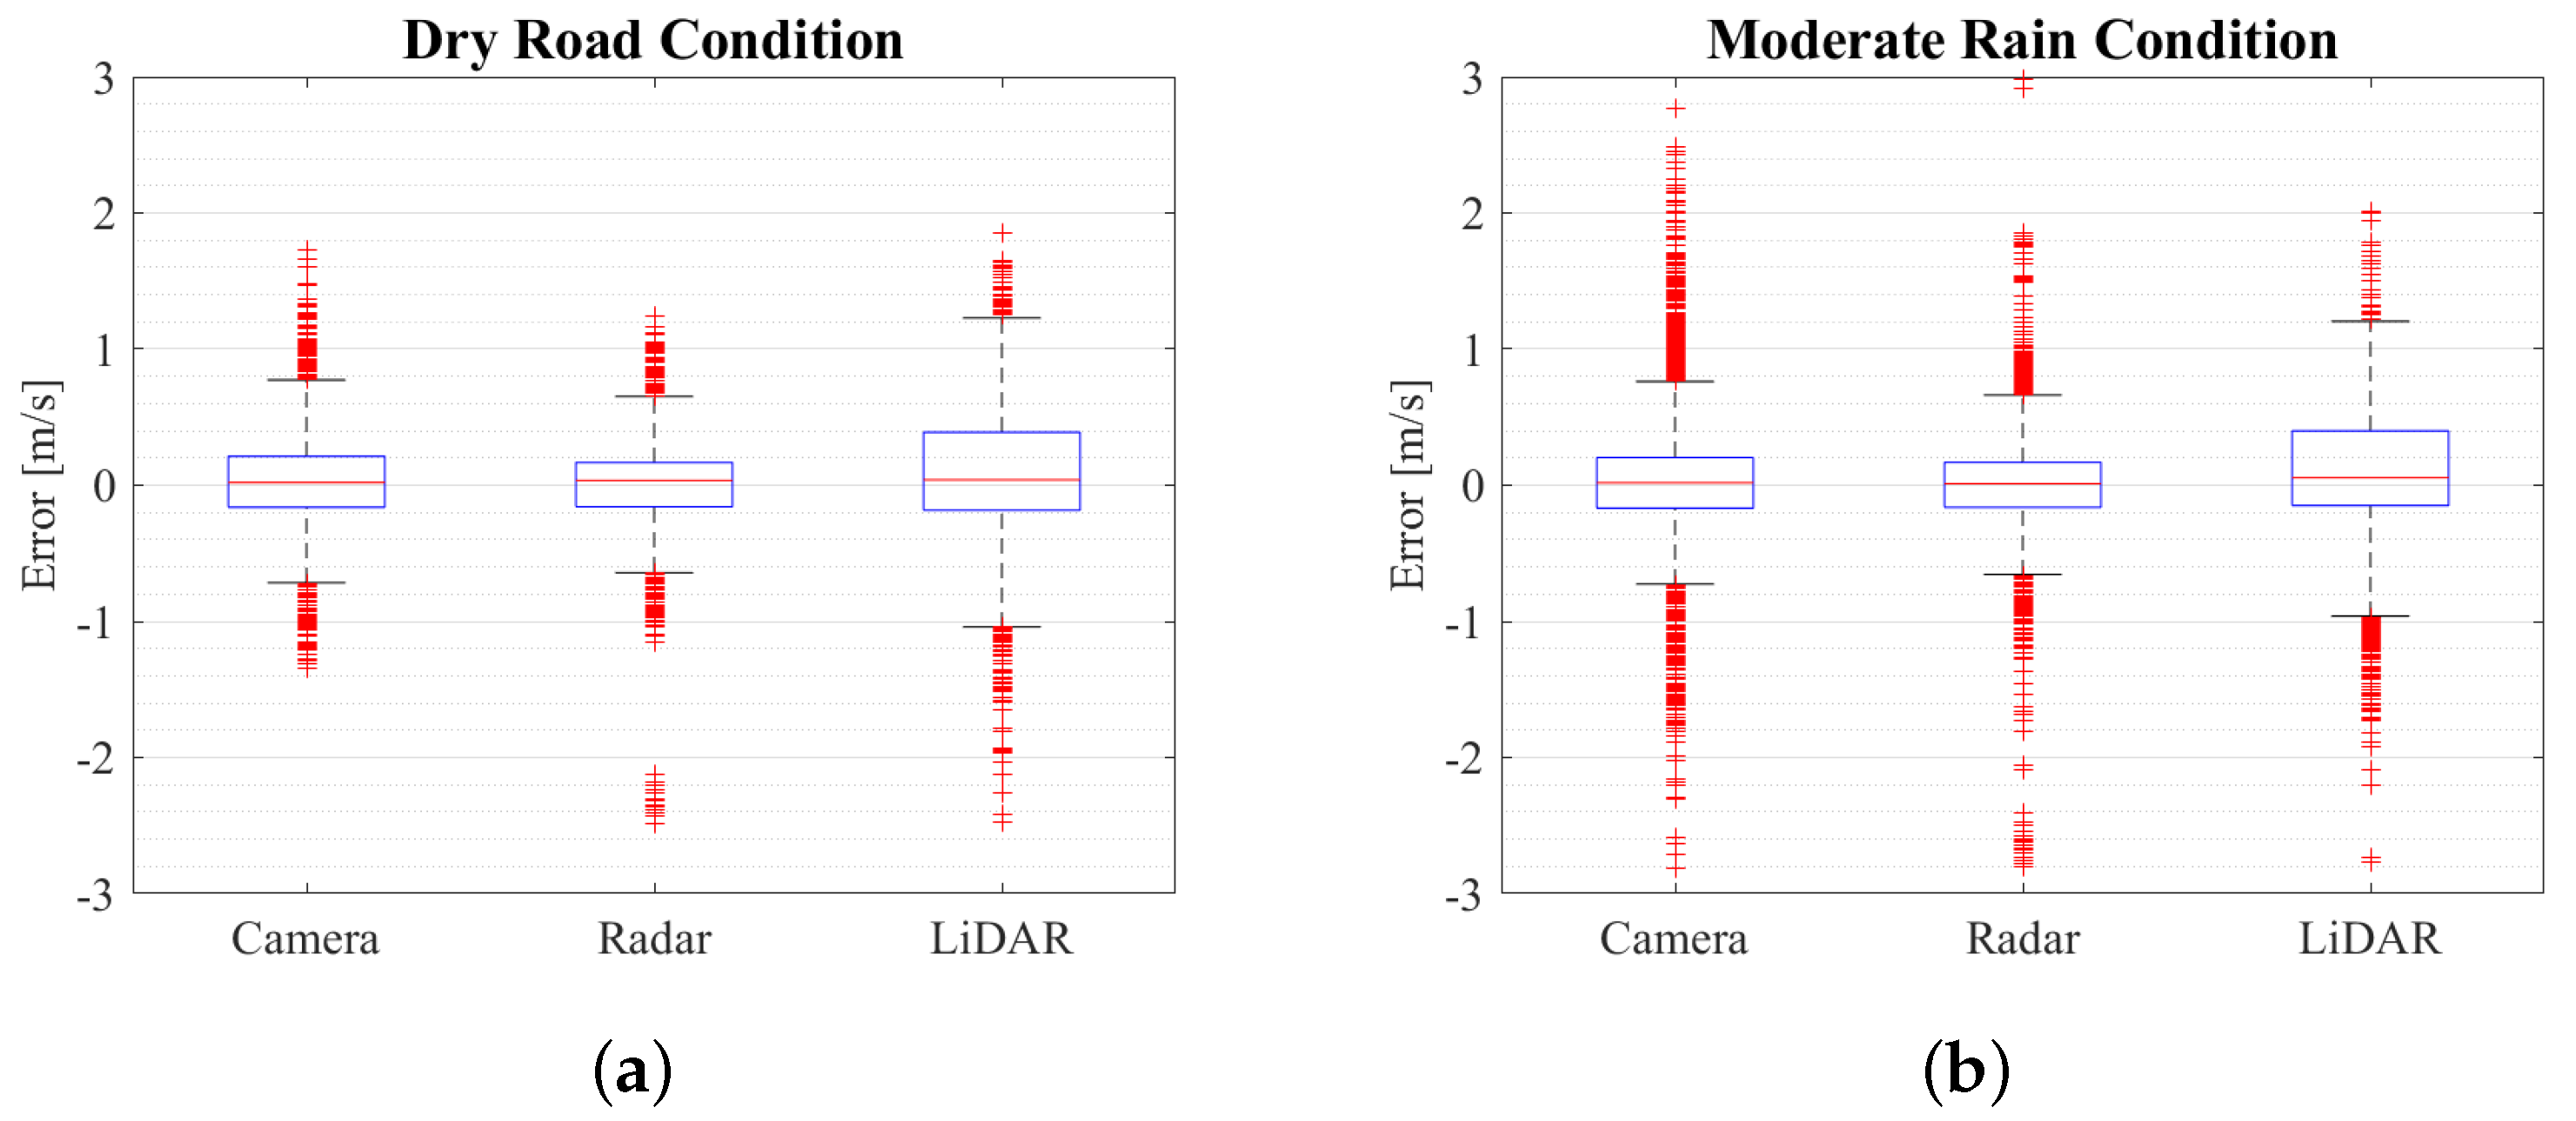
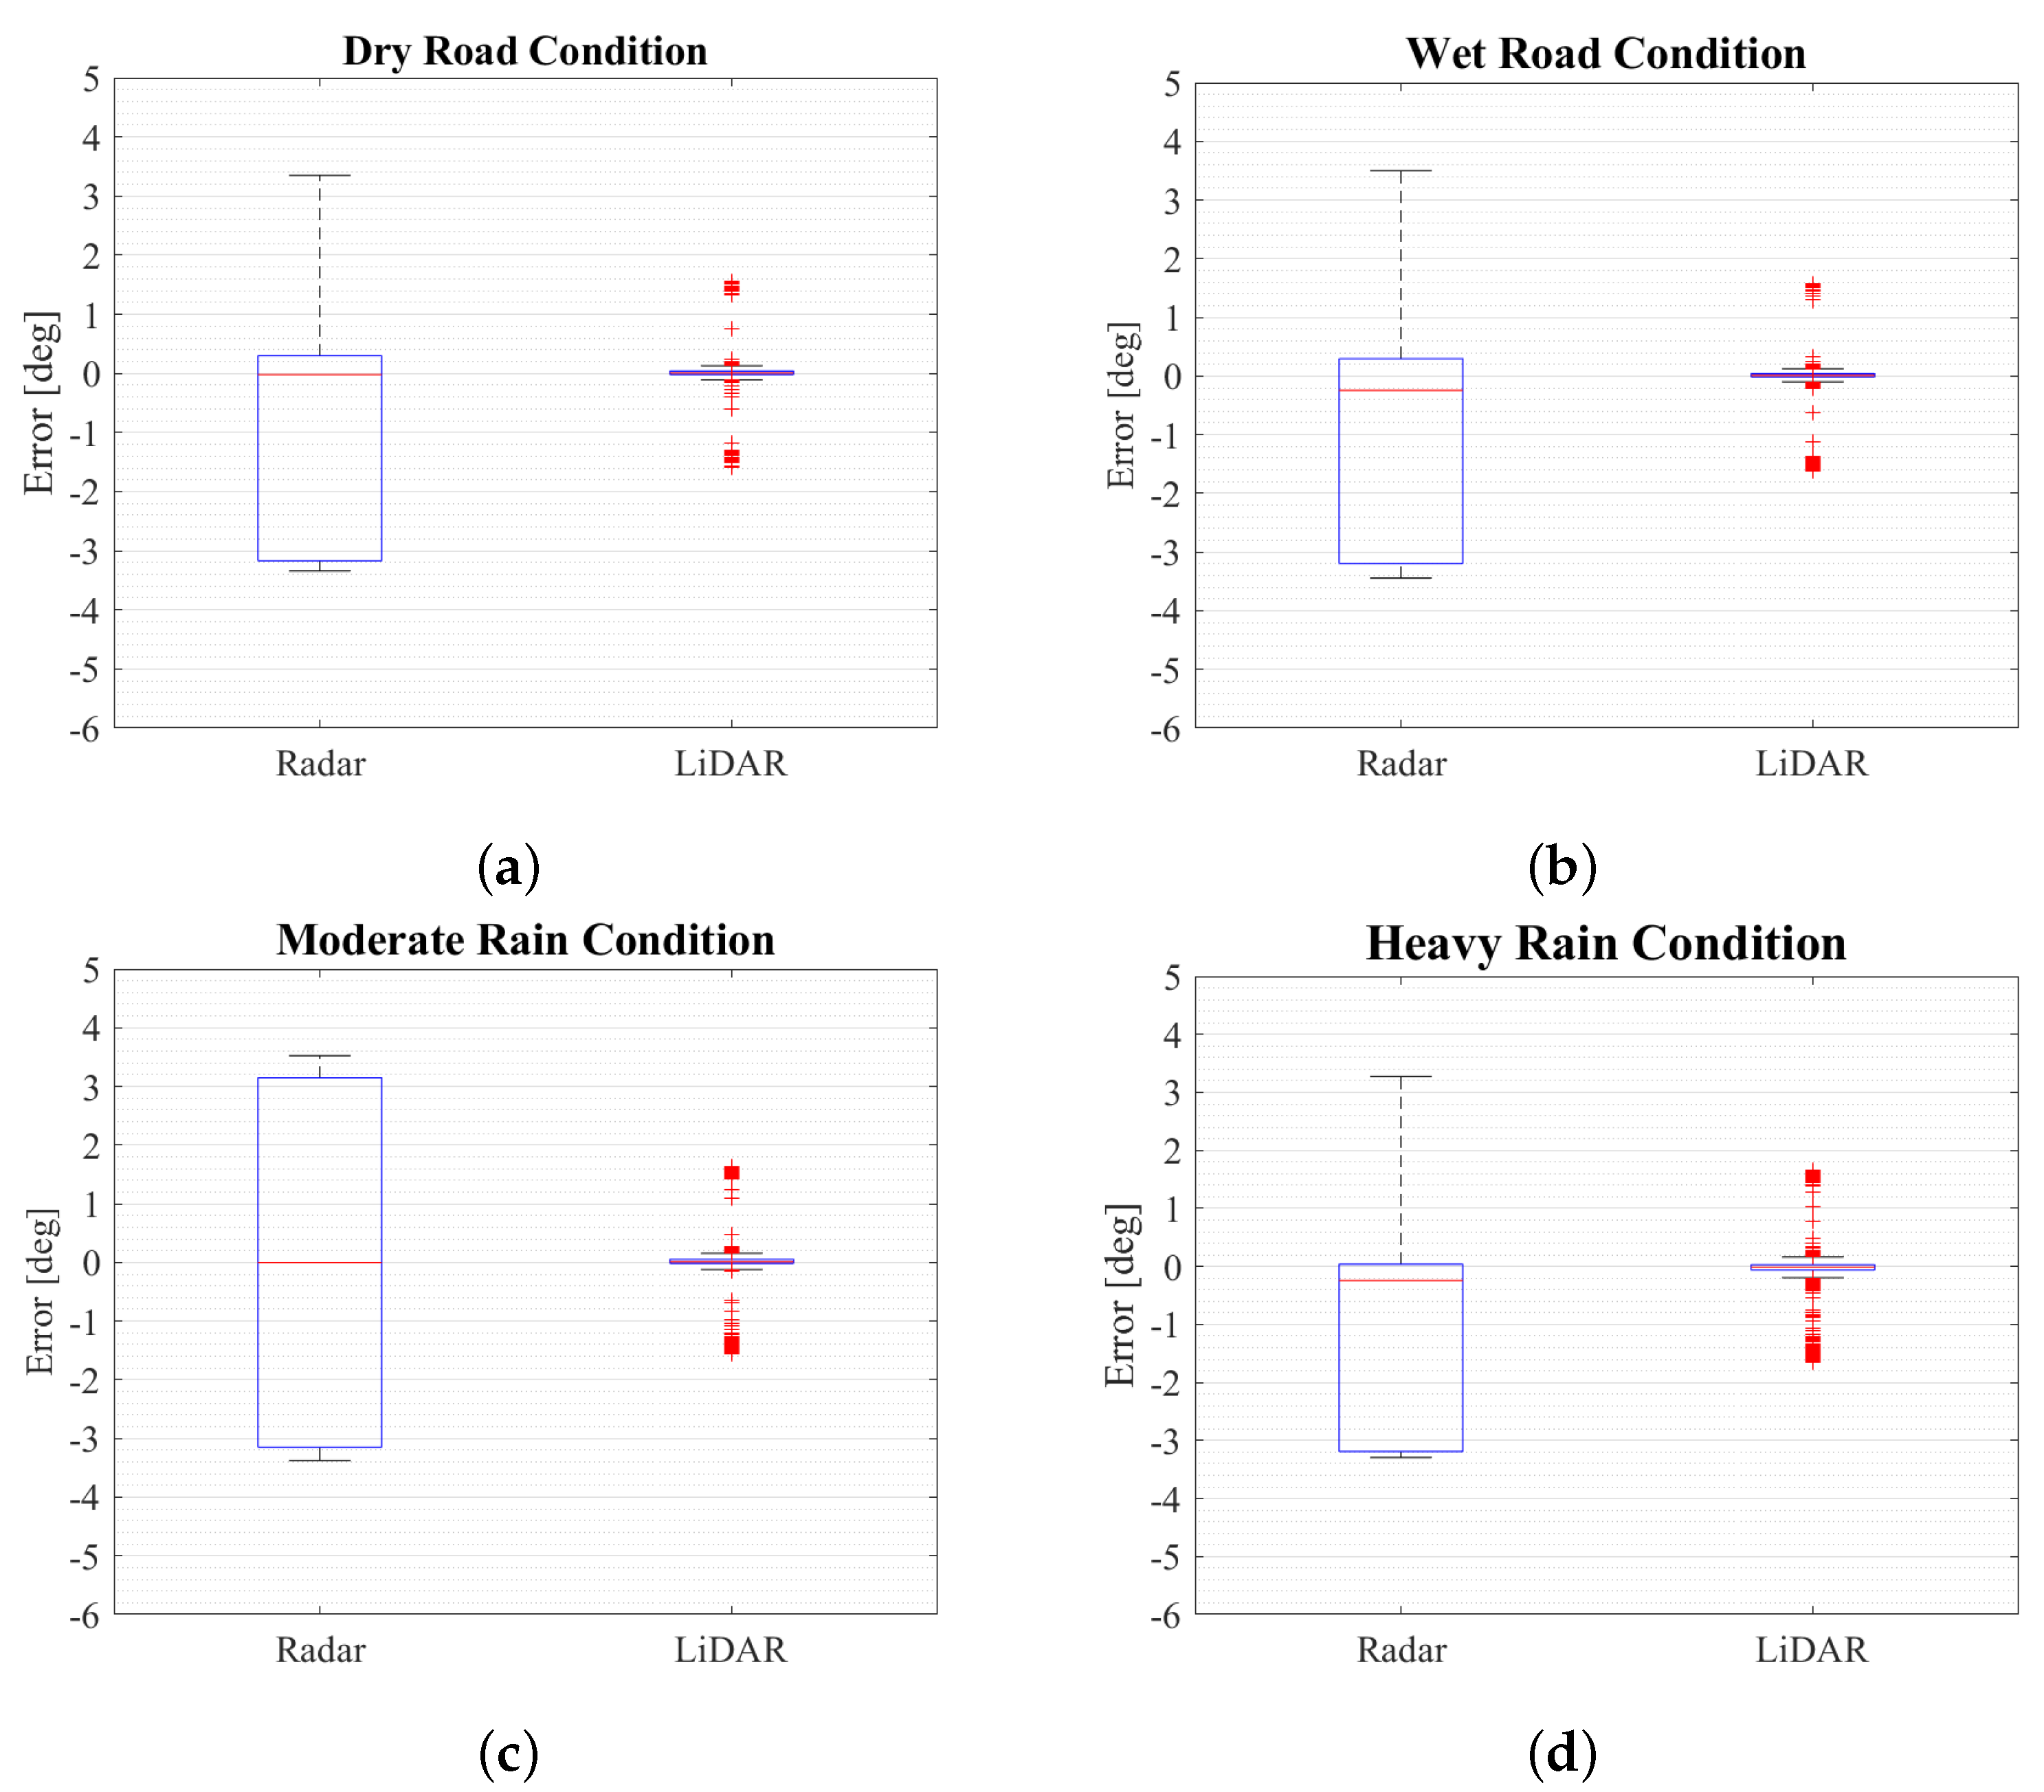
37]. Therefore, the results of other outputs from sensors are presented in
Appendix A, while the focus of the following sections is solely on the performance of the sensor for lateral distance detection.
4.1. Camera
Cameras are currently widely utilized in the field of automotive safety. Hasirlioglu et al. [
10] have demonstrated through a series of experiments that intense rainfall causes a loss of information between the Camera sensor and the object, which cannot be fully retrieved in real time. Meanwhile, Borkar et al. [
14] have proven the presence of artificial lighting can be a distraction factor which makes lane detection very difficult. In addition, Koschmieder’s model describes visibility as inversely proportional to the extinction coefficient of air, which has been widely used in the last century [
38]. This model can be conveniently defined in [
39] by Equation (
2).
where
x denotes the horizontal and vertical coordinates of the pixel,
denotes the wavelength of visible light,
is the extinction coefficient of the atmosphere and
d is the scene depth. Furthermore,
I and
J denote the scene radiance of the observed and clear images depending on
x and
, respectively. The last item
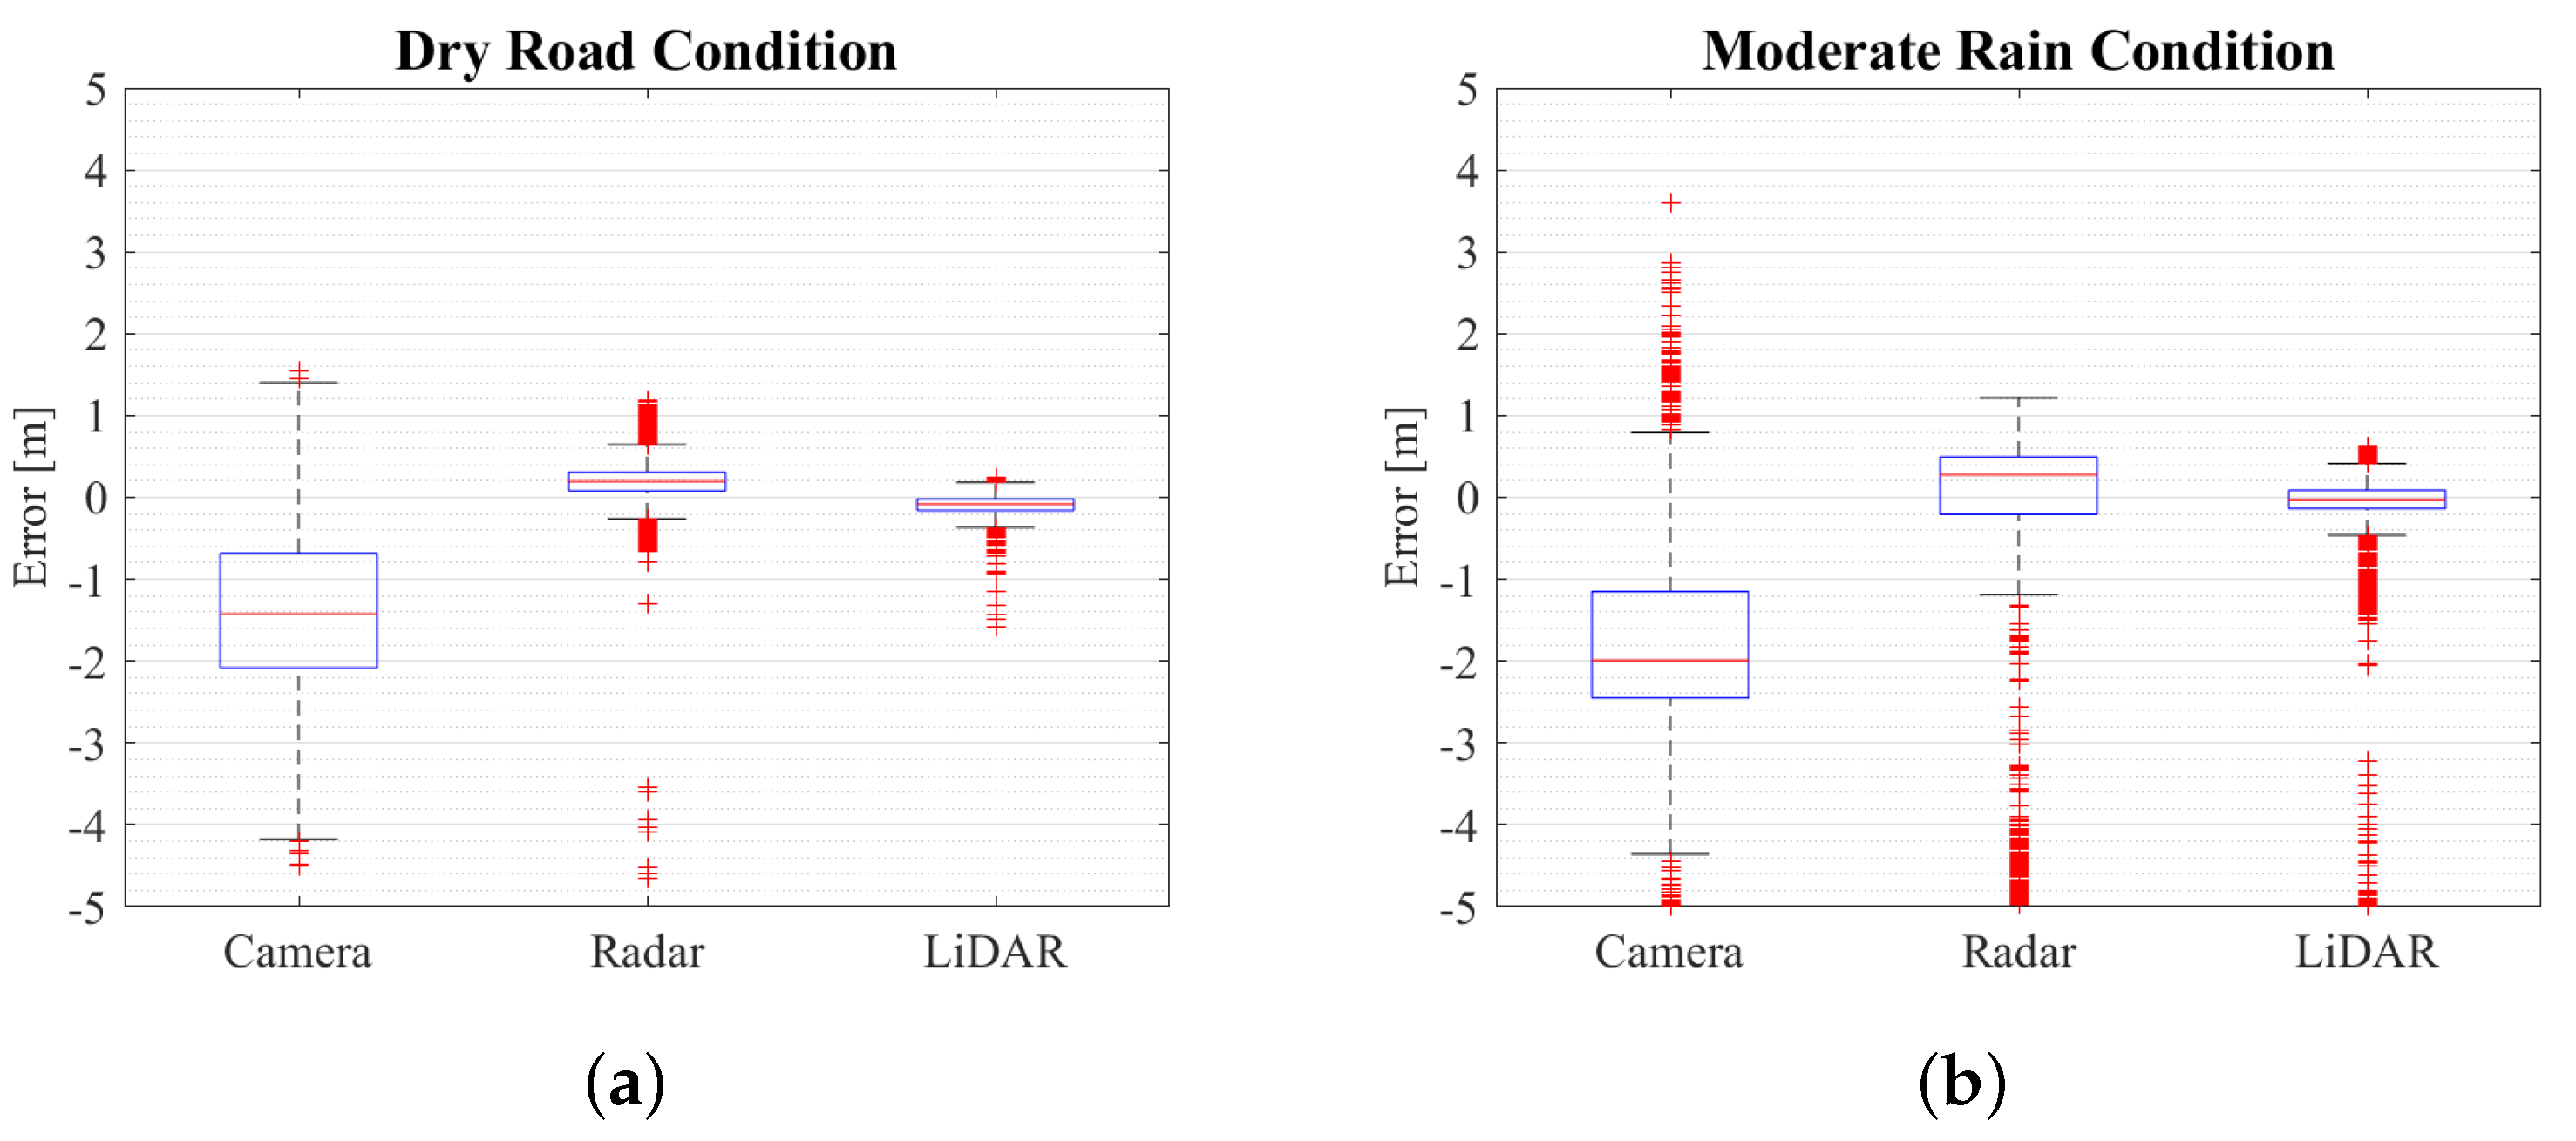
A indicates the lightness of the observed scene. Therefore, by analyzing this equation, once the illumination and the extinction coefficient influence the image observed by the Camera sensor, the estimation of obstacles can lead to detection errors. These test results can be observed in
Figure 5 and
Figure 6, which illustrate the Camera’s lateral detection results.
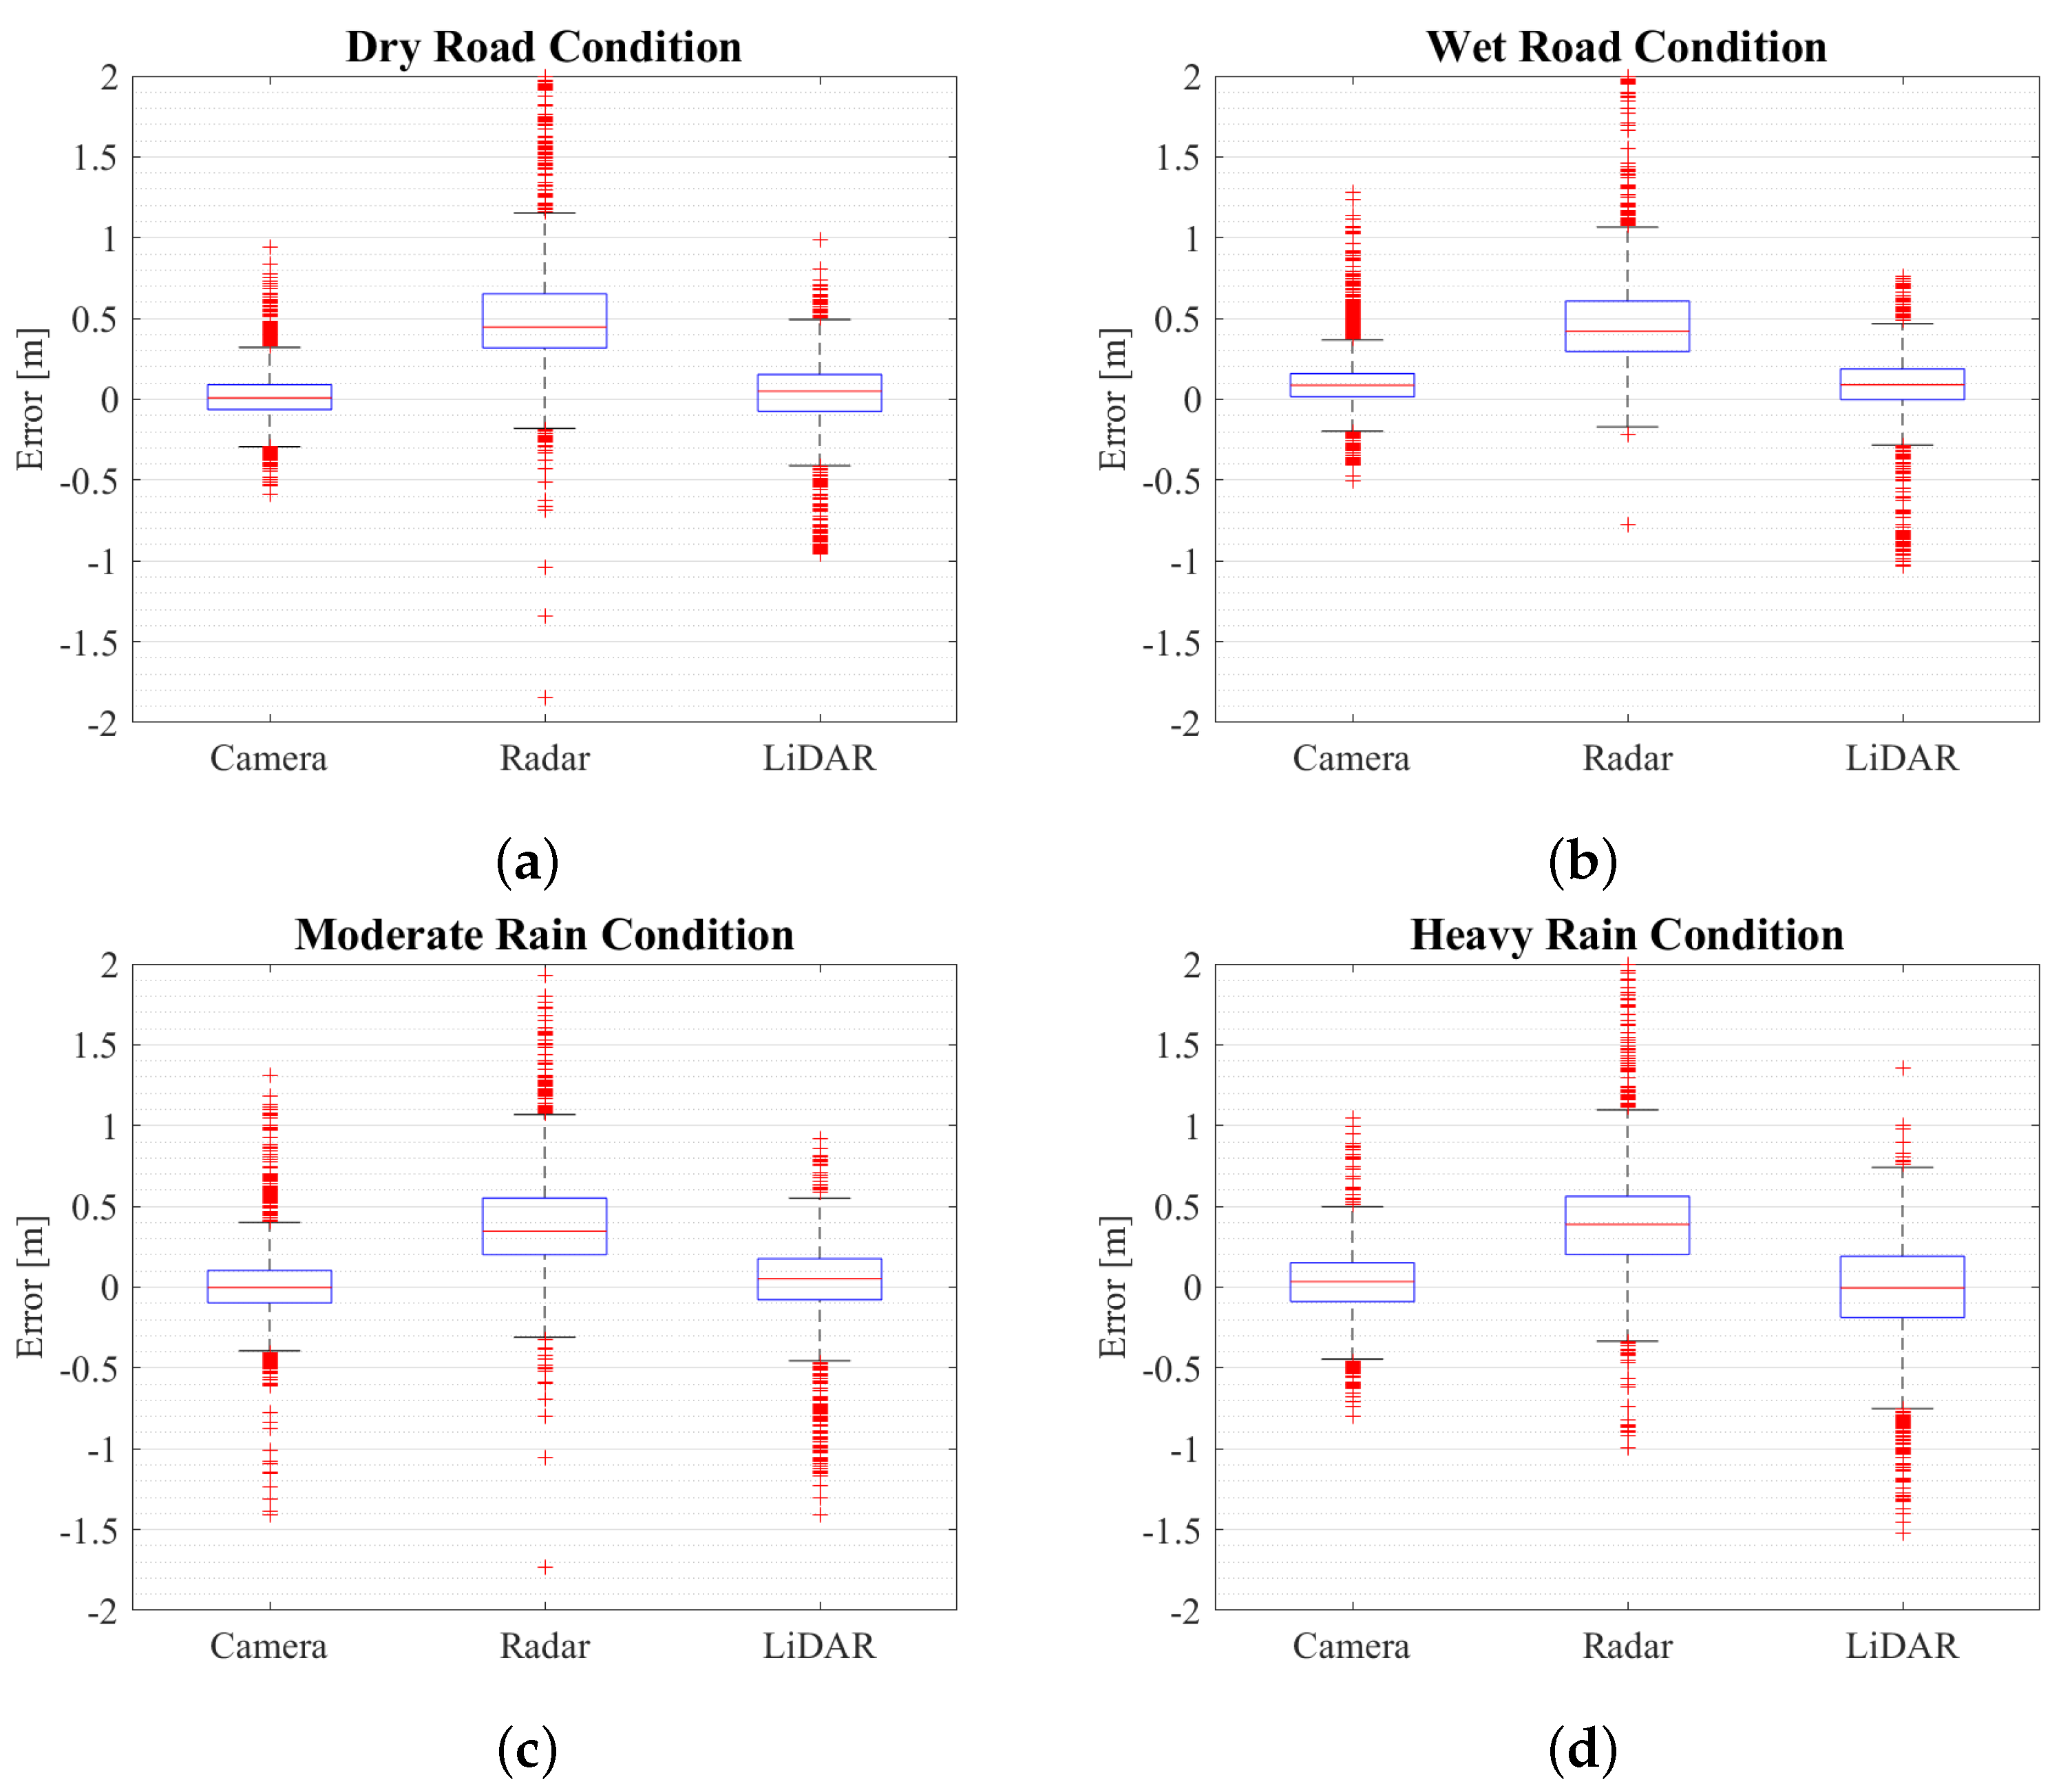
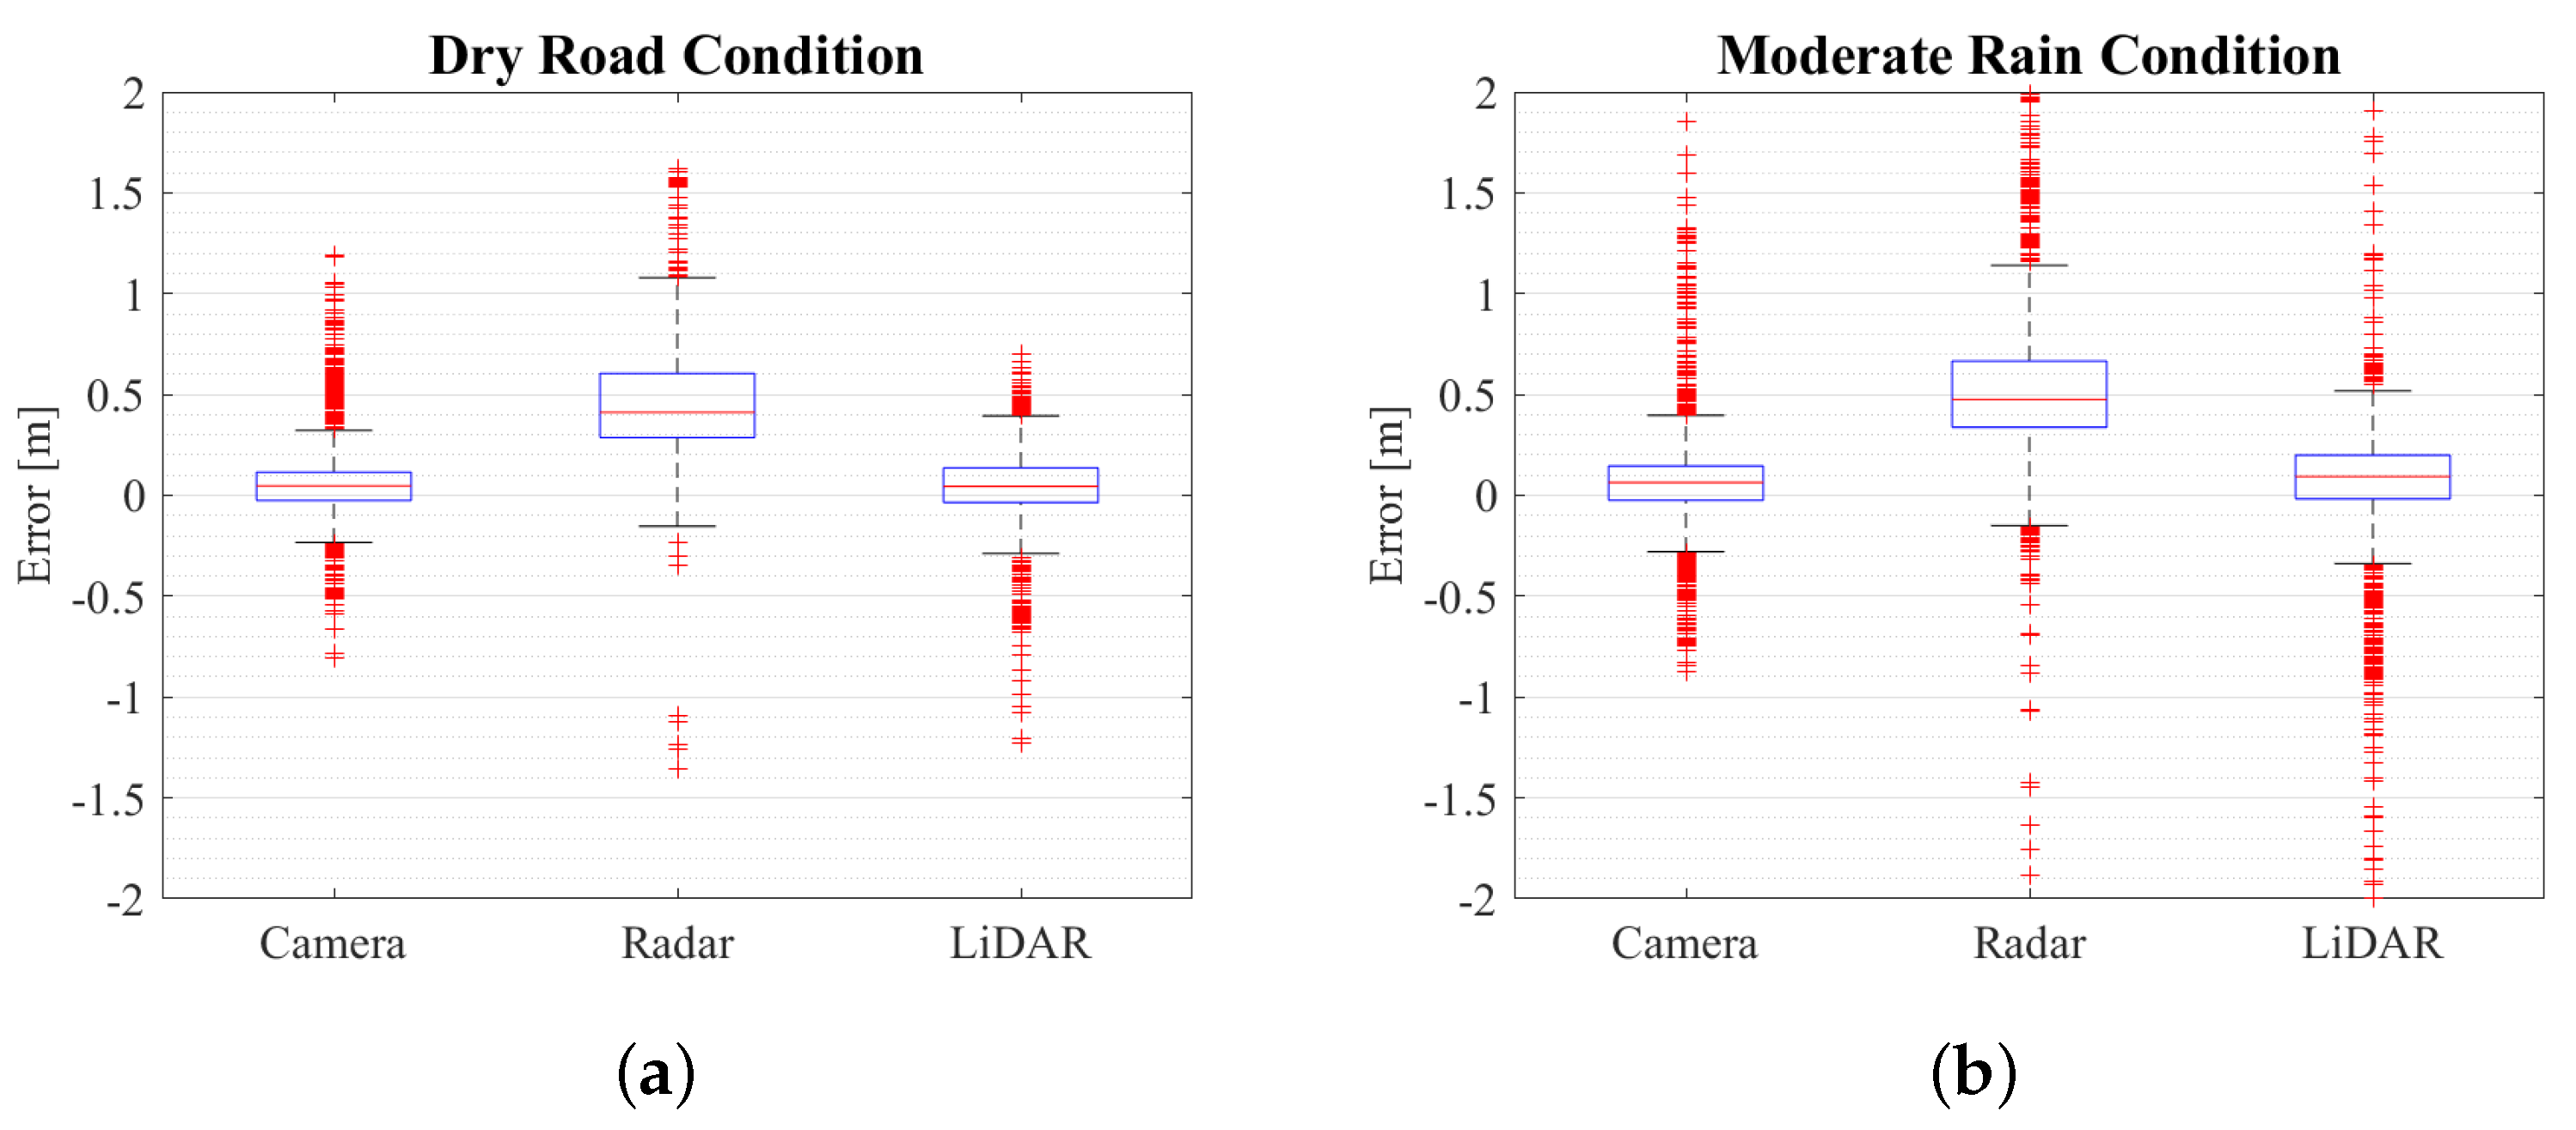
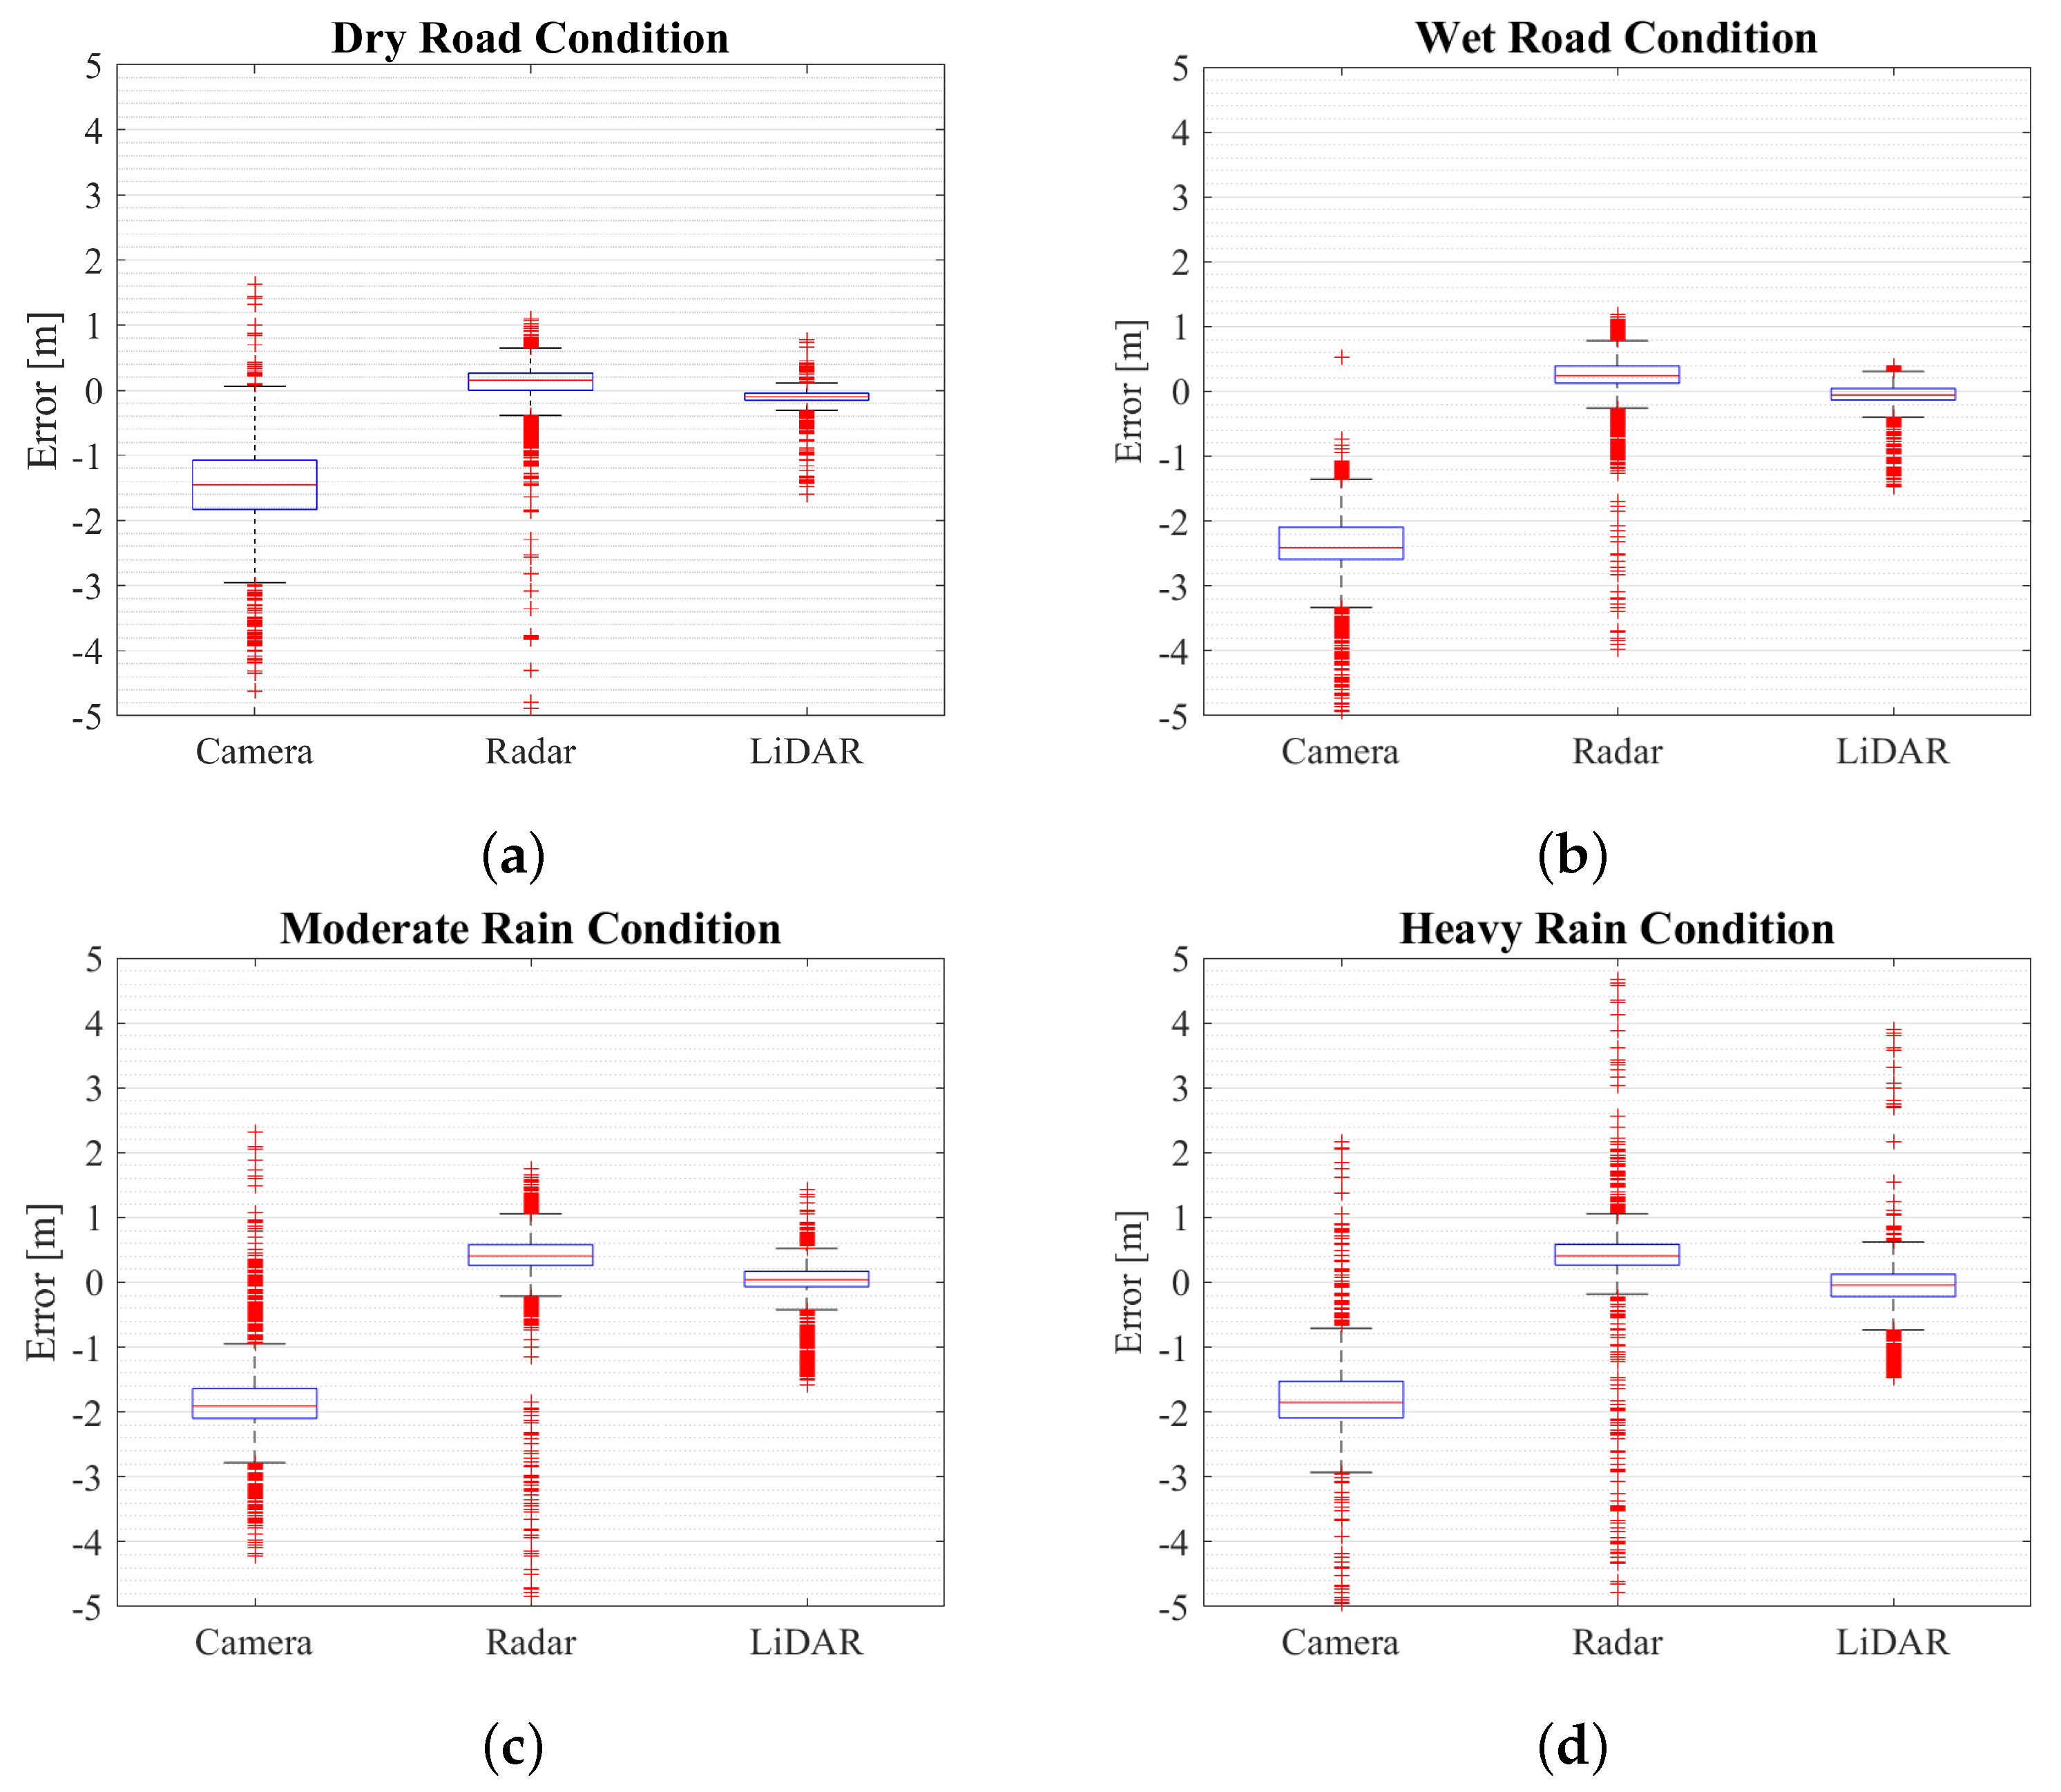
In general, having the wipers activated during rainfall can help to maintain a clear view for the Camera, making the detection more stable. However, the performance of the Camera’s detection is still impacted by other environmental factors, such as the intensity of the rain and the level of ambient light. These factors can affect the image quality captured by the Camera, making it more difficult for the system to detect and track objects accurately. As shown in
Table 4, the IQR increases as the rainfall increases. Specifically, the outlier numbers increase by at least 23% compared to the dry road conditions. It is also evident that the Camera is susceptible to illumination. In principle, the car body material’s reflectivity is higher under sufficient lighting. Hence, the extinction coefficient decreases. Good contrast with the surrounding environment is conducive to recognition. Meanwhile, artificial lighting provides the Camera with enough light at night to capture clear images and perform accurate detection. In this scenario, there is a significant increase in outliers. For dry road conditions, the detected outliers are 55% higher at night than during the day. In the case of moderate rainfall, the number of outliers increased by 41.7%. The high uncertainty of detection at night leads to a decrease in average accuracy, as seen in
Table 5.
Comparing
Figure 5 and
Figure 6, the Camera detection error with the smallest range of outliers is during the day and on a dry road. In addition, nighttime conditions with moderate rainfall are a challenge for Camera detection, where the outlier range is significantly increased in
Figure 6b. Since the Camera is a passive sensing sensor, like most computer vision systems, it relies on clearly visible features in the Camera’s field of view to detect and track objects. For a waterlogged road, the water can cause reflections and glare that can affect the image quality captured by the Camera and make it difficult for the system to process the information accurately. As a result, the average error is greatest in this condition as illustrated in
Table 5.
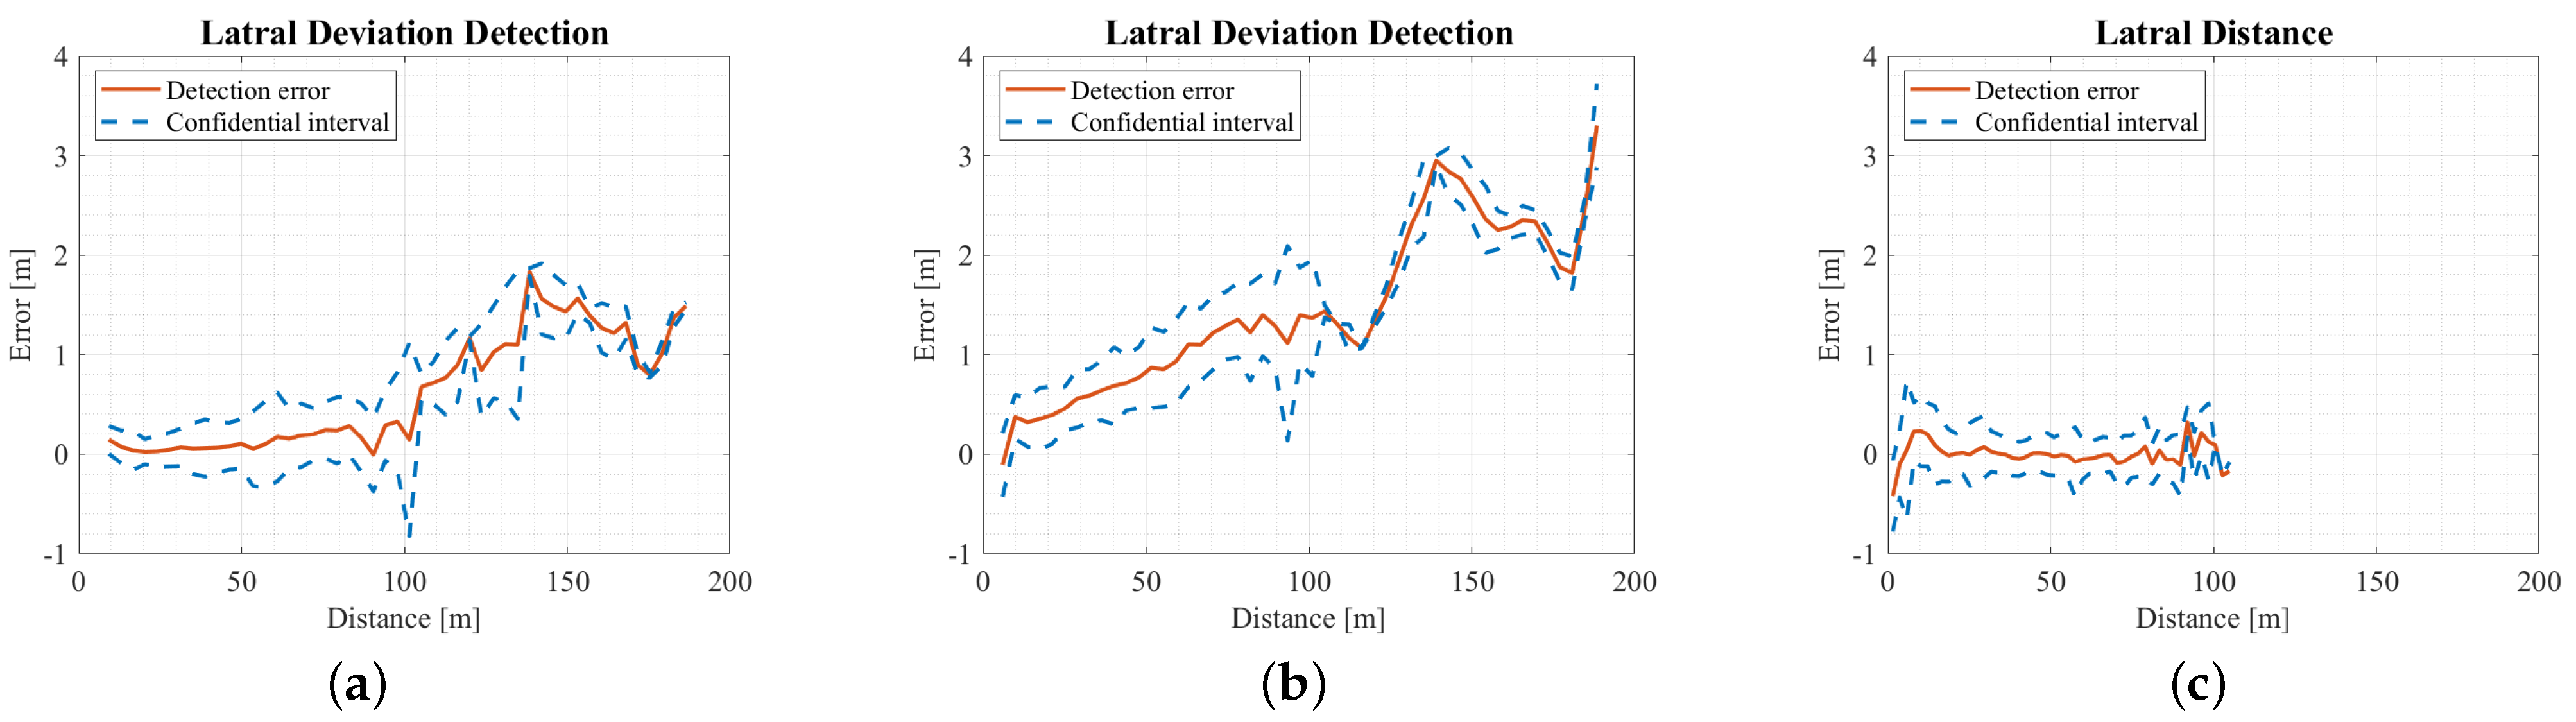
Finally,
Figure 7 demonstrates the influence of distance on the detection results and it can be clearly seen that the effective detection range of the Camera is about 100 m. The error increases for detection results beyond this range and the confidence interval also grows, which makes the detection results unreliable.
4.2. Radar
In the last decade, Radar-based ADAS has been widely used by almost every car manufacturer in the world. However, In the millimetre wave spectrum, adverse weather conditions, for example rain, snow, fog and hail, can have a significant impact on Radar performance [
21]. Moreover, the study of [
10] has demonstrated that different rain intensities directly affect the capability of an obstacle to reflect an echo signal in the direction of a Radar receiver, thus resulting in an impact on maximum detectable range, target detectability and tracking stability. Therefore, rain effects on the mm-wave Radar can be classified as attenuation and backscatter. The two mathematical models for the attenuation and backscattering effects of rain can next be represented by Equation (
3) and Equation (
4), respectively.
where
r is the distance between Radar sensor and the target obstacle,
is the Radar wavelength,
is the transmission power,
G denotes antenna gain, and
denotes the Radar cross-section of the target. The rain attenuation coefficient
is determined by rainfall rate and the multipath coefficient is
V. From Equation (
3), it can be seen that we need to consider the rain attenuation effects when calculating the received signal power
; this is based on the rain attenuation effects, pathloss and multipath coefficient.
The relationship between the power intensity
of the target signal and that of the backscatter signal
is characterized according to Equation (
4). It is essential to maintain the ratio of the two variables above a certain threshold for reliable detection. Where
is pulse duration,
denotes antenna beamwidth,
c is the speed of light. However, The rain backscatter coefficient
is highly variable as a function of the drop-size distribution. Therefore, Radar will also consume more energy and cause greater rain backscatter interference from Equation (
4). Rainwater could produce the water film on the Radar’s housing and thus affect the detection effect, which can be observed in
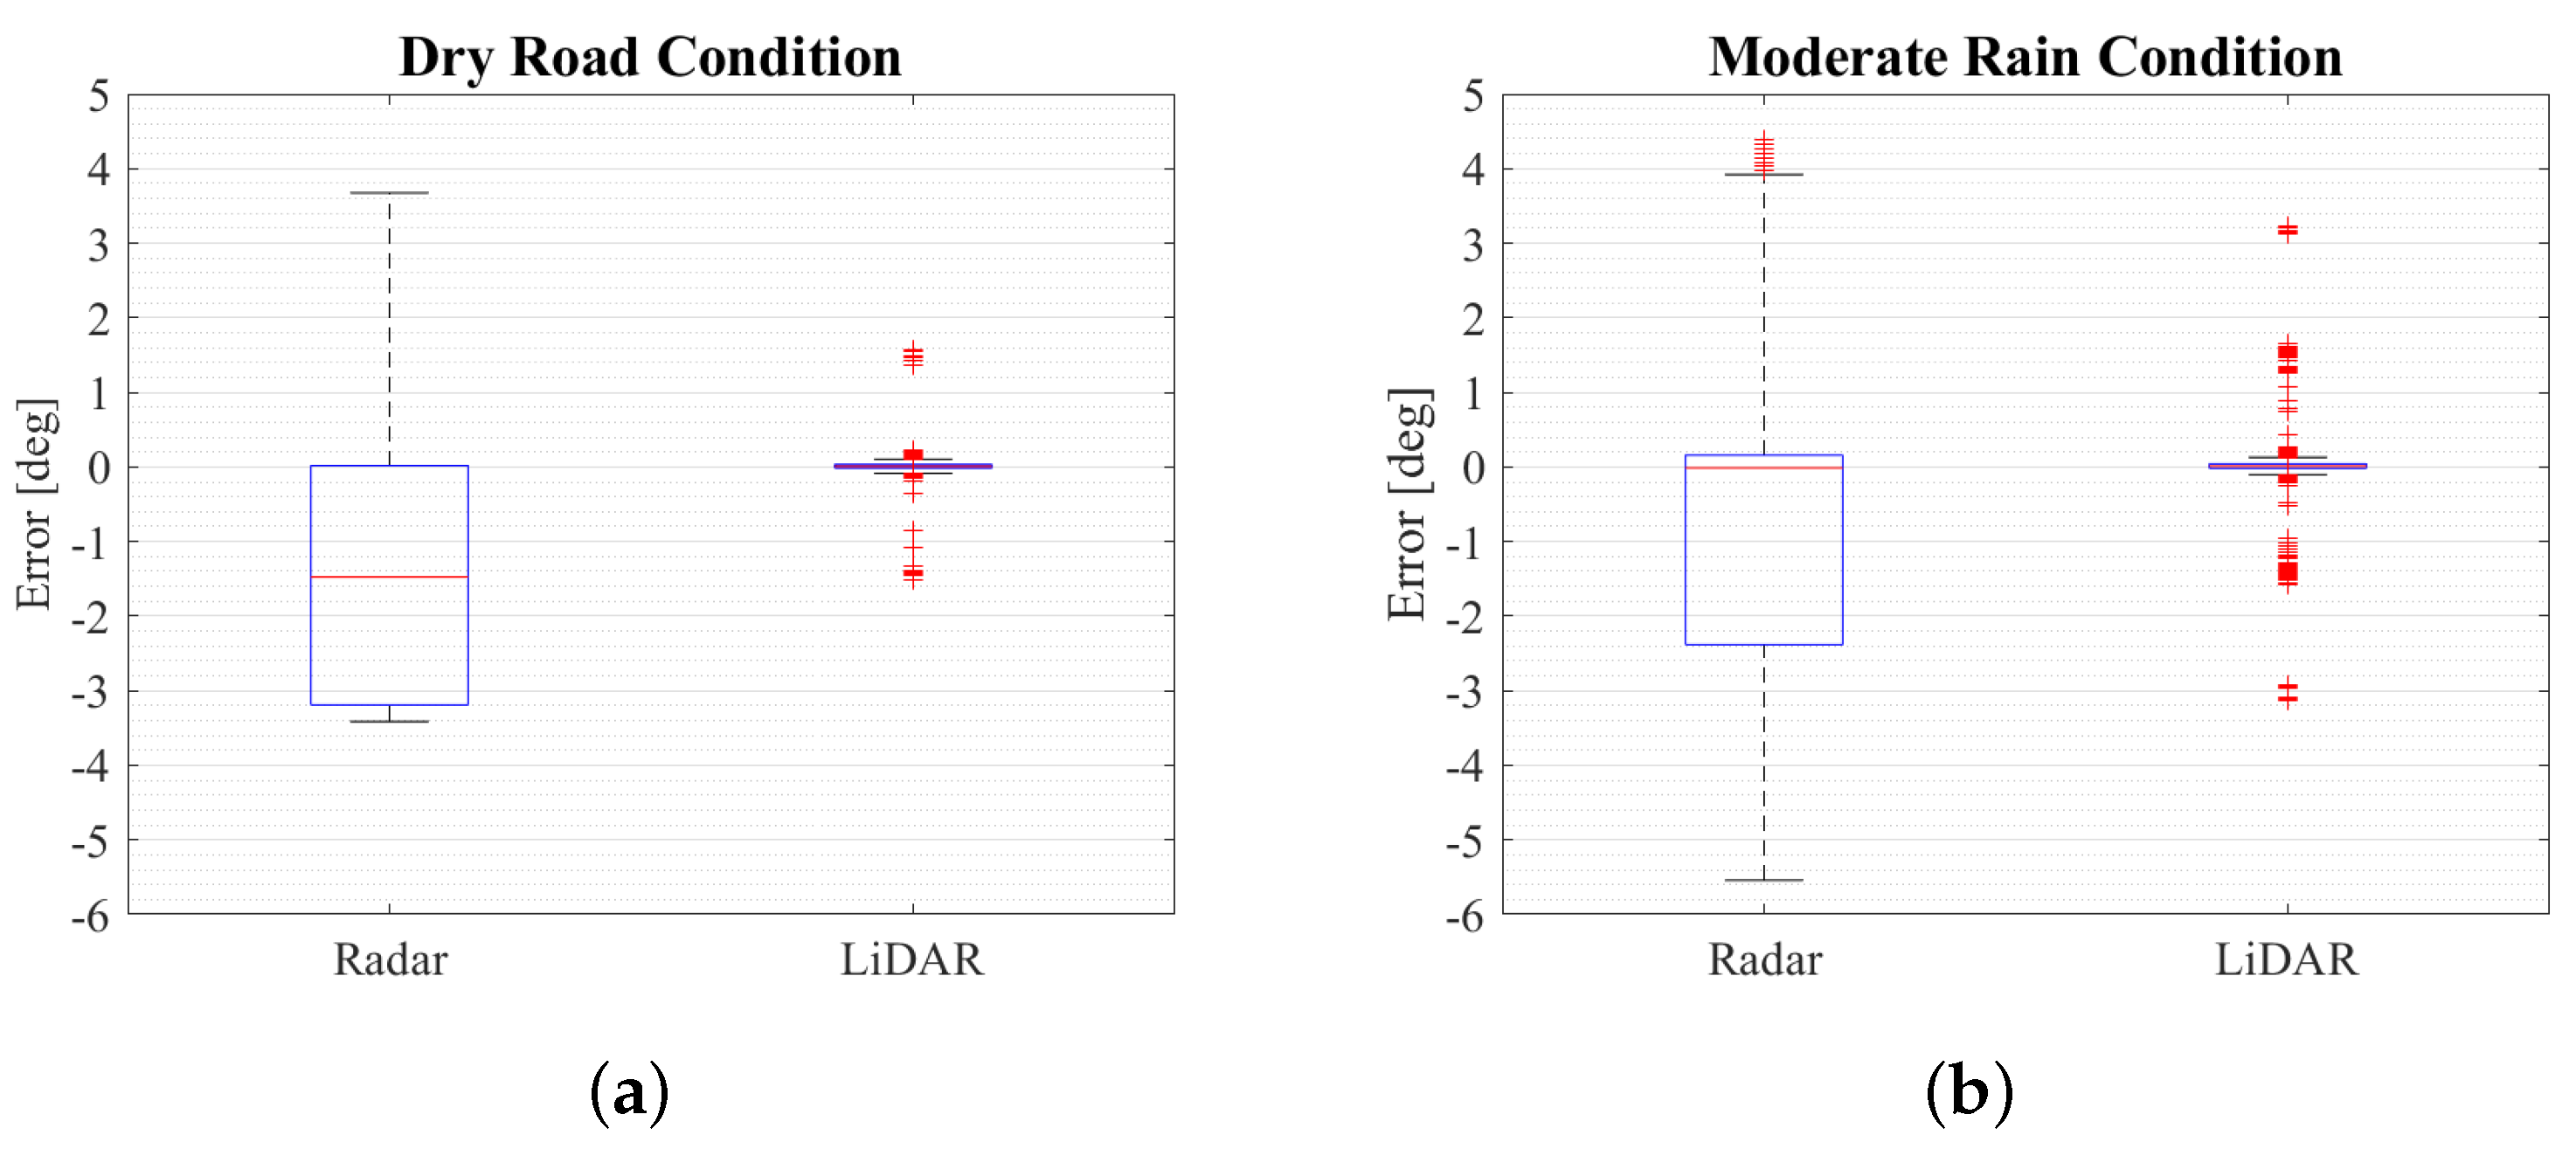
Table 6. Although the difference in IQR values between rainy and clear weather conditions is insignificant, the number of outliers increases during heavy rainfall. Overall, the Radar is not sensitive to environmental factors. In particular, illumination level does not affect the Radar’s detection performance and the IQR values remain consistent with those during the day.
Figure 5 and
Figure 6 demonstrate this phenomenon, the ranges of IQR and outliers are basically the same, but when the rainfall intensity is relative high, the rain backscatter interference leads to more outliers in
Figure 6b.
However, the average error of Radar’s lateral detection results is larger compared to the Camera and LiDAR, as shown in
Table 5. This is because the working principle of Radar is to emit and receive radio waves, which are less focused and have a wider beam width compared to the laser used by LiDAR. This results in a lower spatial resolution for Radar, posing a challenge for lateral detection. LiDAR uses the laser to construct a high-resolution 3D map of the surrounding environment. At the same time, the Camera captures high-resolution images that can be processed using advanced algorithms to detect objects in the scene. This makes LiDAR and Camera systems more suitable for lateral detection than Radar systems. Finally, comparing the performance of the Camera and LiDAR in
Figure 7, Radar has the farthest detection distance of approximately 200 m, but the error increases as the distance increases.
4.3. LiDAR
In recent years, automotive LiDAR scanners have been autonomous vehicle sensors essential to the development of autonomous cars. A large number of algorithms have been developed around the 3D point cloud generated by LiDAR for object detection, tracking, environmental mapping or localization. However, LiDAR’s performance is more susceptible to the effects of adverse weather. The studies of [
19,
40] tested the performance of various LiDARs in a well-controlled fog and rain facility. Meanwhile, these studies verified that as the rainfall intensity increases, the number of point clouds received by the LiDAR decreases, which affects the tracking and recognition of objects. This process can be summarized by LiDAR’s power model in Equation (
5).
This equation describes the power a received laser returns at a distance
r, where
is the total energy of a transmitted pulse laser and
c is light speed.
A represents receiver’s optical aperture area,
is the overall system efficiency.
denotes the reflectivity of the target’s surface, which is decided by surface properties and incident angle. This last item can be regarded as the transmission loss through the transmission medium, which is given by Equation (
6).
where
is the extinction coefficient of the transmission medium; extinction is due to the fact that particles within the transmission medium would scatter and absorb laser light.
From a short review of Equations (
5) and (
6), we can infer that the rainfall enlarges the transmission loss
and hence leads to a decrease in the received laser power
, which makes the following signal processing steps fail. In fact, the performance of the LiDAR is degraded due to changes in the extinction coefficient
and the target reflectivity
. Most of the previous studies focused on the statistics of point cloud intensities; the point cloud intensity decreases with rain intensity and distance. However, object recognition based on deep learning is robust and can resist well the impact of environmental noise on the accuracy of the final results. This phenomenon can be observed from our statistics shown in
Figure 5 and
Figure 6. Although the list of objects output by LiDAR is less influenced by the environment, there are still performance differences. In
Table 7, it can still be seen that dry road conditions are indeed the most suitable for LiDAR detection and the difference in IQR between daytime and nighttime is insignificant. Since the tests under the rain simulator are all close-range detection, the results on wet road surfaces are not much different from those on dry surfaces. However, once the rain test started, the difference was noticeable. Raindrops can scatter the laser beams, causing them to return false or distorted readings. This can result in reduced visibility, making it more difficult for the system to detect objects and obstacles on the road. Therefore, as the amount of rain increases, LiDAR detection becomes more difficult. Especially in heavy rain, where the IQR increased by 0.156 m compared to when tested in dry conditions. Additionally, the number of outliers also significantly increases. Furthermore,
Figure 5c,d also demonstrate the phenomenon, with a larger varying range of outliers under rainy conditions. Meanwhile, The range of outliers covers the entire observed range of the boxplot in
Figure 6b. The influence of rain on LiDAR performance is evident.
In
Figure 7c, it can be seen that the detection range of LiDAR can reach 100 m. However, the effective range of 16-beam LiDAR for stable target tracking is about 30 m. Larger than this range, tracking becomes unstable and is accompanied by missing tracking. This is because the algorithms may use a threshold for the minimum signal strength or confidence level required to recognize an object, which limits the maximum range of the object recognition output. In addition, considering the robustness and accuracy of the algorithm could filter out point cloud at long ranges due to the limited resolution and other sources of error, thereby reducing the computational requirements and potential errors associated with processing data at more distant ranges. Through this method, 16-beam LiDAR can provide higher resolution and accuracy over a shorter range, which is suitable for many applications, such as automated driving vehicles and robotics. Only the error is larger in the closer range, which is caused by the mounting position of the LiDAR. Since our tested LiDAR is installed in the front end of the vehicle, it is difficult to cover the whole object when the car is close to the target, which makes the recognition more difficult and less accurate. However, this problem gradually improves when the target vehicle is far away from the ego car.
Figure 7.
Camera, Radar and LiDAR detection performance over the distance. (a) Camera detection performance; (b) Radar detection performance; (c) LiDAR detection performance.
Figure 7.
Camera, Radar and LiDAR detection performance over the distance. (a) Camera detection performance; (b) Radar detection performance; (c) LiDAR detection performance.
5. Discussion
In this section, we discuss the observations and limitations of sensors for ADAS during the measurement under the rain simulator. By comparison using
Table 5, we calculate the average detection error of the sensors for different environmental conditions. The comparison of lateral distance errors reveals that there is no significant difference between the errors of the Camera and LiDAR sensors, as the average detection error for both sensors is only 0.054 m and 0.042 m, respectively. Meanwhile, the conclusion drawn in the study of [
40] is consistent with our findings, as changes in the propagation medium of the laser due to rain and fog weather adversely affect the detection. However, Radar detection is not as reliable as longitudinal detection, as indicated by the average error of 0.479 m. This is due to the small amount of point cloud data from the Radar and it is challenging to discern lateral deviations after clustering, as discussed in [
10,
20]. Furthermore, the error results from different environments indicate that Radar is the least affected by environmental factors. Although Cameras are also less impacted by the rainfall, it should be noted that the tests were performed with the wipers on. Additionally, in the night test, our results demonstrated that the detection performance is enhanced by the contrast improvement at night with sufficient artificial light. Finally, while LiDAR has the highest detection accuracy, it is susceptible to the amount of rain and the accuracy difference is more than four times.
To investigate the impact of distance on detection accuracy, we aggregated all test cases in
Figure 7 statistically. LiDAR showed an extremely high accuracy rate. The mean error is observed to be merely 0.041 and the standard deviation is also effectively controlled. However, the effective detection range of LiDAR is only about 30 m. Beyond this range, target tracking is occasionally lost. Compared with Radar’s effective detection range of up to 200 m, it is obvious that there are limitations in the usage scenario. However, the detection error of both Radar and Camera becomes larger as the distance increases. The Camera’s average lateral error is 0.617 m, whereas the Radar exhibits a surprisingly high lateral error of 1.456 m, indicating a potential deviation of one lane as distance increases. This presents a significant risk to the accuracy of estimated target vehicle trajectories. Finally, by using uniform sampling, we calculated the detection error for each sensor under all conditions as summarized in
Table 8.
6. Conclusions
Through a series of experiments, we have shown the impact of unfavourable weather conditions on automotive sensors’ detection performance. Our analysis focused on lateral distance detection and we quantitatively evaluated the experimental results. Our studies demonstrated that rainfall could significantly reduce the performance of automotive sensors, especially for LiDAR and Camera. Based on the results presented in
Table 5, it can be inferred that LiDAR’s detection accuracy diminishes by a factor of 4.8 as the rainfall intensity increases, yet it still exhibits a relatively high precision. In contrast, the Camera’s performance experiences less variation in rainy weather, with a maximum reduction of 1.57 times. However, as the Camera is significantly affected by lighting conditions, its detection accuracy declines by 4.6 times in rainy nighttime conditions compared to clear weather conditions. Additionally, the detection error fluctuation of Radar was slight but lacked lateral estimation accuracy. In the same weather conditions, Radar exhibits detection accuracy that was on average 16.5 and 14 times less precise than Camera and LiDAR, respectively.
Furthermore, we conducted a series of nighttime tests that illustrated the positive effect of high artificial illumination on Camera detection. These experimental findings provide essential insights for automotive manufacturers to design and test their sensors under various weather and lighting conditions to ensure accurate and reliable detection. Additionally, drivers should be aware of the limitations of their vehicle’s sensors and adjust their driving behaviour accordingly during adverse weather conditions. Overall, the detection performance of different automotive sensors under environmental conditions provides valuable data to support sensor fusion. For instance, while LiDAR has a maximum effective detection range of around 100 m, tracking loss occurs beyond 30 m. Thus, to address the limitations of individual sensors, multi-sensor fusion is a promising approach.
As part of our future work, we aim to conduct a more in-depth analysis of the raw data obtained from automotive sensors and introduce more rain and Illumination conditions, for example, introducing more tests for rain and artificial light intensity variation. Raw data are critical inputs to the perception algorithm and often have a significant impact on the final detection output. We particularly want to investigate the effects of rainfall on LiDAR’s point cloud data, as it can significantly impact detection accuracy. Additionally, we plan to explore the development of a sensor fusion algorithm based on the experimental results. By combining data from multiple sensors, sensor fusion can compensate for the limitations of individual sensors, providing a more comprehensive perception of the environment and enabling safer and more effective decision-making for autonomous driving systems. Therefore, our future work will focus on improving the accuracy and reliability of sensor data to enable more robust sensor fusion algorithms.

 ,
, 


