1. Introduction
Currently, the transport sector is potentially the most important one in terms of enabling reductions in greenhouse gases (GHG) emissions, because most motor vehicles are powered by fossil fuels [
1]. In this context, countries committed to the agreed GHG reduction targets, with the registration of 3123 climate change laws and policies around the world, are investing in cleaner alternatives for energy sources as a strategy for such reductions [
2]. The Fossil Fuel Free Streets Declaration, promoted by the C40 Cities Leadership Group for Climate in 2019, is an example of a situation in which Brazil participated in order to meet the Sustainable Development Goals (SDGs), especially in regard to SDG 7—Affordable and Clean Energy, indicating the need for measures of transportation system efficiency and renewable fuels, which can provide modern energy for all, and SDG 11—Sustainable Cities and Communities, in which clean energy sources drive cities to become more sustainable. Rio de Janeiro is one of the signatory cities, with a commitment to acquire exclusively zero-emission buses by 2025 and to designate larger urban areas as zero-emission zones, considering the situation of pollutant gas emissions [
3].
Between 1970 and 2010, GHG emissions due to the global transport sector increased by 250%, a significantly higher rate than other sectors [
4]. In 2019, within the energy sector, electricity and heat generation were responsible for most emissions (31.8% of total GHG), followed by transportation (14.3% of total GHG) [
5], both of which are addressed in this study.
According to Björklund (2011) [
6], the concept of green urban transportation involves fewer negative impacts on human and environmental health compared to existing ones. This concept has gained importance in recent years due to the negative impact of transportation on the environment and the health conditions of urban residents. Dyr et al. (2019) [
7] stated that urban mobility is largely based on using conventional passenger means of transport that burn fossil fuels, leading to emissions of harmful substances such as greenhouse gases and an increase in traffic congestion and high-risk commuter accidents, as well as an amplified use of energy derived from petroleum.
One of the main components of green urban transportation is the use of alternative fuels for urban buses. According to Breuer et al. (2021) [
8], the primary goal of the energy transition in the context of transport is to reduce greenhouse gas emissions. Therefore, according to Contestabile et al. (2011) [
9], several high-profile studies have compared the potential of alternative road transport technologies, such as hybrids, plug-in hybrids, battery electric vehicles, hydrogen fuel cells and biofuels.
In recent years, technologies applied to buses have rapidly developed, bringing new solutions to the market, with electric and hybrid vehicles being a market trend. According to Allied Market Research (2021) [
10], the global electric bus market is expected to grow at a compound annual rate of 25.3% until 2027, driven by technological advancements and greenhouse gas emissions reduction policies in many countries. Another growing trend in the bus market is the adoption of hydrogen-powered vehicles, which emit only water vapor and do not pollute the environment. This technology is already being used in several cities around the world, such as London, Paris and São Paulo. The global hydrogen-powered bus market is expected to grow at a compound annual rate of 30.8% until 2027 [
11]. Hydrogen-powered buses offer several advantages over electric and hybrid buses, such as their refueling time, which is similar to that of diesel buses, and electric buses require more time to recharge. Additionally, hydrogen-powered vehicles have greater autonomy and do not require large batteries, making them lighter and reducing energy consumption. According to Frost and Sullivan (2022) [
12], hydrogen buses are expected to become competitive with electric buses in terms of cost per kilometer by 2025.
In Brazil, the transport sector accounted for 79.1% of the final energy consumption related to fossil diesel oil [
13]. As an aggravating factor, the mobility characteristics of Brazilian metropolitan regions, such as Rio de Janeiro, cause the road transport sector to be responsible for an even higher rate of carbon dioxide (CO
2) emissions. Therefore, some GHG reduction strategies in this sector for metropolitan regions have the potential to strongly influence total emissions. Among these strategies, the development of research on hydrogen fuel vehicles has stood out as the most efficient and important GHG [
14].
Given the influence of the road transport sector on Brazilian emission rates, it is necessary to measure the impact of each alternative of energy use, considering all stages, in order to ensure an adequate comparison among them. For such, Life Cycle Assessments (LCAs) present themselves as a sufficiently comprehensive study proposal, as their application to the transport sector provides detailed information on the implementation of alternative fuel/vehicle technologies, which helps not only to compare them, but also to detect improvement points [
15]. Unlike a battery that discharges while in use to power electrical components, fuel cells work as a continuous source of operational energy as gas is supplied [
16]. Therefore, hydrogen fuel cells can overcome the disadvantages of battery electric vehicles (BEVs), making hydrogen the “fuel of the future” for transportation [
17]. Therefore, in this study, an analysis between the diesel-powered internal combustion bus (ICEB) and the hydrogen-powered polymer fuel cell hybrid bus (FCHB) is performed.
This study aims to quantitatively and comparatively evaluate the potential environmental impacts of two type I bus alternatives in the city of Rio de Janeiro (MRJ), which are (1) a diesel-powered internal combustion bus (ICEB); and (2) a hydrogen-powered polymer fuel cell hybrid bus (FCHB). Based on the ISO 14040 and 14044 standards [
18], an LCA study was conducted using well-to-wheel (WtW) modeling to calculate the required energy, as well as total CO
2 emissions. In the case of FCHB, three different methods of hydrogen production are considered: water electrolysis (WE), ethanol steam reforming (ESR) and natural gas steam reforming (NGSR).
This article is divided into four sections. The first section (Introduction) presents the context and justification of the problem, as well as the objectives of the study. The second section presents the methodology proposed for the study. In the third section, the results are shown. Finally, the fourth section contains final considerations.
2. Materials and Methods
An LCA is a decision-making support tool that enables the identification and quantification of the potential environmental impacts of a given product or service throughout its life cycle [
16]. This study follows the basic steps of an LCA [
16]: (i) objective and scope definition, (ii) life cycle inventory analysis, (iii) life cycle impact assessment and (iv) interpretation of the results, which includes a comparative analysis and recommendations for policy decision making.
2.1. Objective and Scope of LCA
The system boundary covers the fuel production and use phase, i.e., a well-to-wheel (WtW) system boundary (
Figure 1). Wang et al. (2015) [
19] showed that, in a WTW analysis, GHG emissions of diesel vehicles (DV), hybrid–electric vehicles (HEV) and battery electric vehicles (BEV) are dominated by CO
2 emissions (~97%), and they concluded that the relative reduction in their GHG emissions follows those of CO
2 emissions.
Bicer and Dincer (2018) [
20] conducted an LCA-based study using a “well-to-wheel” approach to compare new technologies and conventional combustion vehicles. Seven types of environmental impacts were analyzed: abiotic depletion, acidification, eutrophication, global warming, human toxicity, ozone depletion and terrestrial ecotoxicity. The results showed that electric and plug-in vehicles have higher values of acidification, human toxicity and terrestrial ecotoxicity, particularly during the maintenance and manufacturing processes. Hydrogen-powered vehicles are an alternative due to their fuel economy during operation and higher energy density.
Jelti et al. (2021) [
21] conducted a case study in the city of Oujda, Morocco, based on LCA methodology, analyzing the total energy use by fuel type, GHG emissions and air pollutants. A comparative analysis was conducted for diesel, hybrid, electric and fuel cell buses. The results showed that fuel cell and electric buses reduce oil consumption in the TTW phase, in comparison to diesel and hybrid buses, as well as demonstrate an absence of NOx, SOx, CO and VOCs and insignificant amounts of PM
10 and PM
2.5, in comparison to diesel buses. However, the study also indicated an increase in coal consumption during the WTT phase for electric buses due to battery manufacturing, which shows a favorable scenario for hydrogen buses.
Therefore, in this study, only CO2 emissions are considered. The objective of this study is to quantify the energy consumption and potential CO2 emissions of two different buses, considering the city of Rio de Janeiro as a case study. The results, presented in kJ for energy and in kg for CO2 emissions, enable the comparison of the two alternatives, as well as their use for policy making related to the reduction targets of GHG emissions. The Functional Unit (FU) used in this study is p.km traveled, which is a traditional unit in LCAs in the context of transportation systems.
Figure 1 establishes the life cycle stages of energy that are addressed in Phase 2 of the LCI: (a) Well-To-Tank (WTT) analysis, which comprises the processes of raw material extraction, fuel production, transportation, storage, distribution and refueling; and (b) Tank-To-Wheel (TTW) analysis, which includes the use of a fuel or power source by the bus. Finally, an LCA was made through the integration of WTT and TTW analysis, resulting in a Well-to-Wheel (WtW) approach.
The life cycle inventory analysis (LCI) is limited to energy consumption and CO2 emissions, which corresponds, respectively, to energy use and climate change in terms of life cycle impact categories. External normalization is applied by using the average energy consumption and CO2 emissions per capita in the city of Rio de Janeiro. The data in the inventory are secondary data extracted from the scientific literature and reports.
2.2. Description of the Buses
The LCA methodology was applied for two types of buses, both with a length of 12 m, a gross weight of 17 t and a rated capacity of 80 passengers/vehicle, and the operation profile assumes urban traffic with an average speed of 20 km/h [
22]. The occupancy rate considered for the comparison is 66 passengers per vehicle [
23]. The internal combustion engine bus (ICEB) uses B12 fuel, which is an 88% blend of petroleum diesel oil (D100) and 12% soybean oil biodiesel (B100). Its specific mass is 0.8532 kg/L, and its Lower Heating Value (LHV) is 44,732 MJ/t. It is equipped with a compression ignition internal combustion alternative engine (four-stroke) and a mechanical transmission system. Its fuel consumption is 37.2 L per 100 km [
22].
The fuel cell hybrid bus (FCHB) uses hydrogen (H
2) as fuel, with a specific mass of 0.0899 kg/L [
24] and a Lower Heating Value (LHV) of 28,642 MJ/t [
25]. The FCHB is equipped with lithium iron phosphate batteries (LiFePO
4) and a solid oxide fuel cell (PaCos) that provides 50 kW of power [
24]. Its fuel consumption is 6.7 kg per 100 km, and its energy consumption is 5760 kJ/km [
14].
This study intends to provide information that enables the quantitative and comparative evaluation of energy consumption and CO2 emissions during each stage of life cycle impact of the energy used by the buses mentioned, as well as the influence of three of the main hydrogen production methods. In order to reach this objective, the different analyzed systems were classified into four scenarios, with the combination of different propulsion systems and fuels: ICEB with B12 as the fuel; FCHB with hydrogen as the fuel and ethanol steam reforming as the energy source—H2 FCHB (ESR); FCHB with hydrogen as the fuel and water electrolysis as the energy source—H2 FCHB (WE); and FCHB with hydrogen as the fuel and natural gas steam reforming as the energy source—H2 FCHB (NGSR).
Brazil’s energy mix has a 21.9% share of energy generated from non-renewable sources, or, more precisely, 12.8% from natural gas, 3.9% from coal, 3.0% from petroleum and its products and 2.2% from nuclear power; and a 78.1% share coming from renewable sources, which are divided into 56.8% from hydro power, 10.6% from wind power, 8.2% from biomass and 2.5% from solar power [
13], according to
Figure 2. The considered production chains for hydrogen and diesel are described below.
2.2.1. Diesel Fuel—B12
Sales of petroleum-derived fuels in the State of Rio de Janeiro (ERJ) are equivalent to 58% of all oil processed by the Duque de Caxias Refinery (REDUC). Thus, it is assumed that the entire supply of petroleum diesel oil (D100) for the MRJ derives from REDUC. According to ANP (2020) [
26], between 2010 and 2020, this referred refinery had the operational capacity to process 13 × 10
6 m
3 of oil per year, with a 95% utilization factor. The Middle East’s “on shore” deposits provide 42% of the oil processed for supplying the MRJ (3 × 10
6 boe). The rest comes from offshore deposits located on the ERJ’s coast [
13].
D’Agosto et al. (2015) [
22] assumed the maritime transport of imported oil to happen along 8746 ± 262 nautical miles on 300,000 deadweight tonnage (DWT) ships, the transport from wells to terminals through oil pipelines in the Middle East to happen along 145 ± 15 km, and the transport from terminals to refineries in Brazil to be made through oil pipelines (125 km). The transport of domestically extracted oil from wells to the refinery is carried out exclusively by oil pipelines (334 km) [
27]. After refining, the D100 is pumped through ducts into tanks located at the fuel distribution base near the refinery (BDC), where 12% of pure biodiesel is added (B100), resulting in B12. It is then loaded onto oil tank trucks (30,000 L) that distribute the product (27.6 ± 9.7 km) to gas stations located inside bus parking garages [
22]. Equation (1) shows how the import and refining of petroleum oil are carried out.
where D
Total = Total Distance (km); D
IO = Distance of imported oil transportation; D
NM = Distance of sea transportation (1 nautical mile = 1.852 km); D
W-T = Distance of transportation of imported oil from wells to terminals (km); D
t-ref = Distance of transportation from the terminal to the refinery (km); D
DE = Distance of domestically extracted oil transportation from wells to the refinery; and D
ref-GS = Distance of transportation from the refinery to gas stations.
2.2.2. Hydrogen—H2
Hydrogen is a chemical energy carrier that can be used to produce electricity, and through the fuel cell, it is possible to convert this chemically stored energy from a fuel directly into electrical energy, which is used to power electric motors [
17]. The production chains considered for hydrogen are described below.
It is a well-known process in which water is separated into hydrogen and oxygen by applying electricity. During water electrolysis, hydrogen and oxygen gases are generated by applying a direct electric current that promotes the dissociation of water molecules through oxidation–reduction (redox) reactions [
28]. Water electrolysis, combined with renewable energy sources, such as hydraulic, wind and solar photovoltaic energy, is considered a clean and sustainable method of hydrogen production [
29].
The main premises used for the calculations were as follows: (1) the characteristics of Brazil’s energy mix were taken into account for electricity production, as mentioned above, and (2) it was considered that hydrogen is produced on site, without any need for distribution or transport. The CO
2 emission factor associated with electricity generation in Brazil corresponds to 90.0 kg of CO
2/MWh [
13]. The energy considered necessary for the production of 1 kg of hydrogen is 50 kWh [
24].
- b.
Ethanol Steam Reforming (ESR)
It is assumed that all ethanol consumed in the city of Rio de Janeiro is produced in the neighboring state of São Paulo, and then transported by 30,000 L tank trucks along an average route of 697 km to the distribution base in Rio de Janeiro. From this point, ethanol is transported on 30,000 L tanker trucks that distribute it to service stations located at an average distance of 26.23 km. The raw material for ethanol production is sugarcane, which is previously harvested and loaded onto 23-ton trucks that transport it for 20 km to distilleries. It is assumed that 25% of all sugarcane is harvested mechanically, and that the remaining part is harvested manually but loaded mechanically [
15].
In ethanol steam reforming, ethanol is first reformed at a high temperature in the presence of a catalyst. Depending on the reformer type, the raw material reacts with steam or oxygen at a high temperature and produces a synthetic gas composed of H
2, carbon oxide (CO), CO
2, methane (CH
4) and water (H
2O). The synthetic gas is subsequently processed in order to increase its hydrogen content (the CO content in the synthetic gas is converted into hydrogen by means of the water–gas shift reaction, or WGSR). Finally, hydrogen is extracted from the mixture at a desired purity of up to 99.999% for fuel cell applications [
30]. In this study, it was considered that the energy required for the production of 1 kg of hydrogen through ethanol steam reforming is 32.7 kWh [
31], and that the emissions resulting from this process are 12.2 kg of CO
2 per kg of H2 [
32].
- c.
Natural Gas Steam Reforming (NGSR)
In natural gas (NG) production, it is assumed that 100% of compressed natural gas (CNG) for automotive use in the MRJ derives from Campos Basin, which extends from the area around the city of Vitória (ES) to Arraial do Cabo (RJ), on the north coast of the State of Rio de Janeiro. The available NG is transported through pipelines (452 km) to the processing unit, according to TRANSPETRO (2019) [
27]. After processing, it is distributed through pipelines to gas stations (638 km) [
22] where it is compressed (220 atm) for refueling buses.
NG is the main raw material (>75% of production), and steam reforming is the most widespread method for hydrogen production [
24]. NG’s steam reforming process happens identically to that of ethanol, which is described above. For this purpose, the values of 10.83 kWh/kg of H
2 for energy consumption due to NG steam reforming, and of 10.6621 kg/kg of H
2 for CO
2 emissions during this process are considered [
33].
2.3. Temporal and Geographical Coverage
Data collection focused on the period from 2010 to 2020, and had a preference for the most recent data, whenever available. This is due to the complexity and the amount of time spent on collecting data from the previous years for fuel production, especially in some cases of data unavailability. It is considered that data from the previous year, for some of the least recent years in this period, are not relevant enough to modify the results in such a way that it would considerably affect the main objective of this study. When the available data were within a certain range, its average value was used for the calculations.
The campus of the Federal University of Rio de Janeiro, located in Fundão Island, in Rio de Janeiro, Brazil, was adopted as a geographical scope. For the comparison between the technologies, a single vehicle was adopted for each one, given the similarity between them, with both vehicles having the same passenger capacity, similar routes and operating conditions, so that it was a fair and accurate comparison. For hydrogen buses, a study conducted under real operating conditions in this location was adopted [
14]. The study was conducted during a period of 8 months, on an 11 km route, through which about 30,000 people are transported, with an average consumption of 6.7 ± 0.6 kg of H
2 per 100 km, with an average power of 36.4 kW, resulting in an average energy consumption of 1.6 kWh/km.
Following guidelines to reduce pollutant emissions, the insertion of new technologies can reduce emissions from the public transportation sector, which is a major contributor to emissions in the urban region [
14]. Because biodiesel is renewable and miscible to fossil diesel, the Brazilian government desires to expand its use. By 2020, biodiesel addition to diesel reached 12% [
34].
Approximately 45–65 Mt of hydrogen per year is produced globally as a raw material for the chemical and petrochemical industries, which is equivalent to 5.4–7.8 EJ and corresponds to around 1% of the global energy supply. About half of this amount is produced through natural gas steam reforming. For this reason, this method of production was included in this study [
35].
Due to the availability of ethanol throughout Brazil and its widespread use in cars and light commercial vehicles, since 2008, it was chosen as an energy alternative in the production of hydrogen to be used as fuel in urban public transport [
36]. Because Brazil’s energy mix differs from the global energy mix by consuming more renewable alternatives [
13], water electrolysis was included as an alternative for producing hydrogen to be used as fuel, in a cleaner and less polluting manner, despite the awareness of a potentially high energy cost.
2.4. Inventory Analysis
The energy consumed (E) is expressed in kJ/p.km, and it is estimated by summing up all the energy consumption per unit of energy of the resource used in the different processes. It is possible to estimate the energy consumption using Equation (2) [
26].
where E = Energy consumed (kJ/p.km); F
Bus = Fuel consumption (L/km); ρ
diesel = Diesel density (kg/L); LHV = Lower Heating Value (kJ/kg); and occupancy rate (passengers/vehicle).
Then, in order to estimate CO
2 emissions, Equation (3) is used [
26].
where E
CO2 = CO
2 emissions (g/p.km); E = Energy consumed (kJ/km); efactor = Emission factor (g/kJ); and occupancy rate (passengers/vehicle).
In the operation phase, the burning of fuel is taken into account. For all cases, the operation profile assumes a scenario of urban traffic with an average speed of 20 km/h [
22]. The characterization of the buses is presented in
Table S1 in Supplementary Materials. The energy consumption value considered for hydrogen-powered vehicles was 1.6 kWh/km, and it is based on a study conducted in the MRJ [
14]. For diesel vehicles, the assumed fuel economy was 2.6879 km/L [
22], and the used CO
2 emission factor was 0.079 g of CO
2/Kj [
37].
Table S1 in Supplementary Materials shows the fuel consumption values used for each propulsion system, based on the assumptions described above.
3. Results and Discussion
Table 1 shows the results of energy consumption and CO
2 emissions for the technologies considered in this study. For calculation purposes, considering the two bus alternatives, 880,000 km was adopted as the distance traveled during the estimated lifespan of the vehicle [
24].
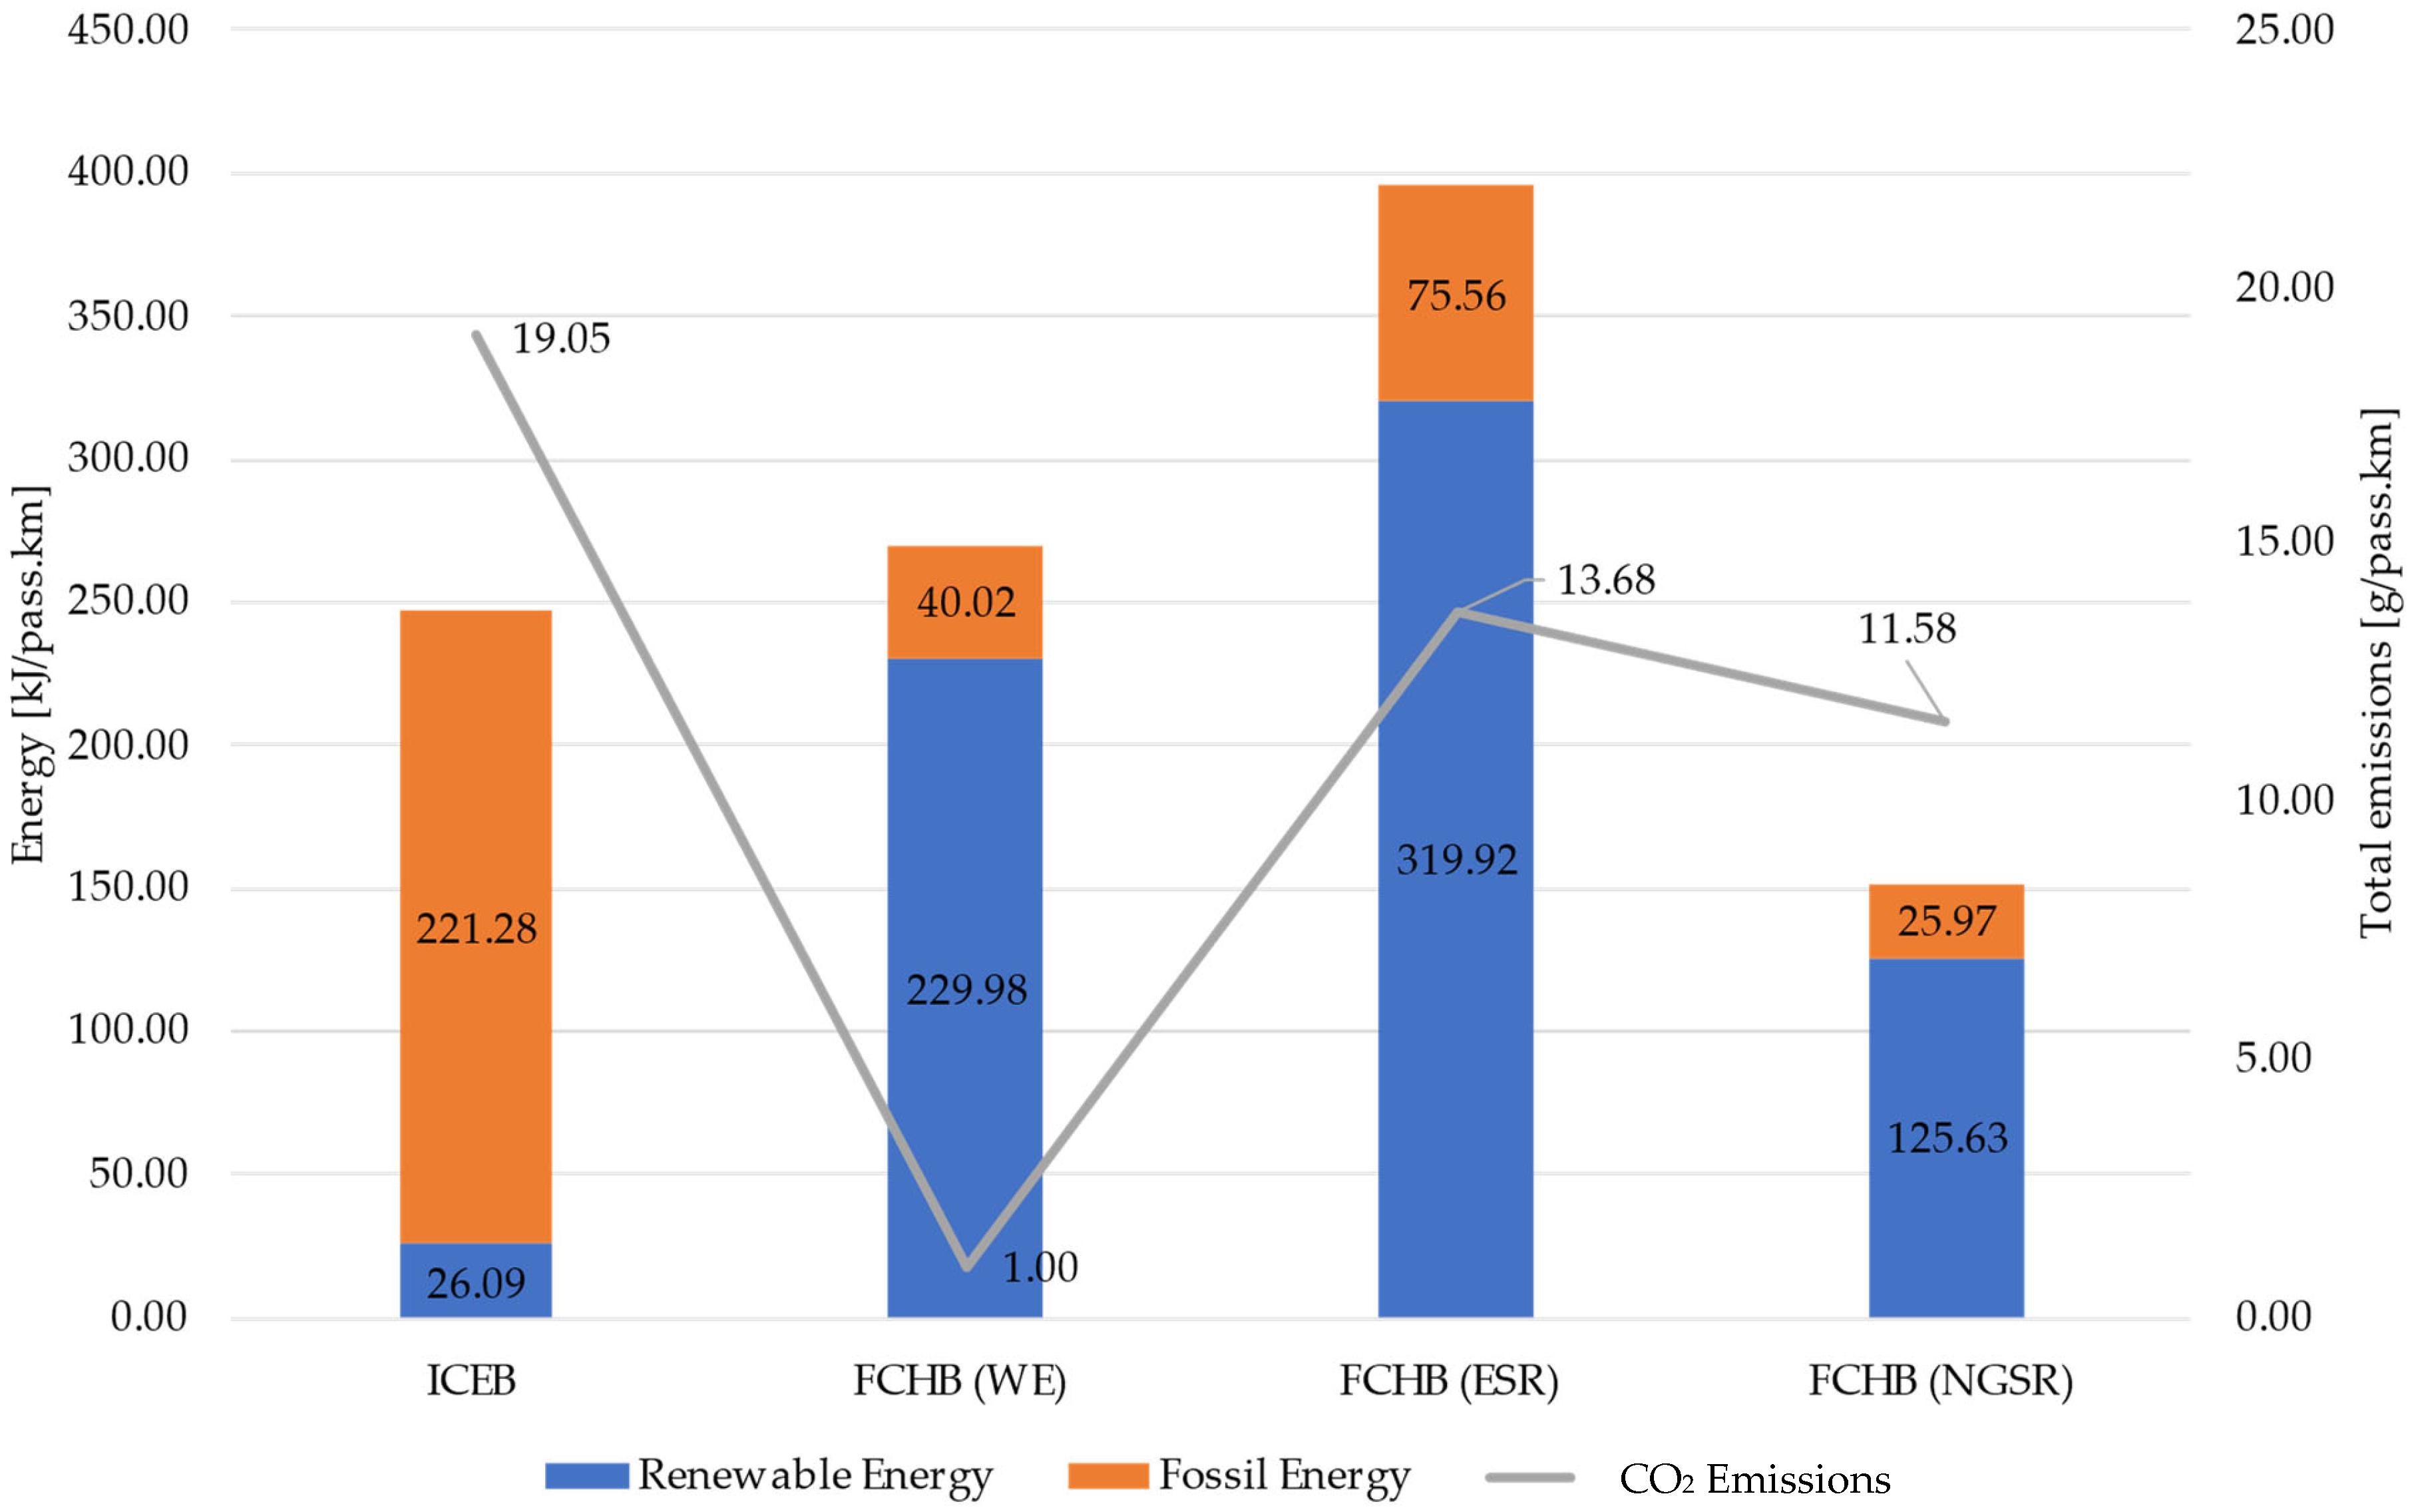
Despite its widespread use,
Figure 3 indicates that this source (ICEB) proved to have the highest rate of emissions among the studied alternatives, something which does not fit the Brazilian objectives of promoting less polluting transport alternatives. Although energy consumption is not the highest one,
Figure 3 indicates that the fossil percentage of this energy is very high (around 89.5%), which further removes this alternative from future plans for a clean transport system in the city of Rio de Janeiro.
Among the three alternatives considered for hydrogen production, water electrolysis proved to be the least polluting one. Despite having a high energy consumption,
Figure 3 leads to the observation that 85.2% of this energy is renewable; in other words, it is related to smaller pollutant emissions. Additionally, Koroneos et al. (2004) [
28] claimed that hydrogen derived from renewable sources can be used as a clean and inexhaustible energy source when necessary. The widespread introduction of this energy source would dramatically reduce global air pollution, increase the availability of energy for economic development and reduce potential global climate problems. The future of clean hydrogen-based energy also relies heavily on reduced costs for renewable energy production. The entry of renewable hydrogen energy into the market depends on when and where it is cost-effective compared to other local forms of energy. It is claimed that, both from an environmental and economic point of view, it is important to increase energy efficiency in all processes. This can lead to reductions in resource consumption, emissions, waste generation and energy consumption. In this sense, it is also worth mentioning that the low emissions associated with this alternative, which are of around 1.00 g of CO
2/p.km, are mainly a result of the emission factors of electricity production, given the characteristics of Brazil’s power generation mix.
FCHB buses (ESR) ranked first in total energy consumption among the alternatives for hydrogen production, reaching 395.48 kJ/p.km. This is mainly due to its high energy consumption during the fuel production phase (ethanol), before it is reformed into hydrogen. During ethanol production, 138.34 kJ/p.km was spent, and during steam reforming, this value was 93.33 kJ/p.km. However, 80.9% of this energy is considered to be renewable. In terms of CO2 emissions, FCHB buses (ESR) were just behind diesel buses (ICEB), with emissions of 13.68 g of CO2/p.km. Therefore, it was concluded that it is not the most sustainable alternative for hydrogen production.
FCHB buses (NGSR) showed the lowest results of total energy consumption, reaching 151.60 kJ/p.km, of which 82.9% are renewable, as shown in
Figure 3. This low energy consumption offers the possibility to hypothesize why this technology is currently the most used for hydrogen production, considering that 96% of the world’s production comes from fossil sources, and around 75% of the used raw material is natural gas [
24]. It is worth noting that, in general, countries have a preference for alternatives with low energy consumption because of high energy costs in certain regions. On the other hand, despite the low energy consumption, emissions of these buses reached 11.58 g of CO
2/p.km. This means that it proved to be almost 12 times more pollutant than electrolysis, exactly due to the fact that it is a fossil source, as mentioned earlier.
In terms of end-use emissions, hydrogen buses showed zero CO
2 emissions, because these vehicles do not emit pollutants during the operation phase. In other words, all emission records of these vehicles are due to the WTT stage. On the other hand, diesel vehicles cause emissions in both stages, and 89.2% of these emissions occur in the operation phase. These results are in line with the literature, because Brazil has renewables as the main energy sources, and the effectiveness of FCHBs depends on the energy generation used to produce hydrogen [
38].
4. Conclusions
The transport sector currently accounts for a considerable share of pollutant emissions, especially in metropolitan regions such as Rio de Janeiro, where increasing urbanization leads to a gradual reduction in available space for passenger cars on the streets. In this sense, several studies are under development in order to find cleaner and more sustainable alternatives, primarily for use in public transport.
In this article, a Life Cycle Assessment was conducted for two type I bus alternatives in the MRJ, allowing for an assessment and comparison of both emissions and energy consumption. The studied vehicles were diesel-powered internal combustion buses (the most widely used fuel in road transport in Brazil) and hydrogen-powered polymer membrane fuel cell hybrid buses. As there are different methods of hydrogen production, three alternatives for the production stage of raw materials were studied (water electrolysis, ethanol steam reforming and natural gas steam reforming).
ICEB showed the highest results of CO2 emissions. Although it is not the alternative with the highest total energy consumption, it had the highest consumption of non-renewable energy. Among the FCHB, the method of hydrogen production with the lowest CO2 emissions was water electrolysis, followed by natural gas steam reforming and, finally, ethanol steam reforming. Regarding energy consumption, natural gas steam reforming presented the lowest values, followed by ethanol steam reforming and, finally, water electrolysis. Thus, it is possible to conclude that the most environmentally advantageous alternative is the FCHB (WE), because it had the lowest emission rate and because the composition of Brazil’s energy mix enables most of the energy spent for the process to come from renewable sources.
It is concluded that, in order to have sustainable and clean transportation, it is necessary for the production processes of vehicles and, especially, alternative fuels to be environmentally friendly. In the Brazilian scenario, hydrogen production through water electrolysis appears to be the best alternative, mainly due to its electric mix. Furthermore, it is possible to observe that, even though it is still a developing technology that requires primarily refueling infrastructure and a regulatory environment, hydrogen-powered buses are effective alternatives for sustainable transportation, considering that the byproduct of its combustion is water vapor, thus being less polluting throughout its life cycle [
11]. It is expected that, by 2050, the demand for hydrogen will triple, driven by the need to reduce greenhouse gas emissions in the transportation, heating and energy generation sectors [
12]. The use of hydrogen as fuel has been shown to be a global trend, and it is hoped that, until 2050, the demand will triple, which shows the need to take a global approach.
The transition to a fleet of low and/or zero-carbon technology buses in Brazilian cities still faces technological, financial and regulatory obstacles (planning, management and monitoring). Therefore, political–regulatory arrangements that condition parameters and incentives for electrification are key to reconciling stakeholders and producing positive externalities for urban mobility [
39,
40]. Thus, despite advances in the literature, such as this study, incipient technical–operational knowledge continues to be one of the barriers to decision making for the implementation of this type of technology. Furthermore, the adoption of a new technology implies considering the incorporation of additional infrastructure that feeds the movement of these vehicles, requiring, therefore, integrated planning of interactive measures among technology, vehicles, urban space and professional training for the operation, maintenance and monitoring of this new technology.
Therefore, this study contributes to the academic community by filling the gap identified in the scientific literature with its proposal of comparing different types of urban buses, regarding not only GHG emissions, but also energy use, and including in its analysis the main methods of hydrogen production, a subject that is still under debate. This study also contributes to transport science by providing detailed energy use values and GHG emissions estimates that were calculated for the same scenario, allowing for a proper comparison, so that the data can be very useful when modeling and analyzing new alternatives.
For future projects, an enrichment of input data is envisioned, including the following: a better analysis of the operation can be performed, considering, for instance, actual values that vary according to the stretch and driving cycle; other pollutant gases can be included, such as methane (CH
4), sulfur dioxide (SO
2) and Particulate Matter (PM); other fuel alternatives, such as biofuels, and even other technologies, such as electric mobility, can be added to this comparison; an analysis of the Brazilian regulatory environment can incentivize new technologies; and the economic and financial feasibility of implementing the necessary charging infrastructure to be installed in garages and specific points in the city can be considered, in addition to the provision of intelligent energy transmission and distribution networks (smart grids). Moreover, it must be remarked that further research is desirable considering other aspects in terms of a sustainable assessment, thus adding, for instance, a cost–benefit analysis and social and economic indicators, mainly because FCHBs may have higher costs associated when compared to conventional diesel buses [
41,
42,
43].

 and
and 


