

Study on the Application of a Multi-Energy Complementary Distributed Energy System Integrating Waste Heat and Surplus Electricity for Hydrogen Production
Abstract
:1. Introduction
2. Research Methodology
2.1. Technical Approach
2.2. Model of the System
2.2.1. Gas Engine
2.2.2. Absorption Chiller/Heater
2.2.3. Waste Heat Recovery Boiler
2.2.4. Photovoltaic Panels
2.2.5. Wind Driven Generator
2.2.6. Miniaturized Natural Gas Hydrogen Production Equipment
2.2.7. Water–Carbon Ratio in Hydrogenation of Natural Gas
2.2.8. Hydrogen Fuel Cell
2.2.9. Multi-Energy Complementary Distributed Energy System Integrating Waste Heat and Surplus Electricity for Hydrogen Production
2.2.10. Calculation Method of Primary Energy Reduction Rate and Carbon Emission Reduction Rate
2.2.11. Calculation Method of Hydrogen Production in Different Types of Buildings
3. Case Study Information
3.1. Representative Urban Climate Data of Zhejiang Province, China
3.2. Investigation of Energy Consumption of Buildings
3.2.1. Energy Consumption of Buildings in Zhejiang Province
3.2.2. Monthly Energy Consumption of Different Type Buildings
3.2.3. The Setting of Electrical Load and Calculation Method
3.3. Electricity Supply Composition in Different Types of Buildings
4. Results
4.1. Waste Heat Utilization and Hydrogen Production
4.1.1. Waste Heat Utilization and Hydrogen Production in a Typical Day
4.1.2. Monthly Hydrogen Production in the City
4.2. The Ratio of Solar and Wind Surplus Electricity Supply for Hydrogen Production
4.2.1. Surplus Electricity Supply Ratio for Hydrogen Production with Different Solar Panel Areas
4.2.2. Ratio of Surplus Electricity Supply for Hydrogen Production with Different Numbers of Wind Turbines
4.3. Single-Parameter Sensitivity Analysis of Hydrogen Production
4.4. Primary Energy Reduction Rate and Carbon Emission Reduction Rate of Integrated Systems
4.5. Economic Benefit Analysis
5. Discussion
5.1. Feasibility of Application of the Integrated System
- (1)
- One is to directly supply energy to office buildings through hydrogen fuel cells, because office buildings can obtain greater energy savings and carbon reduction benefits.
- (2)
- Another is to build a hydrogen refueling station alongside the MECDES, and directly transport the hydrogen to the hydrogen refueling station for short-distance storage, reducing the high cost of long-distance hydrogen transportation.
5.2. Potential Challenges or Limitations of the Integrated System
- (1)
- The hydrogen produced by the integrated system needs to be stored on site. Hydrogen is a flammable and explosive gas, and the integrated system is located around the building, so there are certain challenges in the safe storage and safe operation of hydrogen. The integrated system requires safe storage of hydrogen and protective measures for safe use.
- (2)
- The integrated system requires a lot of high-temperature water vapor for hydrogen production. When the building’s cooling or heating load demand is large and the gas engine does not have excess smoke for the production of high-temperature water vapor, it needs to generate additional high-temperature water vapor through the gas boiler for hydrogen production, to consume the surplus electricity from renewable energy. Otherwise, the surplus electricity will have to be stored in batteries or returned to the grid. Therefore, the selected waste heat recovery boiler needs to be a boiler that can generate water vapor by burning natural gas or an additional gas-fired boiler needs to be set up.
- (3)
- The produced hydrogen needs to be used on site to bring economic benefits. If the produced hydrogen is stored at high pressure and transported for long distance, the profit rate of hydrogen production will decrease or there may even be no economic benefits. Therefore, in order to ensure the economic benefits of hydrogen production, it is necessary to use or sell produced hydrogen on site.
5.3. Limitations of the Study
6. Conclusions
- (1)
- This study proposes a multi-energy complementary distributed energy system that integrates waste heat and surplus electricity to produce hydrogen. This system can store the waste heat of the GE and the surplus electricity of solar and wind energy as hydrogen energy. Based on the proposed integrated system, a mathematical model was established to simulate the hydrogen production capacity of the integrated system. Through simulation analysis, the energy saving and carbon reduction effects of the integrated system in different types of buildings were verified, and the economic benefit of the integrated system was also verified.
- (2)
- Among different types of buildings, offices will experience the most significant impact effect on energy conservation and carbon reduction. The primary energy reduction rate ranges from 49.2 to 85.10%, and the carbon emission reduction rate ranges from 34.88 to 47.00%. When comparing Lishui City, Zhoushan City, Ningbo City, and Hangzhou City, four representative cities with similar building types in Zhejiang Province, Zhoushan City demonstrates the most effective energy-saving and carbon reduction measures. This indicates that cities with optimal solar and wind energy resources can achieve the best results through integrated multi-energy complementary distributed energy systems.
- (3)
- Comparing building type, the best energy-saving and carbon reduction effects of the integrated system are in office buildings, followed by hotels and hospitals. This indicates that the larger the variation in the hourly power load throughout the day, the greater the energy-saving and carbon reduction effect of the integrated system will be. When comparing cities, Zhoushan City will experience the most significant effect of energy saving and carbon reduction, followed by Ningbo City, Hangzhou City, and Lishui City. This shows that cities with higher renewable energy generation obtain better energy saving and carbon reduction effects by using integrated systems.
- (4)
- The hydrogen produced by the integrated system can supply energy to the building through the hydrogen fuel cell in CCHP mode, resulting in additional energy savings and carbon reduction compared with traditional energy supply methods. Among the three types of buildings, office buildings will undergo the most significant impact on energy conservation and carbon reduction, with a primary energy reduction rate of 2.86–3.04% and a carbon emission reduction rate of 12.67–14.26%.
- (5)
- The integrated system has good economic benefits for hydrogen production. The earnings from hydrogen are greater than the cost of hydrogen production, and the annual profit rate of hydrogen production is about 70% in office buildings, 68% in hotel buildings, and 91% in hospital buildings. Because hospital buildings have a stable hourly cooling and heating load, most of the time the hydrogen production is powered by renewable energy, and the cost of hydrogen production is low. Hospital buildings have the highest profit rate of hydrogen production.
- (6)
- Through the parameter sensitivity analysis, it can be seen that the wind speed and the refrigeration and heating coefficients of the LBARHM greatly affect the hydrogen production of the integrated system. The lower the wind speed, the more hydrogen will be produced. The greater the refrigeration coefficient and heating coefficient, the more hydrogen will be produced.
Author Contributions
Funding
Institutional Review Board Statement
Informed Consent Statement
Data Availability Statement
Conflicts of Interest
Nomenclature
| CCHP | combined cooling heating and power |
| MECDES | multi-energy complementary distributed energy system |
| MNGHPE | miniaturized natural gas hydrogen production equipment |
| GE | gas engine |
| LBARHM | lithium bromide absorption refrigerating and heating machine |
| WHRB | waste heat recovery boiler |
| WVNGM | water vapor and natural gas mixer |
| HE | heat exchange |
| GB | gas burner |
| NGR | natural gas reformer |
| NGD | natural gas desulfurizer |
| GC | gas compressor |
| MC | medium converter |
| GLS | gas–liquid separator |
| PSA | pressure swing adsorption |
| OGT | off gas tank |
| PSA | pressure swing adsorption |
References
- Omidvar, M.R.; Khanmohammadi, S.; Shababi, Z.; Kumar, R. Performance assessment and exergy analysis of hydrogen production from natural gas in a petrochemical unit (A real case study). Hydrog. Energy 2023, 5, 320–334. [Google Scholar] [CrossRef]
- Kwon, H.; Do, T.N.; Kim, J. Energy-efficient liquid hydrogen production using cold energy in liquefied natural gas: Process intensification and techno-economic analysis. Clean. Prod. 2022, 380, 135034. [Google Scholar] [CrossRef]
- Building Energy Consumption and Carbon Emission Data Platform of China. Available online: www.cbeed.cn (accessed on 10 January 2023).
- Jianguo, H.; Shan, T.; Zhang, C.; Song, P.; Zheng, H.; Wang, X.; Sui, Y.; Wang, L. Current situation and development trend analysis of small skid mounted natural gas hydrogen production. Technol. Nat. Gas Chem. Ind. 2021, 46, 1–6. [Google Scholar]
- Zhang, C.; Song, P.; Xiao, L.; Zhang, Y.; Wang, X.; Hou, J.; Wang, X.; Lu, L. Research and development of on-site small skid-mounted natural gas to hydrogen generator in China. Hydrog. Energy 2023, 48, 18601–18611. [Google Scholar] [CrossRef]
- Asakura, T.; Mori, T.; Tanaka, T.; Azuma, T. Development of on-site hydrogen production system based on SMR. Press. Technol. 2024, 42, 115–120. [Google Scholar]
- Weber, C.; Shah, N. Optimisation based design of a district energy system for an eco-town in the United Kingdom. Energy 2011, 36, 1292–1308. [Google Scholar] [CrossRef]
- Omu, A.; Choudhary, R.; Boies, A. Distributed energy resource system optimisation using mixed integer linear programming. Energy Policy 2013, 61, 249–266. [Google Scholar] [CrossRef]
- Ren, H.; Gao, W. A MILP model for integrated plan and evaluation of distributed energy systems. Appl. Energy 2010, 87, 1001–1014. [Google Scholar] [CrossRef]
- Falke, T.; Krengel, S.; Meinerzhagen, A.-K.; Schnettler, A. Multi-objective optimization and simulation model for the design of distributed energy systems. Appl. Energy 2016, 184, 1508–1516. [Google Scholar] [CrossRef]
- Di Somma, M.; Yan, B.; Bianco, N.; Graditi, G.; Luh, P.B.; Mongibello, L.; Naso, V. Multi-objective design optimization of distributed energy systems through cost and exergy assessments. Appl. Energy 2017, 204, 1299–1316. [Google Scholar] [CrossRef]
- Mavromatidis, G.; Orehounig, K.; Carmeliet, J. Design of distributed energy systems under uncertainty: A two-stage stochastic programming approach. Appl. Energy 2018, 222, 932–950. [Google Scholar] [CrossRef]
- Yurou, Z. Study on optimization of multi-energy complementary distributed energy systems. Energy Conserv. 2018, 3, 127–128. [Google Scholar]
- Liu, H.; Zhang, L.; Zhang, J.; Wang, S.; Xie, Y. Research on the hybrid distributed energy system based on wind, solar and nature gas. Energy Conserv. Technol. 2020, 38, 60–65. [Google Scholar]
- Wang, Z.; Lei, B.; Xu, L.; Tian, L.; Gao, S. Optimization of multi-energy complementary distributed energy and integrated energy management system. Microcomput. Appl. 2021, 37, 119–122. [Google Scholar]
- Jiang, J.; Hu, J.; Cui, M.; Tian, H. Integration of hydrogen production and waste heat recovery in electrochemical wastewater treatment. Renew. Energy 2012, 43, 179–182. [Google Scholar] [CrossRef]
- Li, P.-J.; Hung, T.-C.; Pei, B.-S.; Lin, J.-R.; Chieng, C.-C.; Yu, G.-P. A thermodynamic analysis of high temperature gas-cooled reactors for optimal waste heat recovery and hydrogen. Prod. Appl. Energy 2012, 99, 183–191. [Google Scholar] [CrossRef]
- Tolku, E.; Avci, A.C.; Kaygusuz, K.; Gur, M. A research on hydrogen production from industrial waste heat by thermal water splitting. Hydrog. Energy 2016, 41, 10071–10079. [Google Scholar]
- Chen, J.; Ge, W.; Wang, Z. Process introduction and cost analysis of hydrogen production from natural gas. Gas Heat 2017, 37, 8–11. [Google Scholar]
- Luo, S.; Fu, J.; Zhou, Y.; Yi, C. The production of hydrogen-rich gas by catalytic pyrolysis of biomass using waste heat from blast-furnace slag. Renew. Energy 2017, 101, 1030–1036. [Google Scholar] [CrossRef]
- Ishaqa, H.; Dincer, I.; Naterer, G.F. New trigeneration system integrated with desalination and industrial waste heat recovery for hydrogen. Prod. Appl. Therm. Eng. 2018, 142, 767–778. [Google Scholar] [CrossRef]
- Zheng, B.; Sun, P.; Meng, J.; Liu, Y.; Wang, G.; Tang, S.; Xu, J.; Zhang, K. Effects of fin structure size on methane-steam reforming for hydrogen production in a reactor heated by waste heat. Hydrog. Energy 2020, 45, 20465–20471. [Google Scholar] [CrossRef]
- Zheng, Z.; Liu, T.; Liu, Q.; Lei, J.; Fang, J. A distributed energy system integrating SOFC-MGT with mid-and-low temperature solar thermochemical hydrogen fuel. Prod. Hydrog. Energy 2021, 46, 19846–19860. [Google Scholar] [CrossRef]
- Wang, F.; Wang, L.; Ou, Y.; Lei, X.; Yuan, J.; Liu, X.; Zhu, Y. Thermodynamic analysis of solid oxide electrolyzer integration with engine waste heat recovery for hydrogen. Prod. Case Stud. Therm. Eng. 2021, 27, 101240. [Google Scholar] [CrossRef]
- Pashchenko, D. Thermochemical waste-heat recuperation as on-board hydrogen production. Technol. Hydrog. Energy 2021, 46, 28961–28968. [Google Scholar] [CrossRef]
- Alali, A.E.; Abulawi, Z.B.; Obeidat, A.Y.M. Assessment of thermal performance improvement of GT-MHR by waste heat utilization in power generation and hydrogen. Prod. Hydrog. Energy 2021, 46, 22719–22734. [Google Scholar] [CrossRef]
- Wang, Z.; Wang, Y.; Zhang, C.; Ye, G. Study progress and exploration of small scale hydrogen production technology by natural gas. Sol. Energy 2022, 5, 40–47. [Google Scholar]
- Cao, Y.; Hani, E.H.B.; Mansir, I.B.; Mehdi, S. Design analysis and tri-objective optimization of a novel integrated energy system based on two methods for hydrogen production: By using power or waste heat. Hydrog. Energy 2022, 47, 26574–26588. [Google Scholar] [CrossRef]
- Cao, Y.; Dhahad, H.A.; Sharma, K.; El-Shafay, A.S.; Ahmed, A.N.; Shamseldin, M.A.; Almojil, S.F.; Almohana, A.I.; Alali, A.F.; Farhang, B. Techno-economic evaluation and parametric study of generating green hydrogen from waste heat recovery of efficient solid oxide fuel cell. Hydrog. Energy 2022, 47, 26632–26645. [Google Scholar] [CrossRef]
- Parsa, S.; Jafarmadar, S.; Neshat, E. Application of waste heat in a novel trigeneration system integrated with an HCCI engine for power, heat and hydrogen. Prod. Hydrog. Energy 2022, 47, 26303–26315. [Google Scholar] [CrossRef]
- Cao, Y.; Hani, E.H.B.; Khanmohammadi, S.; Ahmadi, P. The optimum solution for a biofuel-based fuel cell waste heat recovery from biomass for hydrogen. Prod. Fuel 2022, 317, 123380. [Google Scholar] [CrossRef]
- Ozturk, M.; Dincer, I. Utilization of waste heat from cement plant to generate hydrogen and blend it with natural gas. Hydrog. Energy 2022, 47, 20695–20704. [Google Scholar] [CrossRef]
- Ismail, M.M.; Dincer, I. Development and evaluation of an integrated waste to energy system based on polyethylene plastic wastes pyrolysis for production of hydrogen fuel and other useful commodities. Fuel 2023, 334, 126409. [Google Scholar] [CrossRef]
- Kubilay, B. Determination of hydrogen production performance with waste exhaust gas in marine diesel engines. Hydrog. Energy 2023, 52, 1319–1333. [Google Scholar]
- Nasser, M.; Hassan, H. Assessment of hydrogen production from waste heat using hybrid systems of Rankine cycle with proton exchange membrane/solid oxide electrolyzer. Hydrog. Energy 2023, 47, 7135–7153. [Google Scholar] [CrossRef]
- Sharafilaleh, S.; Zeinali, M.; Mahmoudi, S.M.S.; Soltani, S.; Rosen, M.A. Biomass co-fired combined cycle with hydrogen production via proton exchange membrane electrolysis and waste heat recovery: Thermodynamic assessment. Hydrog. Energy 2023, 48, 33795–33809. [Google Scholar] [CrossRef]
- Ali, A.H.; Ahmed, A.M.; Abdel-Khaliek, A.A.; El Khalik, S.A.; Abass, S.M.; Shaban, M.; Rabia, M. Preparation of inorganic lead-free CuO/Cs2SnCl6-KI perovskite for green hydrogen production from wastewater by using solar. Energy Photochem. Photobiol. 2023, 445, 115102. [Google Scholar] [CrossRef]
- Ge, Y.; Han, J.; Zhu, X.; Zhu, W.; Yang, J. A combined cooling, heating and power system with energy storage of waste heat to hydrogen. Appl. Therm. Eng. 2023, 225, 120224. [Google Scholar] [CrossRef]
- Vallejo, M.C.G.; Alzate, C.A.C. Prefeasibility analysis of biomass gasification and electrolysis for hydrogen. Prod. Environ. Res. 2023, 118003. [Google Scholar]
- Cheng, G.; Zhao, E.L.Y.; Yang, Y.; Chen, B.; Cai, Y.; Wang, X.; Dong, C. Analysis and prediction of green hydrogen production potential by photovoltaic-powered water electrolysis using machine learning in China. Energy 2023, 284, 129302. [Google Scholar] [CrossRef]
- Karayel, G.K.; Dincer, I. A study on green hydrogen production potential of Canada with onshore and offshore wind. J. Cleaner Prod. 2024, 140660. [Google Scholar] [CrossRef]
- Arslan, M.; Yilmaz, C. Development of models for green hydrogen production of Turkey geothermal Resources: A case study demonstration of thermodynamics and thermoeconomics analyses. Fuel 2024, 359, 130430. [Google Scholar] [CrossRef]
- Zhang, T.; Guan, X.; Zhang, Z.; Wang, B.; Qu, J.; Zeng, W.; Guo, X.Y.L. Photothermal catalytic hydrogen production coupled with thermoelectric waste heat utilization and thermal energy storage for continuous power generation. Nano Energy 2024, 121, 109273. [Google Scholar] [CrossRef]
- Fang, H.; Xia, J.; Zhu, K.; Su, Y.; Jiang, Y. Industrial waste heat utilization for low temperature district heating. Energy Policy 2013, 62, 236–246. [Google Scholar] [CrossRef]
- Ziolkowski, P.; Kowalczyk, T.; Kornet, S.; Badur, J. On low-grade waste heat utilization from a supercritical steam power plant using an ORC-bottoming cycle coupled with two sources of heat. Energy Convers. Manag. 2017, 146, 158–173. [Google Scholar] [CrossRef]
- Köfinger, M.; Schmidt, R.R.; Basciotti, D.; Terreros, O.; Baldvinsson, I.; Mayrhofer, J.; Moser, S.; Tichler, R.; Pauli, H. Simulation based evaluation of large scale waste heat utilization in urban district heating networks: Optimized integration and operation of a seasonal storage. Energy 2018, 159, 1161–1174. [Google Scholar] [CrossRef]
- Li, Y.; Wang, W.; Ma, Y.; Li, W. Study of new cascade heating system with multi-heat sources based on exhausted steam waste heat utilization in power plant. Appl. Therm. Eng. 2018, 136, 475–483. [Google Scholar] [CrossRef]
- Akhan, H.; Eryener, D. Building integrated solar air heating with waste heat utilization. Energy Convers. Manag. 2018, 157, 136–145. [Google Scholar] [CrossRef]
- Liu, Y.; Han, J.; You, H. Exergoeconomic analysis and multi-objective optimization of a CCHP system based on LNG cold energy utilization and flue gas waste heat recovery with CO2 capture. Energy 2020, 190, 116201. [Google Scholar] [CrossRef]
- Chu, C.; Wang, X.; Niu, Y. Capacity optimization of multi-energy complementary distributed energy system with seasonal thermal energy storage. Dist. Heat. 2022, 1, 127–136. [Google Scholar]
- Wang, Y.; Chen, H.; Wang, H.; Xu, G.; Lei, J.; Huang, Q.; Liu, T.; Li, Q. A novel carbon dioxide capture system for a cement plant based on waste heat utilization. Energy Convers. Manag. 2022, 257, 115426. [Google Scholar] [CrossRef]
- Li, Y.; Liu, Y.; Zhang, G.; Yang, Y. Thermodynamic analysis of a novel combined cooling and power system utilizing liquefied natural gas (LNG) cryogenic energy and lowtemperature waste heat. Energy 2020, 199, 117479. [Google Scholar] [CrossRef]
- Wang, Y.; Ying, C.; Kai, W.; Xuefei, L. Performance evaluation and thermal analysis of heat pipe flue gas waste heat utilization system. Energy Rep. 2022, 8, 210–217. [Google Scholar] [CrossRef]
- Wang, Y.; Shen, C.; Sun, P.; Li, C.; Zhang, C. Utilization of waste heat from commercial kitchen exhaust for water heating and dish drying. Build. Eng. 2020, 32, 101788. [Google Scholar] [CrossRef]
- Song, W.; Chen, X.; Huang, Y.; Jiang, R.; Zhou, J. Thermal analysis technology to utilize waste biomass and waste heat to produce high-quality combustible gas through simulations and experiments. Sci. Total Environ. 2023, 892, 163970. [Google Scholar] [CrossRef] [PubMed]
- Wallin, A.; Thomasson, T.; Abdurafikov, R. Urban low-to-medium deep borehole field regeneration with waste heat from energy efficient buildings: A techno-economic study in Nordic climate. Energy Build. 2023, 300, 113628. [Google Scholar] [CrossRef]
- Wang, L.; Huang, X.; Babaei, M.; Liu, Z.; Yang, X.; Yan, J. Full-scale utilization of geothermal energy: A high-efficiency CO2 hybrid cogeneration system with low-temperature waste heat. Clean. Prod. 2023, 403, 136866. [Google Scholar] [CrossRef]
- Wang, F.; Wang, L.; Zhang, H.; Xia, L.; Miao, H.; Yuan, J. Design and optimization of hydrogen production by solid oxide electrolyzer with marine engine waste heat recovery and ORC cycle. Energy Convers. Manag. 2021, 229, 113775. [Google Scholar] [CrossRef]
- Lan, Y.; Lu, J.; Mu, L.; Wang, S.; Zhai, H. Waste heat recovery from exhausted gas of a proton exchange membrane fuel cell to produce hydrogen using thermoelectric generator. Appl. Energy 2023, 334, 120687. [Google Scholar] [CrossRef]
- Valant, M.; Luin, U. Chemistry of the iron-chlorine thermochemical cycle for hydrogen production utilizing industrial waste heat. J. Cleaner Prod. 2024, 140681. [Google Scholar] [CrossRef]
- Mu, L.; Wang, S.; Lu, J.; Li, C.; Lan, Y.; Liu, G.; Zhang, T. Effect of hydrogen-enriched natural gas on flue gas waste heat recovery potential and condensing heat exchanger performance. Energy 2024, 286, 129591. [Google Scholar] [CrossRef]
- Zhao, X.; Chen, H.; Li, J.; Pan, P.; Gui, F.; Xu, G. Thermodynamic and economic analysis of a novel design for combined waste heat recovery of biogas power generation and silicon. Prod. Energy 2024, 290, 130272. [Google Scholar] [CrossRef]
- Takaaki, A.; Takumi, T.; Toyokazu, T.; Takayuki, A. Development of compact hydrogen production systems for H2 refueling stations. Jpn. Soc. Mech. Eng. 2005, 54, 31–32. [Google Scholar]
- GB/T 51350; The State Standard of the People’s Republic of China. Technical Standard for Nearly Zero Energy Buildings. China Building Industry Press: Beijng, China, 2019.
- Liu, Z.; Cui, Y.; Wang, J.; Yue, C.; Agbldjan, Y.S.; Yang, Y. Multi-objective optimization of multi-energy complementary integrated energy systems considering load prediction and renewable energy production uncertainties. Energy 2022, 254, 124399. [Google Scholar]
- Liu, X.; Chang, Y.; Yu, J.; Qi, G. Discussion on calculation method of utilization ratio of waste heat for gas pass heat recovery boiler. Regul. Stand. 2021, 37, 26–30. [Google Scholar]
- Calculation Formula of Solar Electricity Generation. Available online: https://www.Everenergy.com.cn/archives/321 (accessed on 6 June 2023).
- Hydrogen Fuel Cell Performance. Available online: https://news.panasonic.com/jp/press/jn211001-3 (accessed on 1 June 2023).
- Meteorological Data of China. Available online: https://xihe-energy.com/#climate (accessed on 6 January 2023).
- Tian, J.; Xu, S. A morphology-based evaluation on block-scale solar potential for residential area in central China. Sol. Energy 2021, 221, 332–347. [Google Scholar] [CrossRef]


| Technical Parameters of the Gas Engine | |||
|---|---|---|---|
| Power load rate | 100% | 75% | 50% |
| Electricity generating efficiency | 43.6% | 42.3% | 39.9% |
| Gas consumption (Nm3/h) | 974 | 750 | 527 |
| Smoke volume (kg/h) | 23,502 | 18,097 | 12,716 |
| Input energy (kW) | 9249 | 7129 | 5010 |
| Rated electricity generation (kW) | 4000 | 3000 | 2000 |
| Set of Data | Specification |
|---|---|
| Fuel | Natural gas |
| Natural gas inlet pressure | 0.5 Mpa |
| Hydrogen purity | More than 99.999 vol% |
| Hydrogen production capacity | 40 Nm3 Natural gas/100 Nm3 H2 |
| H2 production pressure | 0.75 Mpa |
| Electricity consumption | 4.5 kWh/h |
| Hydrogenation reaction temperature | 753.4 °C |
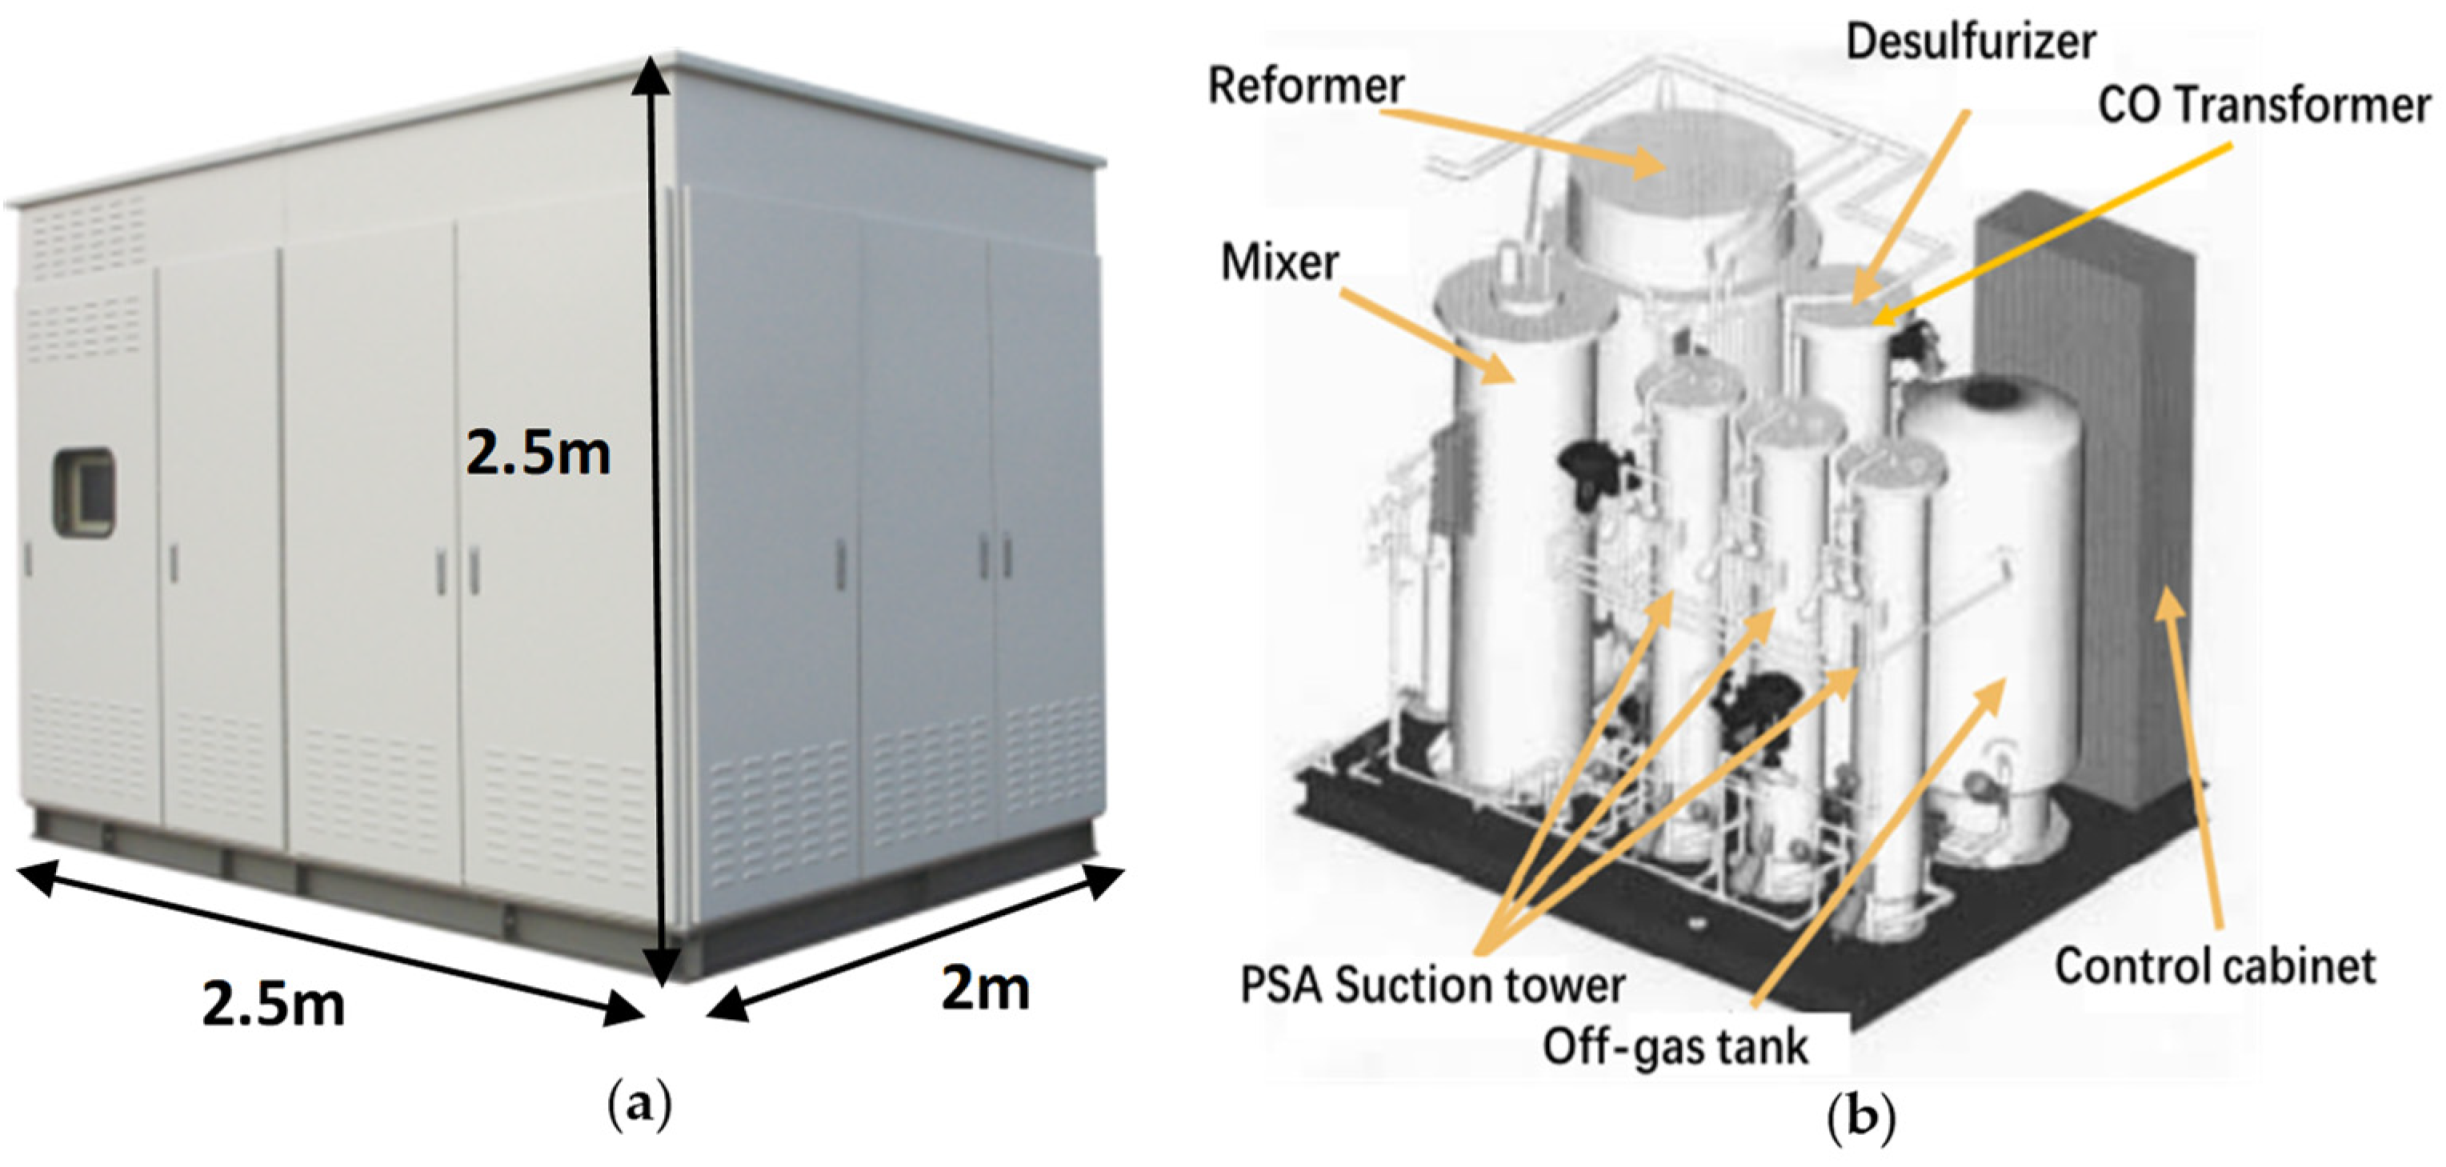
| Equipment configuration | Modularization (boiler, reformer, desulfurizer, PSA suction tower, etc.) |
| Operation | Button start, automatic load tracking, load rate range (40–100%) |
| Set area | 5.0 m2 (2 m × 2.5 m × 2.5 mH) |
| Gas Composition of Natural Gas | Percentage by Volume | |
|---|---|---|
| Methane (CH4) | 85% | |
| Ethane(C2H6) | 9% | |
| Propane (C3H8) | 3% | |
| - | Nitrogen (N2) | 2% |
| Butane (C4H10) | 1% |
| Parameters of the Hydrogen Fuel Cell | |
|---|---|
| Types of fuel cell | Solid polymer fuel cell (PEFC) |
| Type of fuel | Pure hydrogen (more than 99.97 vol%) |
| Generating electricity capacity | 5000 W |
| Hydrogen consumption | 2.976 Nm3/h |
| Heat dissipation under rated Conditions | 3480 W |
| Generating efficiency | 47.3% |
| Heat recovery efficiency | 32.9% |
| Reforming temperature | 753.4 °C |
| Office Buildings (%) | Hotel Buildings (%) | Hospital Buildings (%) | |||||||
|---|---|---|---|---|---|---|---|---|---|
| Time | General Electricity Demand | Demand for Cooling | Demand for Heating | General Electricity Demand | Demand for Cooling | Demand for Heating | General Electricity Demand | Demand for Cooling | Demand for Heating |
| 0:00 | 1.85 | 0.00 | 0.00 | 2.72 | 2.34 | 3.05 | 2.09 | 1.60 | 0.20 |
| 1:00 | 1.62 | 0.00 | 0.00 | 2.58 | 1.80 | 3.43 | 2.01 | 1.60 | 0.30 |
| 2:00 | 1.62 | 0.00 | 0.00 | 2.35 | 1.71 | 3.81 | 1.95 | 1.50 | 0.30 |
| 3:00 | 1.62 | 0.00 | 0.00 | 2.35 | 1.53 | 3.43 | 1.93 | 1.50 | 0.30 |
| 4:00 | 1.62 | 0.00 | 0.00 | 2.32 | 1.44 | 3.05 | 1.92 | 1.50 | 0.30 |
| 5:00 | 1.62 | 0.00 | 0.00 | 2.44 | 1.35 | 3.05 | 2.08 | 3.40 | 5.10 |
| 6:00 | 1.62 | 0.00 | 0.00 | 3.12 | 1.80 | 3.24 | 3.04 | 2.60 | 4.70 |
| 7:00 | 1.56 | 1.28 | 0.30 | 3.64 | 1.98 | 4.19 | 4.31 | 2.80 | 4.70 |
| 8:00 | 5.50 | 9.43 | 16.99 | 3.97 | 2.71 | 5.71 | 5.48 | 6.40 | 10.30 |
| 9:00 | 6.14 | 9.15 | 12.29 | 4.59 | 3.52 | 4.95 | 6.06 | 6.30 | 8.30 |
| 10:00 | 6.67 | 9.00 | 8.09 | 5.00 | 3.61 | 5.14 | 6.18 | 6.60 | 7.50 |
| 11:00 | 6.90 | 9.22 | 10.29 | 5.30 | 3.61 | 4.95 | 6.17 | 6.80 | 6.90 |
| 12:00 | 6.90 | 9.00 | 10.49 | 5.37 | 7.13 | 4.95 | 5.98 | 6.90 | 6.40 |
| 13:00 | 6.90 | 9.22 | 10.29 | 5.39 | 7.22 | 5.14 | 6.01 | 6.10 | 5.20 |
| 14:00 | 6.90 | 9.30 | 8.39 | 5.33 | 8.68 | 4.95 | 6.11 | 6.10 | 5.00 |
| 15:00 | 6.90 | 10.23 | 8.19 | 5.38 | 6.49 | 6.10 | 6.01 | 6.30 | 4.80 |
| 16:00 | 6.90 | 9.00 | 9.09 | 5.48 | 6.58 | 7.24 | 5.80 | 6.30 | 4.90 |
| 17:00 | 6.90 | 9.22 | 5.59 | 5.62 | 6.67 | 6.86 | 5.30 | 6.20 | 5.00 |
| 18:00 | 6.84 | 5.37 | 0.00 | 5.46 | 6.94 | 6.10 | 4.98 | 5.80 | 5.00 |
| 19:00 | 3.37 | 0.29 | 0.00 | 5.25 | 7.03 | 5.33 | 4.70 | 3.20 | 3.50 |
| 20:00 | 3.13 | 0.29 | 0.00 | 4.81 | 6.85 | 1.52 | 4.09 | 3.10 | 3.50 |
| 21:00 | 2.65 | 0.00 | 0.00 | 4.31 | 4.51 | 1.14 | 3.03 | 3.00 | 3.60 |
| 22:00 | 2.26 | 0.00 | 0.00 | 4.23 | 2.34 | 0.00 | 2.50 | 2.80 | 4.00 |
| 23:00 | 2.02 | 0.00 | 0.00 | 3.00 | 2.16 | 2.67 | 2.25 | 1.60 | 0.20 |
| Total | 100 | 100 | 100 | 100 | 100 | 100 | 100 | 100 | 100 |
| Parameters | Initial Value |
|---|---|
| Solar panel area/(m2) | 100,000 |
| Number of wind turbines | 10,000 |
| Annual average wind speed/(m/s) | 6.18 |
| Annual average horizontal radiation/(W/m2) | 167.95 |
| Refrigeration coefficient of LBARHM | 1.05 |
| Heating coefficient of LBARHM | 1.75 |
| Year | Natural Gas Converted into Standard Coal (10,000 tons Standard Coal/100,000,000 m3 Natural Gas) | Electricity Converted into Standard Coal (10,000 Tons Standard Coal/100,000,000 kWh Electricity) | Carbon Emission Factor of Electricity (10,000 Tons CO2/100,000,000 kWh Electricity) | Carbon Emission Factor of Electricity (ton CO2/Standard Coal) | Carbon Emission Factor of Coal (Ton Carbon Emission/Standard Coal) | Carbon Emission Factor of Natural Gas (kgCO2/MJ) |
|---|---|---|---|---|---|---|
| 2020 | 12.338535 | 2.83258 | 4.966 | 1.75317 | 2.66 | 0.056 |
| 2021 | 12.338535 | 2.83258 | 4.821 | 1.70195 | 2.66 | 0.056 |
| 2022 | 12.338535 | 2.83258 | 4.550 | 1.60615 | 2.66 | 0.056 |
| Natural Gas/Fuel (USD/m3) | Hydrogen (USD/kg) | Industrial Water (USD/kg) | Commercial Electricity (USD/kWh) | |||
|---|---|---|---|---|---|---|
| Price | 0.548660 | 4.71660 | 0.000742 | Rush time period | 8:00~11:00 | 0.118804 |
| 13:00~19:00 | ||||||
| 21:00~22:00 | ||||||
| Peak time period | 19:00~21:00 | 0.125776 | ||||
| Trough period | 11:00~13:00 | 0.051688 | ||||
| 22:00~8:00 | ||||||
Disclaimer/Publisher’s Note: The statements, opinions and data contained in all publications are solely those of the individual author(s) and contributor(s) and not of MDPI and/or the editor(s). MDPI and/or the editor(s) disclaim responsibility for any injury to people or property resulting from any ideas, methods, instructions or products referred to in the content. |
© 2024 by the authors. Licensee MDPI, Basel, Switzerland. This article is an open access article distributed under the terms and conditions of the Creative Commons Attribution (CC BY) license (https://creativecommons.org/licenses/by/4.0/).
Share and Cite
Yu, S.; Yang, Y.; Chen, S.; Xing, H.; Guo, Y.; Feng, W.; Zhang, J.; Zhang, J. Study on the Application of a Multi-Energy Complementary Distributed Energy System Integrating Waste Heat and Surplus Electricity for Hydrogen Production. Sustainability 2024, 16, 1811. https://0-doi-org.brum.beds.ac.uk/10.3390/su16051811
Yu S, Yang Y, Chen S, Xing H, Guo Y, Feng W, Zhang J, Zhang J. Study on the Application of a Multi-Energy Complementary Distributed Energy System Integrating Waste Heat and Surplus Electricity for Hydrogen Production. Sustainability. 2024; 16(5):1811. https://0-doi-org.brum.beds.ac.uk/10.3390/su16051811
Chicago/Turabian StyleYu, Shuai, Yi Yang, Shuqin Chen, Haowei Xing, Yinan Guo, Weijia Feng, Jianchao Zhang, and Junhan Zhang. 2024. "Study on the Application of a Multi-Energy Complementary Distributed Energy System Integrating Waste Heat and Surplus Electricity for Hydrogen Production" Sustainability 16, no. 5: 1811. https://0-doi-org.brum.beds.ac.uk/10.3390/su16051811