Article

Applying an Analytic Hierarchy Process and a Geographic Information System for Assessment of Land Subsidence Risk Due to Drought: A Case Study in Ca Mau Peninsula, Vietnam

1
Journal of Hydro-Meteorology, Information and Data Center, Viet Nam Meteorological and Hydrological Administration, Hanoi 10000, Vietnam
2
Faculty of Environmental Sciences, University of Science, Vietnam National University (VNU), Hanoi 10000, Vietnam
3
National Center for Hydrometeorological Forecasting, Viet Nam Meteorological and Hydrological Administration, Hanoi 10000, Vietnam
4
Faculty of Water Resources Engineering, Thuyloi University, Hanoi 10000, Vietnam
*
Author to whom correspondence should be addressed.
Sustainability 2024, 16(7), 2920; https://0-doi-org.brum.beds.ac.uk/10.3390/su16072920
Submission received: 6 February 2024 / Revised: 25 March 2024 / Accepted: 28 March 2024 / Published: 31 March 2024

Abstract

:
The increase in extreme weather events causes secondary hazards that can influence people and the environment enormously. The Ca Mau Peninsula is known as one of the areas most severely affected by drought, and excessive groundwater exploitation is one of the reasons leading to a higher risk of land subsidence. This study uses the Delphi method and the KAMET rule table to analyze and select indicators that affect subsidence. The study uses the analytic hierarchy process (AHP) analytical hierarchy method to evaluate the weights of influencing factors, combined with geographic information system (GIS) technology to overlay the map layers of the main influencing factors and build a subsidence risk warning zoning map of the study area. The influencing factors selected to evaluate the impact on land subsidence in the study area during the drought period included geological structure, soil characteristics, groundwater flow exploitation, water flow in the dry season, current land use status, and evaporation in the dry season. The weights of these factors were evaluated based on the synthesis of relevant documents as well as consultation with experts. The results indicate that nearly two-thirds of the Ca Mau Peninsula area is currently at very low or low risk of subsidence. Meanwhile, 23% of the area is at medium risk, nearly 9% is at high risk, and 0.1% of the study area is at very high risk. Subsidence risk warning zoning maps can provide a visual and general overview of areas with high subsidence risk, supporting managers in making reference plans for socio-economic development in the Ca Mau Peninsula.

1. Introduction

In recent years, there have been a number of studies around the world on susceptibility to subsidence and hazardous risk zoning. These studies have used many methods such as artificial neural networks [1,2]; synthetic aperture radar (SAR) interferometry and geospatial techniques [3,4,5]; the AHP method [6]; the finite element model [7]; machine learning models [8,9]; mapping based on remote sensing (RS); and the GIS [10]. Rezaei et al. [11] used the analytical hierarchy process model and certain factors to map the susceptibility to subsidence in the Ney-shabur aquifer. They created a map of effective subsidence parameters such as hydraulic conductivity, specific yield, water table drop, silt thickness, saturation thickness, compacted clay layer thickness, and underground water return capacity in a GIS environment. The results showed that the certain factor (CF) model produced higher prediction accuracy and a higher rate than the AHP model. But this study selected this method because of the current characteristics and data of the research area; the selected method can provide results with more reliable accuracy. Bhattarai and Kondoh [12] studied and analyzed naturally deposited fine-grained sediments that randomly create high porosity and contain water. As groundwater falls, these sediments are rearranged and compacted, leading to land subsidence. Chen et al. [13] used a land subsidence risk assessment model based on RS and GIS technology in Beijing using the Fuzzy AHP method. Their research determined the risk index of each study area using the Fuzzy AHP method and showed that land subsidence in Beijing is unavoidable. This result is very useful for the prevention and mitigation of natural disasters related to land subsidence. Research on land subsidence due to groundwater exploitation has been carried out in many cities such as Mashhad [14], Neyshabur, and Kashmar [15,16,17]. The Neyshabur Delta is largely overexploited due to uncontrolled irrigation and unsustainable agricultural practices [18]. Due to increases in population and water use, the regulation and enforcement of pumping are inadequate, so subsidence is an increasing problem in the Neyshabur Delta [16].
In Vietnam, a number of studies applying the AHP method and GIS technology in risk mapping have been carried out; for example, Tuyen et al. [19] used a geographic information system (GIS) to assess and zone the risk of landslides. Land subsidence in the karst area in Phong Dien, Thua Thien Hue, was mapped according to the AHP level analysis process. GIS data layers were built from geological maps, geophysical measurement data, groundwater simulation results from MIKE SHE, and blasting monitoring data. The landslide risk level index was calculated on the GIS platform by synthesizing component factors and weighting those factors. Trung et al. [20] used the method of integrating the GIS and the AHP hierarchical model to build a zoning map of the level of arsenic pollution in groundwater. Hao et al. [21] applied AHP methods and a GIS to evaluate land suitability for paddy rice crops in Quang Xuong district, Thanh Hoa province. Tran and Hoang [22] assessed flash flood risks based on the AHP and GIS in a case study of the Hieu catchment (Nghe An, Vietnam). Thanh et al. [23] approached this topic using a “Danger zoning map”. The landslide risk of Da Lat City was established using the AHP hierarchical analysis method and a geographic information system. The results showed that 94.8% of landslides occurred in moderate to very high-risk areas. Areas with landslide risk from extremely low to low, medium, high, and very high accounted for 21.76%, 36.14%, 21.15%, 15.91%, and 5.04% of the study area, respectively. Tuan and Tuyet [24] introduced a method for building landslide risk maps based on the integration of AHP and GIS hierarchical models with a database of natural topographic and geological conditions, morphology, geology, hydrogeology, hydrometeorology, land cover, etc. The results identified and zoned points with high risks of landslides that directly affect the population. In the southern region of Vietnam, there have also been a number of studies evaluating the risk of subsidence and soil erosion. A study used the AHP method to evaluate the risk of riverbank erosion in the downstream area of the Dong Nai river system [25]. Loi and Tuan [26] researched and evaluated the possibility of applying radar RS images to monitor ground subsidence in Can Tho city. The continuous scattering interferometry method Persistent Scatterer SAR Interferometry (PSInSAR) was used on multi-temporal Sentinel-1 satellite images to analyze land subsidence. The study results show that the use of radar RS images in land subsidence monitoring is potentially applicable to Can Tho.
Some studies have been conducted on land subsidence in the Mekong Delta and the correlation between land subsidence and groundwater exploitation [27,28,29,30,31,32]. Currently, Interferometric Synthetic Aperture Radar (InSAR) data based on satellite images are the only source of time-series data on surface elevation allowing estimates of subsidence rates. According to Erban et al. [28], the corresponding time-series assessment results from 2006 to 2010 show that the total subsidence rate at groundwater monitoring stations throughout the Mekong Delta reached about 1–4 cm/year, averaging 1.6 cm/year. If groundwater pumping continues at the current capacity, the rate of subsidence by 2050 is forecast to be about 0.88 m (0.35–1.4 m). Karlsrud and Vangalsten [30] used InSAR technology, and their study results show that the land area in Ca Mau is located at an altitude of less than 1.5 m above sea level. Thus, subsidence has reached 40–80 cm in some places and the current rate of subsidence may correspond to 2–4 cm/year. Recently, satellite-based data using InSAR (Interferometric Synthetic Aperture Radar) technology confirmed that significant subsidence is occurring in all provinces in Vietnam south of Ho Chi Minh City. The subsidence due to groundwater pumping is estimated to be about 2–4 cm/year. In their latest study, Minderhoud et al. [32] applied a delta-wide approach to calculate a groundwater flow model of the entire aquifer system, combined with a geotechnical subsidence model. Research results show that the rate of subsidence has increased rapidly since groundwater was overexploited in the 1990s, with the current rate being between 1–2 cm/year and about 3 cm/year in rural areas. In cities and industrial zones, the average subsidence rate is 1.2 cm/year.
An overview of domestic and foreign studies and research areas shows that the combination of the AHP method with GIS analysis and assessment technology has been very effective in identifying and assessing the risk of subsidence in some areas in Vietnam excluding the Ca Mau Peninsula [19,20]. There have been many studies using modeling combined with RS to evaluate the impact of subsidence due to lowering groundwater levels [22,23,24,25,26,27,28,29,32,33]. Most studies evaluate subsidence due to the impacts of structures and bank landslides that cause the subsidence of surrounding land, but there are very few studies on subsidence due to the impact of prolonged drought. For example, Miller et al. [33] studied the persistent drought in the region beginning in 2012, intensifying in 2014, and abruptly alleviated by a wet period from December 2016 to February 2018. Wüest et al. [34] showed that property damage from drought-induced soil subsidence has risen dramatically across Europe. In France alone, subsidence-related losses have increased by more than 50% within two decades, costing affected regions an average of EUR 340 million per year. Charpentier et al. [35] proposed a method of approaching the costs and frequency of claims due to subsidence based on historical data. This study was applied through two main components: developing new drought indicators using Open Data and using parametric and tree-based models to model this risk. Modeling subsidence integrated meteorological and geological indicators to ascertain the factors predisposing a policy to subsidence. Currently, the problem of subsidence in Ca Mau peninsula area has been studied, however, the previous studies only consider the relationship with the groundwater exploitation [30,31,32]. There have been no studies assessing the risk of subsidence due to drought. This is one of the novelties of this study. The study uses the Delphi method and the KAMET rule table to analyze and select indicators that affect subsidence. The Delphi method is a systematic qualitative research method based on the judgment of individuals identified as experts in the topic under consideration [36]. It provides an iterative solution to achieve general expert consensus on scores or when responses achieve a certain level of stability [37]. In addition, the KAMET rule provides a quantitative threshold to stop further rounds of Delphi questionnaires. This process includes selecting experts, receiving feedback from experts, and checking for qualifications according to the KAMET code of conduct. Since then, many practical applications of the method have been carried out in many fields, in which the field of hydrology and water resource management has been and is being applied [38,39,40,41].
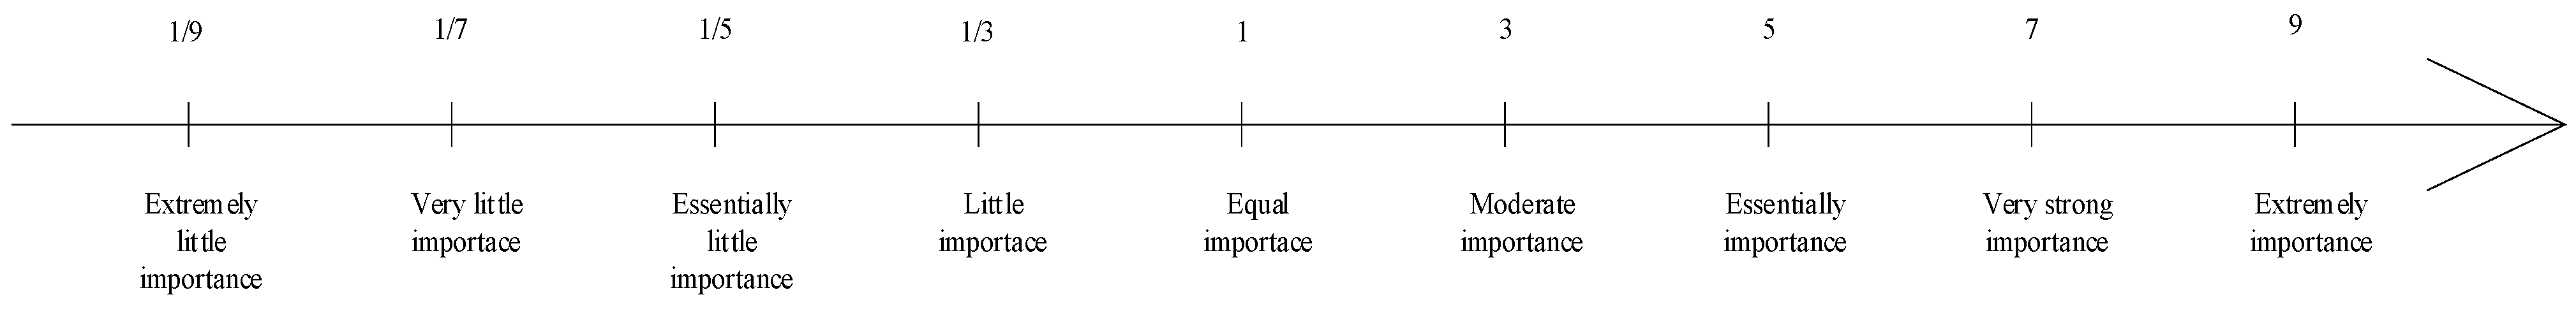
The results can be used to assess the risk of subsidence due to prolonged drought in areas with similar characteristics to the Ca Mau peninsula. This is an area severely affected by drought, prolonged saltwater intrusion, and river water decline, which lead to increased groundwater exploitation. There is no exogenous flow. The study results answered the following question: how does drought affect land subsidence? Thus, this study established a map of subsidence risk due to drought that fully considers the factors (location of underground water flow exploitation, flow volume in the dry season, evaporation in the dry season, geological characteristics, soil characteristics, and land use) that influence the risk of subsidence. For this study, we use the Delphi method and the KAMET rule table to analyze and select indicators. After that, we selected the AHP research method combined with GIS technology to build a zoning map of subsidence risk because of drought in the Ca Mau Peninsula area, Vietnam. The objectives of this study were: (1) to apply the AHP method to determine the weights of factors affecting drought’s impact on subsidence in the Ca Mau Peninsula area and (2) to apply GIS technology to overlay map layers and determine subsidence risk zones in the Ca Mau Peninsula area. The high-risk subsidence maps will provide great support to managers and planners providing structural and non-structural solutions that contribute to the sustainable development goal of “climate action” and improve resilience and adaptability in the context of climate change.

2. Materials and Methods

2.1. Description of the Study Site

The Ca Mau Peninsula is in the southernmost province of the country, with geographical coordinates from 8°34′ to 9°33′ north and from 104°43′ to 105°25′ east, with 3 sides bordering the sea. The eastern region of the peninsula borders the East Sea, western and southern regions border the Gulf of Thailand, and the northern region borders Bac Lieu and Kien Giang provinces (Figure 1). The Ca Mau Peninsula has a natural area of 522,119 hectares, accounting for 13.13% of the Mekong Delta area and 1.58% of the country’s area. The coastline is 254 km long; the west coast is 147 km long, and the east coast is 107 km long. Collapse and subsidence during the dry season are common in the freshwater region of Ca Mau Province. Therefore, this study focused on identifying the main factors of influencing subsidence, using the AHP method to determine the weights of influencing factors and applying GIS technology to compile maps of locations at risk of subsidence in Ca Mau province.

2.2. Methodology

The procedure implemented in this study is presented in Figure 2.
This research used the Delphi method and the KAMET rule table to analyze and select indicators that affect subsidence. The GIS tool was used to analyze maps of component factors (location of underground water flow exploitation, groundwater flow exploitation, flow volume in the dry season, evaporation in the dry season, geological characteristics, soil characteristics, and land use) and determine the weighting factors using the AHP method. The component factors and weight factors were synthesized to derive a subsidence risk zoning map of the Ca Mau Peninsula (Figure 2).

2.2.1. The Delphi Method and the KAMET Rule

Many factors can potentially cause subsidence in the study area. To determine the main factors suitable for the study area, we ensured that representative data could be measured and were easy to put into a formula for assessment, and ensured the quality of data to calculate and analyze the level of impact. This study used the Delphi method and the KAMET rule table to analyze and select indicators affecting subsidence. The Delphi method is a systematic qualitative research method based on the assessments of individuals identified as experts on the topic under consideration [36]. It provides an iterative solution to achieve general expert consensus on scores or when responses achieve a certain level of stability [37]. In addition, the KAMET rule provides a quantitative threshold to stop further rounds of Delphi questionnaires. This process includes selecting experts, receiving feedback from experts, and checking for qualifications according to the KAMET code of conduct. The Delphi method was developed in the 1950s by Helmer and Dalkey [36] of the RAND corporation to solve a number of problems in military projects. Since then, many practical applications of the method have been carried out in many fields, and it has been applied in the field of hydrology and water resource management [38,39,40,41]. Questionnaires are designed to focus on problems, opportunities, solutions, or forecasts.
The next questionnaire is developed based on the results of the previous one. This process stops when the answer reaches consensus or when complete information has been exchanged [42]. This method requires the selected experts to have similar fields and expertise, thereby ensuring consistency in the results. The experts answer the questionnaires in two or more rounds. After each round, the experts are provided with an anonymous summary of the experts’ decisions in the previous round as well as the reasons they gave for those decisions. The process of selecting influencing factors using the Delphi method was carried out in 8 steps:
Step 1: Developing a detailed investigation plan.
Step 2: Selecting a group of experts involved in the consultation process. The selected experts included those working in the field of subsidence such as experts in hydrology, climate change, ecology, environment, irrigation, construction, etc., with similar qualifications (master’s degree or higher) and who were knowledgeable about the study area.
Step 3: Building a Delphi questionnaire: The questionnaire includes questions about indicators based on research overviews, approaches, and assessment of appropriateness of the research problem to seek advice from experts.
Step 4: First Delphi survey: Open-ended questionnaires were sent to each expert for consultation. The experts were asked to evaluate their level of agreement with the given set of indicators and targets. The level of consensus was arranged from 1 to 5 as follows: (i) very unrelated; (ii) unrelated; (iii) more or less related; (iv) related and (v) very related. Sample questions for the experts are presented in Table 1.
Step 5: Analyzing round 1 data. After receiving answers from the experts, the results were synthesized and analyzed based on the KAMET principles. These principles provided the level of importance of each index (qi) in each stage based on an assessment of a combination of statistical values including the median (Mdqi); quartile deviation (Qqi); mean (Mqi); and variance (Vqi). The variance was the rate that the experts changed their assessments (%). The KAMET rule is described in detail with 3 conditions for evaluation in Table 2.
Step 6: Sending the investigation results to the expert group. The questionnaires, after eliminating indicators or questions that did not satisfy the KAMET principles, continued to be sent to the experts.
Step 7: Second Delphi survey. The round 2 Delphi survey was conducted with a questionnaire after finishing round 1. Similarly to round 1, the Delphi team again conducted an analysis based on the KAMET principles. Statistical values included the median (Mdqi), quartile deviation (Qqi), average value (Mqi), and variance (Vqi), which were recalculated in this step. If all questions were approved or rejected, or the mean was higher than 3.5 and the variance was lower than 15%, the consultation method ended [43].
Step 8: Analyzing and synthesizing the results.

2.2.2. AHP Analytical Hierarchy Method

AHP is a hierarchical analysis method researched and developed by Saaty [44]. This method helps implementers choose the most suitable option by identifying and analyzing factors that influence and impact a problem that needs to be solved. Saaty provided a table to classify the importance of factors relative to each other.
The analytic hierarchy process (AHP) is a pairwise comparison method of measurement theory [44]. It divides problems into factors, then arranges them into a hierarchy chart. After that, the value of each factor is compared to determine the most significant factor and choice [45,46]. Saaty [44] set up a fundamental scale with 9 levels of intensity, as shown in Figure 3.
Consistency in comparing pairs is essential. The consistency ratio (CR) is used to determine the level of inconsistency of statements in the AHP method. The process of calculating the consistency index includes the following steps:
-
Determine the total weight vector by multiplying the original pair’s comparison matrix by the weight matrix of the influencing factors.
-
Determine the consistency vector by dividing the total weight vector by the weights of the previously determined factors.
-
Calculate the largest eigenvalue (λmax) by taking the average value of the consistency vector.
The consistency index (CI) is an index that measures the degree of consistency deviation and is determined according to the following formula:
C I = λ max 1 n 1
where λmax is the mean value of the consistency vector and n is the number of criteria.
The consistency ratio (CR) is calculated according to the following formula:
C R = C I R I
where RI is a random index that depends on the number of factors being compared with each other and is determined as shown in Table 3. The random index (RI) [44] shows the average values for matrices of orders 1 to 10 using a sample size of 500.
If the CR value is less than 10%, the result is acceptable; otherwise, the previous steps must be reconsidered. After obtaining the weight of each influencing factor, the GIS tool is used to conduct a zoning assessment to give a score for each specific factor and calculate the total score by overlaying the component maps.

2.2.3. Methods of Overlaying Influencing Factors Using GIS Techniques to Build Subsidence Maps

Map Superposition Method

The geographic information system (GIS) allows the construction of spatial analysis, management, integration, and overlay of information layers. The AHP hierarchical analysis model supports the GIS, synthesizes information, and assigns the most appropriate weights to selected factors. After decentralizing and calculating the weights of the factors, the general integration gives locations with potential subsidence.
The information is standardized and weighted according to different levels of importance. The formula has the following form:
C = Wgeo × YTgeo + Wsoil × YTsoil + Wgw × YTgw + Wflow × YTflow + Wland × YTland + Weva × YTeva
where C is the index that characterizes locations with potential for subsidence; Wgeo, Wsoil, Wgw, Wflow, Wland, and Weva are the weights depending on the importance of the influencing factors; and YTgeo, YTsoil, YTgw, YTflow, YTland, and YTeva are the influencing factors (geology, soil, groundwater flow exploitation, dry-season flow, dry-season evaporation, and land use).
From the results of determining this C index, a map of locations at risk of subsidence was created. This map was verified with actual data. If the results did not match the actual data, the data put into the GIS were rechecked, including the number of factors and the weight of each factor. A diagram of this study’s structure is presented in Figure 2.

Standardize Assessment Criteria

The evaluation criteria needed to be standardized according to a common scale so they could be compared with each other. This process divided the classes within each parameter into 5 levels of sensitivity to land subsidence: very low, low, medium, high, and very high (Table 4). In principle, the evaluation scale for each parameter was made by calculating the density of the subsidence points investigated on each layer of factor parameters. Based on this density, the scale was calculated and classified according to the 5 levels above. The current subsidence factor was used to evaluate the levels of standardization and accuracy of the subsidence risk map in the study area.
Table 4 is a scale showing the influence of each factor on subsidence during drought periods. Each influencing factor is divided into different groups, and the influence level of each group is evaluated according to the sensitivity levels of very high, high, medium, low, and very low. The values are taken according to the monthly rating levels shown in Figure 3.

2.2.4. Data Collection

Based on documents on subsidence in the study area, the main long-term cause is the groundwater exploitation process, in addition to influencing factors such as the flow rate to the study area, potential evaporation, geological and soil characteristics of the study area, and the characteristics of groundwater exploitation and use in the study area. Table 5 shows selected criteria used to assess the risk of land subsidence. Data collected are based on the results of the Delphi and KAMET rule methods to select the main influencing factors on subsidence in the study area.
The above steps and the initial set of preliminary indicators were used to obtain the expert opinions listed in Table 1 and Table 2. The calculation results are presented briefly in Table 2. The index marked with an * is the index that was eliminated because it did not meet the conditions of the KAMET rule, and the final selected index is presented in Table 5.
Table 5 summarizes the results of the experts’ evaluation according to the rules in Table 2. The total of 24 experts used to take the survey include a group of local officials (12 experts from offices representing six provinces in the Ca Mau peninsula region, 1 local-level leader—a person with comprehensive knowledge of the current subsidence situation in the study area, and 1 main specialist in charge related to natural disasters in the area) and 10 independent experts on subsidence research in Vietnam. Experts evaluate the influencing factors selected for survey and evaluation in Table 1 according to the principles listed in Table 2. The results of asking for expert’ evaluations on the index set are presented in Table 5.
The main factors influencing subsidence in the study area are shown in Table 6.
With the main influencing factors identified in Table 6, the data collection is presented in Table 7. Hydrometeorological data at stations in the study area were collected from six meteorological gauges (Ca Mau, Bac Lieu, Soc Trang, Vi Thanh, Tra Noc, and Can Tho) and sixteen hydrology gauges (Thot Not, Bon Tong, Tan Hiep, Co Do, Ha Giang 1, Xeo Ro, Vi Thanh, Tra Noc, Tan Quy Tay, Dai Ngai, Phung Hiep, Tran De, Phuoc Long, Ganh Hao, Nam Cam and Song Doc) (Figure 4a). These data were collected to calculate the flow and the amount of evaporation in the dry season in the study area. The data were collected from the Information and Data Center, Vietnam Meteorological and Hydrological Administration, Ministry of Natural Resources and Environment (MoNRE).
This study used the Penman–Monteith formula [47] to calculate evapotranspiration. This formula is recommended by the FAO (Food and Agriculture Organization of the United Nations) and is written as follows:
E T 0 = 0.408 Δ R n G + γ 900 T + 273 u 2 e x e a Δ + γ 1 + 0.34 u 2
where ETo is the reference evapotranspiration [mm.day−1]; Rn is the net radiation at the crop surface [MJ.m−2.day−1]; G is the soil heat flux density [MJ.m−2.day−1]; T is the mean daily air temperature at a height of 2 m [°C]; u2 is the wind speed at a height of 2 m [m.s−1]; es is the saturation vapor pressure [kPa]; ea is the actual vapor pressure [kPa]; es − ea is the saturation vapor pressure deficit [kPa]; Δ is the slope of the vapor pressure curve [kPa°C−1]; and g is the psychrometric constant [kPa°C−1].
The dry-season flow was calculated using the Soil Conservation Service’s (SCS) Curve Number Method [48] according to the following formula:
Q = P I a 2 P I a + S
where Q is the runoff (in), P is the rainfall (in), S is the potential maximum retention after runoff begins, and Ia is the initial abstractions.
Table 7. Selected criteria for assessing the risk of land subsidence.
No.Selection CriteriaData Sources Used
1Geological structureGeological map of the study area (scale 1:10,000)
2Soil documentsNational Center for Water Resources Planning and Investigation
3Groundwater flow exploitation National Center for Water Resources Planning and Investigation
4Water flow in the dry seasonCalculated according to (SCS) Curve Number Method [48]
5Current land use statusLand use map of the study area (scale 1:10,000)
6Evaporation in the dry seasonCalculated according to Penman–Monteith formula [47]
Geological, soil, and land use maps are presented in Figure 4b,c,e.
Groundwater exploitation documents were collected from the National Center for Water Resources Planning and Investigation (NAWAPI) (Figure 4d).

3. Results

3.1. Determine Standardization Criteria

Based on the results of collecting opinions on the parameters through the questionnaire, a comparison matrix was established. The coefficients of the matrix were calculated by comparing the pairwise scores of the components. In this thesis, comparisons were made between groups of indicators and between the indicators within each group. The comparative value of the index was determined based on expert opinions. Then, the weights of the index groups as well as the index were calculated according to the AHP algorithm. The variables were a set of many components with different values and dimensions. To be able to calculate and determine the risk of subsidence index (C), it was necessary to standardize the variables into a dimensionless form according to the rating scale. The level of influence ranged from 1 to 5. This was multiplied by the weight of the variable, thereby calculating the values of the index, the index group, and the composite C index.
Geological factors assessed the levels of geological strata that potentially cause subsidence in the study area (the geological stratification map of the study area was used to determine the score on the assessment scale). The soil factor evaluated the influence of each type of soil on subsidence in the study area (the map of the distribution of soil types in the area with actual subsidence occurring in the study area was used to determine the point evaluation). The land use factor was based on the map of land use types, and information on the locations of subsidence was used to give an assessment score. The groundwater exploitation and use factor was based on the locations of drilled wells and groundwater flow exploitation, and the locations of actual subsidence were used to give an assessment scale. The dry-season evaporation factor was based on data from the meteorological stations. It calculated the amount of dry-season evaporation in the basin and built a correlation with the locations where subsidence occurred in reality to give a rating scale. The dry-season flow factor calculated the amount of recharge flow into the basin during the dry season and built a correlation with the actual locations of subsidence to give points on the evaluation scale.
This study standardized six selected indicators, and the results are shown in Table 8, Table 9, Table 10, Table 11, Table 12 and Table 13. This study evaluated the sensitivity level of each group in the elements based on the synthesis of documents and data collected in the study area, and consultation with experts. Specifically, for the geological factors, data related to geological drilling holes, and data related to the distribution of geological layers in the study area, this study was conducted to overlay the layers and determine the locations where subsidence had occurred to give an assessment according to the sensitivity scale. The amQ3IV1 geological component area is the area where subsidence often occurs during drought periods. Similarly, the factor groups of the other components were also evaluated based on superposition with the map layer of areas where subsidence often occurs in reality. The assessment results were compared with expert opinions, including those of local officials and experts who had participated in projects and studied topics related to subsidence in the study area.
The map layers after normalization are shown in Figure 5a–f. The geological sensitivity map (Figure 5a) shows the influence of geological factors on subsidence in the study area. Ca Mau province is the area where subsidence is most affected by geological factors. Figure 5b shows the sensitivity of soil factors to subsidence in the Ca Mau Peninsula area. Soil factors have a relatively strong influence on subsidence in Ca Mau, Bac Lieu, and Soc Trang provinces. Figure 5c shows the sensitivity of minimum flow factors to subsidence in the study area. The results show that areas with many wells have high sensitivity to subsidence. Figure 5d shows the influence of dry-season flow factors. The subsidence in Soc Trang province is greatly influenced by this factor. Figure 5e shows the level of influence of evaporation factors on subsidence in the study area. Evaporation has the highest sensitivity to subsidence in Ca Mau province and has a strong influence in other provinces in the region during drought periods. The land use factor is also one of the factors affecting the subsidence situation in the Ca Mau Peninsula (Figure 5f). However, this factor has a low level of influence on subsidence in the study area.

3.2. Weight of Evaluation Criteria

This study used the AHP analytical hierarchy method to establish a calculation matrix. The matrix table comparing the evaluation criteria is shown in Table 14.
The weight calculation was carried out by dividing each value in each column of the matrix by the total number of values in that column. The result was a weight between 0 and 1, as shown in Table 15.
Equations (1) and (2) were used to calculate CI = 0.101 and CR = 8.1%. As the CR value is less than 10%, the weight can be used.
The subsidence risk index of the study area is calculated according to the following formula:
Risk of subsidence (C) = (Land × 0.036) + (Qdry × 0.296) + (Geological × 0.052) + (Land use × 0.145) + (ETdry × 0.159) + (Groundwater exploitation × 0.312)
Formula (6) weighted with the influencing factors (land, Qdry, geological, land use, ETdry, groundwater exploitation) was applied to build a land subsidence risk zoning map, as shown in Figure 6. The analysis results in Table 16 show that currently, the Ca Mau Peninsula area is mostly at low or very low risk of subsidence, with over 30% of the area at the low level, while 23% of the area is at the average level, 10% of the area is at high risk, and 0.1% of the study area is at very high risk. The results of this article’s research are shown using a subsidence risk zoning map that provides an intuitive and general overview of the areas with high subsidence risk and can be a document to help managers consult in the work of building a socio-economic development plan for the Ca Mau Peninsula region.

4. Discussion

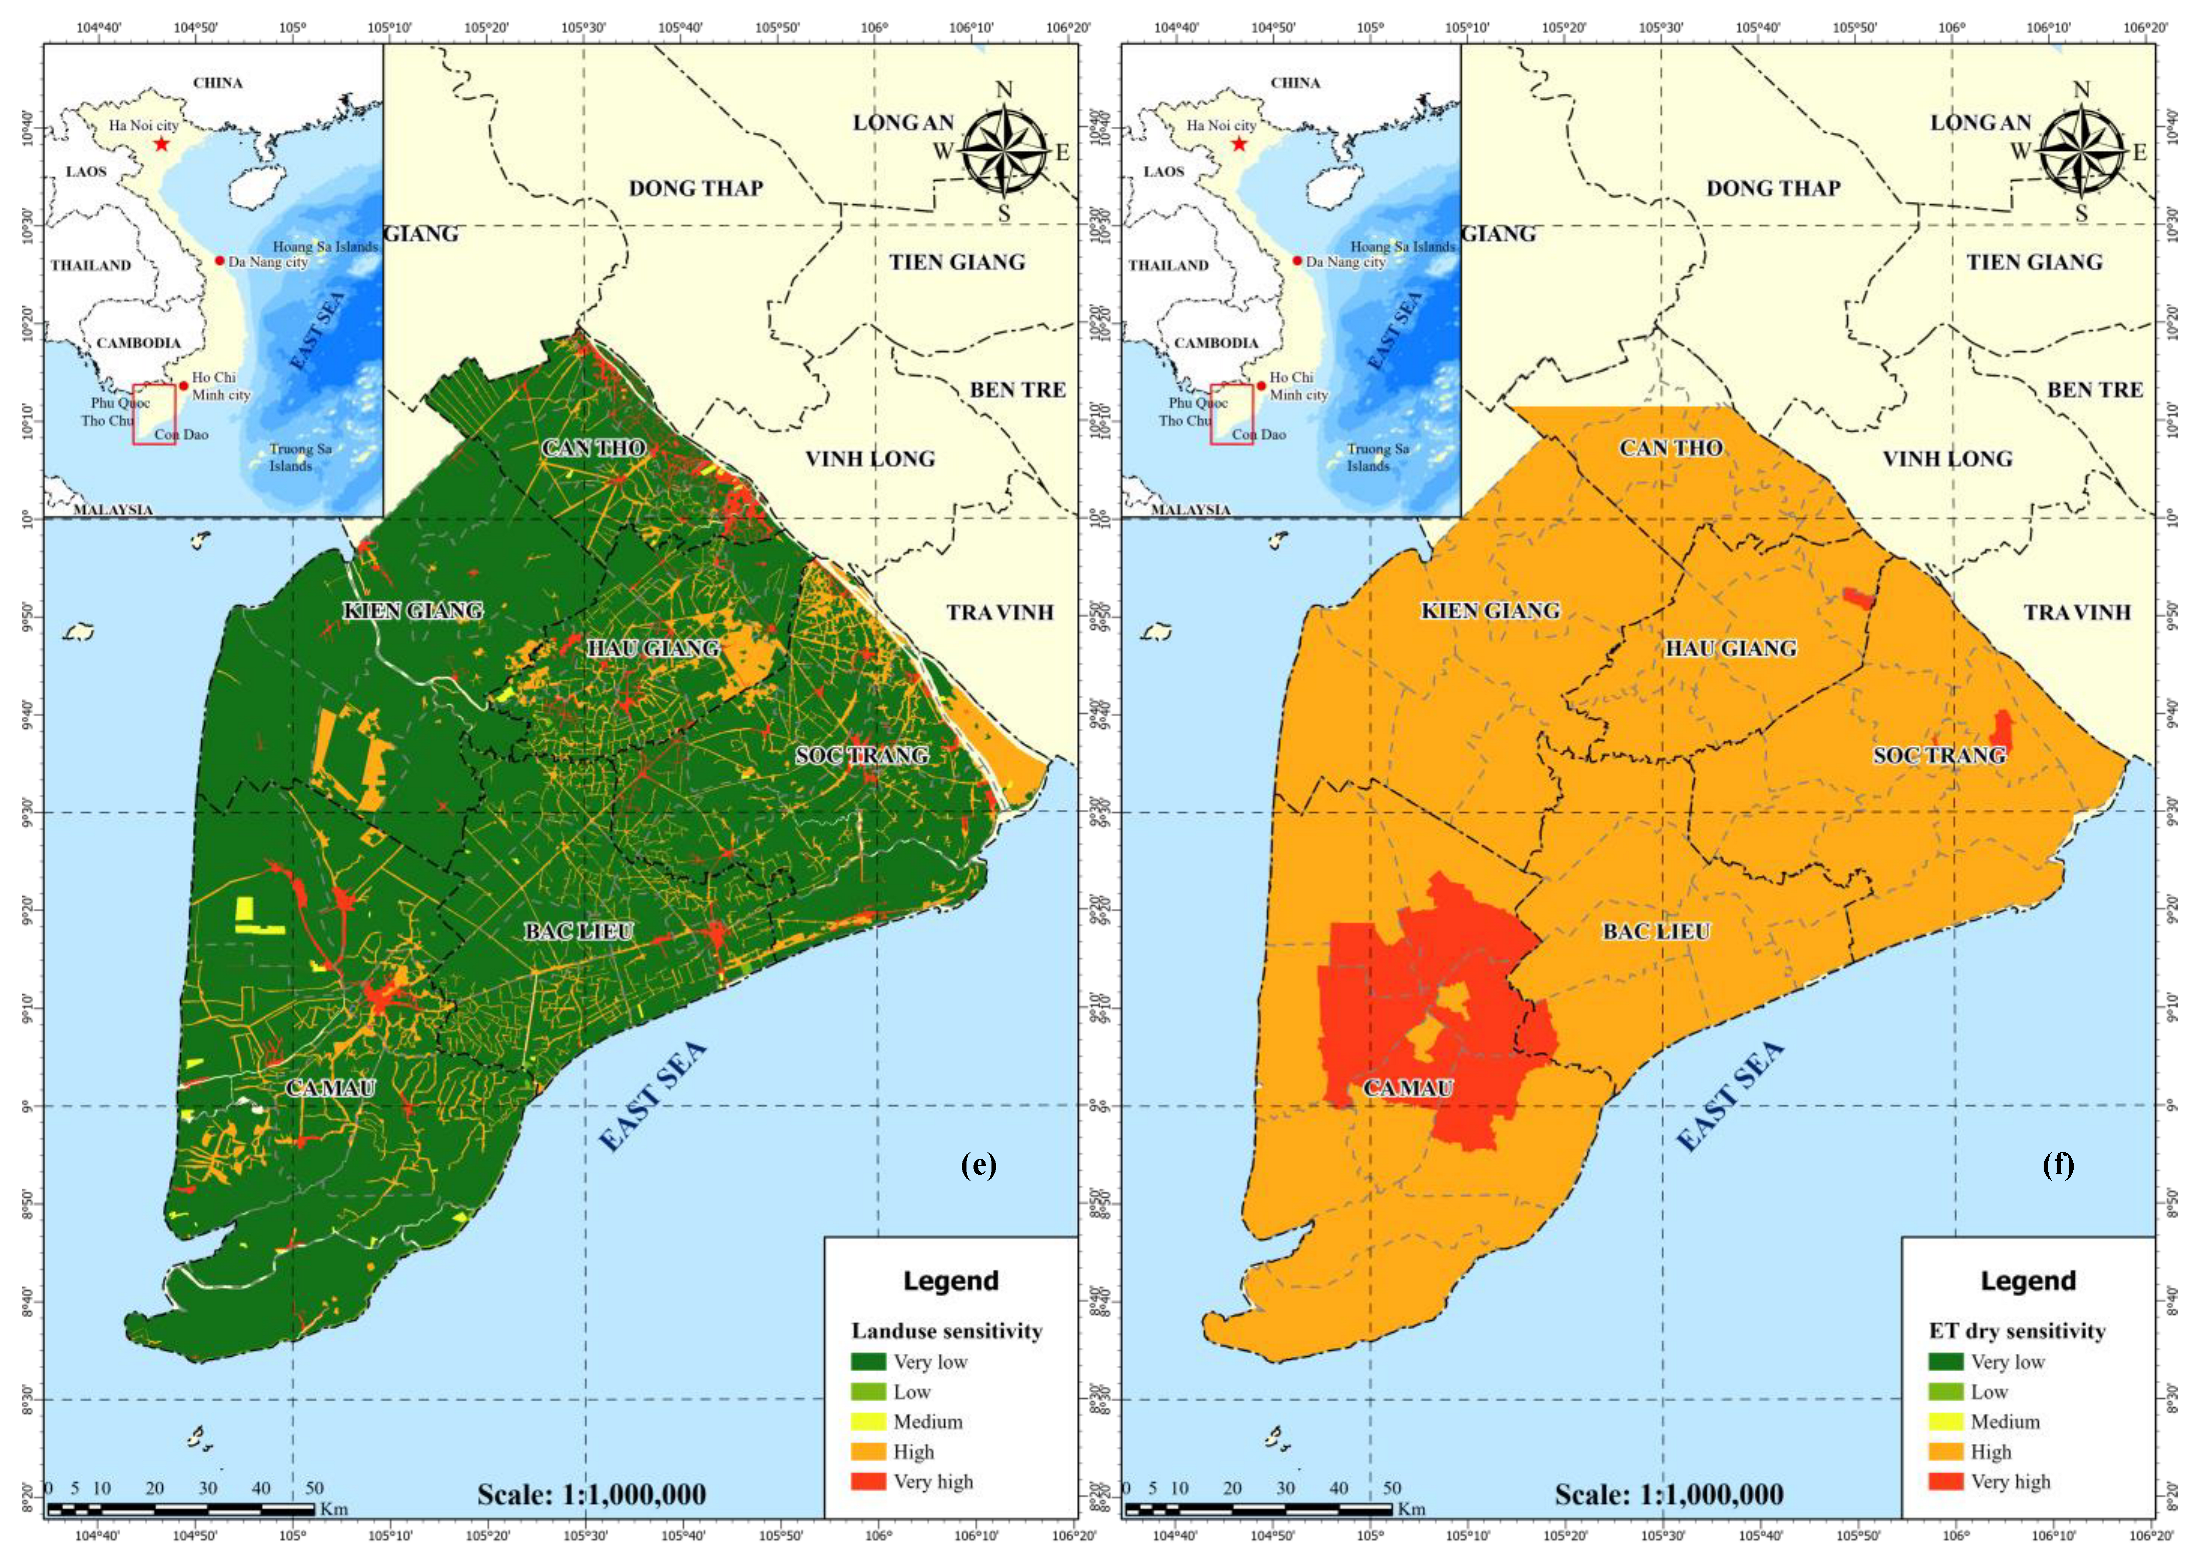
Determining the influencing factors causing subsidence showed that groundwater exploitation is the main cause of subsidence in the Mekong Delta and Ca Mau Peninsula area with the weighting factors in Table 11. This is consistent with observations in the study area [28,29,32,33] in particular, and in other sinking deltas, such as the Yellow River Delta [49], the Bangkok delta cities in the Chao Phraya delta [50], Suzhou in the Yangtze delta [51], Jakarta [52], Indonesian cities [53], and Shanghai [54,55], and major land subsidence due to groundwater withdrawal worldwide [56]. Previous studies have often focused on a single city or a relatively small part of a delta and selected some factors such as groundwater depletion, the slow consolidation of weak water-saturated soil layers, saltwater intrusion, geological tectonics, relative sea level rise, etc. [57,58,59,60,61]. This research applied the AHP method and GIS technology to determine the weights of factors affecting drought and the subsidence risk zones in the Ca Mau Peninsula area. The results show that the combined application of AHP and GIS methods is consistent with previous research results [62,63].
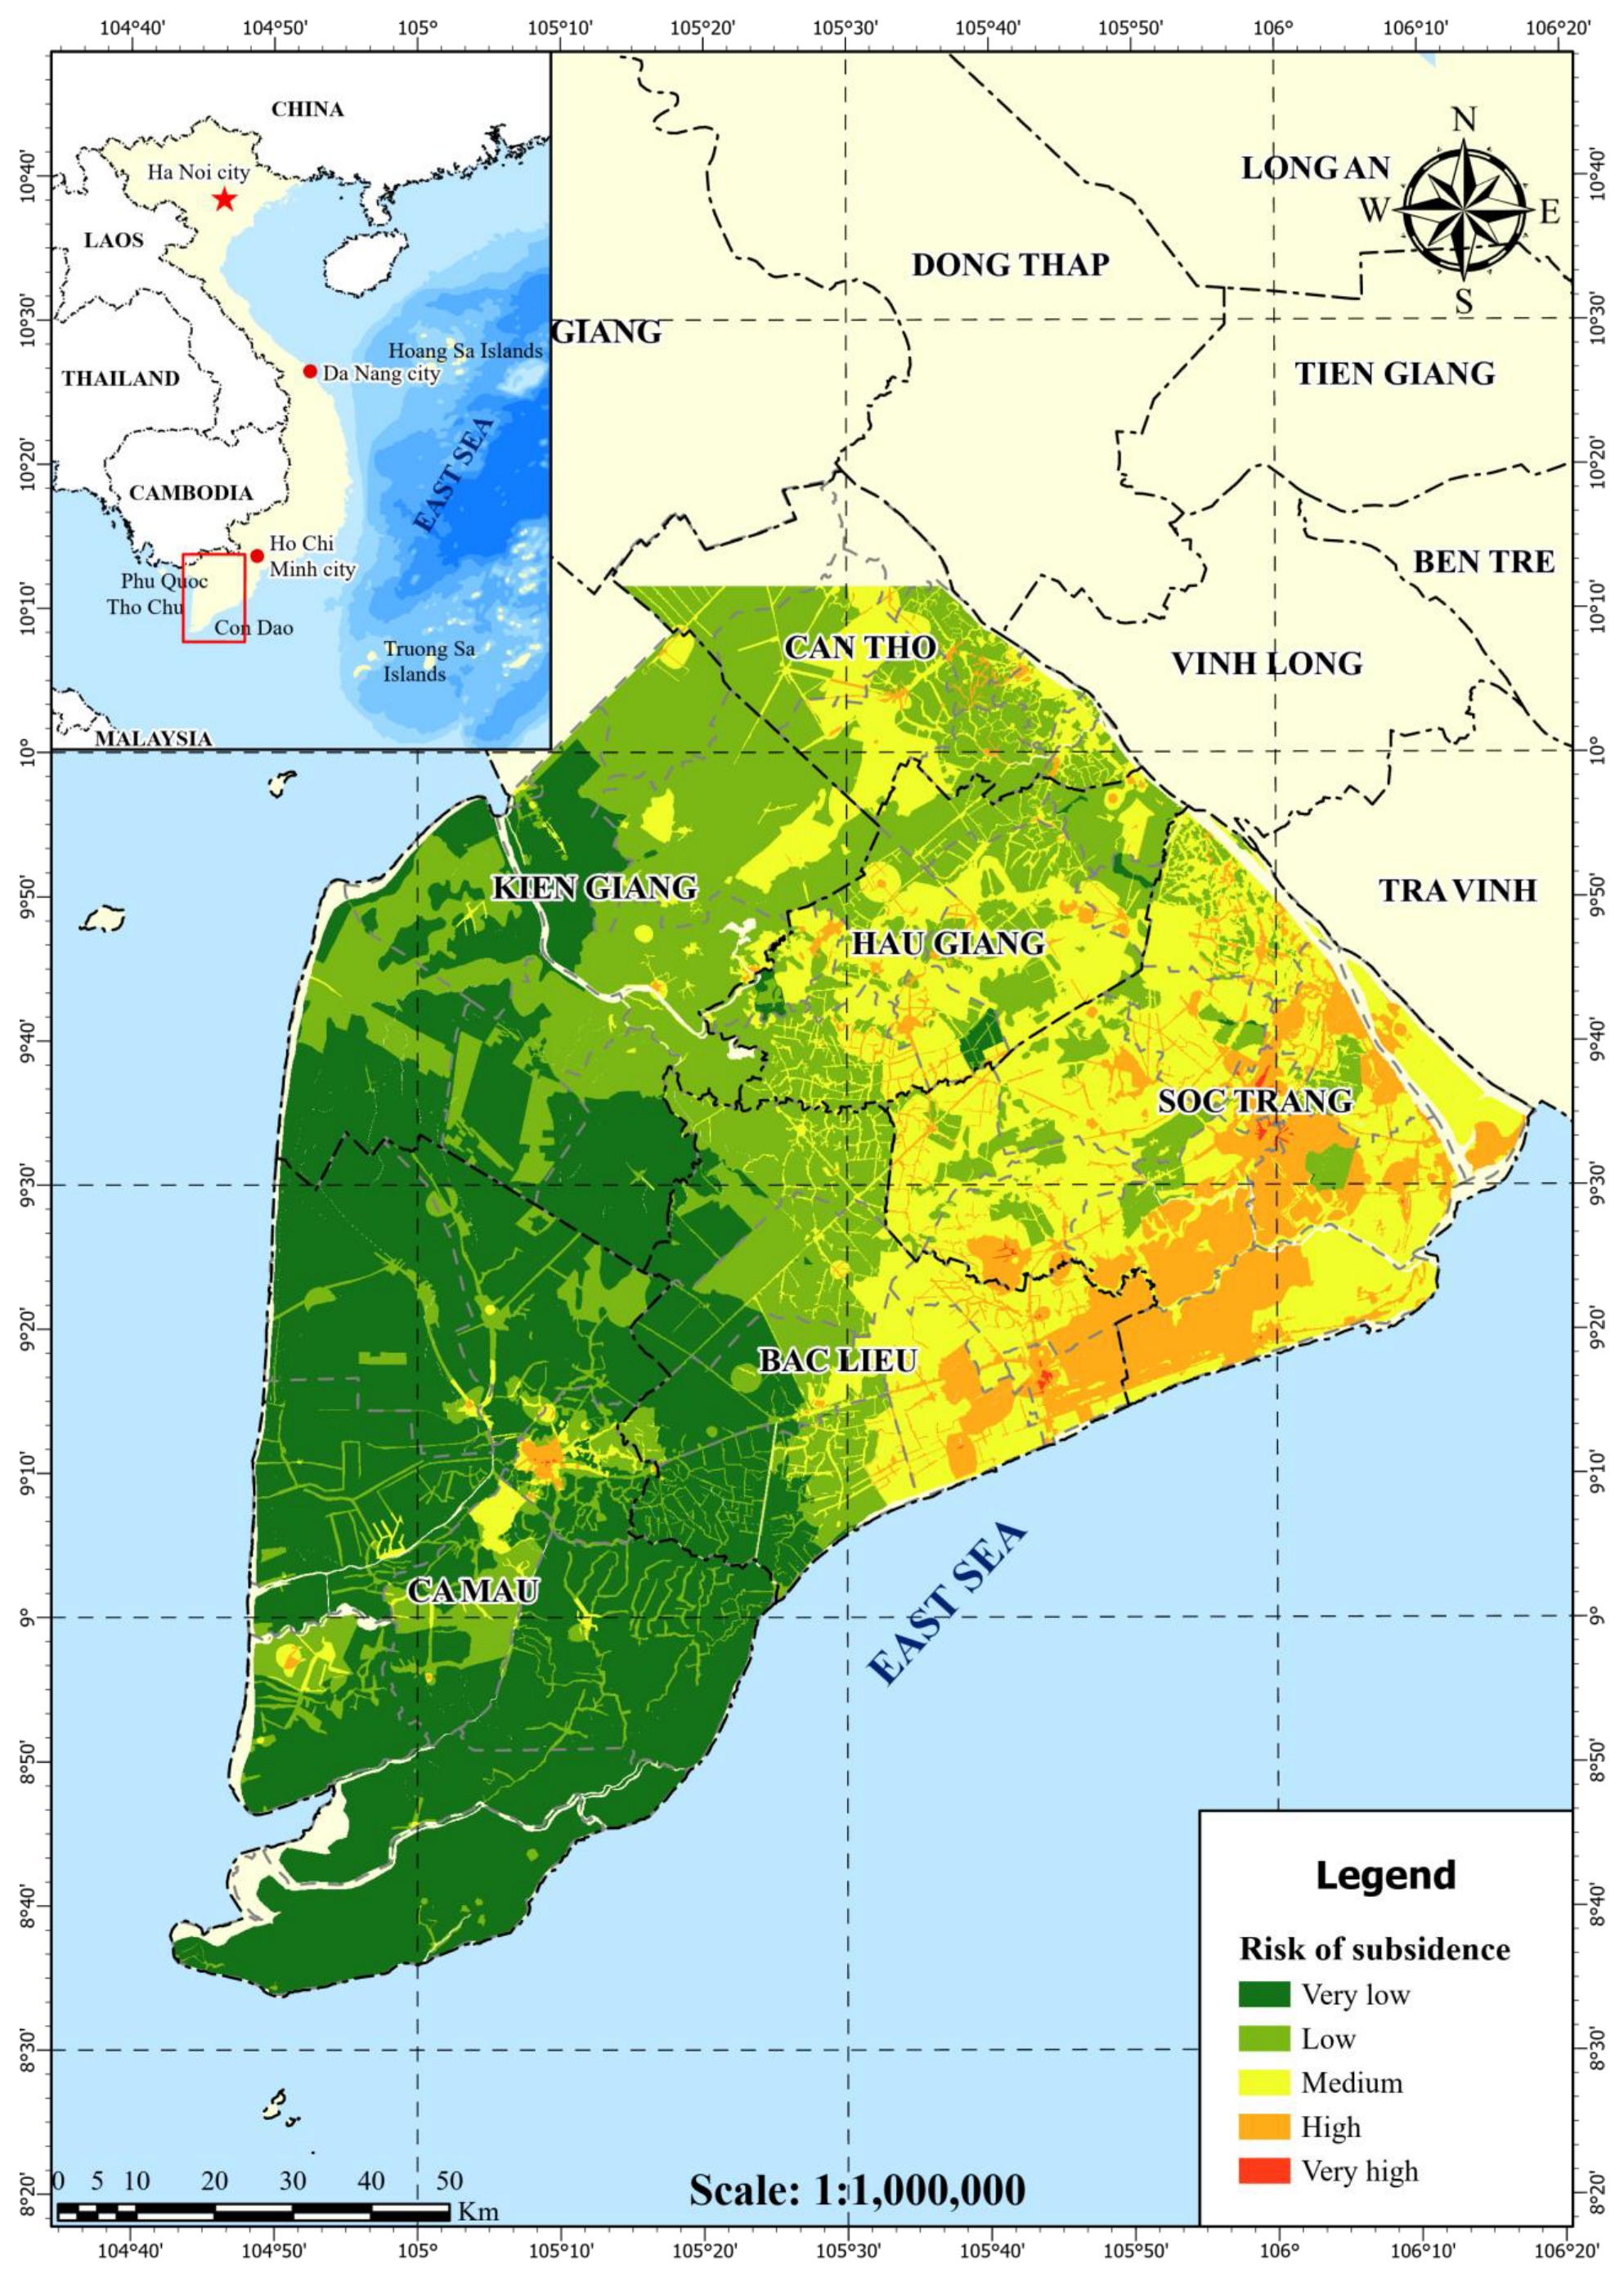
The results show that during periods of prolonged drought, the area with high subsidence potential is Soc Trang province, followed by Ca Mau, Can Tho, Tra Vinh, and Hau Giang provinces. The results were evaluated based on the subsidence risk map (Figure 6) established by overlaying the layers of influence factors according to the weights evaluated using the AHP method. The Soc Trang area has geological factors and soil factors that affect subsidence with high sensitivity. At the same time, the dry-season flow in this area is not replenished much and the rate of groundwater exploitation is high. Therefore, the combination of these factors makes Soc Trang the area with the highest subsidence risk based on this assessment method [64]. Ca Mau Province has a number of areas at high risk of subsidence [65]. These locations are quite similar to areas where subsidence frequently occurs, such as Tran Van Thoi district and U Minh district [66]. Ca Mau Province is also one of the cities affected by subsidence, especially during periods of prolonged drought, and the research results also show this. Soc Trang and Tra Vinh are two provinces with subsidence in areas along canals and rivers [67,68,69,70]. Table 16 lists the facies areas corresponding to the subsidence risks, and the area at very high risk of subsidence accounts for a very low percentage (0.1%). However, the area with a moderate-to-high risk of subsidence is relatively large (over 30%).
By combining the AHP method and GIS technology, this study evaluated the weights of factors affecting subsidence in the study area during drought periods. These factors were selected based on an evaluation of the correlation of each individual factor with subsidence during drought periods. After overlaying the map layers, the influencing factors were selected with assessment points in consultation with experts. The map of locations at risk of subsidence shows locations with a high risk of subsidence during times of drought if the influencing factors are not affected by sudden changes. The subsidence risk zoning map shows the locations at high risk of subsidence relatively accurately during drought periods. The information in this map is a meaningful reference for planners in this area.
This study on subsidence due to drought in the Ca Mau Peninsula area is one of the new studies conducted in Vietnam. The study area is increasingly facing prolonged droughts, leading to increased groundwater exploitation. Therefore, the risk of subsidence is becoming more and more serious. The study results will help managers make appropriate groundwater exploitation policies during drought periods as well as develop drought response plans to minimize the impact of subsidence and ensure sustainable development goal No. 13 of “climate action” in the context of climate change in the study area.

5. Conclusions

This study provides the steps to build a subsidence risk map based on superimposed factors affecting subsidence in a study area. Influencing factors were analyzed and weighted based on the AHP hierarchical analysis method. The main findings are summarized as follows:
-
The study applied the Delphi method along with the KAMET rules to select these factors affecting the study area. Six component factors were selected. Groundwater exploitation is the core factor leading to land subsidence in the Ca Mau Peninsula, followed by geological and soil factors. During periods of prolonged drought, the study area with the highest subsidence potential is Soc Trang province, followed by Ca Mau, Can Tho, Tra Vinh, and Hau Giang provinces.
-
Identifying factors affecting subsidence and applying map overlay technology allowed a subsidence zoning map of the study area to be built. If influencing factors can be predicted, a subsidence risk warning map will be built for the study area.
-
The high-risk subsidence maps will provide great support to managers and planners providing structural and non-structural solutions that contribute to the sustainable development goal No. 13 “climate action” and improve resilience and adaptability in the context of climate change.
This study analyzed factors affecting subsidence in the Ca Mau peninsula area using AHP analysis and GIS methods. However, it was practically impossible to collect data on each individual factor. The study results have some limitations. The main limitation is the use of the method of overlapping map layers, in which map layers with determined weights were stacked on top of each other to identify locations at risk of subsidence in the study area. The processing of some map layers may have had errors, such as the dry-season evaporation map and the dry-season water flow map, which were built based on factors using calculation formulas, so they could not avoid work errors. In addition, the hydrometeorological station locations in the study area were quite sparse, leading to the interpolated values not being perfectly accurate. Furthermore, the weighting of the influencing factors used expert methods, so subjective assessments could not be avoided. However, the weights of these influencing factors can change over time to gradually match reality. Another limitation of this study is that there is no continuous and complete database of subsidence points to use when building a real-time subsidence risk assessment map of the study area. The collected documents used in this research are mainly information about the locations of occurrence in some typical areas with asynchronous years and times of occurrence.
The results of the subsidence risk map in the study area are quite similar to those in areas where subsidence is likely to occur when drought and groundwater exploitation increase. To overcome the above limitations, in the future, we can continue to study this topic and build a warning system for the risk of subsidence in the Ca Mau Peninsula area. The warning system will actively support managers in making plans and solutions to effectively manage groundwater exploitation, ensuring sustainable socio-economic development.

Author Contributions

Conceptualization, D.Q.T., N.V.N., Q.T.T.T., P.T.D. and N.T.T.; Methodology, D.Q.T., N.V.N., Q.T.T.T., H.T.T.P., P.T.D. and N.T.T.; Software, D.Q.T., N.V.N., Q.T.T.T. and P.T.D.; Calibration and validation, D.Q.T., N.V.N. and Q.T.T.T.; Formal analysis, D.Q.T., N.V.N. and Q.T.T.T.; Investigation, D.Q.T., N.V.N., Q.T.T.T., H.T.T.P., P.T.D. and N.T.T.; Data curation, D.Q.T., N.V.N., Q.T.T.T. and P.T.D.; Writing—original draft preparation, D.Q.T., N.V.N., Q.T.T.T., H.T.T.P., P.T.D. and N.T.T.; Writing—review and editing, D.Q.T.; Visualization, D.Q.T., N.V.N., Q.T.T.T., H.T.T.P., P.T.D. and N.T.T. All authors have read and agreed to the published version of the manuscript.

Funding

This research was funded by the ministerial-level project of MoNRE “Study on the scientific basic and establishing a warning system for the risk of landslide, subsidence due to the drought and underground water exploitation at Ca Mau Peninsula”, grant number: TNMT.2023.06.12 during 2023–2025. The ministerial-level key science and technology program on forecasting and warning of hydrometeorological disasters for disaster prevention and control in the 2021–2025 period. Program code: TNMT.06/21-25.

Institutional Review Board Statement

Not applicable.

Informed Consent Statement

Not applicable.

Data Availability Statement

Data are contained within the article.

Conflicts of Interest

The authors declare no conflicts of interest.

References

  1. VaeziNejad, S.M.; Tofigh, M.M.; Marandi, S.M. Zonation and prediction of land subsidence (Case study-Kerman, Iran). Int. J. Geosci. 2011, 2, 102–110. [Google Scholar] [CrossRef]
  2. Lee, S.; Park, I.; Choi, J.K. Spatial prediction of ground subsidence susceptibility using an artificial neural network. Environ. Manag. 2012, 49, 347–358. [Google Scholar] [CrossRef] [PubMed]
  3. Dehghani, M.; Rastegarfar, M.; Ashrafi, R.A.; Ghazipour, N.; Khorramrooz, H.R. Interferometric SAR and geospatial techniques used for subsidence study in the Rafsanjan plain. Am. J. Environ. Eng. 2014, 4, 32–40. [Google Scholar]
  4. Ge, L.; Ng, A.H.M.; Li, X.; Abidin, H.Z.; Gumilar, I. Land subsidence characteristics of Bandung basin as revealed by ENVISAT ASAR and ALOS PALSAR interferometry. Remote Sens. Environ. 2014, 154, 46–60. [Google Scholar] [CrossRef]
  5. Karimzadeh, S. Characterization of land subsidence in Tabriz basin (NW Iran) using InSAR and watershed analyses. Acta Geod. Geophys. 2016, 51, 181–195. [Google Scholar] [CrossRef]
  6. Ghorbanzadeh, O.; Blaschke, T.; Aryal, J.; Gholaminia, K. A new GIS-based technique using an adaptive neuro-fuzzy inference system for land subsidence susceptibility mapping. J. Spat. Sci. 2020, 65, 401–418. [Google Scholar] [CrossRef]
  7. Pacheco, J.; Arzate, J.; Rojas, E.; Arroyo, M.; Yutsis, V.; Ochoa, G. Delimitation of ground failure zones due to land subsidence using gravity data and finite element modeling in the Querétaro valley, México. Eng. Geol. 2006, 84, 143–160. [Google Scholar] [CrossRef]
  8. Bui, T.D.; Shahabi, H.; Shirzadi, A.; Chapi, K.; Pradhan, B.; Chen, W.; Khosravi, K.; Panahi, M.; Bin Ahmad, B.; Saro, L. Land subsidence susceptibility mapping in South Korea using machine learning algorithms. Sensors 2018, 18, 2464. [Google Scholar] [CrossRef] [PubMed]
  9. Oh, H.J.; Syifa, M.; Lee, C.W.; Lee, S. Land subsidence susceptibility mapping using bayesian, functional, and meta-ensemble machine learning models. Appl. Sci. 2019, 9, 1248. [Google Scholar] [CrossRef]
  10. Oh, H.J.; Ahn, S.C.; Choi, J.K.; Lee, S. Sensitivity analysis for the GIS-based mapping of the ground subsidence hazard near abandoned underground coal mines. Environ. Earth Sci. 2011, 64, 347–358. [Google Scholar] [CrossRef]
  11. Rezaei, M.; Noori, Z.Y.; Barmaki, M.D. Land subsidence susceptibility mapping using analytical hierarchy process (AHP) and certain factor (CF) models ats Neyshabur plain, Iran. Geocarto Int. 2020, 37, 1465–1481. [Google Scholar] [CrossRef]
  12. Bhattarai, R.; Kondoh, A. Risk assessment of land subsidence in Kathmandu Valley, Nepal, using remote sensing and GIS. Adv. Remote Sens. 2017, 6, 132. [Google Scholar] [CrossRef]
  13. Chen, B.; Gong, H.; Li, X.; Zhang, Y.; Zheng, L. Risk assessment on the land subsidence in Beijing. In Proceeding of the Second International Conference on Earth Observation for Global Changes, Chengdu, China, 25–29 May 2009; Volume 7471, p. 74711L. [Google Scholar] [CrossRef]
  14. Motagh, M.; Djamour, Y.; Walter, T.R.; Wetzel, H.V.; Zschau, J.; Arabi, S. Land subsidence in Mashhad valley, Northeast of Iran, results from InSAR leveling and GPS. J. Geophys. 2007, 168, 518–528. [Google Scholar] [CrossRef]
  15. Lashkaripour, G.; Ghafouri, M.; Salehi, R. Land subsidence of southern Mahyar plain and effects of induced fissures on residential, industrial and agricultural. In Proceeding of the Fifth National Conference of Geology and the Environment; Islamic Azad University of Eslamshahr: Eslamshahr, Iran, 2010; p. 6. (In Persian) [Google Scholar]
  16. Lashkaripour, G.; Ghafouri, M.; Kazemi, R.; Damshenas, M. Land subsidence due to groundwater decline in Neyshabur plain. In Proceeding of the Fifth Conference of Engineering Geology and the Environment; Natural Disaster Research Institute: Tehran, Iran, 2007; pp. 1082–1091. (In Persian) [Google Scholar]
  17. Lashkaripour, G.; Rostami barani, H.; Kohandel, A.; Torshizi, H. Decline in groundwater levels and land subsidence in the kashmar plain. In Proceedings of the International Conference on Earth Sciences, Tehran, Iran, January 2006; pp. 2428–2438. (In Persian). [Google Scholar]
  18. Beyzaey, A. The Effects of Recent Drought on Water Resources Neyshabur Plain. Master Thesis, Faculty of Geography, Tehran University, Tehran, Iran, 2003; p. 122. [Google Scholar]
  19. Tuyen, T.H.; Thuy, N.T.; Do, H.N.T.; Tham, H.H. Zoning sinkhole susceptibility for Phong Xuan area (Phong Dien district, Thua Thien Hue province) by using SAATY’s analytical hierarchy process (AHP). J. Sci. Technol. Univ. Sci. Hue Univ. 2021, 19, 179–188. Available online: https://csdlkhoahoc.hueuni.edu.vn/data/2022/7/2021_-_Tc_KHCN_DHKH_-_Sut_dat_Phong_Xuan_.pdf (accessed on 5 February 2024). (In Vietnamese).
  20. Trung, D.T.; Nhan, P.Q.; Hung, N.K. Using GIS and analysis hierarchy process (AHP) in order to map arsenic pollution zonation in groundwater based on the influence of geological factors in the Red River Delta. Hanoi Univ. Nat. Resour. Environ. 2020, 29, 24–35. Available online: https://tapchikhtnmt.hunre.edu.vn/index.php/tapchikhtnmt/article/view/213/215 (accessed on 5 February 2024). (In Vietnamese).
  21. Hao, N.H.; Van, P.V.; Ha, K.M. Applying AHP method and GIS to evaluate land suitability for paddy rice crop in Quang Xuong district, Thanh Hoa province. Can Tho Uni. J. Sci. 2019, 11, 1–10. [Google Scholar] [CrossRef]
  22. Tran, T.T.; Hoang, T.T. Assessing flash flood risks based on analytic hierarchy process (AHP) and geographic information system (GIS): A Case Study of Hieu catchment (Nghe An, Vietnam). In Global Changes and Sustainable Development in Asian Emerging Market Economies; Nguyen, A.T., Hens, L., Eds.; Springer: Cham, Switzerland, 2022; Volume 2, pp. 793–803. [Google Scholar] [CrossRef]
  23. Thanh, D.Q.; Nguyen, D.H.; Prakash, I.; Jaafari, A.; Nguyen, V.T.; Phong, T.V.; Pham, B.T. GIS based frequency ratio method for landslide susceptibility mapping at Da Lat City, Lam Dong province, Vietnam. VN J. Earth Sci. 2020, 42, 55–66. [Google Scholar] [CrossRef]
  24. Tuan, H.N.; Tuyet, V.T. Research and develop a landslide risk zoning map for mountainous areas of Quang Nam province. J. Irrig. Sci. Technol. 2021, 68, 1–9. Available online: https://vawr.org.vn/Upload/BaibaoKH/hoang-ngoc-tuan-68-2021.pdf (accessed on 5 February 2024). (In Vietnamese).
  25. Lan, P.T.H.; Long, N.L.; Minh, D.Q. Application of hierarchical analysis process method (AHP) to assess the risk of riverbank erosion in the downstream of the Dong Nai River basin. J. Water Res. Environ. Eng. 2020, 70, 17–24. Available online: https://vjol.info.vn/index.php/DHTL/article/download/52289/43117/ (accessed on 5 February 2024). (In Vietnamese).
  26. Loi, N.T.; Tuan, V.Q. Assessment of on the possibility of using radar remotely sensed data in monitoring land subsidence in Can Tho City from 2015 to 2020. CTU J. Sci. 2022, 58, 80–94. [Google Scholar] [CrossRef]
  27. Erban, L.E.; Gorelick, S.M.; Zebker, H.A.; Fendorf, S. Release of arsenic to deep groundwater in the Mekong Delta, Vietnam, linked to pumping-induced land subsidence. Environ. Sci. 2013, 110, 13751–13756. [Google Scholar] [CrossRef] [PubMed]
  28. Erban, L.E.; Gorelick, S.M.; Zebker, H.A. Groundwater extraction, land subsidence, and sea-level rise in the Mekong Delta, Vietnam. Environ. Res. Lett. 2014, 9, 084010. [Google Scholar] [CrossRef]
  29. Fujihara, Y.; Hoshikawa, K.; Fujii, H.; Kotera, A.; Nagano, T.; Yokoyama, S. Analysis and attribution of trends in water levels in the Vietnamese Mekong Delta. Hydrol. Process. 2016, 30, 835–845. [Google Scholar] [CrossRef]
  30. Karlsrud, K.; Vangelsten, B.V. Subsidence and shoreline retreat in the Ca Mau Province—Vietnam, causes, consequences and mitigation options. Geotech. Eng. J. SEAGS AGSSEA 2017, 48, 26–32. Available online: http://seags.ait.asia/journals/2017/48-1-march/24436-subsidence-and-shoreline-retreat-in-the-ca-mau-province/ (accessed on 5 February 2024).
  31. Minderhoud, P.S.J.; Erkens, G.; Pham, V.H.; Vuong, B.T.; Stouthamer, E. Assessing the potential of the multi-aquifer subsurface of the Mekong Delta (Vietnam) for land subsidence due to groundwater extraction. Proc. Int. Assoc. Hydrol. Sci. 2015, 372, 73–76. [Google Scholar] [CrossRef]
  32. Minderhoud, P.S.J.; Erkens, G.; Pham, V.H.; Bui, V.T.; Erban, L.E.; Stouthamer, E. Impacts of 25 years of groundwater extraction on subsidence in the Mekong delta, Vietnam. Environ. Res. Lett. 2017, 12, 064006. [Google Scholar] [CrossRef] [PubMed]
  33. Miller, M.M.; Jones, C.E.; Sangha, S.S.; Bekaert, D.P. Rapid drought-induced land subsidence and its impact on the California aqueduct. Remote Sens. Environ. 2020, 251, 112063. [Google Scholar] [CrossRef]
  34. Wüest, M.; Bresch, D.; Corti, T. The Hidden Risks of Climate Change: An Increase in Property Damage from Soil Subsidence in Europe; Swiss Reinsurance Company Ltd.: Zurich, Switzerland, 2011; pp. 1–9. [Google Scholar]
  35. Charpentier, A.; James, M.; Ali, H. Predicting drought and subsidence risks in France. Nat. Hazards Earth Syst. Sci. 2022, 22, 2401–2418. [Google Scholar] [CrossRef]
  36. Dalkey, N.; Helmer, O. An experimental application of Deplhi method to use of experts. Manag. Sci. 1963, 9, 458–467. Available online: https://0-www-jstor-org.brum.beds.ac.uk/stable/2627117 (accessed on 5 February 2024). [CrossRef]
  37. Drescher, M. Toward rigorous use of expert knowledge in ecological research. Ecosphere 2013, 4, 1–26. [Google Scholar] [CrossRef]
  38. Brady, S.R. Utilizing and adapting the Delphi method for use in qualitative research. Int. J. Qual. Methods 2015, 14. [Google Scholar] [CrossRef]
  39. Dell’Olio, L.; Ibeas, A.; de Oña, J.; de Oña, R. Chapter 3—Public participation techniques and choice of variables. In Public Transportation Quality of Service; Elsevier: Amsterdam, The Netherlands, 2018; pp. 33–47. [Google Scholar] [CrossRef]
  40. Skinner, R.; Nelson, R.R.; Chin, W.W.; Land, L. The Delphi method research strategy in studies of information systems. Commun. Assoc. Inf. Syst. 2015, 37, 32–63. [Google Scholar] [CrossRef]
  41. Anh, N.T.; Tra, T.V.; Bich, D.T.N.; Linh, L.V.; Huy, N.Q. Application of the Delphi survey method in assessing the level of integrated water resources management. J. Clim. Change Sci. 2021, 20, 66–77. [Google Scholar]
  42. Skulmoski, G.J.; Hartman, F.T.; Krahn, J. The Delphi method for graduate research. J. Inf. Technol. Educ. Res. 2007, 6, 1–21. [Google Scholar] [CrossRef] [PubMed]
  43. Chu, H.C.; Hwang, G.J. A Delphi-based approach to developing expert systems with the cooperation of multiple experts. Expert Syst. Appl. 2007, 34, 2826–2840. [Google Scholar] [CrossRef] [PubMed]
  44. Saaty, T.L. Decision making with the analytic hierarchy process. Int. J. Serv. Sci. 2008, 1, 83–98. Available online: https://www.rafikulislam.com/uploads/resourses/197245512559a37aadea6d.pdf (accessed on 5 February 2024). [CrossRef]
  45. Rattanavarin, S. Development of Automatic Guided Vehicle (AGV) Controlling System by Radio Frequency Identification (RFID). Master Thesis, King Mongkut’s University of Technology North Bangkok, Bangkok, Thailand, 2007. [Google Scholar]
  46. Cheng, E.W.L.; Li, H.; Ho, D.C.K. Analytic hierarchy process (AHP): A defective tool when used improperly. Meas. Bus. Excell. 2002, 6, 33–37. [Google Scholar] [CrossRef]
  47. Allen, R.G.; Pereira, L.S.; Raes, D.; Smith, M. Crop evapotranspiration—guidelines for computing crop water requirements. In FAO Irrigation and Drainage Paper 56; Food and Agriculture Organization of the United Nations: Rome, Italy, 1998; ISBN 978-92-5-104219-9. [Google Scholar]
  48. Soil Conservation Service. National Engineering Handbook, Section 4, Hydrology; Department of Agriculture: Washington, DC, USA, 1964; p. 450. [Google Scholar]
  49. Higgins, S.; Overeem, I.; Tanaka, A.; Syvitski, J.P.M. Land subsidence at aquaculture facilities in the Yellow River Delta, China. Geophys. Res. Lett. 2013, 40, 3898–3902. [Google Scholar] [CrossRef]
  50. Phien-wej, N.; Giao, P.H.; Nutalaya, P. Land subsidence in Bangkok, Thailand. Eng. Geol. 2006, 82, 187–201. [Google Scholar] [CrossRef]
  51. Shi, X.; Fang, R.; Wu, J.; Xu, H.; Sun, Y.; Yu, J. Sustainable development and utilization of groundwater resources considering land subsidence in Suzhou, China. Eng. Geol. 2012, 124, 77–89. [Google Scholar] [CrossRef]
  52. Abidin, H.Z.; Andreas, H.; Gumilar, I.; Fukuda, Y.; Pohan, Y.E.; Deguchi, T. Land subsidence of Jakarta (Indonesia) and its relation with urban development. Nat. Hazards 2011, 59, 1753–1771. [Google Scholar] [CrossRef]
  53. Chaussard, E.; Amelung, F.; Abidin, H.; Hong, S.H. Sinking cities in Indonesia: ALOS PALSAR detects rapid subsidence due to groundwater and gas extraction. Remote Sens. Environ. 2013, 128, 150–161. [Google Scholar] [CrossRef]
  54. Wu, J.; Shi, X.; Ye, S.; Xue, Y.; Zhang, Y.; Wei, Z.; Fang, Z. Numerical simulation of viscoelastoplastic land subsidence due to groundwater overdrafting in Shanghai, China. J. Hydrol. Eng. 2010, 15, 223–236. [Google Scholar] [CrossRef]
  55. Ye, S.; Luo, Y.; Wu, J.; Yan, X.; Wang, H.; Jiao, X.; Teatini, P. Three-dimensional numerical modeling of land subsidence in Shanghai, China. Hydrogeol. J. 2016, 24, 695–709. [Google Scholar] [CrossRef]
  56. Gambolati, G.; Teatini, P. Geomechanics of subsurface water withdrawal and injection. Water Resour. Res. 2015, 51, 3922–3955. [Google Scholar] [CrossRef]
  57. Mnasri, H.; Nunes, A.; Sahnoun, H.; Abdelkarim, B.; Mahmoudi, S. Assessment of soil erosion in southern Tunisia using AHP-GIS modeling. Euro-Mediterr. J. Environ. Integr. 2023, 9, 223–234. [Google Scholar] [CrossRef]
  58. Tafreshi, G.M.; Nakhaei, M.; Lak, R. Land subsidence risk assessment using GIS fuzzy logic spatial modeling in Varamin aquifer, Iran. GeoJournal 2021, 86, 1203–1223. [Google Scholar] [CrossRef]
  59. Hoan, T.V.; Richter, K.; Doerr, F.; Bauer, J.; Börsig, N.; Steinel, A.; Le, V.T.M.; Pham, V.C.; Norra, S. The process of groundwater Salinization on the Ca Mau Peninsula (Mekong Delta, Vietnam): Evaluation of saltwater intrusion pathways via scenario calculations applying a 3D groundwater model. Preprints 2023, 2023110943. [Google Scholar]
  60. Wijitkosum, S.; Sriburi, T. Fuzzy AHP integrated with GIS analyses for drought risk assessment: A case study from Upper Phetchaburi River Basin, Thailand. Water 2019, 11, 939. [Google Scholar] [CrossRef]
  61. Chen, H.; Tan, X.; Zhang, Y.; Hu, B.; Xu, S.; Dai, Z.; Zhang, Z.; Wang, Z.; Zhang, Y. study on groundwater function zoning and sustainable development and utilization in Jining City planning area. Sustainability 2023, 15, 12767. [Google Scholar] [CrossRef]
  62. Senapati, U.; Das, T.K. Assessment of basin-scale groundwater potentiality mapping in drought-prone upper Dwarakeshwar River basin, West Bengal, India, using GIS-based AHP techniques. Arabian J. Geosci. 2021, 14, 960. [Google Scholar] [CrossRef]
  63. Khadka, D.B.; Bhattarai, M. Delineation of ground water potential zoning using GIS and remote sensing by AHP of Sunsari District (Koshi Basin) area of Nepal. J. Eng. Res. Reports 2023, 24, 42–61. [Google Scholar] [CrossRef]
  64. Available online: https://vtv.vn/trong-nuoc/sut-lun-nghiem-trong-lam-sat-lo-9-can-nha-xuong-song-o-soc-trang-20190831225949546.htm (accessed on 31 August 2019).
  65. Available online: https://congly.vn/ca-mau-nhieu-khu-vuc-sut-lun-sat-lo-trong-mua-kho-417981.html (accessed on 20 February 2024).
  66. Available online: https://tintucmientay.baoangiang.com.vn/vung-ngot-ca-mau-lien-tuc-sut-lun-sat-lo-dat-a388628.html (accessed on 21 February 2024).
  67. Available online: https://kinhtemoitruong.vn/sat-lo-bo-song-o-soc-trang-ngay-cang-nghiem-trong-19418.html (accessed on 4 August 2020).
  68. Available online: https://thanhnien.vn/soc-trang-sat-lo-bo-song-3-can-nha-bi-nhan-chim-185230621133210795.htm (accessed on 21 June 2023).
  69. Available online: https://moitruong.net.vn/tra-vinh-cong-bo-tinh-huong-khan-cap-su-co-sat-lo-bo-song-khu-vuc-cu-lao-long-tri-65585.html (accessed on 11 September 2023).
  70. Available online: https://tintucmientay.baoangiang.com.vn/tra-vinh-cong-bo-tinh-huong-khan-cap-su-co-sat-lo-bo-song-tai-huyen-cau-ngang-a384519.html (accessed on 1 January 2024).
Figure 1. Study location map.
Sustainability 16 02920 g001
Figure 2. A flowchart of the structure of this study.
Sustainability 16 02920 g002
Figure 3. Scale comparing the importance of factors [44].
Sustainability 16 02920 g003
Figure 4. (a) Hydrometeorological data at stations in the study area, (b) geological, (c) soil, (d) groundwater flow exploitation, (e) land use maps.
Sustainability 16 02920 g004aSustainability 16 02920 g004b
Figure 5. Factors affecting subsidence: (a) geology, (b) soil, (c) groundwater flow exploitation, (d) flow in the dry season, (e) land use, and (f) evaporation in the dry season.
Sustainability 16 02920 g005aSustainability 16 02920 g005b
Figure 6. Subsidence risk zoning map in the Ca Mau Peninsula area.
Sustainability 16 02920 g006
Table 1. Sample questions on the relation of factors affecting subsidence.
Relevance/Indicator GroupVery
Unrelated
UnrelatedMore or Less RelatedRelatedVery
Related
Geological characteristics
Soil characteristics
Land use characteristics
Annual flow characteristics
Dry-season flow characteristics
Evaporation throughout the year
Characteristics of evaporation in the dry season
Characteristics of underground water exploitation
Topographic characteristics
Characteristics of construction projects
Table 2. KAMET rules analyzed and evaluated using the Delphi method.
Round tRound t + 1Round t + 2
The average value (Mqi) ≥ 3.5If the average value (Mqi) ≥ 3.5; quartile deviation (Qqi) ≤ 0.5; and variance (Vqi) < 15%, qi is accepted and no further qi consultation is required.
The average value (Mqi) ≥ 3.5If Mqi ≥ 3.5, Qqi ≤ 0.5; and Vqi ≥ 15%, round 2 consultation is required.If Mqi ≥ 3.5, Qqi ≤ 0.5, and Vqi ≤ 15%, qi is accepted and no further qi consultation is required.
The average value (Mqi) < 3.5If Mqi < 3.5, Qqi ≤ 0.5, and Vqi ≤ 15%, qi is eliminated and no further qi consultation is required.If Mqi ≥ 3.5, Qqi ≤ 0.5, and Vqi ≤ 15%, qi is accepted and no further qi consultation is required.
Table 3. Random index (RI) [44].
N123456
R1000.250.891.111.25
N789101112
R11.351.41.451.491.521.54
Table 4. Standardized scoring scale.
Object GroupSensitivity LevelPoint Evaluation
Group 1Very high9
Group 2High7
Group 3Medium5
Group 4Low3
Group 5Very Low1
Table 5. Results of asking for expert opinions on the index set.
Consultation RoundIndexMqiQqiVqi (%)
Round 1Geological characteristics4.1
Round 23.6015.2
Round 33.5012.5
Round 1Soil characteristics4.50.5
Round 24.20.3825
Round 33.70.56.3
Round 1Land use characteristics4.3
Round 24.10.515.2
Round 340.512.5
Round 1Annual flow characteristics (*)3.7
Round 23.50.8837.5
Round 33.10.3818.8
Round 1Dry-season flow characteristics3.9
Round 23.80.518.8
Round 33.60.512.5
Round 1Evaporation throughout the year (*)3.7
Round 23.6143.8
Round 33.2131.3
Round 1Characteristics of evaporation in the dry season 3.8
Round 23.60.525
Round 33.50.512.5
Round 1Characteristics of underground water exploitation4.4
Round 24.10.518.8
Round 33.80.512.5
Round 1Topographic characteristics (*)3.7
Round 23.51.3843.8
Round 33.31.3837.5
Round 1Characteristics of construction projects (*)3.6
Round 23.5137.5
Round 33.40.556.3
Note: * Factors are not selected because they don’t meet the KAMET rules.
Table 6. Factors affecting the study area.
FactorsSymbol
Geological characteristicsGeo
Soil characteristicsSoil
Characteristics of groundwater exploitation and useGw
Dry-season flow characteristicsFlow
Land use characteristicsLand
Characteristics of evaporation in the dry seasonEva
Table 8. Sensitivity to geological factors.
Geological CompositionSensitivity LevelPoints
amQ3IV1Very high9
amQ23IV1High7
mQ3IV1Medium5
amQ23IV2Low3
abQ3IV2Very Low1
amQ3IV1: sand, clay, and clay powder; amQ23IV1: clay powder, plant remains, gravel, and sand; mQ3IV1: sand and clay; amQ23IV2: gravel, clay, and clay powder; abQ3IV2: fine sand, silt, clay, and plant remains.
Table 9. Sensitivity to soil factors.
Soil TypeSensitivity LevelPoints
AlluvialVery Low1
AlumLow3
Alkaline soil contaminated with saltMedium5
Peat soilHigh7
Sandy soil with clay layerVery High9
Table 10. Change in underground flow exploitation.
Underground Flow Rate (m3/day)Sensitivity LevelPoints
<500Very Low1
500–1000Low3
1000–2000Medium5
2000–3000High7
>3000Very High9
Table 11. Amount of recharge flow in the dry season in the study area.
Dry-Season Surface Flow (m3/s)Sensitivity LevelPoints
<25Very High9
25–30High7
30–35Medium5
35–40Low3
>40Very Low1
Table 12. Sensitivity to land use factors.
Type of UseSensitivity LevelPoints
Agricultural landVery Low1
Unused landLow3
National defense and security landMedium5
Rural landHigh7
Transport land and urban housingVery High9
Table 13. Evaporation amount in dry season.
Evaporation Amount in Dry Season (mm/month)Sensitivity LevelPoints
<350Very Low1
338–350Low3
350–362Medium5
362–375High 7
>375Very High9
Table 14. Matrix for comparing evaluation criteria.
RateLandQdryGeologicalLand UseETdryQexploit
Land11/31/31/71/71/9
Qdry313333
Geological31/311/91/51/9
Land use71/3911/71/3
ETdry71/35311/7
Qexploit91/39371
Table 15. Weight matrix of evaluation factors.
ElementLandQdryGeologicalLand UseETdryQexploitWi
Land0.0330.1250.0120.0140.0120.0240.036
Qdry0.1000.3750.1100.2930.2610.6390.296
Geological0.1000.1250.0370.0110.0170.0240.052
Land use0.2330.1250.3290.0980.0120.0710.145
ETdry0.2330.1250.1830.2930.0870.0300.159
Qexploit0.3000.1250.3290.2930.6090.2130.312
Table 16. Statistics of areas with different risk levels.
Risk LevelArea (ha)Ratio (%)
Very low risk area598.17236.83
Low risk area512.34431.55
Medium risk area372.00722.91
High risk area140.4608.65
Very high-risk area1.1110.06
Disclaimer/Publisher’s Note: The statements, opinions and data contained in all publications are solely those of the individual author(s) and contributor(s) and not of MDPI and/or the editor(s). MDPI and/or the editor(s) disclaim responsibility for any injury to people or property resulting from any ideas, methods, instructions or products referred to in the content.

