
Distribution and Stabilisation Mechanisms of Stable Landslide Dams

College of Environmental and Civil Engineering, Chengdu University of Technology, Chengdu 610059, China
*
Author to whom correspondence should be addressed.
Sustainability 2024, 16(9), 3646; https://0-doi-org.brum.beds.ac.uk/10.3390/su16093646
Submission received: 23 February 2024
/
Revised: 22 April 2024
/
Accepted: 22 April 2024
/
Published: 26 April 2024
Abstract
:Landslide dams, especially stable landslide dams, have been recognised as important contributors to regional geomorphological evolution. The eastern edge of the Tibetan Plateau provides good conditions for the formation of stable landslide dams. To identify stable landslide dams on the eastern margin of the Tibetan Plateau, the Google Earth Engine (GEE) was first used to map water surfaces in the study area. Then, stable landslide dams were identified using high-precision remote sensing images provided by Google Earth. A field investigation and a sampling of typical stable landslide dams were also adopted to characterise the landslide dams. The results show that 101 stable landslide dams are present in the study area, covering an area of 27.75 × 10⁴ km2. There are four types of stable landslide dams, as follows: (1) landslides, (2) rock avalanches, (3) moraines, and (4) debris flows. The morphological parameters of a dam, which include dam height, dam width, dam volume, and catchment area, can be fitted with different relationship curves, with respect to the number of landslide dams. The source areas of landslide dams are generally located in the upper-middle and upper sections of adjacent mountains. The stability of a landslide dam is mainly controlled by the structure of the dam and the relationship between the dam volume and catchment area. Structurally, large rocks with large particle sizes are difficult to activate using river water and the large gaps between the rocks provide sufficient channels for the flow of river water. In regard to the relationship between the dam volume and catchment area, a river with a small catchment area in the study area is commonly blocked by a large dam volume. This study provides a unique opportunity to study the spatial distribution and clarify the factors influencing the stability of stable landslide dams.
1. Introduction
Since the middle Pleistocene, the Tibetan Plateau has experienced rapid upwards movement, due to the collision between the Indian Plate and the Eurasian Plate [1,2]. This has resulted in the Tibetan Plateau becoming the highest plateau in the world and mountains have also been rapidly uplifting in this area. With the rapid uplift of mountains, slopes have deformed, the integrity of the rock has gradually deteriorated, and deep gorges have formed through river incision. These processes have created good conditions for the formation of landslide dams [3,4,5,6]. A large amount of fractured rock can collapse, forming landslides, debris flows, and other types of mass movement in response to earthquakes, rainfall, and glaciation. Such mass movements can easily block deep gorges and form landslide dams on the margin of the Tibetan Plateau.
Landslide dams, as a natural hazard, are ubiquitous worldwide and often cause great harm to the properties and lives of people over relatively large areas and extended periods, by inundating upstream areas and flooding downstream areas [7,8,9,10,11,12,13,14,15,16]. Many catastrophic landslide dam breach events have occurred on the eastern margin of the Qinghai–Tibet Plateau. For example, the Mogangling landslide dam was formed by the 1786 Ms 7.75 Moxi earthquake and it blocked the Dadu River and, ultimately, caused more than 100,000 deaths after ten days [17,18]. This may be the most disastrous landslide dam breach event in the world. The 1933 Ms 7.5 Diexi earthquake caused three landslide dams to block the Minjiang River and the flood resulted in at least 2500 deaths when the dam was overtopped 45 days later [19,20]. One recent catastrophic landslide dam is the Baige landslide dam, which repeatedly dammed the Jinsha River and numerous roads, bridges, and residential houses on the banks of the lower reaches of the river were destroyed, causing significant economic losses [21,22,23]. In addition, the longevity of landslide dams is very short and approximately 85% of landslide dams are breached within one year [8]. Other scholars have reached similar conclusions from different landslide dam databases [24,25,26]. However, some landslide dams have existed for decades on the eastern margin of the Qinghai–Tibet Plateau; such dams do not cause disasters and also provide many benefits to fluvial geomorphology, the ecological environment, the landscape, and hydropower resource development. For example, the Mahu landslide dam blocked the Huanglang River in Leibo County and has existed for at least 4200 years [27]. The existence of the Mahu landslide dam has influenced the local climate, increasing the yield of vegetables and fruits [28]. A cascading landslide dam also existed long ago in Jiuzhaigou and is now a famous tourist attraction, attracting tens of thousands of tourists every year. Due to three landslide dams that have existed for at least one thousand years in Shenxi Gully, which is located on the Yingxiu–Beichuan fault, the upstream slope has not been continuously eroded by the river. Therefore, when the Ms 8.0 Wenchuan earthquake occurred, although almost all other mountains were stripped bare by landslides and avalanches, the mountains in the Shenxi Gully area were still green, because no landslides or avalanches occurred [29].
This study used the eastern margin of the Qinghai–Tibet Plateau, which is famous for its concentration of landslide dams [30,31,32,33], as the study area. The landslide dams that formed in the study area include both stable and unstable landslide dams. Previous studies on the study area have concentrated on catastrophic landslide dams [34,35]. However, little work has focused on stable landslide dams that benefit the environment, in this study area [36]. The deep canyons on the eastern margin of the Tibetan Plateau provide favourable conditions for the formation and long-term existence of landslide dams. Certain questions about stable landslide dams in this area remain unclear, as follows: what is the distribution of stable landslide dams in this region and why have these landslide dams remained stable? In addition, for the identification of stable landslide dams, traditional remote sensing interpretation methods have been used [37,38,39]. For such a large study area on the eastern edge of the Tibetan Plateau, the workload of the traditional remote sensing interpretation method is large. Hence, to reduce the workload of identifying stable landslide dams in the study area, a method of mapping surface water was adopted in this paper. Field investigations and geotechnical tests were used to clarify the factors influencing the stability of stable landslide dams on the eastern margin of the Tibetan Plateau.
2. Regional Geological Background
2.1. Regional Tectonic Background
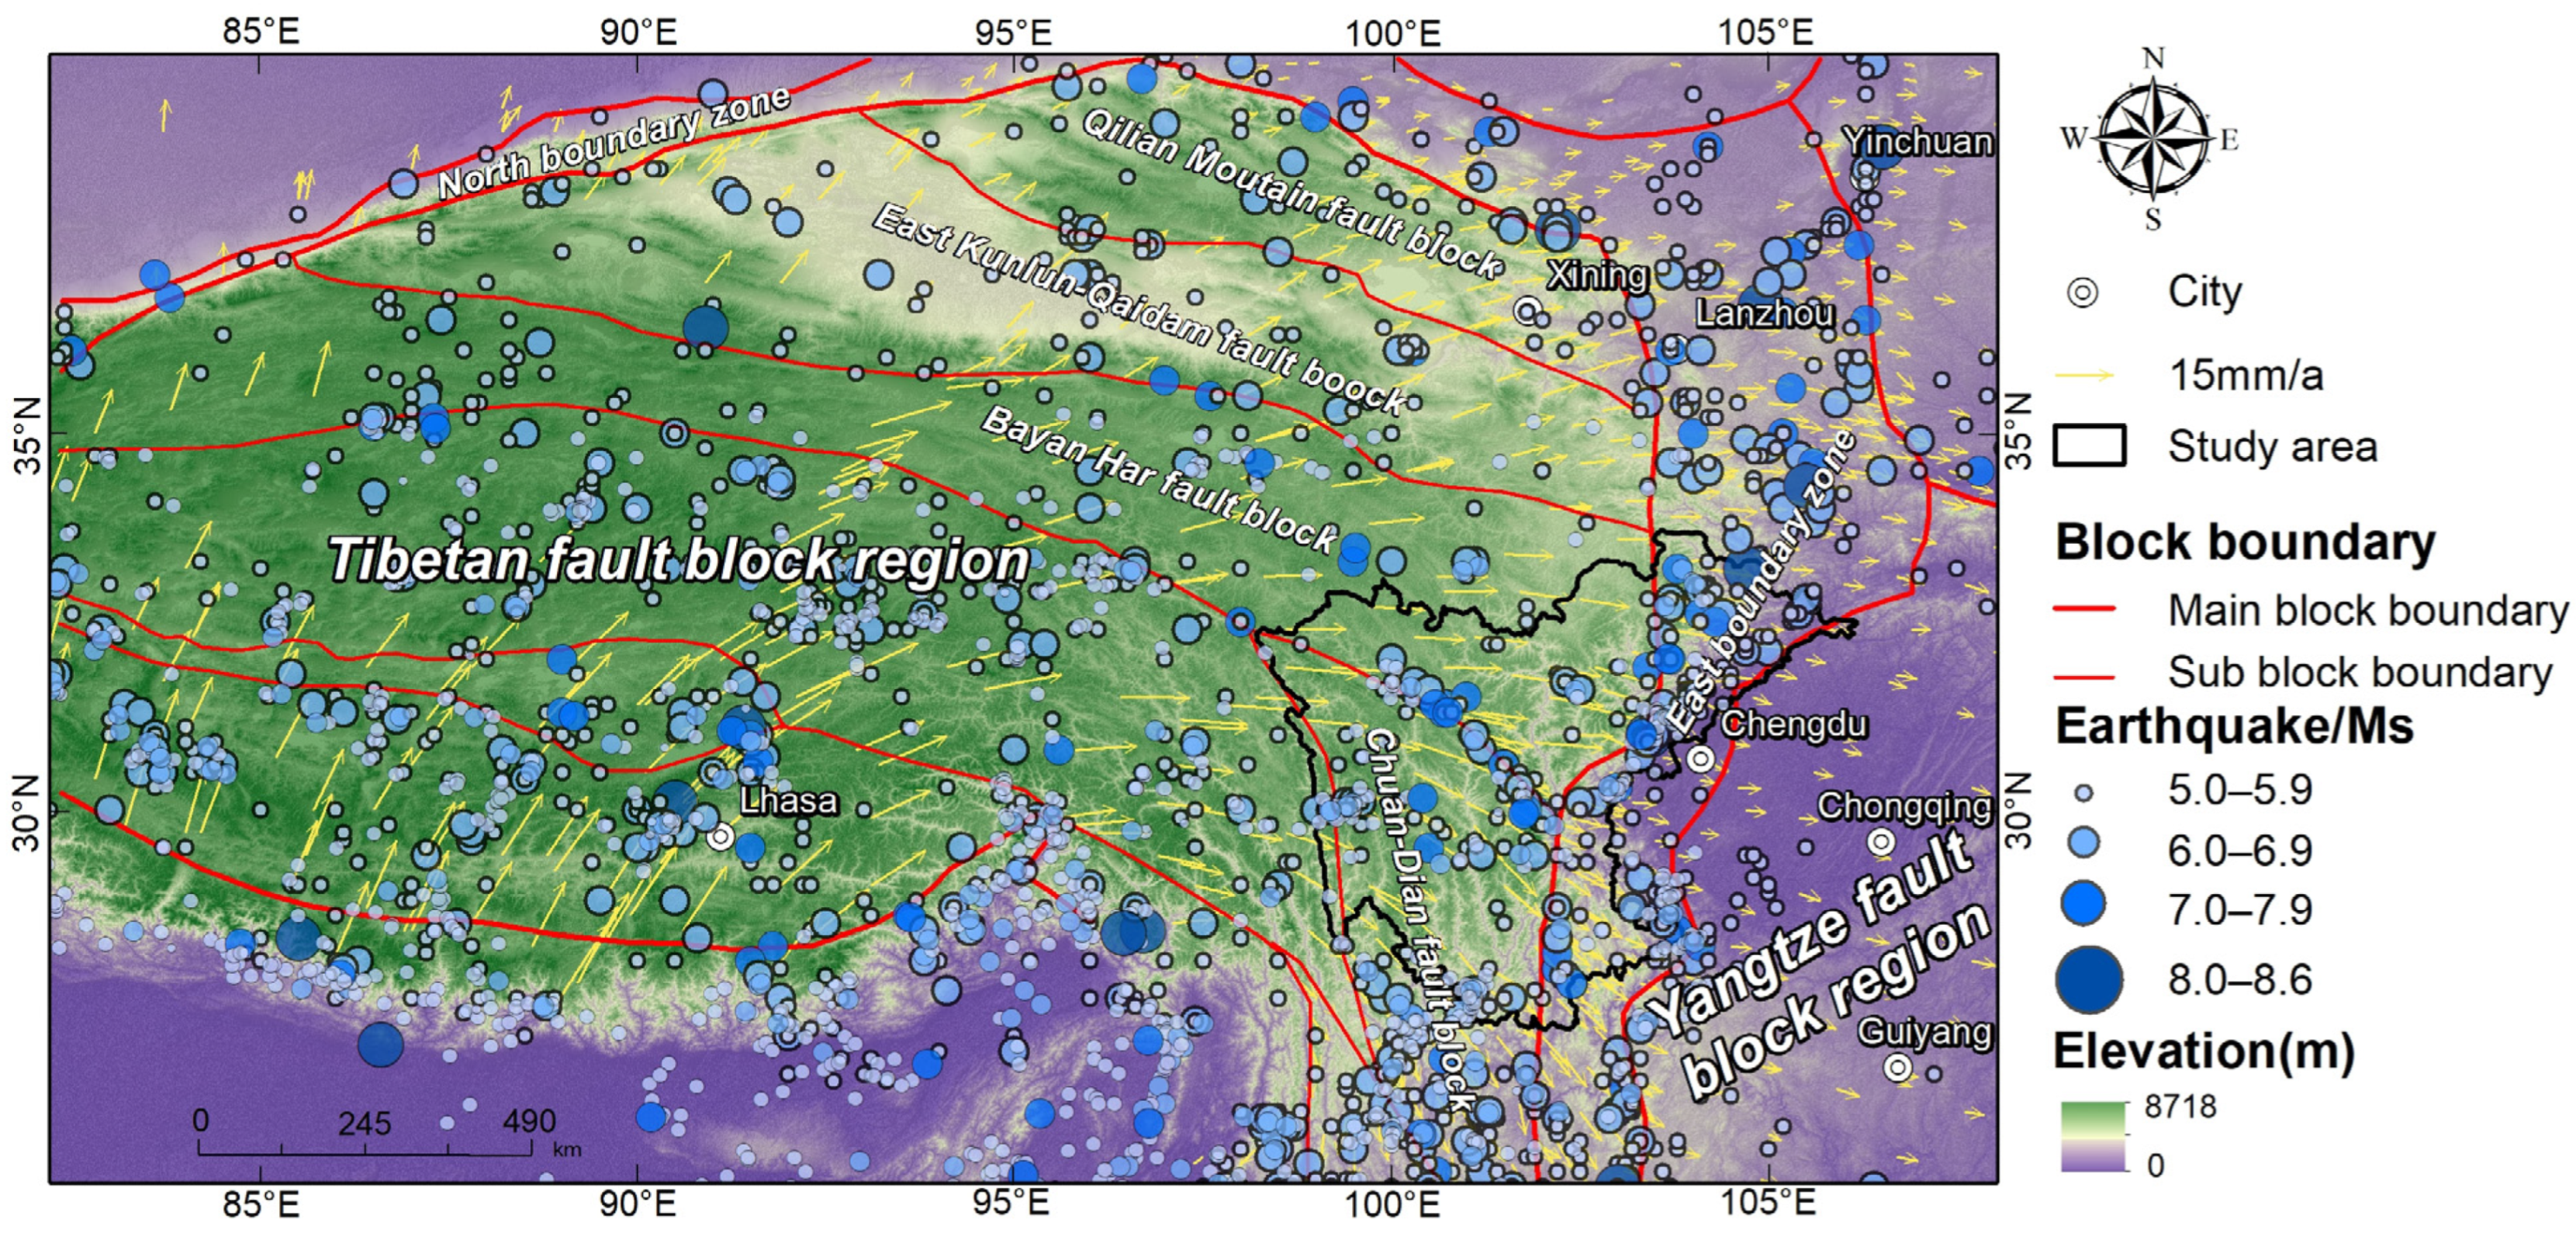
The study area is located in Sichuan Province, Southwest China. This region is also located on the eastern margin of the Tibetan Plateau (Figure 1) and is an ideal area for studying stable landslide dams. According to the regional tectonic structure division, the study area mainly includes three blocks separated by active fault zones, the Bayan Har fault block, the Chuan–Dian fault block, and the eastern boundary zone, which are famous for intense tectonic activity and frequent earthquake events (Figure 1). The study area lies in one of the areas with the most active tectonism in China (Figure 1).
Regional global positioning system (GPS) data show that the motion of more than 10 mm/y in the Chuan–Dian fault block and Bayan Har fault block decreases to less than 6 mm/y in the eastern boundary zone (Figure 1). The dramatic changes in the GPS data indicate that a large amount of energy is accumulating in the crust in the study area.
In response to the intense tectonic activity produced by the movement of blocks, numerous faults have developed in the study area. The main faults in the study area are shown in Figure 2. Several faults with intense activity have produced earthquakes that have formed a series of dammed lakes. For example, the 1786 Ms 7.75 Moxi earthquake on the Xianshuihe fault formed a catastrophic dammed lake [17,18]; the 1933 Ms 7.5 Diexi earthquake on the Minjiang fault formed nine dammed lakes that still exist [30,36]; the Ms 8.0 Wenchuan earthquake on the Longmenshan fault zone (including the Wenchuan–Maoxian fault, Yingxiu–Beichuan fault, and Guanxian–Anxian fault) formed at least 828 dammed lakes [37]; and earthquakes triggered by activity along the Longmenshan fault zone and Xianshuihe fault formed dammed lakes in 2022 [3,42].
2.2. Lithological and Geomorphic Features
Due to intense tectonism, the strata cropping out in the study area are complex and are mainly composed of Sinian, Cambrian, Silurian, and Triassic strata (Figure 2). The strata exhibit certain distribution patterns. The Sinian strata are mainly concentrated in the eastern part of the study area, especially along the Longmenshan fault zone and Xianshuihe fault. The Cambrian strata are mainly concentrated to the east of the Sinian strata and exhibit a NE–SW banded distribution. The Silurian strata are mainly concentrated to the west of the Sinian strata and also exhibit a NE–SW banded distribution. The distribution of Triassic strata is the broadest in the study area, with the highest concentration in the western portion of the study area.
Numerous rivers, including the Jialing River, Tuojiang River, Minjiang River, and Jinsha River, flow through the study area (Figure 3A). The Jinsha River is the upstream portion of the Yangtze River, while the Tuojiang River, Minjiang River, and Jinsha River are secondary tributaries of the Yangtze River. All of these rivers in the study area flow from NW to SE (Figure 3A). Additionally, the water system is extremely well developed in the study area (Figure 3A). Geomorphically, deeply cut gorges are a typical feature in the study area and the elevations of the study area in the west and south are greater than those in the east and north (Figure 3). In addition, the elevation of the study area is generally greater than 3500 m, reflecting a high mountain geomorphology (Figure 3B). The lowest elevation, less than 1000 m, is located in the eastern part of the study area. The topographic relief is greater than 2500 m. The well-developed water system, deeply cut gorge geomorphology, and large topographic relief provide favourable conditions for the formation of dammed lakes in the study area.
3. Methods
This paper defined a dam with a water surface for more than 10 years as a stable landslide dam. First, surface water in the study area was mapped to identify possible dammed lakes. The mapping of the surface water in the study area utilised the research results of Pekel et al. [43], who provided a dataset including high-resolution global surface water mapping results using three million Landsat satellite images. The dataset recorded changes in global surface water over the past 32 years at a 30-metre resolution and can be accessed through the Google Earth Engine (GEE). The GEE is a cloud-based platform commonly used for water mapping [44,45,46]. To determine when a lake formed, surfaces of different colours were set to cover the water surface. Specifically, the water surfaces that existed in 2010 and 2020 were masked with red and yellow surfaces (Figure 4), respectively. Water surfaces that existed for more than 10 years from 2010 to 2020 were masked with a blue surface (Figure 4). However, not all blue surfaces are dammed lakes. Most of them are ponds and common lakes. Hence, to determine whether the blue surfaces correspond to dammed lakes, high-precision remote sensing images from Google Earth were examined. If a dammed lake was covered by a blue surface, a high-precision remote sensing image from Google Earth was used to determine whether the lake was formed by a dam. If a lake is a dammed lake, then the dam body must have a source region that can be identified using high-precision remote sensing images from Google Earth. If a lake was determined to be a dammed lake, then the corresponding dam body was defined as a stable landslide dam in this paper.
Second, the morphological characteristics of stable landslide dams, including dam height, dam width, dam volume, and the catchment area of the landslide dam, were obtained from Google Earth. Google Earth can provide high-precision remote sensing images to accurately measure and collect the morphological parameters of landslide dams.
Third, a field investigation of typical landslide dams was carried out to evaluate the accuracy of this surface water mapping method (Figure 5). To reveal the typical characteristics of landslide dams, the lithology, material, composition, structure, and boundary of a typical landslide dam body were obtained via field investigation. In addition, the particle size distribution of a typical landslide dam was obtained using the research method used in (Figure 5A,B) [9]. Specifically, an area was selected in a representative profile of a landslide dam to measure particle sizes larger than 100 mm (Figure 5C). For particles less than 100 mm in size, a typical profile was sampled and sieves with diameters of 60 mm, 40 mm, 20 mm, 10 mm, 5 mm, 0.25 mm, and 0.075 mm were used to determine the particle size in the laboratory (Figure 5D). The particle size distributions of the rock avalanche-type landslide dams were obtained via the same methods. Two measurement areas with side lengths of 10 m were selected to determine the distribution of particle sizes larger than 100 mm.
4. Results
4.1. The Characteristics of Stable Landslide Dams
4.1.1. Basic Characteristics
The results of the stable landslide dam inventory show that 101 stable landslide dams are located in the 27.75 × 10⁴ km2 study area (Figure 6). Based on the distribution of stable landslide dams in the river basin, there are differences in the distribution of stable landslide dams in different river basins. Specifically, the number of stable landslide dams distributed in the Minjiang River Basin is the highest, at 19. There are 18 and 15 stable landslide dams distributed in the Yalong River and Jinsha River Basins, respectively. The Bailong River, Dadu River, Fujiang River, Xianshuihe River, Tuojiang River, Litang River, Zagunao River, and Heishui River Basins contain 13, 13, 6, 5, 4, 4, 2, and 2 stable landslide dams, respectively (Figure 6A). In addition, stable landslide dams are distributed in clusters along large faults (Figure 6B). The large faults include the Tazang Fault, Minjiang Fault, Longmenshan Fault Zone, Xianshuihe Fault, Yunongxi Fault, Ganzi–Yushu–Fenghuoshan Fault Zone, and Boke–Muli Fault. The highest landslide dam concentration along a large fault reaches 0.02/km2.
4.1.2. Types of Landslide Dams
A landslide dam is a result of the runout of a landslide and interaction with local topography [11]. Based on the field investigation and remote sensing data, four types of landslide dams were identified in the study area (Figure 7), as follows: (1) landslides, in which the rockslides disintegrate rapidly during long-distance movement and flow extremely rapidly on a steep slope (Figure 7A); (2) rock avalanches, in which the integrity of the rock is destroyed by discontinuity joints and the fragmented rock starts to move in response to gravity or earthquakes (Figure 7B); (3) moraines, in which the deposits are formed by glaciation (Figure 7C); and (4) debris flows, in which water and material derived from a saturated debris flow move extremely rapidly in steep channels, induced by rainfall (Figure 7D).
4.1.3. Morphological Characteristics
A sketch of the morphological parameters of a landslide dam is shown in Figure 8. The specific morphological parameters of a landslide dam include dam height, dam width, dam volume, and catchment area (Figure 8A). To determine the morphological characteristics of the stable landslide dams in the study area, the dam length, dam height, dam volume, and catchment area of the stable landslide dams were statistically analysed.
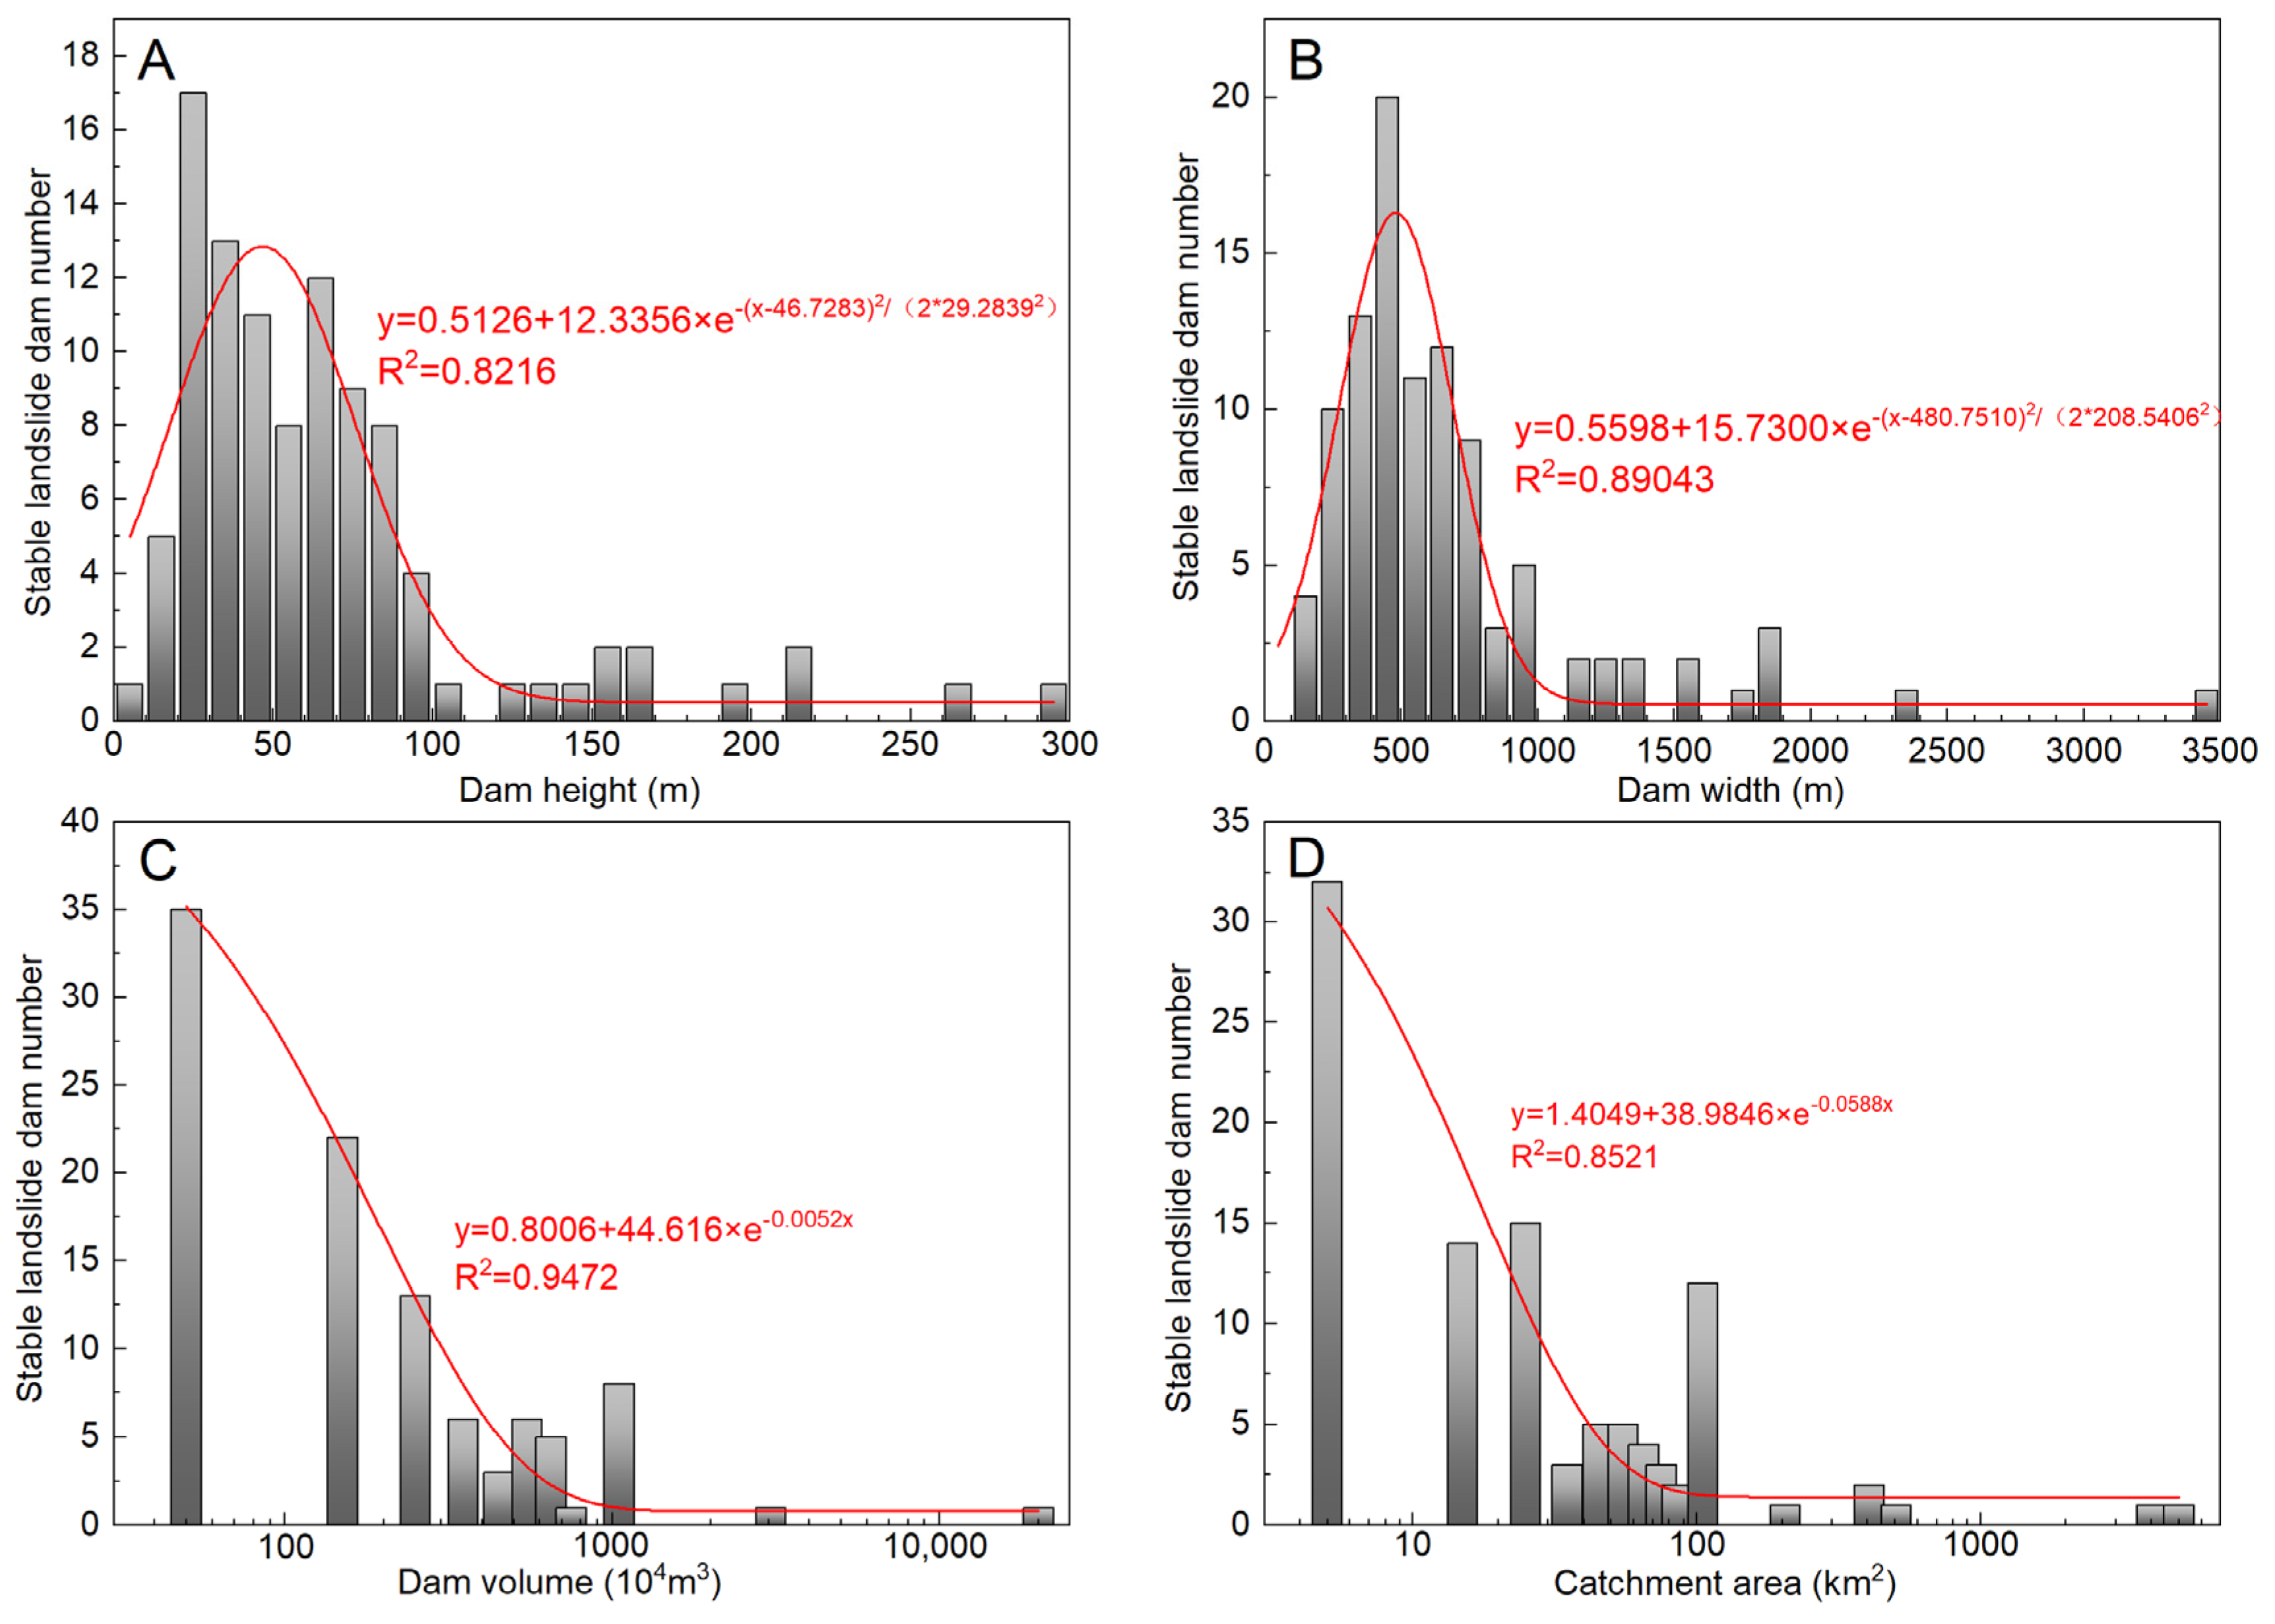
The statistics of the dam height results are shown in Figure 9A. As the height of the dam increases, the number of landslide dams first increases and then decreases. The dam height is concentrated within 100 m. Dams with heights of less than 100 m accounted for 87% of the dam. The fitting function for the relationship between dam height and the number of landslide dams is as follows (where y is the number of landslide dams and x is the dam height):
The statistics of dam width indicate that most landslide dam widths are less than 1000 m, accounting for 86% of all landslide dams (Figure 9B). As the width increases, the number of landslide dams first increases and then decreases. The number of dams with widths in an interval of [400, 500] is the greatest, reaching 20. The widest width of a stable dam exceeds 3000 m (the Mahu landslide dam). The fitting function for the relationship between dam width and the number of landslide dams is as follows (where y is the number of landslide dams and x is the dam width):
The actual landslide dam volume in this inventory is difficult to obtain and a classical empirical equation that considers landslide material characteristics through a volume–area (V–A) scaling parameter can be used to estimate the volume; the general relationship is expressed as follows:
where V is the volume of the landslide dam and A is the area of the dam. This equation was also applied to estimate the volume of the landslide dam produced by the 2008 Wenchuan earthquake [38]. Landslide dams can be divided into large landslide dams (volume: 100–1000 × 104 m3), super-large landslide dams (volume: 1000–10,000 × 104 m3), and giant landslide dams (volume greater than 10,000 × 104 m3), according to previously published classification criteria [47]. According to the statistics of the dam volume results, most landslide dams are large landslide dams, accounting for 55% of all landslide dams. Moreover, the volume of the largest landslide dam (the Mahu landslide dam) exceeds 10,000 × 104 m3, indicating that it is a giant landslide dam. With increasing dam volume, the number of landslide dams decreases and follows the following function (where y is the number of landslide dams and x is the dam volume) (Figure 9C):
V = 0.146A1.332
y = 0.8006 + 44.616 × e−0.0052x
As shown in Figure 9D, the catchment area of 98% of landslide dams is less than 1000 km2 and only two landslide dam catchment areas exceed 1000 km2. The catchment areas of the Dahaizi and Xiaohaizi landslide dams exceed 1000 km2 and are located on the trunk stream of the Minjiang River. Among dams with catchment areas of less than 1000 km2, stable landslide dams with catchment areas of less than 100 km2 represent the majority, accounting for 82% of all landslide dams. With increasing catchment area, the number of landslide dams decreases according to the following function (where x is the catchment area and y is the number of landslide dams):
y = 1.4049 + 38.9846 × e−0.0588x
4.2. Spatial Distribution of Stable Landslide Dams
4.2.1. Spatial Location
To determine the source location of stable landslide dams on the corresponding mountain, the following three methods were adopted: (1) the location of a landslide dam is controlled by two influencing factors (elevation and distance to the river) (Figure 10); (2) the landslide dam distribution at different mountain positions is qualitatively reflected by the normalised position (normalised distance to the river and ridge line) (Figure 11); and (3) the landslide dam distribution in different mountain sections is quantitatively reflected by the relative position (the ratio of the distance to the valley bottom (L) to the distance from the ridge line to the valley bottom (S)) (Figure 12 and Figure 13).
- (1)
- Profile position
According to the statistics of elevation and the distance to the river for the landslide dams in this inventory, landslide dams are most common at elevations ranging from 1500 m to 5000 m and distances to the river ranging from 300 m to 3000 m (Figure 10). Specifically, the source regions of landslide dams are concentrated at elevations ranging from 4150 m to 4750 m and at distances to the river ranging from 300 m to 1500 m.
- (2)
- Normalised position
The distance of the landslide dam to the river or ridge line was normalised using Formula 6. The method of normalisation can map the distance of a landslide dam to a river or ridge line to an interval of [0, 1] and can also transform the data into a unified dimensionless scalar
where X is the normalised result, x is the distance from the landslide dam to the river or ridge line, min(x) is the minimum distance from the landslide dam to the river or ridge line, and max(x) is the maximum distance from the landslide dam to the river or ridge line. The results of the position normalisation process are shown in Figure 11. The results show that the highest concentration of normalised positions is located in the lower left area close to the Y axis (distance to river), which means that the sources of landslide dams are located close to the ridge line and far from the river (Figure 12).
- (3)
- Relative position
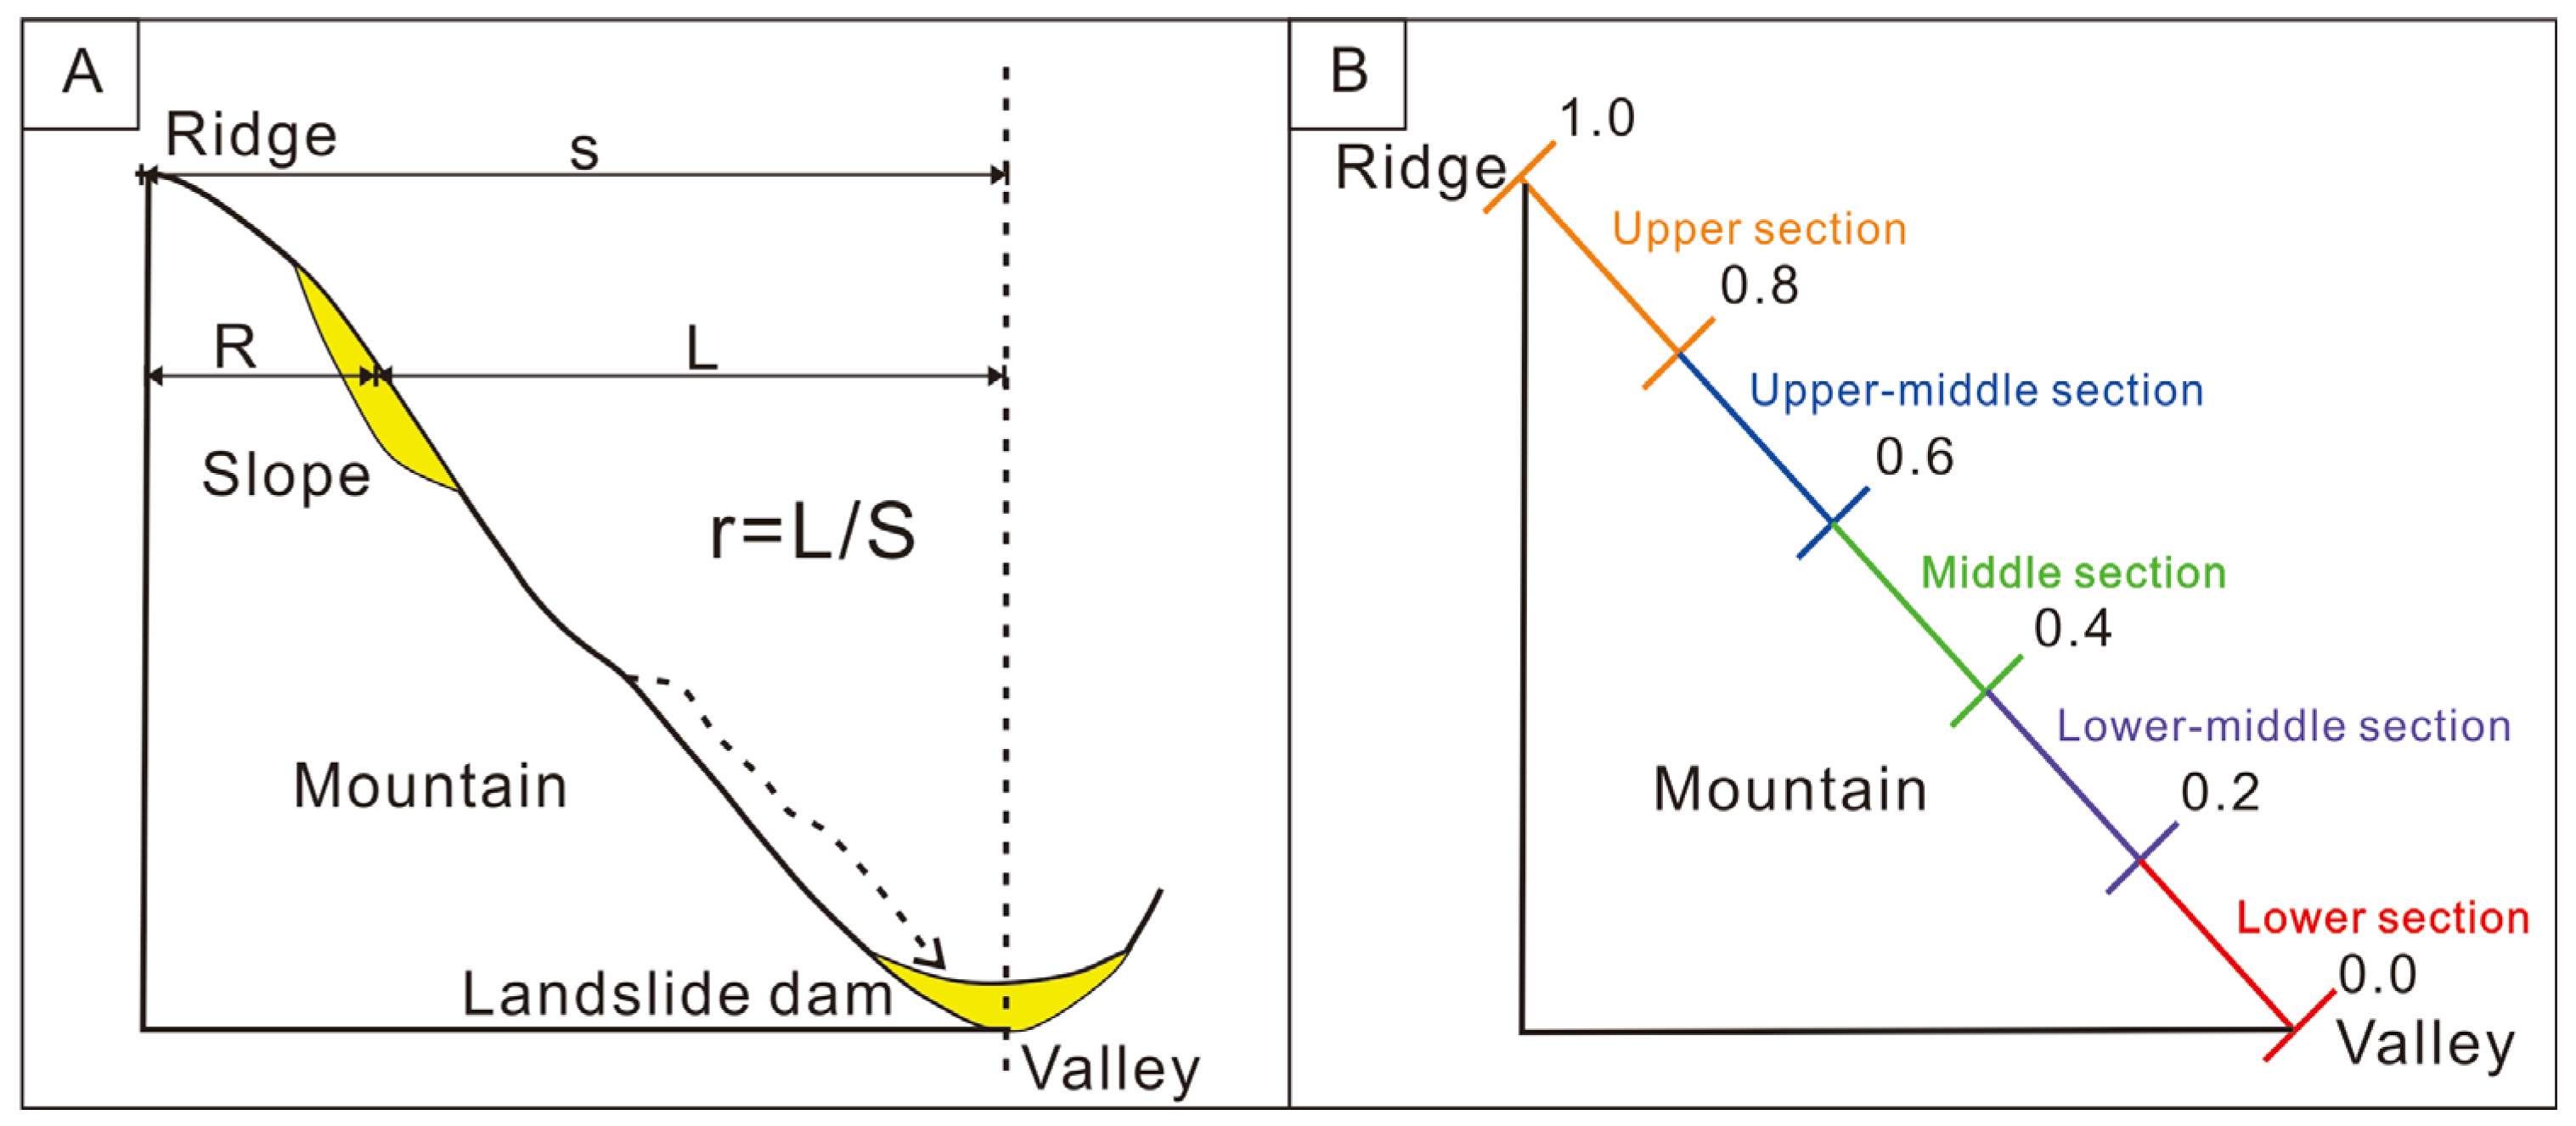
Compared to the above methods, which only qualitatively analyse the landslide dam position, the relative position method can quantitatively determine position information for landslide dams. The value of the relative position (r) is defined by the ratio of the distance to the valley bottom (L) to the distance from the ridge line to the valley bottom (S) (Formula (7) and Figure 12A). Different r values represent different positions on the mountain and the specific definitions of different r values are shown in Figure 12B.
r = L/S
The results of the relative position of the source region of the landslide dams are shown in Figure 13. The r values are mainly concentrated in an interval of [0.7, 0.9], which means that the source areas of the landslide dams mainly correspond to the upper-middle section and upper section of the mountain. The results also confirm the accuracy of the normalised position method.
4.2.2. Other Influencing Factors
- (1)
- Slope and PGA
The statistical results of the slope and peak ground acceleration (PGA) in the study area are shown in Figure 14. The slopes of the source regions of more than 90% of all the landslide dams range from 25° to 55° (Figure 14a1,a2). In particular, the proportion of slopes from 35° to 45° is the highest, accounting for more than 40% of all landslide dams. The PGA values of the landslide dams are concentrated between 0.15 g and 0.2 g (Figure 14b1,b2).
- (2)
- Rock
According to the rock hardness statistics of the strata that produced the landslide dams in the study area, the rocks were divided into the following two types: I—hard rocks and II—interbedded soft–hard rocks. The hard rocks include dolomite, sandstone, granite, limestone, basalt, and other hard rocks. The interbedded soft–hard rocks include sandstone interbedded with slate, limestone interbedded with phyllite, and siliceous rocks interbedded with slate. The only soft rock present is phyllite (Figure 14c1). Granite and limestone landslide dams are the most common, totalling 18 and 22 dams, respectively. Sandstone–slate dams are the most common form of interbedded soft–hard rock dam, representing 24 dams. The proportions of hard rocks and interbedded soft–hard rocks are 65% and 35%, respectively (Figure 14c2).
4.3. The Characteristics of a Typical Stable Landslide Dam
4.3.1. Characteristics of Landslide-Type Landslide Dams
- (1)
- Basic characteristics
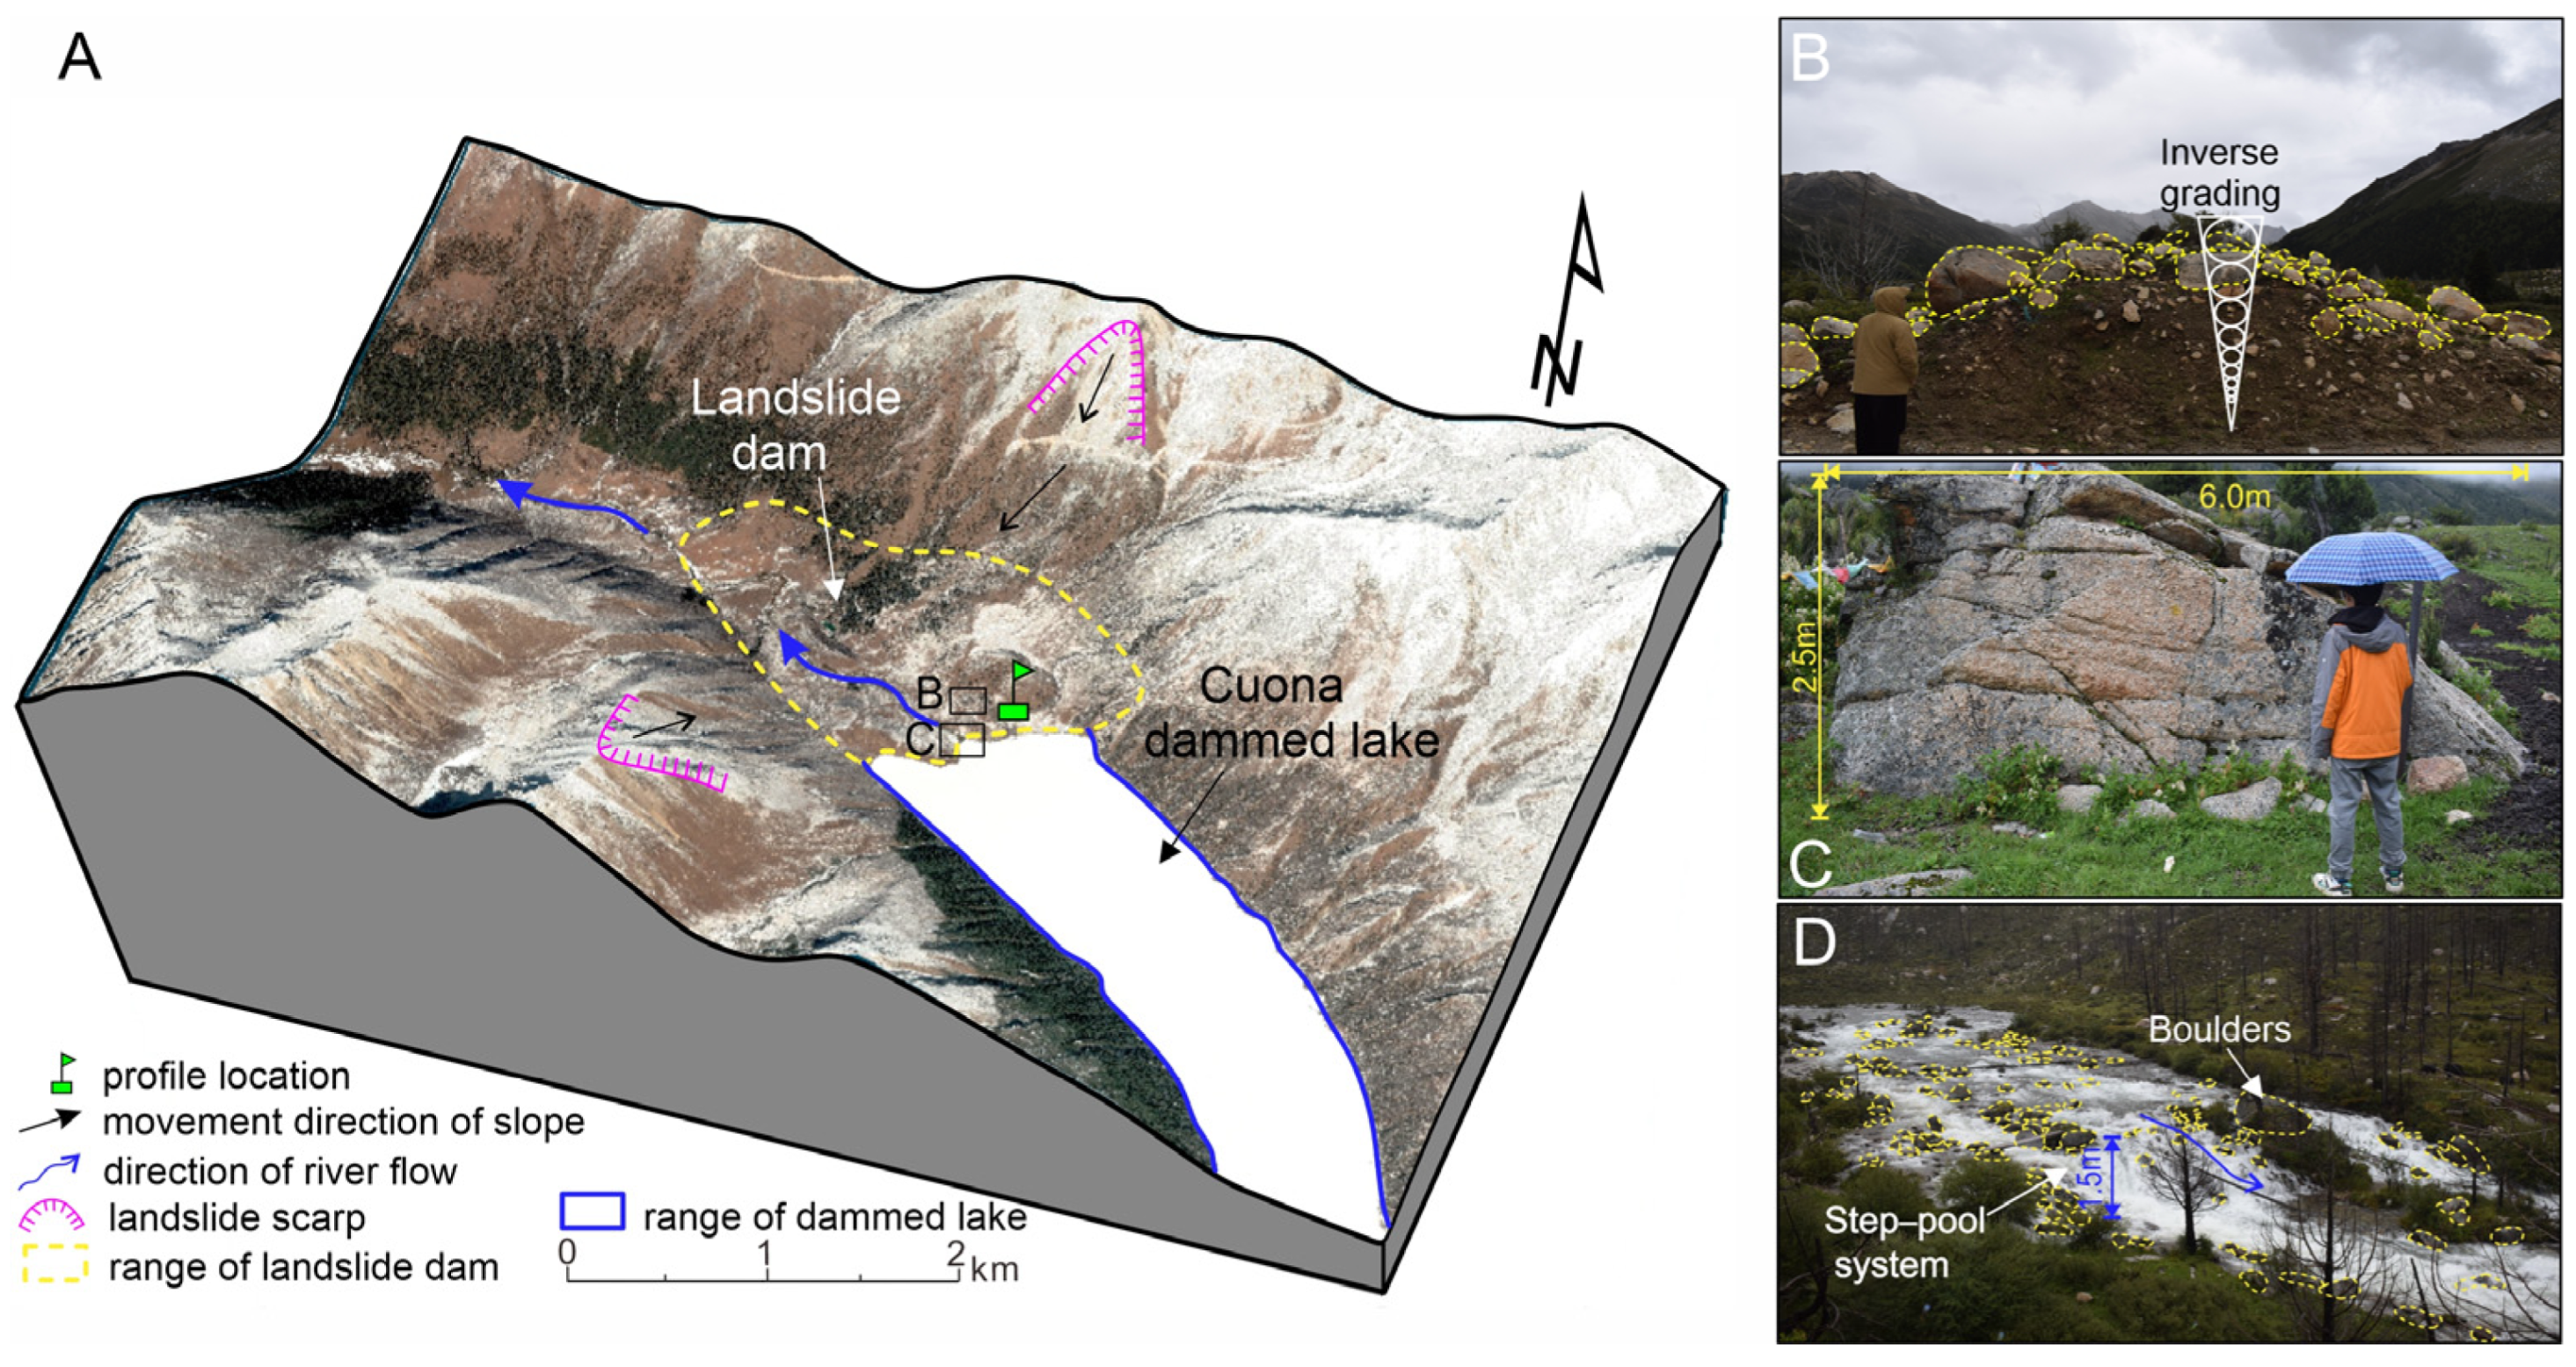
The Cuona landslide dam is located in the Lieyi township, Batang County, Garze Tibetan Autonomous Prefecture, Sichuan Province, with coordinates of 99°31′56.6″ E and 30°11′54.6″ N, as shown in Figure 15A. The Cuona landslide dam was sourced from the slope on the left and right banks of the river, composed of upper Yanshan granite, which underwent damage and high-speed movement under the influence of an earthquake, ultimately resulting in loose rocks collapsing and forming the dammed lake. Due to the high-speed movement of the loose rocks, the dam structure exhibits inverse grading (Figure 15B). Specifically, the upper part of the dam is composed of coarse particles, while the lower part of the dam is composed of fine particles. Scattered boulders are present everywhere on the surface of the landslide dam and the diameter of the largest boulder reaches 6 m (Figure 15C). Many boulders can also be observed inside the spillway and a step–pool system has also developed inside the spillway (Figure 15D).
- (2)
- Structural characteristics of the landslide dam
To quantitatively analyse the structural characteristics of the landslide dam, the particle size distribution of the Cuona landslide dam was determined (Figure 16). According to the results of the particle size distribution, the grading curves of the particles in the first layer (upper layer) and the second layer (lower layer) show significant offset characteristics from left to right. This quantitatively indicates that the landslide dam has obvious sorting in the vertical direction. Namely, the higher the profile position is, the larger the particle size inside it.
Specifically, the first layer of the landslide dam is mainly composed of boulders (d > 200 mm) with a content of 80%. The contents of gravel (2 mm < d < 60 mm) and sand are both 10%. In the second layer of the landslide dam, the contents of boulder and gravel (d > 60 mm) are significantly lower, reaching 47%. The boulder content accounts for 25% and particles with d > 500 mm are absent. The contents of gravel and sand are 33% and 20%, respectively.
4.3.2. Characteristics of a Rock Avalanche-Type Landslide Dam
- (1)
- Basic characteristics
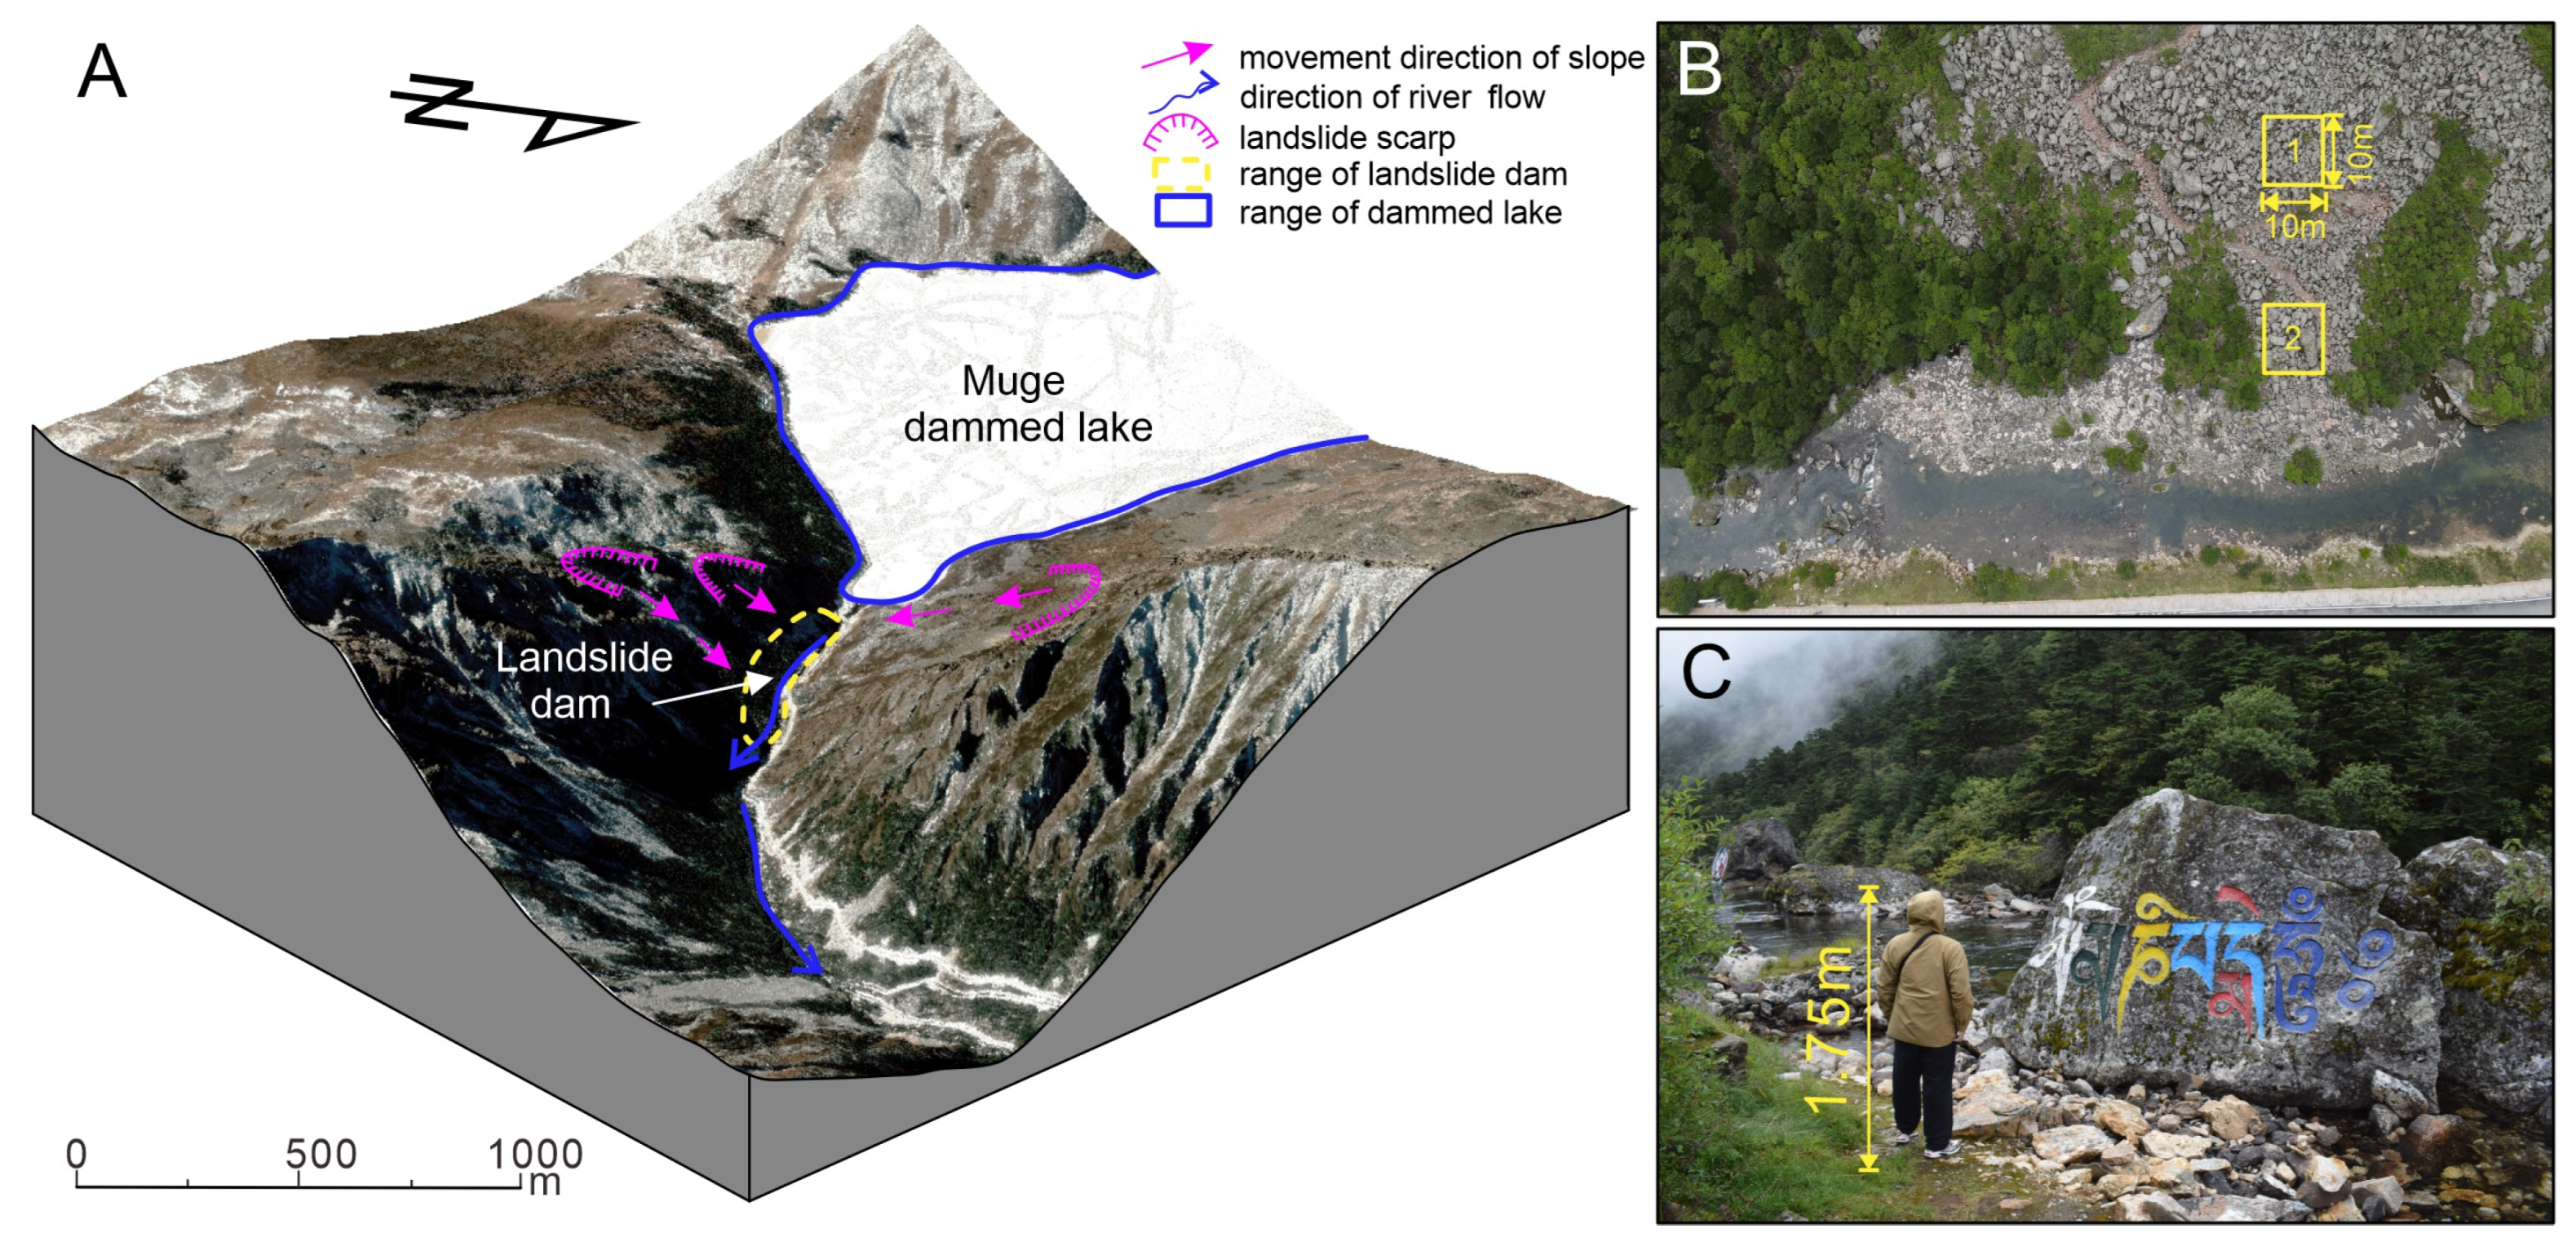
The Mugecuo landslide dam is located in Kangding city, Garze Tibetan Autonomous Prefecture, Sichuan Province, with coordinates of 101°51′52.7″ E and 30°9′12.1″ N; it is shown in Figure 17A. The Mugecuo landslide dam was sourced from the slopes on both banks of the river, which are composed of upper Yanshan granite. A rock avalanche was triggered by an earthquake (Figure 17A). Due to the formation mechanism of the rock avalanche, the entire landslide dam is composed of boulders (Figure 17B). Boulders with diameters exceeding 1.75 m are distributed inside the spillway (Figure 17C).
- (2)
- The structural characteristics of this rock avalanche-type landslide dam
To quantitatively analyse the structural characteristics of this rock avalanche-type landslide dam, the particle size distribution of the Mugecuo landslide dam was obtained. The results are shown in Figure 18.
The results of Window 1 represent the original structure of the rock avalanche-type landslide dam, which has not been disturbed by the river. The results show that the boulder diameter in Window 1 is mainly 0.2~2 m. Approximately 64% of the total boulders have a diameter of 0.2~1 m. The results of Window 2 represent the structure of the rock avalanche-type landslide dam that has been disturbed by the river. The results show that the boulder diameter in Window 2 is also 0.2~2 m. However, the number of boulders with a diameter of 0.2~1 m decreased to 55% of the total number of boulders. Notably, the content of boulders with a particle size greater than 1 m remains unchanged between Window 1 and Window 2.
5. Discussion
According to a field investigation and a comprehensive analysis of typical landslide dams, the stability of a landslide dam is mainly controlled by the structure of the landslide dam and the relationship between the dam volume and catchment area.
5.1. The Structure Influences the Stability of the Landslide Dam
Landslide-type and rock avalanche-type landslide dam structures have different impacts on the stability of landslide dams. According to the field investigation, landslide-type landslide dams always have an inverse grading structure. This means that the upper and lower parts of the landslide-type dam are composed of coarse and fine particles, respectively. Due to the strong erosion resistance of the coarse particles in the upper part of the landslide dam, the fine particles in the lower parts of the landslide dam are protected from erosion by the river. This is the reason why the river flows through the landslide dams by runoff and the dams are not destroyed. In particular, the dead storage capacity of a dammed lake is protected from leakage by the impermeability of fine particles during the dry season (Figure 19A). With the upstream river influx in the wet season, the water in the dammed lake flows downstream between the coarse particles, which protects the fine particles from being eroded by the river (Figure 19B). In addition, a step–pool system commonly develops inside spillways. The step–pool system has been widely proven to have extremely strong river resistance in mountainous rivers; such systems can maximise the consumption of river energy and protect the riverbed inside the spillway from erosion [29,48]. Many stable landslide dams with inverse grading sequence structures have been observed worldwide. For example, the Usoi landslide dam is the largest dam in the world and has existed for more than 100 years and the structure of the dam also shows an inverse grading sequence [16].
Rock avalanche-type landslide dams are composed of many boulders, which provide enough voids to allow the river to flow through. On the other hand, in both the disturbed and undisturbed areas of the Mugecuo landslide dam, the content of boulders with a particle size greater than 1 m is the same. This means that as long as the boulders are large enough, it is difficult for the boulders to be moved by the river. Large boulders play a crucial role in the stability of rock avalanche-type landslide dams.
To analyse the impact of the structure on the stability of the landslide dam, this study analysed the force on the surface stone particles of the dam body and used the theory of bed load motion to analyse the starting speed of the giant particle structure in the water flow. Specifically, particles located on the surface of the dam body may move under the erosion of river water. Assuming that the dam has a uniform porosity and that the particles are approximately spherical, there are a total of five forces acting on the stone particles [49], as follows: (1) the positive thrust, Fd, of the water flow; (2) the uplift pressure of the water flow, Fl; (3) the effective gravity of the particles, Fw; (4) the permeability, Fp; and (5) the frictional resistance, Fr. The specific particle forces are shown in Figure 20 and the specific calculation formula is as follows:
where Fd is the positive thrust of the water flow; Cd is the thrust coefficient; ρw is the density of water; ub is the water flow velocity acting on the particles; and d is the equivalent diameter of the particle.
where Fl is the uplift pressure of the water flow and CL is the uplift pressure coefficient.
where Fw is the effective gravity of the particle, ρw is the particle density, and g is the gravitational acceleration.
where Fp is the seepage force and i is the hydraulic gradient.
The resistance, Fr, caused by friction in the opposite direction of motion depends on the uplift pressure, Fl, of the water flow; the effective gravity, Fw, of the particles; and the seepage force Fp, expressed as follows:
where Fr is the frictional resistance; Φ is the internal friction angle; β is the slope of the downstream slope of the dam body; and α is the angle between the seepage force and the horizontal direction.
The downstream stone particles of the dam are prone to damage. Therefore, based on the principle of static equilibrium, a force analysis was conducted on the downstream particles of the dam. The sum of the positive thrust force on the particles, the effective gravity force on the particles, and the permeability force of the water flow is equal to the frictional force on the particles, that is:
By substituting Equations (8) to (12) into Equation (13), the relationship between the starting speed of the particles and their particle size can be obtained, as follows:
Based on an analysis of Formula (14) combined with the particle initiation velocity in the theory of bed load motion, under the conditions of determining the geometric characteristics and properties of the landslide dam, whether certain block stone particles on the landslide dam are subject to river erosion depends on the flow velocity of the river water. Obviously, the coarser and more uneven the particles on the landslide dam are, the greater the speed at which the particles are washed away by the water flow. The speed required for the block stone particles to be washed and transported is greater, while the speed required for the small block stone particles to be washed and transported is lower. Therefore, when the speed of the river is less than the starting value of the coarse particles on the landslide dam, the coarse layer of coarse particles on the surface of the landslide dam will always exist, which will cause larger stones to block the river channel and the dam will remain stable for a long time.
For the role of the dam structure on the stability of the landslide dam, on the one hand, large rocks with large particle sizes are difficult to activate using river water and the large gaps between the rocks provide sufficient channels for the flow of river water. On the other hand, the deep step–pool system formed in the spillway greatly consumes the energy of the river. These factors provide favourable conditions for the long-term existence of landslide dams in the study area.
5.2. Dam Volume and Catchment Area Influence the Stability of Landslide Dams
To examine the influence of dam volume and catchment area on dam stability, the catchment area corresponding to dam volume was statistically analysed. The results are shown in Figure 21. The results show that most catchment areas of landslide dams are concentrated in an interval from 0 to 90 km2 (Figure 21A). The minimum and maximum average volumes of landslide dams in the concentrated area were 100 × 104 m3 and 1000 × 104 m3, respectively. This means that a river with a small catchment area in the study area is commonly blocked by a large dam volume. In addition, the minimum volume of a landslide dam blocking a corresponding catchment area was fitted with an envelope (Figure 21B). The fitting envelope is as follows:
where y is the stable landslide dam volume and x is the corresponding catchment area. When the volume of the landslide dam is located above the envelope, the volume of the landslide dam may contribute to its stability. The corresponding river flow provided by the catchment area makes it difficult to destroy a large landslide dam. A typical example of a stable landslide dam with a large volume and small catchment area is the Mahu landslide dam. The Mahu landslide dam is currently the largest known dam in China [24], with a volume of 23,800 × 104 m3, and its upstream catchment area is only 110 km2. Ermini and Casagli [9] and Zheng et al. [6] also indicated that dam stability increases with increasing landslide dam volume.
y = 220481.34 + 122791 × e((x−1.75)/963) + 122791 × e((x−1.75)/1177)
6. Conclusions
The eastern edge of the Tibetan Plateau provides good conditions for the formation of stable landslide dams. Previous studies on the study area have concentrated on catastrophic landslide dams. However, little work has focused on stable landslide dams that benefit the environment in the study area. Therefore, this study examined the distribution and mechanisms of stable landslide dams in the study area. The stable landslide dams were identified using the Google Earth Engine (GEE) and high-precision remote sensing images. Finally, 101 stable landslide dams were identified in the study area. Among them, the Minjiang, Minjiang River, Yalong River, and Jinsha River Basins are the top three basins in terms of the number of stable landslide dams, with 19, 18, and 15 dams, respectively. The types of stable landslide dams in the study area mainly include (1) landslides, (2) rock avalanches, (3) moraines, and (4) debris flows. In regard to the morphological characteristics, as the dam height (x) increases, the number of dams (y) first increases and then decreases and satisfies the functional relationship of . As the dam width increases (x), the number of dams (y) also first increases and then decreases and satisfies the functional relationship of . As the dam volume (x) increases, the number of dams (y) gradually decreases and satisfies the functional relationship of y = 0.8006 + 44.616 × e−0.0052x. As the catchment area (x) increases, the number of dams (y) also gradually decreases and satisfies the functional relationship of y = 1.4049 + 38.9846 × e−0.0588x. The source areas of the landslide dams are mainly located in the upper-middle section and upper section of adjacent mountains. The slope, PGA, and lithology could also influence the distribution of landslide dams.
The stability of a landslide dam is mainly controlled by the structure of the dam and the relationship between the dam volume and catchment area. In regard to the role of the dam structure on the stability of the landslide dam, on the one hand, large rocks with large particle sizes are difficult to activate using river water and the large gaps between the rocks provide sufficient channels for the flow of river water. On the other hand, the step–pool system formed in the spillway greatly consumes the energy of the river. These factors provide favourable conditions for the long-term existence of landslide dams in the study area. A river with a small catchment area in the study area is commonly blocked by a large dam. The minimum volume of a landslide dam blocking a corresponding catchment area was fitted with an envelope. The fitting envelope is as follows: y = 220481.34 + 122791 × e ((x−1.75)/963) + 122791 × e ((x−1.75)/1177). When the volume of the landslide dam is located above the envelope, the volume of the landslide dam may contribute to its stability.
Author Contributions
Methodology, Y.W.; Investigation, Y.Z., Z.X., Z.F., S.L. and T.T.; Resources, Y.W.; Writing—original draft, L.S.; Writing—review and editing, Y.W. All authors have read and agreed to the published version of the manuscript.
Funding
This study was supported by the National Natural Science Foundation of China (Grant No. 41877235).
Institutional Review Board Statement
Not applicable.
Informed Consent Statement
Not applicable.
Data Availability Statement
The data presented in this study are available on request from the corresponding author.
Conflicts of Interest
The authors declare no conflicts of interest.
References
- Li, Y.; Wang, C.; Dai, J.; Xu, G.; Hou, Y.; Li, X. Propagation of the deformation and growth of the Tibetan–Himalayan orogen: A review. Earth-Sci. Rev. 2015, 143, 36–61. [Google Scholar] [CrossRef]
- Zhan, J.; Chen, J.; Zhang, W.; Han, X.; Sun, X.; Bao, Y. Mass movements along a rapidly uplifting river valley: An example from the upper Jinsha River, southeast margin of the Tibetan Plateau. Environ. Earth Sci. 2018, 77, 634. [Google Scholar] [CrossRef]
- Fan, X.; Fang, C.; Dai, L.; Wang, X.; Luo, Y.; Wei, T.; Wang, Y. Near real time prediction of spatial distribution probability of earthquake-induced landslides—Take the Lushan earthquake on 1 June 2022 as an example. J. Eng. Geol. 2022, 30, 729–739. [Google Scholar]
- Xu, Q.; Fan, X.-M.; Huang, R.-Q.; Van Westen, C. Landslide dams triggered by the Wenchuan Earthquake, Sichuan Province, south west China. Bull. Eng. Geol. Environ. 2009, 68, 373–386. [Google Scholar] [CrossRef]
- Yin, Y.; Wang, F.; Sun, P. Landslide hazards triggered by the 2008 Wenchuan earthquake, Sichuan, China. Landslides 2009, 6, 139–152. [Google Scholar] [CrossRef]
- Zheng, H.; Shi, Z.; Shen, D.; Peng, M.; Hanley, K.J.; Ma, C.; Zhang, L. Recent advances in stability and failure mechanisms of landslide dams. Front. Earth Sci. 2021, 9, 659935. [Google Scholar] [CrossRef]
- Capra, L. Abrupt climatic changes as triggering mechanisms of massive volcanic collapses. J. Volcanol. Geotherm. Res. 2006, 155, 329–333. [Google Scholar] [CrossRef]
- Costa, J.E.; Schuster, R.L. The formation and failure of natural dams. Geol. Soc. Am. Bull. 1988, 100, 1054–1068. [Google Scholar] [CrossRef]
- Ermini, L.; Casagli, N. Prediction of the behaviour of landslide dams using a geomorphological dimensionless index. Earth Surf. Process. Landf. J. Br. Geomorphol. Res. Group 2003, 28, 31–47. [Google Scholar] [CrossRef]
- Evans, S.G.; Delaney, K.B.; Hermanns, R.L.; Strom, A.; Scarascia-Mugnozza, G. The formation and behaviour of natural and artificial rockslide dams; implications for engineering performance and hazard management. In Natural and Artificial Rockslide Dams; Springer: New York, NY, USA, 2011; pp. 1–75. [Google Scholar]
- Fan, X.; Dufresne, A.; Subramanian, S.S.; Strom, A.; Hermanns, R.; Stefanelli, C.T.; Hewitt, K.; Yunus, A.P.; Dunning, S.; Capra, L.; et al. The formation and impact of landslide dams–State of the art. Earth-Sci. Rev. 2020, 203, 103116. [Google Scholar] [CrossRef]
- Fan, X.; Scaringi, G.; Korup, O.; West, A.J.; van Westen, C.J.; Tanyas, H.; Hovius, N.; Hales, T.C.; Jibson, R.W.; Allstadt, K.E.; et al. Earthquake-induced chains of geologic hazards: Patterns, mechanisms, and impacts. Rev. Geophys. 2019, 57, 421–503. [Google Scholar] [CrossRef]
- Massey, C.I. Kaikoura Earthquake Short-Term Project: Landslide Inventory and Landslide Dam Assessments; GNS Science = Te Pū Ao: Lower Hutt, New Zealand, 2019. [Google Scholar]
- Strom, A.; Abdrakhmatov, K. Rockslides and Rock Avalanches of Central Asia: Distribution, Morphology, and Internal Structure; Elsevier: Amsterdam, The Netherlands, 2018. [Google Scholar]
- Dhital, M.; Rijal, M.; Bajracharya, S. Landslide dams and their hazard after the 25 April 2015 Gorkha Earthquake in Central Nepal. Lowl. Technol. Int. 2016, 18, 129–140. [Google Scholar]
- Schuster, R.L.; Alford, D. Usoi landslide dam and lake sarez, Pamir mountains, Tajikistan. Environ. Eng. Geosci. 2004, 10, 151–168. [Google Scholar] [CrossRef]
- Dai, F.; Lee, C.F.; Deng, J.; Tham, L. The 1786 earthquake-triggered landslide dam and subsequent dam-break flood on the Dadu River, southwestern China. Geomorphology 2005, 65, 205–221. [Google Scholar] [CrossRef]
- Zhao, B.; Wang, Y.; Wu, J.; Su, L.; Liu, J.; Jin, G. The Mogangling giant landslide triggered by the 1786 Moxi M 7.75 earthquake, China. Nat. Hazards 2021, 106, 459–485. [Google Scholar] [CrossRef]
- Bureau, S.S. The 1933 Diexi Earthquake; Sichuan Science and Technology Publishing House: Chengdu, China, 1983. [Google Scholar]
- Chai, H.; Liu, H.; Zhang, Z.; Xu, Z. The distribution, causes and effects of damming landslides in China. J. Chengdu Univ. Technol. 2000, 27, 302–307. [Google Scholar]
- Fan, X.; Xu, Q.; Alonso-Rodriguez, A.; Subramanian, S.S.; Li, W.; Zheng, G.; Dong, X.; Huang, R. Successive landsliding and damming of the Jinsha River in eastern Tibet, China: Prime investigation, early warning, and emergency response. Landslides 2019, 16, 1003–1020. [Google Scholar] [CrossRef]
- Wang, W.; Yin, Y.; Zhu, S.; Wang, L.; Zhang, N.; Zhao, R. Investigation and numerical modeling of the overloading-induced catastrophic rockslide avalanche in Baige, Tibet, China. Bull. Eng. Geol. Environ. 2020, 79, 1765–1779. [Google Scholar] [CrossRef]
- Xu, Q.; Zheng, G.; Li, W.; He, C.; Dong, X.; Feng, W. Study on successive landslide damming events of Jinsha River in Baige Village on 11 Octorber and 3 November 2018. J. Eng. Geol. 2018, 26, 1534–1551. [Google Scholar]
- Korup, O. Recent research on landslide dams-a literature review with special attention to New Zealand. Prog. Phys. Geogr. 2002, 26, 206–235. [Google Scholar] [CrossRef]
- Miller, B.; Dufresne, A.; Geertsema, M.; Atkinson, N.; Evensen, H.; Cruden, D. Longevity of dams from landslides with sub-channel rupture surfaces, Peace River region, Canada. Geoenviron. Disasters 2018, 5, 1. [Google Scholar] [CrossRef]
- Weidinger, J. Stability and life span of landslide dams in the Himalayas (India, Nepal) and the Qin Ling Mountains (China). In Natural and Artificial Rockslide Dams; Evans, S., Hermanns, R., Strom, A., Scarascia-Mugnozza, G., Eds.; Lecture Notes in Earth Sciences; Springer Publication: Heidelberg/Berlin, Germany, 2011; pp. 243–277. [Google Scholar]
- Cui, Y.; Deng, J.; Xu, C. Volume estimation and stage division of the Mahu landslide in Sichuan Province, China. Nat. Hazards 2018, 93, 941–955. [Google Scholar] [CrossRef]
- Wang, Y.; Lu, Y. The colluvial landslide accumulation and its environmental effects in Huanglang, Leibo. J. Mt. Sci. 2000, 18, 44–47. [Google Scholar]
- Wang, Z.; Cui, P.; Yu, G.-A.; Zhang, K. Stability of landslide dams and development of knickpoints. Environ. Earth Sci. 2012, 65, 1067–1080. [Google Scholar] [CrossRef]
- Chai, H.; Liu, H.; Zhang, Z. The catalog of Chinese landslide dam events. J. Geol. Hazards Environ. Preserv. 1995, 6, 1–9. [Google Scholar]
- Cui, P.; Han, Y.; Chao, D.; Chen, X. Formation and treatment of landslide dams emplaced during the 2008 Wenchuan earthquake, Sichuan, China. In Natural and Artificial Rockslide Dams; Springer: New York, NY, USA, 2011; pp. 295–321. [Google Scholar]
- Kapil, J.C.; Sharma, S.; Singh, K.; Shahi, J.S.; Arora, R. Acoustic emission monitoring and analyses for avalanche release and slab fracturing events observed in Great Himalaya. Nondestruct. Test. Eval. 2023, 39, 446–473. [Google Scholar] [CrossRef]
- Zhang, X.; Chen, X.; Liu, W.; Hu, M.; Dong, J. The comprehensive risk assessment of the Tangjiashan landslide dam incident, China. Environ. Sci. Pollut. Res. 2023, 30, 73913–73927. [Google Scholar] [CrossRef]
- Zhang, Z.; Liu, M.; Tan, Y.J.; Walter, F.; He, S.; Chmiel, M.; Su, J. Landslide hazard cascades can trigger earthquakes. Nat. Commun. 2024, 15, 2878. [Google Scholar] [CrossRef]
- Yang, J.; Shi, Z.; Peng, M.; Zheng, H.; Soares-Frazão, S.; Zhou, J.; Shen, D.; Zhang, L. Quantitative risk assessment of two successive landslide dams in 2018 in the Jinsha River, China. Eng. Geol. 2022, 304, 106676. [Google Scholar] [CrossRef]
- Song, L.; Wang, Y.-S.; Hu, D.-Y.; Wu, H.-C.; Tang, T.; Liu, S.-C. Insights into the long-term stability of landslide dams on the eastern margin of the Tibetan Plateau, China—A case study of the Diexi area. J. Mt. Sci. 2023, 20, 1674–1694. [Google Scholar] [CrossRef]
- Fan, X.; Van Westen, C.J.; Xu, Q.; Gorum, T.; Dai, F. Analysis of landslide dams induced by the 2008 Wenchuan earthquake. J. Asian Earth Sci. 2012, 57, 25–37. [Google Scholar] [CrossRef]
- Fan, X.; Dufresne, A.; Whiteley, J.; Yunus, A.P.; Subramanian, S.S.; Okeke, C.A.; Pánek, T.; Hermanns, R.L.; Ming, P.; Strom, A.; et al. Recent technological and methodological advances for the investigation of landslide dams. Earth-Sci. Rev. 2021, 218, 103646. [Google Scholar] [CrossRef]
- Tacconi Stefanelli, C.; Catani, F.; Casagli, N. Geomorphological investigations on landslide dams. Geoenviron. Disasters 2015, 2, 21. [Google Scholar] [CrossRef]
- Zhao, B.; Huang, Y.; Zhang, C.; Wang, W.; Tan, K.; Du, R. Crustal deformation on the Chinese mainland during 1998–2014 based on GPS data. Geod. Geodyn. 2015, 6, 7–15. [Google Scholar] [CrossRef]
- Deng, Q.; Cheng, S.; Ma, J.; Du, P. Seismic activities and earthquake potential in the Tibetan Plateau. Geosci. Front. 2014, 57, 678–697. [Google Scholar]
- Tie, Y.; Zhang, X.; Lu, J.; Liang, J.; Wang, D.; Ma, Z.; Li, Z.; Lu, T.; Shi, S.; Liu, M.; et al. Characteristics of Geological Hazards and It’s Mitigations of the Ms6.8 Earthquake in Luding County, Sichuan Province. Hydrogeol. Eng. Geol. 2022, 49, 1–12. [Google Scholar]
- Pekel, J.-F.; Cottam, A.; Gorelick, N.; Belward, A.S. High-resolution mapping of global surface water and its long-term changes. Nature 2016, 540, 418–422. [Google Scholar] [CrossRef] [PubMed]
- Mahdianpari, M.; Salehi, B.; Mohammadimanesh, F.; Homayouni, S.; Gill, E. The first wetland inventory map of newfoundland at a spatial resolution of 10 m using sentinel-1 and sentinel-2 data on the google earth engine cloud computing platform. Remote Sens. 2018, 11, 43. [Google Scholar] [CrossRef]
- Boothroyd, R.J.; Williams, R.D.; Hoey, T.B.; Barrett, B.; Prasojo, O.A. Applications of Google Earth Engine in fluvial geomorphology for detecting river channel change. Wiley Interdiscip. Rev. Water 2021, 8, e21496. [Google Scholar] [CrossRef]
- Albarqouni, M.M.; Yagmur, N.; Bektas Balcik, F.; Sekertekin, A. Assessment of Spatio-Temporal Changes in Water Surface Extents and Lake Surface Temperatures Using Google Earth Engine for Lakes Region, Türkiye. ISPRS Int. J. Geo-Inf. 2022, 11, 407. [Google Scholar] [CrossRef]
- Xu, Q.; Li, Y.; Zhang, S.; Dong, X. Classification of large-scale landslides induced by the 2008 Wenchuan earthquake, China. Environ. Earth Sci. 2016, 75, 22. [Google Scholar] [CrossRef]
- Wang, Z.-Y.; Melching, C.S.; Duan, X.-H.; Yu, G.-A. Ecological and hydraulic studies of step-pool systems. J. Hydraul. Eng. 2009, 135, 705–717. [Google Scholar] [CrossRef]
- Yan, L.; Lu, Y.-J.; Chiew, Y.-M. Incipient motion of cohesionless sediments on riverbanks with ground water injection. Int. J. Sediment Res. 2012, 27, 111–119. [Google Scholar]
Figure 1.
The regional geological background of the study area. The GPS velocity data are from [40], the fault block data are from [41], and the historical earthquake data are from the China Earthquake Network Center (http://www.cenc.ac.cn/, accessed on 12 December 2023).
Figure 1.
The regional geological background of the study area. The GPS velocity data are from [40], the fault block data are from [41], and the historical earthquake data are from the China Earthquake Network Center (http://www.cenc.ac.cn/, accessed on 12 December 2023).

Figure 2.
Geological map of the study area. TZ F.—Tangzang Fault, WX F.—Wenxian Fault, PW–QC—Pingwu–Qingchuan Fault, XS F.—Xueshan Fault, HY F.—Huya Fault, MJ F.—Minjiang Fault, YX–BC F.—Yingxiu–Beichuan Fault, WC–MX—Wenchuan–Maoxian Fault, GX–AX—Guanxian–Anxian Fault, GL–ZH F.—Ganluo–Zhuhe Fault, DLS F.—Daliangshan Fault, XJH F.—Xiaojianhe Fault, JH–QH F.—Jinhe–Qinghe Fault, BK–ML Fault—Boke–Muli Fault, YNX F.—Yunongxi Fault, ML F.—Mula Fault, CZ F.—Cazhong Fault, LT–DW F.—Litang–Deiwu Fault, SDC F.—Shangdeicha Fault, GZ–LT F.—Ganzi–Litang Fault, ZK–SQ F.—Zengke–Shuoqu Fault, GZ–YS–FHS F.—Ganzi–Yushu–Fenghuoshan Fault, DG–XC F.—Dege–Xiangcheng Fault, YK F.—Yuke Fault, and MEK F.—Merkang Fault.

Figure 3.
The water system and geomorphic features of the study area. (A)—water system features and (B)—geomorphic features. The profile position of (B) is shown in (A).
Figure 3.
The water system and geomorphic features of the study area. (A)—water system features and (B)—geomorphic features. The profile position of (B) is shown in (A).

Figure 4.
Typical water surface images of the study area produced by the Google Earth Engine. (A)—The dammed lakes are covered by blue surfaces in the Diexi area. (B)—A dammed lake is covered by a blue surface in Mahu. (C)—A dammed lake is covered by a blue surface in Tianchi.
Figure 4.
Typical water surface images of the study area produced by the Google Earth Engine. (A)—The dammed lakes are covered by blue surfaces in the Diexi area. (B)—A dammed lake is covered by a blue surface in Mahu. (C)—A dammed lake is covered by a blue surface in Tianchi.

Figure 5.
The method of determining the particle size distribution of a typical landslide dam. (A)—A typical profile of a typical landslide dam; (B)—a sketch map of a typical landslide dam. (C)—A 1 m2 area in a typical landslide dam was selected to determine the distribution of particles larger than 100 mm. (D)—Particles less than 100 mm in size were sampled and sieved in the laboratory to determine the particle size distribution.

Figure 6.
The results of the stable landslide dam inventory. (A)—The distribution of stable landslide dams in the study area. (B)—The corresponding concentration of stable landslide dams in the study area. (1)—Tazang Fault, (2)—Minjiang Fault, (3)—Longmenshan Fault Zone, (4)—Xianshuihe Fault, (5)—Yunongxi Fault, (6)—Ganzi–Yushu–Fenghuoshan Fault Zone, and (7)—Boke–Muli Fault.

Figure 7.
Stable landslide dam types in the study area. (A)—landslide; (B)—rock avalanche; (C)—moraine; and (D)—debris flow (the image in Panel D is from Google Earth).
Figure 7.
Stable landslide dam types in the study area. (A)—landslide; (B)—rock avalanche; (C)—moraine; and (D)—debris flow (the image in Panel D is from Google Earth).

Figure 8.
Sketch of the morphological parameters of a landslide dam. (A)—plan view of a stable landslide dam and (B)—profile of a landslide dam.
Figure 8.
Sketch of the morphological parameters of a landslide dam. (A)—plan view of a stable landslide dam and (B)—profile of a landslide dam.

Figure 9.
Morphological characteristics of the stable landslide dams in the inventory. (A)—The relationship between the number of stable landslide dams and dam height, (B)—the relationship between the number of stable landslide dams and dam width, (C)—the relationship between the number of stable landslide dams and dam volume, and (D)—the relationship between the number of stable landslide dams and catchment area.

Figure 10.
The elevation and distance to the river influence the development of landslide dams.

Figure 11.
Normalised distances to the river and ridge line, revealing the distribution of landslide dam sources at the different mountain positions.
Figure 11.
Normalised distances to the river and ridge line, revealing the distribution of landslide dam sources at the different mountain positions.

Figure 12.
Sketch of the relative position (r). (A)—The definition of the relative position (r) and (B)—the different mountain sections, divided based on the value of the relative position (r). The upper section, upper-middle section, middle section, lower-middle section, and lower section of the mountains are defined by relative position values of [1.0, 0.8), [0.8, 0.6), [0.6, 0.4), [0.4, 0.2), and [0.2, 0), respectively.

Figure 13.
Relative position (r) results.

Figure 14.
Other factors influencing the distribution of landslide dams in the study area. (a1,a2)—The influence of the slope; (b1,b2)—the influence of the PGA; (c1,c2)—the influence of the lithology; 1—dolomite; 2—sandstone; 3—granite; 4—limestone; 5—basalt; 6—other hard rocks; 7—interbedded sandstone–slate strata; 8—interbedded limestone–phyllite strata; 9—interbedded siliceous rock–slate strata; 10—phyllite; I—hard rocks; and II—interbedded soft–hard rocks.

Figure 15.
The basic characteristics of the Cuona landslide dam. (A)—Overview of the Cuona landslide dam; (B)—the inverse grading of the landslide dam; (C)—the largest boulder on the landslide dam; and (D)—the spillway filled with many boulders.
Figure 15.
The basic characteristics of the Cuona landslide dam. (A)—Overview of the Cuona landslide dam; (B)—the inverse grading of the landslide dam; (C)—the largest boulder on the landslide dam; and (D)—the spillway filled with many boulders.

Figure 16.
Particle grading distribution of the Cuona landslide dam.

Figure 17.
Basic characteristics of the Mugecuo landslide dam. (A)—Overview of the Mugecuo landslide dam; (B)—the boulders of the landslide dam; and (C)—a boulder in the spillway.
Figure 17.
Basic characteristics of the Mugecuo landslide dam. (A)—Overview of the Mugecuo landslide dam; (B)—the boulders of the landslide dam; and (C)—a boulder in the spillway.

Figure 18.
Particle size distribution of the Mugecuo landslide dam. The locations of Window 1 and Window 2 are shown in Figure 17B.
Figure 18.
Particle size distribution of the Mugecuo landslide dam. The locations of Window 1 and Window 2 are shown in Figure 17B.

Figure 19.
Sketch of the inverse grading structure in a landslide dam. (A)—Sketch of the landslide dam in the dry season; and (B)—sketch of the landslide dam in the wet season.
Figure 19.
Sketch of the inverse grading structure in a landslide dam. (A)—Sketch of the landslide dam in the dry season; and (B)—sketch of the landslide dam in the wet season.

Figure 20.
Schematic diagram of force analysis on coarse particles in landslide dam blocks.

Figure 21.
Correlation between the catchment area and landslide dam volume. (A)—the concentrated area of the catchment area and the average volume; and (B)—the fitting curve of the catchment area and the minimum volume.
Figure 21.
Correlation between the catchment area and landslide dam volume. (A)—the concentrated area of the catchment area and the average volume; and (B)—the fitting curve of the catchment area and the minimum volume.

Disclaimer/Publisher’s Note: The statements, opinions and data contained in all publications are solely those of the individual author(s) and contributor(s) and not of MDPI and/or the editor(s). MDPI and/or the editor(s) disclaim responsibility for any injury to people or property resulting from any ideas, methods, instructions or products referred to in the content. |
© 2024 by the authors. Licensee MDPI, Basel, Switzerland. This article is an open access article distributed under the terms and conditions of the Creative Commons Attribution (CC BY) license (https://creativecommons.org/licenses/by/4.0/).
Share and Cite
MDPI and ACS Style
Song, L.; Wang, Y.; Zhao, Y.; Xiao, Z.; Feng, Z.; Liu, S.; Tang, T. Distribution and Stabilisation Mechanisms of Stable Landslide Dams. Sustainability 2024, 16, 3646. https://0-doi-org.brum.beds.ac.uk/10.3390/su16093646
AMA Style
Song L, Wang Y, Zhao Y, Xiao Z, Feng Z, Liu S, Tang T. Distribution and Stabilisation Mechanisms of Stable Landslide Dams. Sustainability. 2024; 16(9):3646. https://0-doi-org.brum.beds.ac.uk/10.3390/su16093646
Chicago/Turabian StyleSong, Liang, Yunsheng Wang, Yuchao Zhao, Zhuolin Xiao, Zhuo Feng, Shicheng Liu, and Tao Tang. 2024. "Distribution and Stabilisation Mechanisms of Stable Landslide Dams" Sustainability 16, no. 9: 3646. https://0-doi-org.brum.beds.ac.uk/10.3390/su16093646
Note that from the first issue of 2016, this journal uses article numbers instead of page numbers. See further details here.