Article

Regional Informatization and Economic Growth in Japan: An Empirical Study Based on Spatial Econometric Analysis

1
Business School, Beijing Normal University, No.19 XinjiekouWai Street, Beijing 100875, China
2
Oberlin University, 3758 Tokiwa-machi, Machida-shi, Tokyo 194-0294, Japan
*
Author to whom correspondence should be addressed.
Sustainability 2014, 6(10), 7121-7141; https://0-doi-org.brum.beds.ac.uk/10.3390/su6107121
Submission received: 25 April 2014 / Revised: 26 September 2014 / Accepted: 30 September 2014 / Published: 16 October 2014
(This article belongs to the Section Economic and Business Aspects of Sustainability)

Abstract

:
Research opinion on informatization is divided between two opposite poles—that it promotes or inhibits the spillover of regional economies. These conflicting viewpoints are called “the paradoxical geographies of the digital economy”. Information-based investment and diffusion of informatization contribute to breaking the economic space constraints caused by distance, leading to interregional spillover effects, according to the results of the Durbin model of spatial lag applied to Japanese regional data. Clearly, the local direct effects and the perimeter region’s indirect effects of informatization are both positive. This proves the existence of network externality, which causes increasing returns to scale. Extensive diffusion of information technology plays a significant role in the process, in addition to rapid accumulation and infiltration of information resources, which strengthens the information-based investment spillover effect. In this empirical analysis, evidence seems to support the view that informatization promotes economic development in Japan.

1. Introduction

Research opinion on the relationship between informatization and economic growth is divided between two extreme positions, represented by “the digital divide” and “the world is flat” perspectives. The former refers to the ever-increasing inequalities in a nation, region, or class, or between individuals, due to the gap-boosting effect of the information-acquisitioning ability on the information-based economic development process. This implies that informatization is the driving force behind a wealthier, better society. Conversely, the latter opinion holds that with the diffusion of the Internet and modern communication technology, economic, cultural, and political distinctions are becoming blurred, resulting in a flat, minified world. On the surface, the two opinions are diametrically opposite to each other. However, both of them essentially involve the same question, namely, to what extent does informatization influence the economic space constraint? This question leads to two typical spatial metaphors.
According to the logic of the digital divide, informatization will at least lead to economic concentration at first, if not an economic agglomeration effect, and the confinement of generalized space length (which includes physics, language, culture, skill, capital, and other areas), which is still obvious, is strengthened [1]. Conversely, informatization will reduce the confinement of space length, and the interregional and international economic spillover effect will be highly strengthened, according to the world is flat perspective. Although neither viewpoint denies, while both indeed highlight, the role of informatization in promoting economic growth, it is directed at the opposite pole in each case. This logical difference is called “the paradoxical geographies of the digital economy” [2].
“The paradox of the geographical and digital economy” has been the subject of endless debate since the 1990s. However, empirical research at the regional level is scare. Studies on the effect of informatization on economic growth mainly focus on macro-level issues. Informatization has obviously promoted the economic growth of developed countries [3,4,5,6,7]. Two reports of OECD [8], “ICT and Economic Growth” and “The Economic Impact of ICT”, show that with the diffusion of Internet and the mobile phone, ICT was the main driving force for economic growth during the research period [9,10]. The other study which is based on 1995–2005 data on more than 100 countries, extends the research to developing countries, and finds clear evidence of the spreading effect of information technology during the studied period, especially in the developing countries, where informatization makes a greater contribution to economic growth than in the developed counties [11]. Meanwhile, there is a strong positive relationship between investment intensity and the effect of informatization.
These studies show that informatization creates an obvious spreading effect at the national level. The concerns of the gap theory seem to be inappropriate, and the flat theory appears to have the upper hand. However, the paradox has not been resolved for any in-depth study. Because the development, concentration, and spread of informatization usually appear at the regional level, the phenomenon could exist inside or outside one country, but the national-level analysis neglects these factors. Therefore, some biased conclusions could be drawn from the fact that the paradoxical geographies of the digital economy have been resolved through national-level analysis. Therefore, regional-level analysis covering neighboring countries is necessary.
Previous studies have found that agglomeration of industry is not subject to administrative boundaries [12]. From previous research on European ICT industry agglomeration, the inductive effect on the economy from ICT is not limited to a single nation, but is a transboundary supranational phenomenon from the spatial spillover effect [13]. Therefore, ICT is likely to lead to decentralization of economic activity based on the analysis of Italy, which thus favors diminishing economic discrepancy among regions. In another study on thirteen Asian nations, an analysis of production shows serious problems with the digital divide and the spread phenomenon of Asian ICT [14]. The Japanese Ministry of Economic Information and Communication conducted empirical research using data on forty-seven Japanese provinces for the 1975–2005 period to analyze the relationship between ICT investment, the level of informatization, and economic growth, and found evidence of the promotional effect of informatization. Moreover, ICT, spillover of the intersection of ICT and informatization was notable. ICT and informatization have become one of the main driving forces for the economic development of Japan, especially since 1998 [15].
Research on the relationship between informatization and economic growth conducted from a regional perspective have arrived at some meaningful conclusions. However, there are some problems. First, this type of research is very limited. Moreover, much of the research is incidental to studies on other topics. Therefore, it is not systematic. Second, the regional or spatial relationship perspective is not involved in these research studies, so the economic growth promotion effect of informatization can neither be truly proved nor disproved. Finally, although the influence of spatial relationship has been considered, the emphasis is on the mutual influence of inter-regional economic growth (induced variable) in space, while the effect on economic growth from the spatial relationship of informatization (independent variable) is neglected.
To address the flaws of the research discussed above, this article plans to analyze the following aspects: first, whether, from a regional spatial relationship perspective, the informatization effect on economic growth is based on the concentration (digital divide) or spreading (world is flat) effect; second, the direct and indirect effects of informatization on economic growth, with the interaction effect of economic growth and the informatized space simultaneously incorporated into the model.

2. Construction of the Analytical Model

2.1. Basic Model

Based on the above analysis, the article adopts the Cobb-Douglas production function to analyze the effect of informatization on economic growth. First, ICT investment, considered a part of the material capital input, is divided into ICT capital stock and non-ICT capital stock in line with previous studies [16]. Therefore, we obtain the following formula:
Sustainability 06 07121 i001
In Equation (1), GDPit, NICTit, ICTit, and Lit represent regional output, non-ICT capital input, ICT capital input, and labor input, respectively. The formula helps isolate the contribution of informatization investment to economic growth from other factors. For statistical analysis, a logarithm is conducted on both sides of the formula with the divided labor input.
ln(GDPit / Lit) = ln A + α1 ln(NICTit / Lit) + β1 ln(ICTit / Lit) + μi + λt + εit
In Equation (2), μi, λt, and εit represent the spatial fixed effect, time fixed effect, and random disturbance term, respectively.
Furthermore, we define ICT investment as a technological progress factor to influence productivity:
Sustainability 06 07121 i002
For statistical reasons, both sides of (3) could be transformed to logarithms as in (4).
ln(GDPit / Lit) = ln A + α2 ln(Kit/ Lit) + β2 ln(ICTit) + μi + λt + εit
In Equation (4), Kit represents all the capital inputs of the firm, including both ICT and non-ICT. Unlike Equation (2), ICTit in Equation (4) represents ICT capital inputs with public attributes, such as an optical fiber building. The formula provides the spillover effect of informatization investment on ICT.

2.2. Spatial Model Selection

In the models above, the spatial effect is ignored. Generally, regional infrastructure, highway accessibility, and reputation of the adjacent region may affect the dependent variable. Ignoring these factors may raise the issue of missing variables [17]. Since ICT is shown to have significant spatial spillover effects [14], we should include these effects in the model.
To deal with the spatial effect, the study employs the spatial autoregressive (SAR) model as follows [17]:
y = ρWy + α ιn + Xβ + ε
Equation (5) can be calculated as follows:
y = (In ‒ ρWy)‒1ιn + Xβ) + (In ‒ ρWy)‒1 ε
ε ~ N (0, σ2In)
In Equations (5) and (6), ρWy represents the spatial lag of the dependent variable y, and W represents the spatial weight matrix.
Moreover, the study deals with the spatial effect of the dependent variable by extending the SAR model to the spatial Durbin model (SDM).
y = ρWy + α ιn + Xβ + WXγ + ε
y = (In ‒ ρWy)‒1ιn + Xβ+ WXγ + ε)
ε ~ N (0, σ2In)
In Equation (8), WXγ represents the spatial lag of the independent variable X.
According to Equation (7), the popular SDM is constructed with the addition of the spatial lag of the dependent variable to the SAR model. Incorporating Equations (2) and (4) into SDM, we obtain the following regional production model.
Sustainability 06 07121 i003
Sustainability 06 07121 i004
The definitions of variables in Equations (9) and (10) are the same as in Equations (2) and (4). The only difference is that we add the spatial lag of the dependent variable y and the independent variable X.

2.3. Selection of Control Variables

In Equation (3), we consider ICT investment as a technological progress factor that influences productivity. Besides ICT investment, R&D and transportation infrastructure can influence productivity. Therefore, these two variables can affect Ait in Equations (1) and (3).
Ait = Ae(δ1ln R&Dit + η1ln Tranit + μi + λt + εit)
Ait = A e(β2 ICTit + δ2ln R&Dit + η2ln Tranit + μi + λt + εit)
In the above formula above, R&D represents the logarithm of regional R&D capital stock. Tran represents the logarithm of transportation infrastructure capital stock. We extend Equations (2) and (4) to Equations (11) and (12), respectively, as follows:
Sustainability 06 07121 i005
In Equation (11), GDPit, NICTit, ICTit, Lit, R&D, and Tran represent regional output, non-ICT capital input, ICT capital input, labor input, R&D capital stock, and infrastructure capital stock, respectively.
Sustainability 06 07121 i006
In Equation (12), Kit and ICTit represent all the material capital inputs of the firm and ICT capital input with public attributes, respectively. Other variables have the same meaning as in Equation (11). In the subsequent analysis, we analyze Equations (11) and (12) with the Matlab software, employing the maximum likelihood method to estimate the model parameters and for the related tests.

2.4. Direct and Indirect Spillover Effect of the Independent Variable

To estimate the spatial spillover effect of an independent variable, most empirical research adopts a non-spatial and a spatial model or a variable parameter comparison of several spatial models. Unfortunately, these approaches are not comparable with each other because they may lead a false and biased conclusion [16]. Colecchia et al. believe that a change in a single observational region with respect to any variable will influence that region directly (direct effect) and another region indirectly (indirect effect), which means that a local spatial variable change has a direct spatial effect on the local area and an indirect effect on an adjacent area [16]. Therefore, we could obtain the interactive effect by following LeSage and Pace’s method.
Let us first take the spatial Durbin model.
(InρW)y = + WXθ + ιnα + ε
Sustainability 06 07121 i007
In the model, Sr(W) = V(W)(Inβr + r)
V(W) = (InρW)‒1 = In + ρW + ρ2W2 + ρ3W3 + ∙∙∙
Equation (13) can be obtained as follows:
Sustainability 06 07121 i008
Sustainability 06 07121 i009
Equation (15) is very different from a non-spatial linear model. The direct and indirect effects can be calculated with Equation (16).
Sustainability 06 07121 i010
In Equation (16), Sustainability 06 07121 i011 measures, for region i, the influential effect of the independent variable xir on the dependent variable, which represents the direct effect. For region j, Sustainability 06 07121 i010, i ≠ j, measures the influential effect of the independent variable xjr on the dependent variable, which represents the indirect effect. The diagonal elements in Sr(W) represent the direct effects and the off-diagonal elements the indirect effects.
In this study, we aim to examine, by calculating informatization investment’s direct and indirect effects, whether informatization influences economic growth through an agglomeration effect or a spillover effect.

3. Data Source

3.1. Sample Selection

The development of informatization in Japan has some unique characteristics.
First, Japan experimented with a unique process of research and development, manufacturing, and application of technology. Thus, the process of informatization is quite clear. From the 1960s, Japan set about developing the computer, putting in place a unique system in the eighties. Focusing on the National Information Infrastructure (NII) technologies in the middle of the nineties, the Japanese government promoted the “fiber to the home (FTTH)” project, which led to increasing use of the computer. In the 2000s, the “e-Japan” plan helped 30 million families to connect to the Internet, and 10 million families obtained access to a 100-MBT broadband network. In 2004, the “u-Japan” plan was launched to establish seamless Internet connectivity, digital television, mobile communication, GPS, and other terminals for the realization of a ubiquitous (“anytime, anywhere, anything, and anybody”) network society with access to the Internet. ICT investment by private enterprises in the past 10 years constitute about 25% of equipment investment, contributing about 30% to economic growth and increasing the proportion of Internet users to over 70%. The 3G network has given a boost to the mobile phone, increasing its penetration rate to 84.5% and popularizing Internet surfing with the mobile phone (52.4%), home-network access to broadband (60%), and digital television (60.7%). All e-government applications have increased, promoting the development of informatization to a great extent.
Japan’s ICT equipment investment increased 19.4 times from 1.036816 trillion in 1980 to 2.0112077 trillion yen in 2007, representing an annual growth rate of 1.097 during the period (Figure 1). Furthermore, investment in ICT equipment as a proportion of business equipment expanded from 2.74% to 23.05% while regional GDP expanded from 0.34% to 3.59% and the share of informatization investment increased significantly. However, the year 1997 became the turning point for ICT investment, which increased rapidly between 1980 and 1996 at an annual growth rate of 16.84%. Growth slowed down to an annual rate of just 4.42% between 1997 and 2007, and informatization development entered a stable growth stage.
Second, regional informatization has been promoted rapidly and in diverse ways. In the early stage, Japanese informatization was concentrated in Tokyo, Yokohama, Nagoya, Osaka, and Kyushu, as well as other industrially developed areas. After 1998, the informatization level of each area increased rapidly, while the gap narrowed. Compared to Tokyo with an index of 100 in 2001, the average informatization index of the above areas was 104.64 with a standard deviation of 22.41, the maximum was 173.65, and the minimum 66.22. The individual indexes were 89.91, 101.72, 74.13, and 6.97, respectively. The informatization of Japanese regions has developed rapidly, narrowing the gap significantly. Our particular concern is whether Japanese regional informatization has led to a spreading effect and how it has affected regional economic growth.
Comprehensive and reliable data on regional informatization investment and informatization indexes are available in Japan. All data on the level of information capital and the social informatization of Japanese prefectures can be traced back to 1975. In particular, the Subordinate Intelligence Communication Research Institute of the Japanese Ministry has done intensive basic work to prepare the ground for informatization analysis.
Figure 1. ICT equipment investment in Japan between 1980 and 2007.
Sustainability 06 07121 g001

3.2. Sources of Data

This article adopted Japanese regional panel data for a period of 32 years, from 1975 to 2007, based on seven variables: prefecture regional gross domestic product (GDP), private enterprise non-information communication capital stock (NICT), information communication capital stock (ICT), labor input (I), R&D capital stock (R&D), transportation infrastructure capital stock (Tran), and ubiquitous informatization index (U).
For the regional gross domestic product variable, we adopted Japanese government official data on “county civil economic calculation” for the years of 1975–2007, considering the 2000 price level as the benchmark.
For private enterprise non-information capital stock data, the prefecture’s total private enterprise capital stock was calculated as follows: First, nationwide total private enterprise capital stock was adopted from the “Private Enterprise Capital Stock Annual Report” of the Japanese Government Official Economic and Social Research Institute. Second, each prefecture’s private enterprise capital stock data for the period 1975–1980 were adopted from the “Japanese national database”, while the stock between 1981 and 2007 was calculated by the following interpolation Equation (17):
Sustainability 06 07121 i012
In the formula, t represents the year; p, total private capital stock; and I, private equipment investment, all derived from the “county civil economic calculation”. Non-information communication capital stock is equal to the total of private enterprise capital stock and information communication capital stock. Investment input is equal to private capital times rate of capacity utilization. Rate of capacity utilization(rcu) is calculated as the national average productivity times rate of capacity utilization index of the Ministry of Economy, Trade, and Industry.
Information communication capital stock data were derived from prefecture ICT capital stock data calculated by the Japanese Intelligence Communication Research Institute for the period 1975–2007, with the 2000 price level as the benchmark. The data are based on four hardware investment items: computer-related equipment investment, communication-related equipment investment, business equipment investment, and software-related investment amount; hardware and software capital stock is calculated separately and summed up.
Labor input(L)is equal to (number of workers) times working hours. Number of employees is based on employee data of “the county civil economic calculation”; working hours are annual average values obtained from the Monthly Industry Statistics Local Investigation of the Ministry of Health and Labor.
R&D capital stock (R&D) data are sourced from the R&D, Innovation and Productivity database of the Academic Institute for Science, Technology and Policy in Japan.
Transportation infrastructure capital stock (Tran) data are obtained from the Social Capital Stock database of the Japanese government. We chose the quantity of Road and Harbor between 1980 and 2007 as the proxy variable.
We adopted the ubiquitous informatization index data for the 1975–2005 period Japan’s Ministry reports; to make up for the deficiency due to the ministry’s calculation method, we used 2006 and 2007 data based on eight interrelated indexes: the computer family popularization rate, Internet utility ratio, number of broadband connections, number of mobile communication connections, number of landline connections, usable information content, enterprise videoconference usage rate, and the multimedia software ratio.

4. Empirical Analysis

4.1. The Construction of Spatial Weight Matrix

To analyze the model, this study adopts the spatial adjacency matrix W of adjacent and non-adjacent area values, namely, 1 and 0, respectively:
Sustainability 06 07121 i013
Moreover, we employ a first-, second-, and third-order adjacency matrixes, W1, W2, and W3, respectively, to analyze the spatial spillover effects of different variables in different spatial ranges.

4.2. Contribution of Informatization Investment to Economic Growth

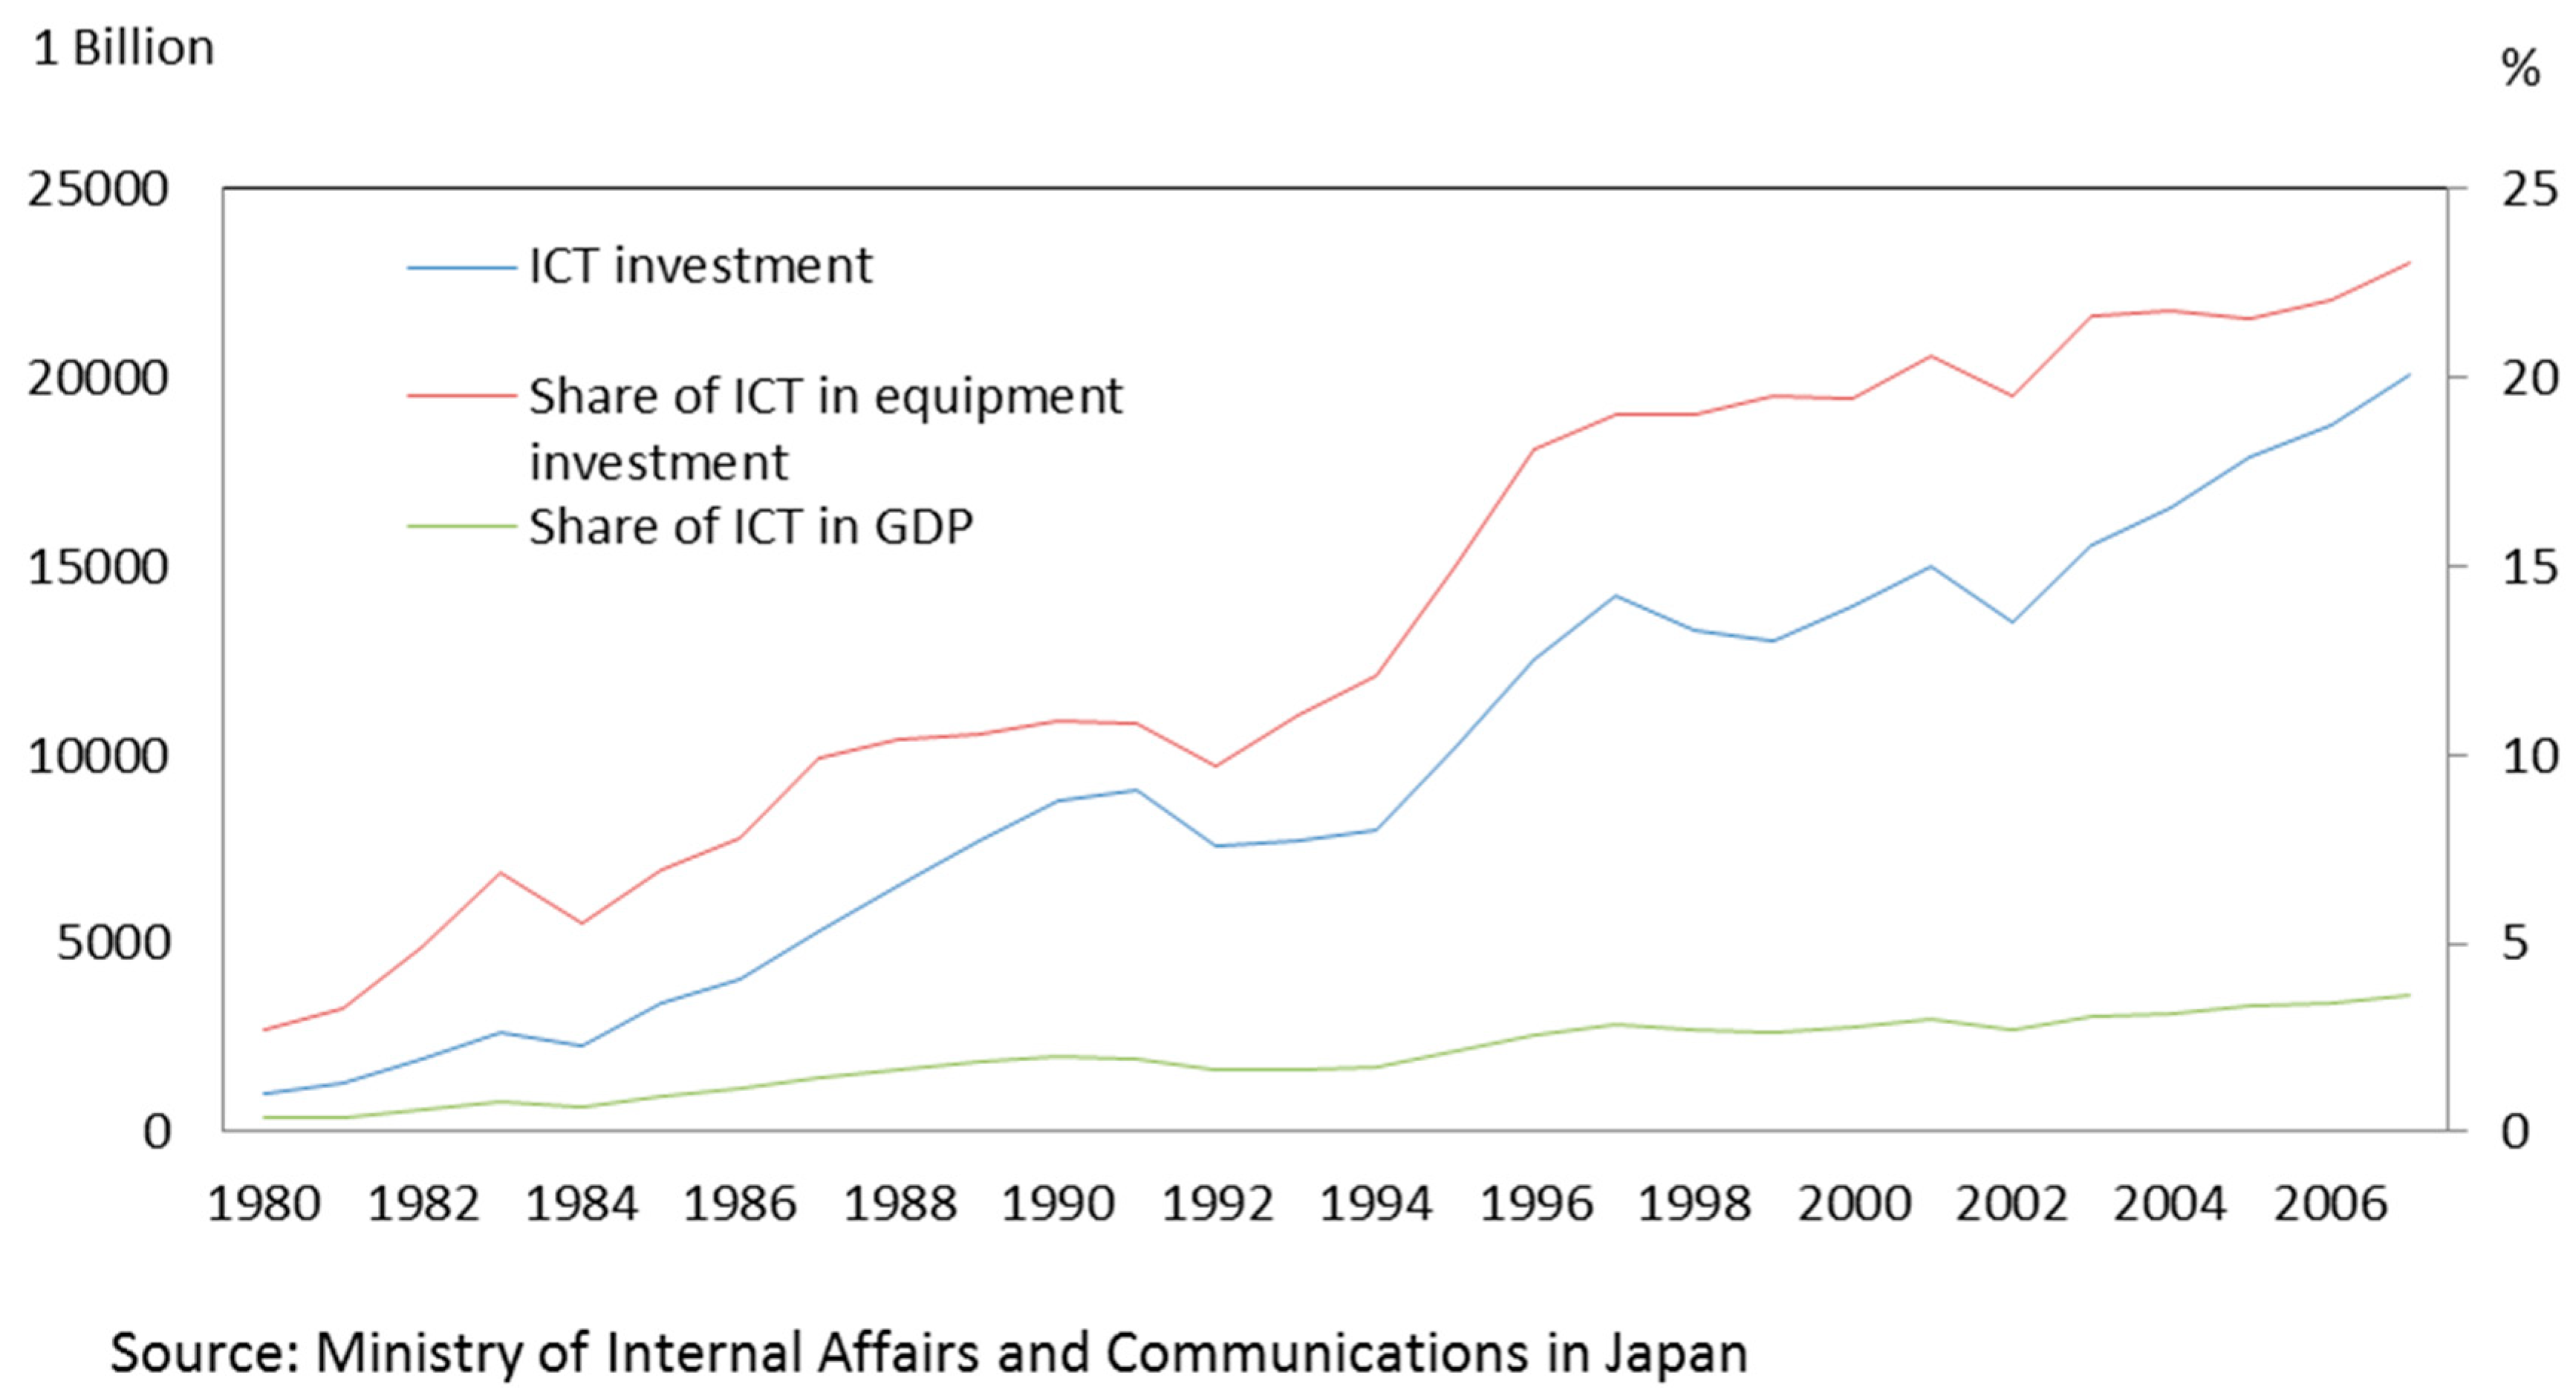
First, we analyzed the degree of influence of Japanese regional informatization investment on each unit of regional economic growth from 1980 to 2007. From a preliminary observation of Figure 1, 1997 seems to be the demarcation point of informatization investment. This needs to be further verified and confirmed. The article adopts the collective value of Japanese regional ICT investment data to test Equation (2); the result shows that the test statistics, at F = 6.2969 and LR = 22.8226, are significant; however, the test statistics for the adjacent years (i.e., 1996 and 1998) are not significant. Therefore, 1997 can be considered a real catastrophic point. We analyze the three periods 1980–2007, 1980–1996, and 1997–2007 separately; for convenience, we use protophase and anaphase to represent the two successive phases, 1980–1996 and 1997–2007, respectively.
For spatial analysis, we should first determine the model to be adopted for estimation. The process could be divided into three steps: First, determine whether to adopt the spatial lag model (SAR), spatial error model (SEM), or a common non-spatial model. Second, determine whether a fixed effect model or random effect model should be adopted; if a fixed effect model is employed, a spatial fixed effect, time fixed effect, or bidirectional fixed effect must be chosen. Third, determine whether the spatial Durbin model is suitable or not [18,19,20]. The model test results for the three periods can be summarized as follows.
First, for the feasibility of the non-spatial model, we compared all test statistics, the Lagrange multiplier (LM) test result, spatial lag, and spatial error test for 1980–2007. The LM spatial lag test statistic is 160.12, and the LM spatial error is 39.29 in the non-spatial model, negating the no-spatial-effect hypothesis. Obviously, a spatial effect does exist. The robust LM test statistic, too, rejects the hypothesis of no spatial effect (robust LM lag: 122.67, robust LM error: 1.84). For 1980–1996, the test statistics are 81.65, 18.37, 65.77, and 2.49 respectively. For 1997–2007, the values are 107.10, 27.16, 84.55, and 4.61, respectively. Both the LM test and the robust LM test for the three periods show that the statistical magnitude of spatial lag is greater than the spatial error. Therefore, we can confirm that the spatial lag model provides a better result than does the spatial error model.
Second, the LM test result for 1980–2007 also shows that the spatial lag in the time effects of the statistical magnitude of LM and robust LM is larger than the spatial error while the spatial lag is lower than spatial error for the fixed effect. For the regional individual + time effects, the spatial lag is larger than the spatial error. The other two periods show similar characteristics. Moreover, the likelihood ratio test result for all three periods negates not only the possibility that the spatial fixed effect is not significant (2287.93, 2022.51, and 1005.92, degree of freedom = 47, p < 0.01) but also the null hypothesis that the time fixed effect is not significant (276.85, 184.52, and 176.02, degree of freedom = 28, p < 0.01), which shows the feasibility of incorporating spatial fixed effects or time fixed effects into the model.
Third, the results of the spatial Durbin model indicate that the random effect model with spatial lag is suitable for the periods of 1980–2007 and 1980–1996 (For 1980–2007, Wald lag = 2.8765, p = 0.5787; Wald error = 8.2522, p = 0.0828; LR lag = 4.0260, p = 0.4025; LR_error = 8.8985, p = 0.0637; Hausman = 12.8183, p = 0.1710. For 1980–1996, Wald lag = 2.3271, p = 0.6758; Wald error = 0.4736, p = 0.9760; LR lag = 1.9933, p = 0.7370; LR_error = 0.4491, p = 0.9783; Hausman = 16.8142, p = 0.0517. According to the Wald test and LR test, the random effect model should be employed for the analysis). However, the bidirectional fixed effect model with spatial lag is suitable for the period 1997–2007.
Table 1 shows the statistical results on the effect of regional informatization investment on economic growth in Japan from 1980 to 2007.
For 1980–2007, the random effect model has a better fit, indicating that the regional and temporal heterogeneity is independent of the explanatory variables in the long term. Therefore, we can consider them as random factors and include them in the model. From the degree of fit perspective, the R2 values for 1980–2007, 1980–1996, and 1997–2007 are 0.9344, 0.9683, and 0.9725, respectively, and the corrected R2 values are 0.6549, 0.5732, and 0.3728, respectively. Here, the difference between R2 and the corrected R2 is that the latter neglects the variance explained by the spatial fixed effect, implying that the fixed effect explains the whole variation. What is more, when taking the spatial lag of the explained variable as explanatory variable it takes R2 to explain, and when taking the spatial lag of the explained variable as no explanatory variable it takes corrected R2 to explain. It can be seen that spatial fixed effect should be incorporated into the model, which has a good fit overall.
Table 1. Regional informatization and economic growth in Japan: spatial and time-period fixed effects (1980–2007).
1980–20071980–19961997–2007
Spatial Random EffectsSpatial Random EffectsSpatial and Time-Period Fixed Effects
W × ln(GDP/L)0.11600.13600.0216
(3.3661)(3.0992)(0.3908)
ln(NICT/L)0.36890.35570.7658
(13.7340)(10.7594)(11.4621)
ln(ICT/L)0.04410.0438−0.1143
(3.6558)(2.9222)(−2.1016)
ln(R&D)0.00630.0021 0.0071
(5.0761)(1.2910)(3.0808)
ln(Tran)0.02320.00230.0907
(3.3592)(0.2918)(3.3162)
W × ln(NICT/L)0.1247−0.0055−0.4220
(2.6262)(−0.0905)(−4.1424)
W × ln(ICT/L)−0.0384−0.04260.2800
(−2.2990)(−2.1397)(4.0379)
W × ln(R&D)0.00510.0070 −0.0140
(1.9789)(2.0104)(−3.1874)
W × ln(Tran)0.00780.01190.4549
(0.5605)(0.7603)(7.5783)
phi0.09290.0684
(6.8830)(6.8698)
σ20.00030.00020.0001
R20.93440.96830.9725
Corrected R20.65490.57320.3728
Log L2941.62101.91606.5
Wald test spatial lag20.1575 (p = 0.001)10.02 (p = 0.04)90.83 (p = 0.001)
Wald test spatial error32.3197 (p = 0.001)11.45 (p = 0.01)87.55 (p = 0.001)
LR test spatial lag 90.88 (p = 0.001)
LR test spatial error 88.59 (p = 0.001)
Direct effect ln(NICT/L)0.37550.35730.7629
(14.160)(10.789)(11.540)
Direct effect ln(NICT/L)0.37550.35730.7629
(14.160)(10.789)(11.540)
Indirect effect ln(NICT/L)0.18450.0497−0.4112
(3.524)(0.757)(−4.248)
Total effect ln(NICT/L)0.56000.40700.3517
(9.145)(5.079)(4.062)
Direct effect ln(ICT/L)0.04330.0423−0.1095
(3.750)(2.943)(−2.017)
Indirect effect ln(ICT/L)−0.0365−0.04050.2788
(−2.070)(−1.955)(4.148)
Total effect ln(ICT/L)0.00680.00180.1693
(0.438)(0.104)(3.772)
Direct effect ln(R&D)0.00640.00240.0070
(5.021)(1.456)(3.040)
Indirect effect ln(R&D)0.00640.0079−0.0140
(2.246)(1.974)(−3.094)
Total effect ln(R&D)0.0128 0.0103−0.0070
(3.812)(2.178)(−1.424)
Direct effect ln(Tran)0.02350.00260.0933
(3.407)(0.321)(3.457)
Indirect effect ln(Tran)0.01130.01340.4643
(0.726)(0.767)(7.542)
Total effect ln(Tran)0.03480.01600.5576
(2.060)(0.838)(8.219)
From the perspective of each explanatory variable coefficient, the coefficients other than W × ln(ICT/L) are significantly positive for 1980–2007. The coefficient of W × ln(Tran) is not significant, while the others are significant. Moreover, the spatial lag of ICT/L is negative, which means that the contribution of ICT to economic growth is mainly derived from its agglomeration effect, rather than the diffusion effect. Quite obviously, ICT has a spillover effect.
Meanwhile, some interesting changes have occurred over the two successive phases. In the protophase, ln(ICT/L) is 0.044 and W × ln(ICT/L) is 0.0070. Both t values are significant. In the anaphase, ln(ICT/L) is –0.114 and W × ln(ICT/L) is 0.28. Both values of t are significant. Therefore, we can conclude that in the protophase, namely, the period before the diffusion of Internet, the effect of ICT investment was mainly felt in the local area while the effect on the perimeter was limited. With the diffusion of Internet and other new ICT technologies, the ICT investment effect is strengthened, and the effect on the perimeter gradually manifests, so that the spillover effect indeed plays a major role.
Now, this raises a question: Is the spatial effect of ICT investment on earth derived from the local area or from the perimeter? To determine the answer, we need to further observe the direct and indirect effects. In the non-spatial model, the ln(NICT/L) estimators of the protophase random effect and the subsequent bi-directional fixed effect are 0.351 and 0.5178, respectively. For the direct effect, the ln(ICT/L) estimators are 0.0857 and 0.081, respectively. However, in the spatial Durbin model, the direct effect estimators are 0.357 and 0.7629 for ln(NICT/L) and 0.0423 and −0.1095 for ln(ICT/L). This means that in the protophase the non-information capital distribution rate in the non-spatial model is underestimated by 1.68%, and the information capital distribution rate is underestimated by 202.6%. In the later stage, the former is underestimated by 30.9%, while the latter is overestimated by 26%. Corresponding to the situation, the labor distribution rates for two periods are 0.5634 and 0.3922 in the non-spatial model and 0.6004 and 0.3466 in the spatial Durbin model; the latter model underestimates the labor distribution rate by 6.16% in the protophase and overestimates it by 13.13% in the later stage. The underestimation or overestimation can be illustrated by the feedback effect, regardless of whether it is direct or indirect.
The difference between the direct effect and the variable coefficient is called feedback effect, the magnitude of which reflects the influential degree of lag effect of the independent variable and induced variable. The feedback effects of ln(ICT/L) during two successive periods are −0.0015 and 0.0048, respectively, which means the ICT investment effect in the protophase is mainly derived from local investment and the influence on the perimeter is almost negligible. However, later ICT investment is influenced distinctively by the perimeter besides being influenced by the local effect.
In the protophase, the direct effect of ln(ICT/L) is 0.0423, and the t value is significant. The indirect effect is −0.0405, but its t value is not significant. In the later stage, the direct and indirect effects are −0.1095 and 0.2788, respectively, and their t values are significant. It can be seen that from 1997 local ICT investment starts to exert significant influence on the economic growth of circumjacent areas. The degree of interaction of the two kinds of effects can be represented by the ratio of the indirect effect to the direct effect. The quotient is 0.48928 in the protophase and 0.71791 in the later stage, which means the indirect effect from the information capital distribution rate is just 48.93% of the direct effect in the protophase, although it rises to 71.79% in the later stage. This implies that a change in the information capital distribution rate, in the protophase, results in a proportionate change in the labor distribution rate of the adjacent and local areas in the ratio of 1:2.04; in the later stage, the reciprocal inter-region influence is almost negligible, the corresponding ratio being 1:1.39, but the reciprocal influence is strengthened significantly. We can conclude that the ln(ICT/L) coefficient changes from 1980–1996 to 1997–2007 because of the interaction effect among the regions. Obviously, the ICT capital input does have a spatial spillover effect.

4.3. Spillover Effect and Network Effect of Informatization

In the foregoing analysis, we explored the contribution of ICT investment to economic growth under the hypothesis of constant returns to scale. The model does not take into account whether or not ICT investment has increasing returns due to the scale effect on the regional economy. However, new ICT investment will strengthen the network connections of other enterprises, producing an external effect that creates an increasing returns-to-scale effect on the regional economy. Moreover, the massive diffusion of the personal computer and the introduction of the Internet since 1995, plus the mobile phone and other network communication equipment, have developed a social network system with the stronger osmosis property, and the relevance and interpenetration of enterprise and other social aspects have been further strengthened. Whether the development of the social network system will strengthen the spillover effect of ICT investment is an important question that needs to be examined as a future direction of this research. In other words, one would naturally like to know what kind of effect social networks and ICT investments will impose on economic growth.
We employ model (4) and its derivative, the spatial Durbin model, to answer the above question. In model (12), the variable ln(ICTit) is used to explore the network externality of ICT investment. In a macroeconomic situation, we expect the variable to be positive, but in the context of a regional economy, the expected variable could be either positive or negative. Combined with the paradoxical geographies of the digital economy, if the variable is positive, it means there is a spillover or spreading effect, and the world is flat theory is verified. If the variable is negative, it means there is no spillover effect, while there could be a convergence effect, and the digital divide is supported. Based on Equation (4), the study has taken advantage of the cross-term of ICT to explore the informatization external effect under the interaction of enterprise ICT investment and the social information network. Thus, Equation (4) can be extended to Equation (19):
ln(GDPit / Lit) = ln A + α2 ln(Kit / Lit) + β2 ln(ICTit × Uit) + μi + λt + εit
In Equation (19), U represents the ubiquitous informatization index. Now, we can extend the model.
Sustainability 06 07121 i014
The variables in Equations (19) and (20) have the same meaning as in Equations (4) and (12), respectively.
Table 1 shows that informatization investment in Japan increased significantly after 1995 while the Internet and other means of communication diffused on a massive scale around 1997. Meanwhile, the analysis in the above section also shows that 1997 is a demarcation point. Therefore, we employed data for 11 years, from 1997 to 2007, to analyze the external network effect of informatization.
In general, the spatial spillover effect becomes attenuated as the distance increases. In order to test the effect of spatial distance on ICT spatial spillover, we designed first-order (W1), second-order (W2), and third-order (W3) spatial adjacency weights.
Table 2 shows the test results of the Lagrange multiplier and robust Lagrange multiplier approaches. It can be seen that the null hypothesis of the spatial effect on the non-spatial model has not been negated and the spatial lag model is better than the spatial error model. The tests provided significant results for spatial fixed effects, time fixed effects, or bi-directional fixed effects. Besides, LR also shows that the spatial fixed effect (1005.93, degree of freedom = 47, p < 0.001) and the time fixed effect (176.03, degree of freedom = 11, p < 0.001) are significant, which means that the bi-directional fixed effects approach is an appropriate choice.
Table 3 provides the estimated results of informatization input spatial spillover from 1997 to 2007. The first row in the table gives the estimated results with first-order weights (W1). The second row provides the estimated results with second-order weights (W2). The third row indicates the estimated results with third-order weights (W3). From the estimated results with first-order weights, R2 is 0.9744, and the corrected R2 is 0.4156; therefore, the model fits well. The Wald lag and Wald error test statistics are 128.18 (p = 0.001) and 118.57 (p = 0.001), respectively. The LR lag and LR error test statistics are 124.71 (p = 0.001) and 121.72 (p = 0.001), respectively. These results mean that the spatial Durbin model with spatial lag is an appropriate choice. The estimated coefficients with first-order weights are significant for all variables except W × ln(K/L), which is negative but not significant(t = −1.94). Both ln(ICT) and W×ln(ICT) are significant. ICT is negative but not significant, which means local ICT investment will not lead to an external effect or a spatial spillover effect. However, it is too early to draw a conclusion. In the local area, ln(ICT) is negative, which means that there may be an excessive investment problem. However, W × ln(ICT) is positive, and the coefficient is larger than ln(ICT), which suggests a significant spillover effect. This can be verified from the total effect (direct effect = 0.1885, t = 4.466).
At 0.6152, the coefficient value of ln(K/L) is underestimated by 9.0% in the non-spatial bi-directional fixed effect model compared to the spatial Durbin model. This suggests the error of neglecting the spatial effect in the non-spatial model. In the spatial Durbin model of the bi-directional fixed effect, the indirect effect of ln(K/L) is 19.87% of the direct effect. In other words, a change in the capital distribution rate results in a proportionate change in the labor distribution rate of the adjacent and local areas in the ratio of 1:5.03.
Table 2. Results of the Lagrange multiplier and the robust Lagrange multiplier.
OLS EstimationSpatial Fixed EffectsTime-Period Fixed EffectsSpatial and Time-Period Fixed Effects
ln(KL)0.3750.2080.307 0.615
(19.839)(6.623)(15.14)(11.48)
ln(ICT)0.071−0.0090.071 0.033
(14.09)(−0.299)(15.43)(1.018)
ln(R&D)0.0040.0080.0070.008
(2.926)(2.959)(5.148)(3.490)
ln(Tran)−0.0070.178-0.0120.107
(−1.914)(10.67)(-3.449)(3.891)
Intercept−1.339
(−38.66)
R20.7240.8060.7160.251
Durbin-Watson1.8711.4972.0291.730
Log L1009.801473.101058.201561.10
LM spatial lag107.1027.2546.392.34
LM spatial error27.1731.725.453.63
Robust LM spatial lag84.550.0051.880.38
Robust LM spatial error4.624.4810.951.68
LR test spatial fixed effects, 1005.93 (p = 0.000); LR test time fixed effects, 176.030 (p = 0.000).
Table 3. The spatial spillover effect of informatization.
Spatial and Time-Period Fixed Effects W1Spatial and Time-Period Fixed Effects W2Spatial and Time-Period Fixed Effects W3
W × ln(GDP/L)0.02190.2427−0.0585
(0.4002)(3.4463)(−0.5255)
ln(K/L)0.67700.64680.6720
(13.4205)(12.2567)(12.8019)
ln(ICT)−0.3270−0.2757−0.2097
(−5.3955)(−5.2624)(−4.8450)
ln(R&D)0.00730.00730.0047
(3.2597)(3.1083)(2.0160)
ln(Tran)0.09120.09820.1049
(3.4579)(3.5318)(3.8223)
W × ln(K/L)−0.1782−0.1819−0.2231
(−1.9370)(−1.2550)(−1.1099)
W × ln(ICT)0.51150.52480.6550
(6.9291)(6.3031)(6.7266)
W × ln(R&D)−0.0129−0.0147−0.0290
(−3.0264)(−1.9917)(−2.5442)
W × ln(Tran)0.45930.24740.6359
(7.8760)(2.4894)(3.9463)
σ20.00010.00010.0001
R20.97440.97190.9725
Corrected R20.41560.35210.3707
Log L1624.81598.61607.0
Wald test spatial lag128.18(p=0.000)66.413(p=0.001)87.41(p=0.000)
Wald test spatial error118.57(p=0.000)49.21(p=0.001)73.32(p=0.000)
LR test spatial lag124.71(p=0.000)69.25(p=0.001)91.03(p=0.000)
LR test spatial error121.72(p=0.000)59.87(p=0.001)90.21(p=0.000)
Direct effect ln(K/L)0.67610.64560.6717
(14.099)(11.971)(12.760)
Indirect effect ln(K/L)−0.1676−0.0363−0.2569
(−1.847)(−0.207)(−1.367)
Total effect ln(K/L)0.50850.60930.4147
(4.915)(3.135)(2.162)
Direct effect ln(ICT)−0.3230−0.2606−0.2148
(−5.399)(−5.177)(−4.837)
Indirect effect ln(ICT)0.51150.59210.6375
(6.988)(6.271)(6.512)
Total effect ln(ICT)0.18850.33150.4228
(4.466)(4.523)(5.450)
Direct effect ln(R&D)0.00720.00690.0048
(3.295)(2.919)(2.003)
Indirect effect ln(R&D)−0.0128−0.0167−0.0282
(−3.058)(−1.721)(−2.520)
Total effect ln(R&D)−0.0055−0.0098−0.0234
(−1.200)(−0.964)(−1.987)
Direct effect ln(Tran)0.09430.10760.1033
(3.672)(3.963)(3.856)
Indirect effect ln(Tran)0.46740.35120.6036
(7.622)(2.741)(3.708)
Total effect ln(Tran)0.56180.4588 0.7069
(8.439)(3.303)(4.224)
In terms of information investment in the non-spatial model, the coefficient of ln(ICT) is 0.033 (t = 0.96), which is an overestimation. In the spatial model, the direct effect is −0.323 (t = −5.399), and the indirect effect is 0.5115 (t = 6.988). These results indicate that ICT affects economic growth through spatial spillover. We arrived at similar conclusionsanalyzing the effect of R&D capital stock (R&D) and transportation infrastructure capital stock (Tran). R&D capital stock and transportation infrastructure capital stock affect economic growth through spatial spillover.
From the range of spatial spillover, the indirect effects of ICT from the three adjacency matrix conditions of W1, W2, and W3 do not decrease with an increase in the spatial scope. However, they tend to increase. We can conclude that the spatial spillover of ICT is not confined to the adjacent area. It is characterized by cross-regional influence on the economic development.
In terms of the above ICT investment analysis, what would happen if informatization gradually permeates the whole society? Table 4 shows the estimated result of the bi-directional fixed effect with the spatial Durbin model (20) involving the cross-term of ICT and the ubiquitous index, which is the social informatization development standard. In the cross-term, R2 and the corrected R2 are 0.9725 and 0.372, respectively, no different from Table 3. These passed the Wald test and the LR test, which means the spatial Durbin model is an appropriate choice.
In contrast to Table 3, all variables have the same empirical result as in Table 4, except ln(ICT × U), which means that the model is stable. Moreover, the estimated coefficient of ln(ICT × U) changes from negative to positive, with the spatial lag being positive. This means that under the influence of social informatization, the external effect and spillover effect of ICT investment are strengthened.
From the analysis of the two above-mentioned models, we can conclude as follows. First, for the 1997–2007 period, the effect of the introduction and diffusion of informatization on Japanese regional economic growth, as well as the effect of the increasing returns to scale, is significant. Second, informatization investment does not necessarily lead to network external effects and the regional spatial spillover effect, and may show spatial convergence for local investment. Third, the extensive introduction and diffusion of informatization has enhanced the effect of informatization investment and strengthened network externality and the spatial spillover effect of investment, spearheading regional economic development as a whole. This implies the effect of increasing returns to scale.
Table 4. The spatial spillover effect of interaction.
Spatial and Time-Period Fixed Effects W1Spatial and Time-Period Fixed Effects W2 Spatial and Time-Period Fixed Effects W3
W × ln(GDP/L)0.03030.1954−0.0638
(0.5456)(2.6482)(−0.5579)
ln(K/L)0.71520.73230.7311
(13.4275)(13.0346)(13.0560)
ln(ICT × U)0.03720.02440.0388
(1.9332)(1.2315)(2.1657)
ln(R&D)0.00780.00940.0070
(3.3782)(3.9636)(2.8941)
ln(Tran)0.10560.1169 0.1300
(3.8423)(4.0572)(4.5437)
W × ln(K/L)−0.07060.06270.0063
(−0.6756)(0.3695)(0.0261)
W × ln(ICT × U)0.03790.09380.0972
(1.3909)(2.3452)(1.8055)
W × ln(R&D)−0.0138−0.0206−0.0421
(−3.1066)(−2.7568)(−3.6214)
W × ln(Tran)0.44450.23100.2976
(7.4031)(2.2478)(1.8457)
σ20.00010.00010.0001
R20.97250.97020.9705
Corrected R20.37200.31530.3237
Log L1606.51584.71588.5
Wald test spatial lag61.47 (p = 0.001)16.99 (p = 0.001)26.44 (p = 0.001)
Wald test spatial error62.24 (p = 0.001)16.14 (p = 0.002)25.85 (p = 0.001)
LR test spatial lag64.84 (p = 0.001)18.89 (p = 0.001)29.64 (p = 0.001)
LR test spatial error65.93 (p = 0.001)18.58 (p = 0.001)30.77 (p = 0.001)
Direct effect ln(K/L)0.71730.73710.7284
(13.046)(12.938)(13.570)
Indirect effect ln(K/L)−0.05000.2452 −0.0457
(−0.504)(1.265)(−0.209)
Total effect ln(K/L)0.66730.9824 0.6827
(5.792)(4.535)(2.974)
Direct effect ln(ICT × U)0.03650.0284 0.0388
(1.892)(1.447)(2.106)
Indirect effect ln(ICT × U)0.04070.11750.0873
(1.494)(2.626)(1.713)
Total effect ln(ICT × U)0.07720.14580.1261
(3.338)(3.568)(2.746)
Direct effect ln(R&D)0.00780.00880.0071
(3.469)(3.724)(3.001)
Indirect effect ln(R&D)−0.0138−0.0227−0.0403
(−3.006)(−2.412)(−3.424)
Total effect ln(R&D)−0.0060−0.0139−0.0331
(−1.214)(−1.386)(−2.678)
Direct effect ln(Tran)0.10850.12390.1276
(4.065)(4.207)(4.406)
Indirect effect ln(Tran)0.46110.30620.2732
(7.283)(2.365)(1.803)
Total effect ln(Tran)0.56960.43010.4008
(8.326)(3.052)(2.508)

5. Conclusions and Research Implications

This article aimed to analyze how informatization will affect space constraints and whether informatization efficiently promotes economic growth in the region. From the analysis of the relationship between the regional economy and informatization, shown in the earlier part of the paper, the following implications can be summarized.
First, the empirical analysis of the Japanese economy shows that informatization and its applications contribute to breaking the economic space constraints that distance imposes. The spatial effect of informatization was not significant for the 1980–1996 period. The ICT investment effect was mainly reflected in the local area, while the external effect of ICT investment was fully evident from 1997 to 2007 with the promotion of the Internet and other new IT technologies. Because of informatization, the interregional spreading effect of the economy is stronger than the convergence effect. In the three spatial Durbin models assuming constant returns to scale, the ICT investment external effect and the ICT × ubiquitous index cross-effect have shown spillover effects and interaction of informatization in the interregional area. The results on the regional aspect seem to support the world is flat theory, at least in developed countries like Japan.
Second, the spillover effect of informatization brings about the so-called network external effect. The effect not only leads to increasing scale returns but also strengthens the increasing returns-to-scale effect in the regional aspect. In the three Durbin models for 1997–2007, we find that the direct effect is lower than variable coefficient and the feedback effect is negative, which means that local economic growth relies not only on the input of local informatization resources (direct effect) but also on the contribution of other regions’ informatization (indirect effect).
Third, the introduction and diffusion of informatization plays a significant role in the spillover of informatization investment. The spillover effect of informatization is distinctly different from the spillover effect of common equipment investment. It relies not only on the relatedness among enterprises but also on the diffusion of information communication terminals and extensive application of information resources. In other words, the standard of social informatization determines the range of the informatization investment network externality. Clearly, when one incorporates the ubiquitous index into the model, no matter what the algebraic sign of variable or the coefficient is, the value greatly improves, changing from negative to positive and becoming more significant. These results prove the importance of social informatization for economic growth [21].
Finally, although some conclusions seem to support the world is flat theory, not all evidence negates the existence of space constraints. From the range of spatial spillover, the ICT capital input has a positive and significant effect from the three adjacency matrix conditions of W1, W2, and W3. However, the interaction between the ICT capital input and information resources indicates that the spillover effect is subject to constraints.

Acknowledgments

This research was supported by the Humanities and Social Science Projects organized by the Ministry of Education of China (Grant #10YJA630136 and Grant #12YJC630076) and the National Natural Science Foundation of China (Grant #71202029 and Grant #71202150). A special thanks to the reviewers for their insightful suggestions and all those who participated in the SAC 2014 conference.

Author Contributions

Chuan Sun was the lead author of this paper, with Hao Jiao and Yun Ren contributing significantly to fieldwork coordination, literature review, data analysis, and writing. All authors have read and approved the final manuscript.

Conflicts of Interest

The authors have no conflict of interest to declare.

References

  1. Graham, M. Warped geographies of development: The Internet and theories of economic development. Geogr. Compass 2008, 2, 771–789. [Google Scholar]
  2. Moriset, B.; Malecki, E.J. Organization versus space: The paradoxical geographies of the digital economy. Geogr. Compass 2009, 3, 256–274. [Google Scholar]
  3. Oliner, S.D.; Sichel, D.E.; Triplett, J.E.; Gordon, R.J. Computers and output growth revisited: How big is the puzzle. Brook. Pap. Econ. Act. 1994, 2, 273–334. [Google Scholar]
  4. Stiroh, K.J. Computers, productivity, and input substitution. Econ. Inq. 1998, 6, 175–191. [Google Scholar]
  5. Jorgenson, D.W.; Stiroh, K.J.; Gordon, R.J.; Sichel, D.E. Raising the speed limit: US economic growth in the information age. Brook. Pap. Econ. Act. 2000, 1, 125–235. [Google Scholar]
  6. Jorgenson, D.W. Information technology and the US economy. Am. Econ. Rev. 2001, 91, 1–32. [Google Scholar]
  7. Jorgenson, D.W. Information technology and the G7 economies. World Econ. 2004, 4, 139–169. [Google Scholar]
  8. Organisation for Economic Co-operation and Development (OECD>. The Economic Impact of ICT: Measurement, Evidence and Implications; OECD: Paris, France, 2004. [Google Scholar]
  9. Jorgenson, D.W.; Vu, K. Information Technology and the World Economy*. Scand. J. Econ. 2005, 107, 631–650. [Google Scholar]
  10. Jorgenson, D.W.; Vu, K. Information technology and the world growth resurgence. Ger. Econ. Rev. 2007, 8, 125–145. [Google Scholar]
  11. Khuong, V. Determinants of Economic Growth over the Period 1995–2005. In Proceedings of the 6th International Conference of Socio network Strategies, Osaka, Japan, 28 December 2009.
  12. Quah, D. ICT clusters in development: Theory and evidence. Eur. Invest. Bank Pap. 2004, 6, 86–100. [Google Scholar]
  13. Koski, H.; Rouvinen, P.; Ylä-Anttila, P. ICT clusters in Europe the great central banana and the small Nordic potato. Inf. Econ. Policy 2002, 14, 145–165. [Google Scholar]
  14. Wong, P.K. ICT production and diffusion in Asia Digital dividends or digital divide. Inf. Econ. Policy 2002, 14, 167–187. [Google Scholar]
  15. InfoCom Research, Inc. Investigation Report on Regional Economic Growth resulting from Ubiquitous Process; Ministry of Internal Affairs and Communications: Tokyo, Japan, 2008. [Google Scholar]
  16. Alessandra, C.; Schreyer, P. ICT investment and economic growth in the 1990s: Is the United States a unique case? A comparative study of nine OECD countries. Rev. Econ. Times 2002, 5, 408–442. [Google Scholar]
  17. LeSage, J.P.; Pace, R.K. Introduction to Spatial Econometrics; CRC Press Taylor and Francis Group: Boca Raton, FL, USA, 2009. [Google Scholar]
  18. Lin, G.P.; Long, Z.H.; Wu, M. A Spatial Econometric Analysis of Regional Economic Convergence in China, 1978–2002. China Econ. Q. 2005, 5, 67–82. [Google Scholar]
  19. Elhorst, J.P. Spatial Panel Data Models. In Handbook of Applied Spatial Analysis; Springer: Berlin/Heidelberg, Germany, 2010; pp. 377–407. [Google Scholar]
  20. Elhorst, J.P. Matlab Software for Spatial Panels. Available online: http://www.regroningen.nl (accessed on 12 March 2010).
  21. Pilat, D. ICT and Economic Growth: Evidence from OECD Countries, Industries and Firms; Organisation for Economic Co-operation and Development (OECD): Paris, France, 2003. [Google Scholar]

