Article

Identification and Characterization of Particulate Matter Concentrations at Construction Jobsites

by
Ingrid P. S. Araújo
1,†,
Dayana B. Costa
2,*,† and
Rita J. B. De Moraes
2,†
1
Department of Structural and Construction Engineering, School of Engineering, Federal University of Bahia, Aristides Novis, 2, Federação, Salvador 40210-630, Brazil
2
Department of Structural and Construction Engineering, School of Engineering, Federal University of Bahia, Aristides Novis, 2, Federação, Salvador 40210-630, Brazil
*
Author to whom correspondence should be addressed.
These authors contributed equally to this work.
Sustainability 2014, 6(11), 7666-7688; https://0-doi-org.brum.beds.ac.uk/10.3390/su6117666
Submission received: 3 September 2014 / Revised: 10 October 2014 / Accepted: 23 October 2014 / Published: 3 November 2014
(This article belongs to the Special Issue ZEMCH Research Initiatives: Mass Customisation and Sustainability)

Abstract

:
The identification and characterization of particulate matter (PM) concentrations from construction site activities pose major challenges due to the diverse characteristics related to different aspects, such as concentration, particle size and particle composition. Moreover, the characterization of particulate matter is influenced by meteorological conditions, including temperature, humidity, rainfall and wind speed. This paper is part of a broader investigation that aims to develop a methodology for assessing the environmental impacts caused by the PM emissions that arise from construction activities. The objective of this paper is to identify and characterize the PM emissions on a construction site with different aerodynamic diameters (PM2.5, PM10, total suspended particulates (TSP)), based on an exploratory study. Initially, a protocol was developed to standardize the construction site selection criteria, laboratory procedures, field sample collection and laboratory analysis. This protocol was applied on a multifamily residential building construction site during three different construction phases (earthworks, superstructure and finishings) aimed at measuring and monitoring PM concentrations arising from construction activities. The particulate matter was characterized in different particle sizes. Results showed that the higher TSP emissions arising from construction activities provoked environmental impacts. Some limitations to the results were identified, especially with regards the need for a detailed investigation about the influence of different construction phases on PM emissions. The findings provided significant knowledge about various situations, serving as a basis for improving the existing methodology for particulate material collection on construction sites and the development of future studies on the specific construction site phases.

1. Introduction

Environmental protection is an important issue throughout the world. Building construction and operations have large direct and indirect effects on the environment [1,2]. Pollution sources resulting from construction processes include harmful gases, noise, dust, solid and liquid wastes [3].
Despite developments, the construction industry is still considered an important source of atmospheric pollution due to particulate matter emissions, causing negative impacts on human health and the environment. Worldwide, it is estimated that air pollution caused by PM2.5 (particulate matter less than 2.5 µm in diameter) in the atmosphere is responsible for approximately 0.8 million premature deaths and 6.4 million years of life lost annually [4].
Dust and PM emissions can come from a number of sources during construction activities, as well as from off-site vehicles associated with the construction works and on-site machinery (off-road emissions), including both static and non-road mobile machinery [5,6]. The detrimental health impacts of PM emissions are not confined to the construction site, since fine particles (particulate matter smaller than 2.5 µm in diameter) can travel further than coarser dust (particulate matter between 2.5 µm and 10 µm in diameter) and can therefore affect the health of people living and working in the surrounding area of the site [5,6].
Emissions of particles and dust from construction can also have an impact on indoor air quality in the neighboring area [7]. Dust and other air pollution from demolition and construction can impact greatly on the health and quality of the lives of people working on and living close to these sites if they are badly managed [7].
The growth of construction and its environmental impacts highlight the importance of the need for sustainable construction processes and ways to manage sustainability measures. It is very important to predict the environmental impacts of a construction site and how they can be prevented before starting an activity [8].
The environmental pollution theme has been well studied in the academic area, and general pollution standards and methodologies exist. In addition, the literature review makes reference to some studies concerning the measurement of particulate matter on construction jobsites from an occupational health workers’ perspective [9,10,11]. Despite knowledge of this, the development of a specific methodology to measure and evaluate particulate matter on construction sites from an environmental perspective remains relatively unexplored. Therefore, there is a need to measure the relevance of emission sources of particulate matter during the different construction phases, as well as to identify mitigating measures to reduce its impact, generating better air quality in the workplace.
Additionally, the Brazilian code for air pollution does not establish quality standard levels that consider the generating source and the chemical composition of the material, considering only the mass concentration, and it mentions the potential toxic risk. Therefore, there is a need for the establishment of standards on the particulate matter emission level arising from construction sites [6,12].
This paper is part of a broader investigation that aims to validate a methodology for assessing the environmental impacts caused by PM emissions arising from construction activities and aims to determine air pollution concentrations caused by particle emissions during the different construction phases. This assessment aims to contribute to the identification and evaluation of appropriate measures of mitigating impacts caused by particulate matter. The objective of this paper is to identify and characterize the environmental impacts caused by PM emanating from construction sites with different aerodynamic diameters (PM2.5, PM10, total suspended particulates (TSP)) based on an exploratory study. This study is part of the Technologies for Sustainable Construction on Social Housing Jobsites Project (Cantechis Project), sponsored by FINEP (Financiadora de Estudos e Projetos) (Brazilian Innovation Agency) and developed by four Brazilian universities: the Federal University of São Carlos (UFSCar), Federal University of Bahia (UFBA), Federal University of Rio Grande do Sul (UFRGS) and University of São Paulo (USP).

2. Background

2.1. Atmospheric Pollution and Particulate Matter

According to Daly and Zanetti [13], air pollution is defined as the anthropogenic emission of harmful chemicals that alter the chemical composition of the natural atmosphere and have an adverse effect on the health of living things, an adverse effect on anthropogenic or natural non-living structures or reduce the air’s visibility.
An air pollutant is any substance emitted into the air from an anthropogenic, biogenic or geogenic source that is either not part of the natural atmosphere or that is present in higher concentrations than in the natural atmosphere and that may cause short-term or long-term adverse effects [13].
Most dust particles are too big to be inhaled, but can cause eye, nose and throat irritation and lead to deposition on cars, windows and property [7]. They include evidence of cardiovascular disease exacerbation as noted by multi-center studies assessing the association between ambient air pollution and cardiovascular disease mortality [14]. Other recent studies are providing incomplete, but intriguing results suggesting that particle-induced pulmonary and systemic inflammation, accelerated atherosclerosis and altered cardiac autonomic function may be part of the pathophysiological pathways linking particulate air pollution with cardiovascular mortality [15].
Particulate matter (PM) is composed of inert carbonaceous cores with multiple layers of various adsorbed molecules, including metals, organic pollutants, acid salts and biological elements, such as endotoxins, allergens and pollen fragments [16]. PM is classified in the following types.
  • “Total suspended particulates” (TSP) is a name given to particles of sizes up to about 50 µm. The larger particles in this class are too big to get past our noses or throats, and so, they cannot enter our lungs. They are often from wind-blown dust and may cause soiling of buildings and clothes. However, TSP samples may also contain the small PM10 and PM2.5 particles that may enter into our lungs [17,18].
Total suspended particulates (TSP) with additional subcategories of particles smaller than 10 µm (PM10) and particles smaller than 2.5 µm (PM2.5) are discussed. PM can exist in solid or liquid form and includes smoke, dust, aerosols, metallic oxides and pollen. Sources of PM2.5 include all types of combustion, such as motor vehicles, power plants, residential wood burning, forest fires, agricultural burning and some industrial processes [17,18]. Size and chemical composition are among the most important parameters influencing the way in which airborne particles interact with the environment. Deposition from the atmosphere onto soil, vegetation and other surfaces is a function of particle size [19].
The extent to which airborne particles penetrate the human respiratory system is determined mainly by size, with possible health effects resulting from the presence of toxic substances [19]. Visibility degradation is known to be a function of both the size and composition of the airborne particles [19]. A clear distinction is that particles smaller than 2.5 µm penetrate into the alveoli and terminal bronchioles; larger particles of up to 10 µm will deposit primarily in the primary bronchi, and much larger particles (up to 100 µm) will deposit in the nasopharynx [20].
By far the greatest number of particles fall into the ultrafine size range, consisting of PM with a diameter of 0.1 µm or less (PM0.1). These ultrafine particles (UFPs) dominate the surface area of particulate pollution, but do not contribute largely to the PM mass [17]. These size fractions arise primarily from combustion emissions and secondly from particles produced by gas-to-particle conversion processes. They are inherently unstable and grow into larger particles through coagulation and condensation [20]. These particles are dominated by sulfates, nitrates, organic carbon (OC) and, namely, elemental carbon (EC). Ultrafine particles (UFPs) present a particular health threat in that their small size allows greater lung penetration and onward passage across the air-blood barrier [20].
The lifetime of PM2.5 in the atmosphere is typically several days in the absence of precipitation, because fine particles have a negligible sedimentation rate and are not removed rapidly by dry deposition processes [21]. They can be transported thousands of km and remain in the atmosphere for a number of days. Coarse dust particles can settle rapidly from the atmosphere (within hours) and normally travel only short distances [17,18].
The chemical composition of particulate matter is an essential element of information for assessing its source and health effects. Knowledge on chemical composition allows the identification of the potential harmful effect of PM [22].

2.2. Air Quality Standards

Standard references are established in order to differentiate between a polluted and non-polluted atmosphere. These are determined by air quality standards, which define the maximum concentration levels of an atmospheric pollutant, which considers that higher concentrations will affect the health and safety of the population (primary standard), as well as result in damages to the flora, fauna, material and environment as a whole (secondary standard) [23]. These standards were established based on scientific studies concerning the effects produced by a specific pollutant.
The Brazilian National Environment Council (CONAMA) Resolution Number 3 published on Aug, 1990 [24] states that when area classes are not established, primary standards should be adopted. In Brazil, the standardized pollutants are TSP, smoke, sulfur dioxide (SO2), inhalable particles, carbon monoxide (CO), ozone (O3) and nitrogen dioxide, as shown in Table 1. The CONAMA Resolution Number 3 also states the critical air pollution scenarios, which are attention, alert and urgency (see Table 2).
Table 1. Brazilian National Air Quality Standards according to Company of Technology Environmental Sanitation—CETESB (2004). TSP, total suspended particulates; PM, particulate matter.
PollutantAveraging TimePrimary StandardsSecondary Standards
TSP24 h 1
Geometric Annual Average
240 µg/m3
80 µg/m3
150 µg/m3
60 µg/m3
PM1024 h 1
Arithmetic Annual Average
150 µg/m3
50 µg/m3
150 µg/m3
50 µg/m3
1 Do not exceed once a year.
Table 2. Critical air pollution scenarios, CETESB (2004).
PollutantAttentionAlertUrgency
TSP
(µg/m3)–24 h
≥375≥625≥875
PM10
(µg/m3)–24 h
≥250≥420≥500
Table 3 presents different country air quality standards for PM2.5.
Table 3. Air quality standards for PM2.5.
Countries/RegionsAveraging TimeStandard (µg/m3)References
WHO24 h
Annual
25
10
[25]
Canada24 h30[26]
USA24 h
Annual
35
15
[27]
European UnionAnnual
Annual
25 (in 2010)
20 (in 2015)
Directive 2008/50/CE [28]
Mexico24 h
Annual
65
15
[26]
The World Health Organization [25] recommends the standards for PM2.5 air quality as 25 µg/m3 using a 24-h averaging time, based on well-known short- and long-term health effects. Canada currently uses two sets of air quality standards: National Ambient Air Quality Objectives (NAAQOs) and Canada-Wide Standards (CWS). The federal government sets the NAAQOs [29]. These are national goals intended to protect public health, the environment and the aesthetic properties of the environment. They take a long-term risk reduction approach to protecting the environment and public health while recognizing economic and technical limits. The goals, which were developed for SO2, NO2, CO, O3 and TSP, are intended to provide background information, a uniform scale for assessing air quality in Canada and guidance to governments. The Canada-Wide Standards (CWS) establish numeric goals for ambient PM2.5 (30 µg/m3 using a 24-h averaging time) and O3 concentrations (65 ppb over an 8-h averaging time) that should be met by 2010 [29].
The Clean Air Act was amended in 1990 and requires that the EPA approves the Standard or National Standard of Air Quality (NAAQS), for compounds considered dangerous to human health and the environment. The Clean Air Act established two types of European Union national air quality standards: the Primary Standard, which enforces standards to define population health, including the health of sensitive populations, such as asthmatics, children and the elderly; the Secondary Standard, which imposes limits to protect public welfare, including protection against decreased visibility, damage to animals, crops, vegetation and buildings [27].
Directive 2008/50/EC (Council of the European Union) [28] became effective in June 2010, and the Member States are responsible for its implementation. This Directive is part of the “Fifth Action Program for the Environment of the EC” of 1992, which recommended the establishment of long-term goals for air quality. It complements European legislation in the field of air quality improvement that involves Directive 80/779/EEC on the air quality standards and reference values for sulfur dioxide and suspended particulates. In addition to the criteria pollutants covered by the NAAQS, the State has promulgated ambient air quality standards for total suspended particulates (TSP), hydrogen sulfide and added a 24-h NO2 standard [30].
The State of New Mexico air quality regulations are provided in the New Mexico Administrative Code (NMAC) Title 20, Chapter 2. These regulations establish State Ambient Air Quality Standards (NMAAQS) that are equal to or more stringent that the NAAQS. New Mexico also requires that all pollutant concentrations are expressed in parts per million (ppm) and are adjusted for altitude and temperature at the measurement location [30].
The Brazilian regulations do not have standards for PM2.5, while the American regulations do not have standards for suspended particulates. Both regulations do not establish air quality, which takes into account the generation source and the chemical composition of the material, and only establish the weight and the potential toxic risk.

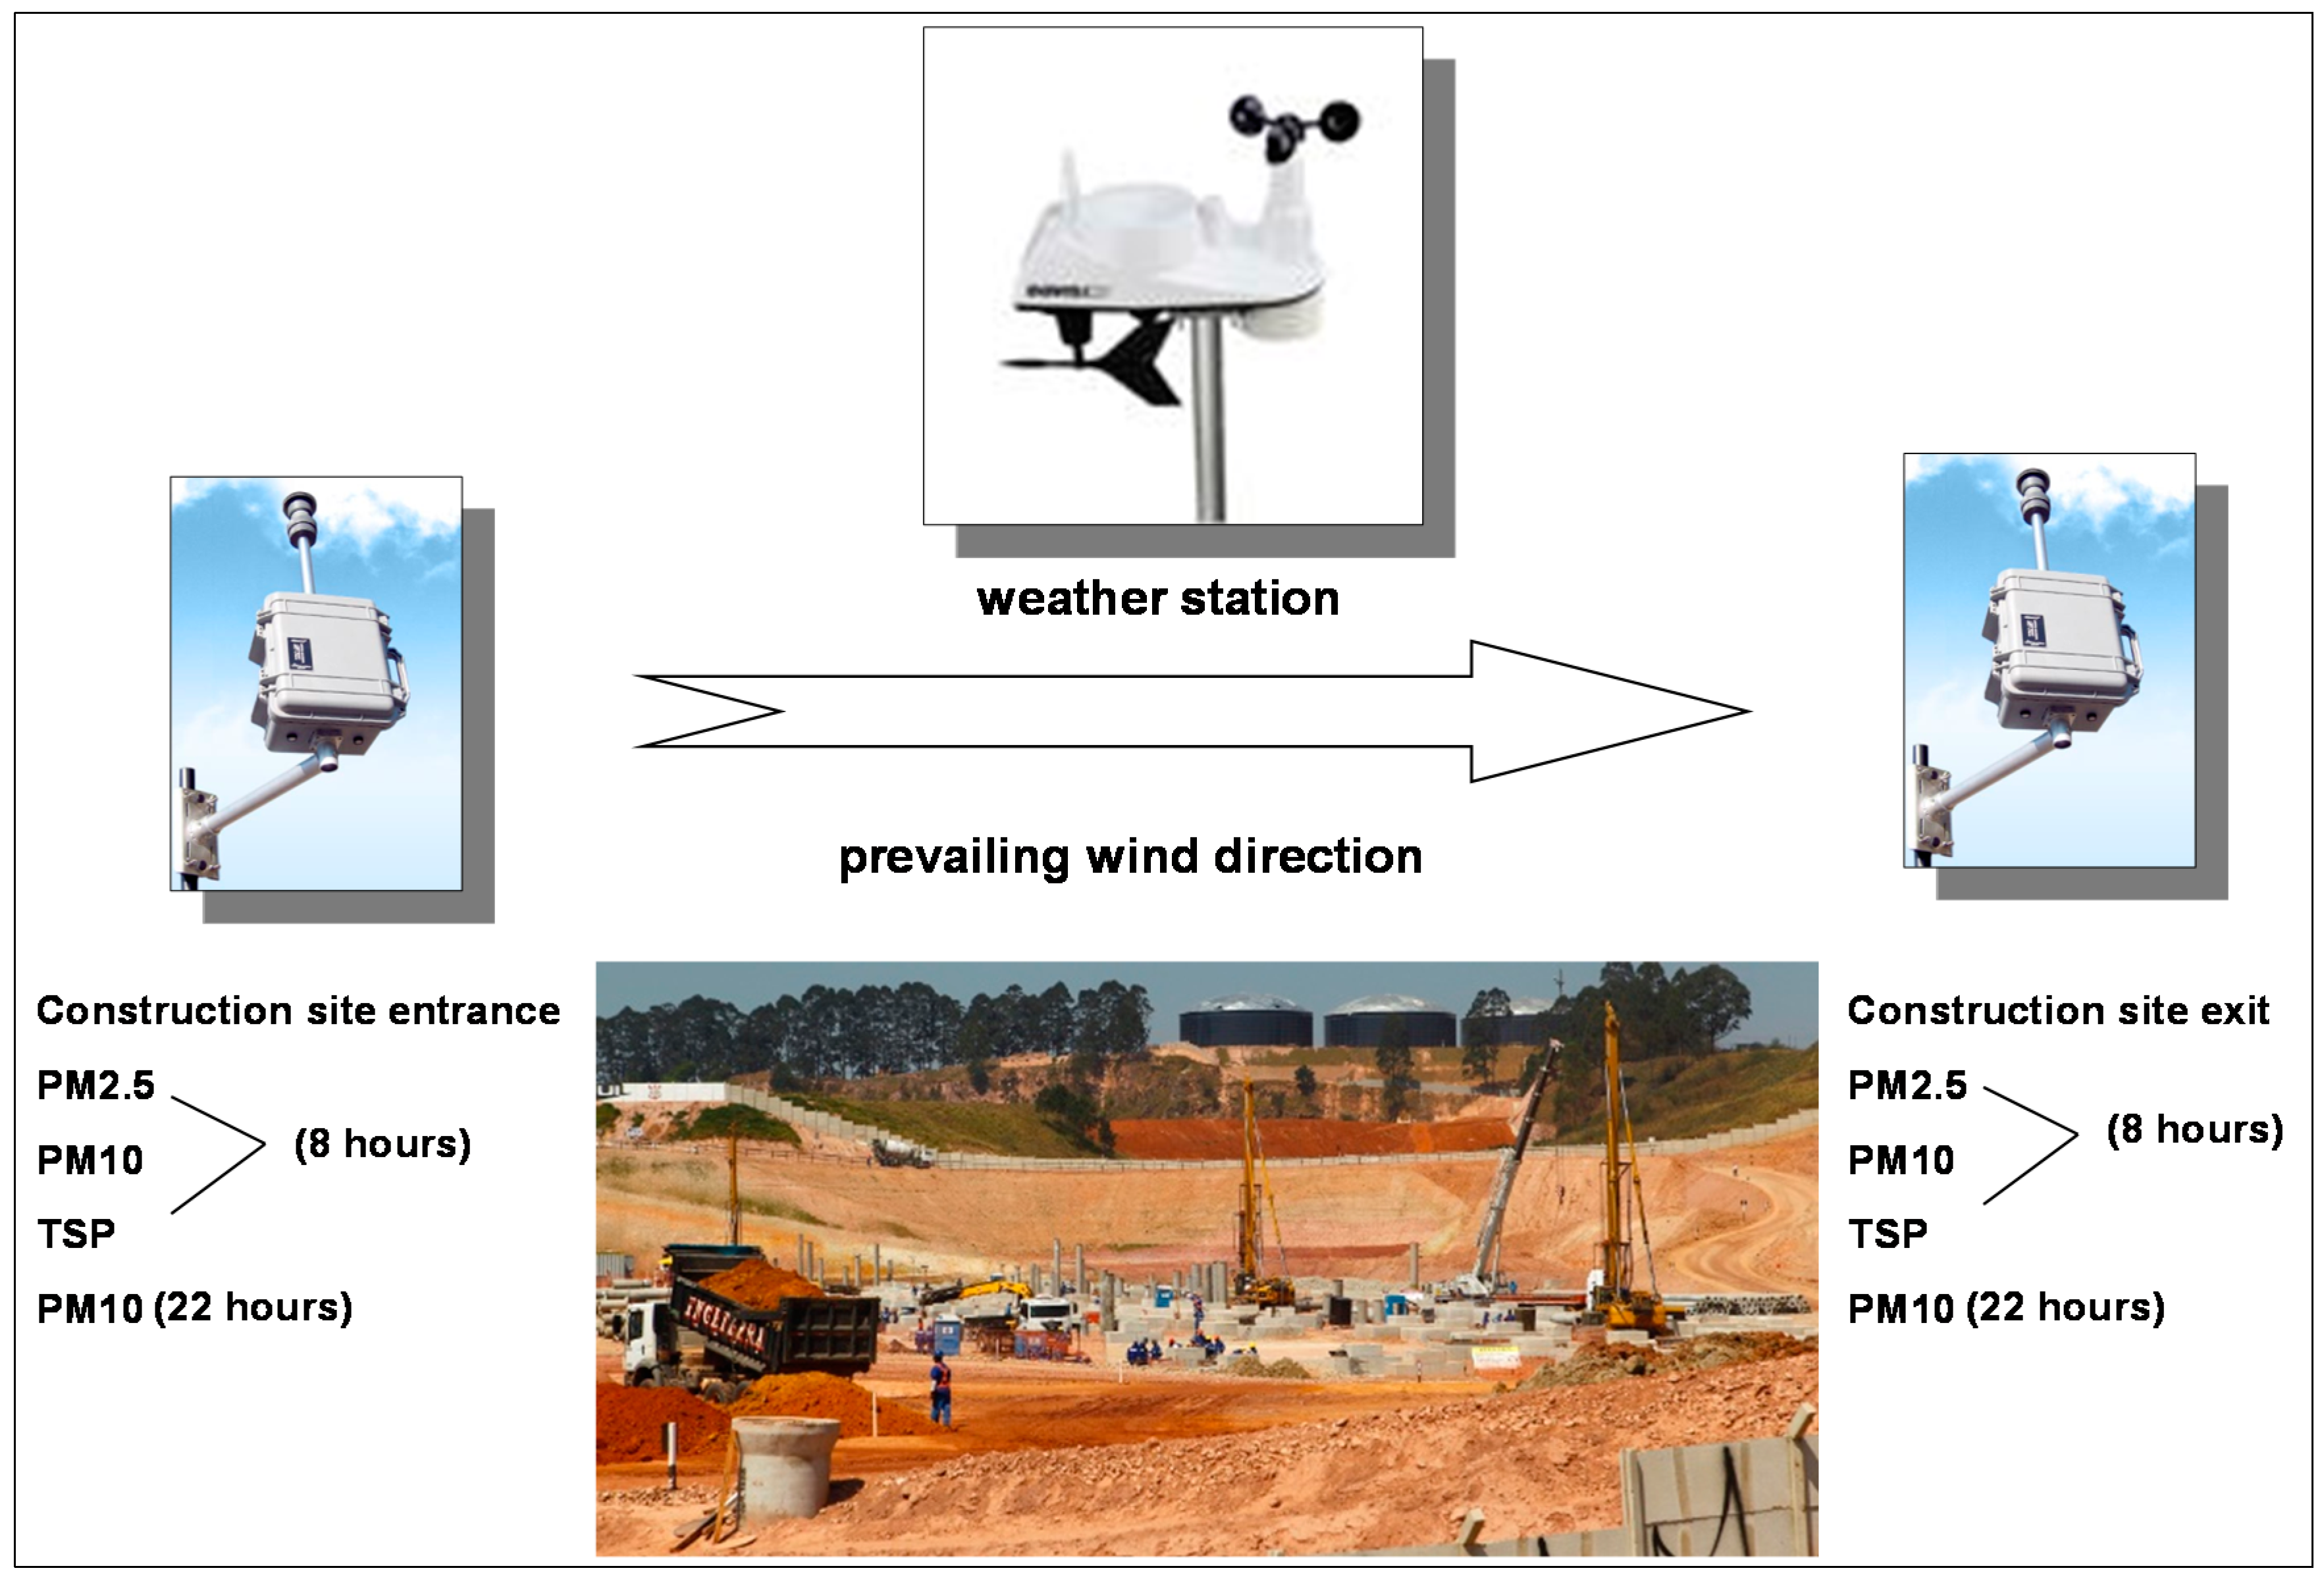
2.3. Equipment Used to Sample Particulate Matter

The sampling of particulate matter can be carried out by different types of equipment. This paper only presents the MiniVol equipment, which was used in the study.
The MiniVol Portable Air Sampler was developed jointly by the U.S. Environmental Protection Agency (U.S. EPA) and the Lane Regional Air Pollution Authority in an effort to address the need for portable air pollution sampling technology. Airmetrics (Springfield, OR, USA) manufactures the MiniVol™ TAS, which samples ambient air at 5 L/min for particulate matter (PM10, PM2.5 and TSP). While not a reference method sampler, the MiniVol™ TAS gives results that closely approximate data from federal reference method samplers. Lightweight and portable, the MiniVol™ TAS is ideal for remote areas or locations where no permanent site has been established [31].
The MiniVol™ comes equipped with low flow and low battery shut-offs and operates from a rechargeable, lead-acid battery. The battery can power the sampler for 24 h of continuous sampling before the battery pack must be exchanged for a freshly charged one. The MiniVol™ also features a seven-day programmable timer, an elapsed time totalizer and rugged PVC construction [31].
In the particulate matter sampling mode, air is drawn through a particle size separator and then through a filter medium. Particle size separation is achieved by impaction. Inlet impactors are available with a 10 micron cut-point (PM10) and a 2.5 micron cut-point (PM2.5). Operating the sampler without an impactor allows for the collection of total suspended particulate matter (TSP).
Critical to the collection of the correct particle size is the correct flow rate through the impactor. To assure a constant flow rate through the size separator at differing air temperatures and atmospheric pressures, the sampler must be adjusted for each sampling project [31].

3. Research Methods

The research strategy adopted in the present work was an experiment, consisting of a planned procedure, starting from a problem and hypothesis, which aims to understand phenomena under controlled conditions, to observe and, also, analyze its results [32,33].
The data were obtained by collecting PM2.5, PM10 and TSP via the MiniVols equipment, selected for this work due to its portability. It was installed during the three different construction site phases, earthworks (Phase 1), superstructure (Phase 2) and finishing (Phase 3), over a 10-day period for each phase in a residential building construction site in Salvador, Bahia, Brazil. In this study, the adjustment of the flow rate was carried out according to the MiniVol Operation Manual [31], and, so a regression curve was plotted to determine the initial flow rate of each MiniVol equipment used in the study.
Furthermore, the sedimentation rate was collected using an adhesive “sticky pad”, which consisted of the placing of these adhesives in the neighborhood for 3 days in a horizontal position in order to identify the emission impact of the activities that emit particles in the neighborhood.
In order to monitor the environmental conditions in which this PM was emitted, the Davis Vantage Vue weather station was used. The weather station was installed 5 days before the MiniVols accommodation and was allocated at the exit of the construction site, taking into consideration the regions’ prevailing wind, and from the data analysis, the correct sampling position was set in order to attain accurate data for each measurement.
Directional criteria have been suggested in order to monitor the particulate material, useful for reviewing critical emissions in neighboring buildings after the implementation of a construction site. This technique involves the use of sampler pairs placed in opposite positions along the prevailing wind direction. One set is placed at the construction site entrance (measuring the contribution of PM emissions entering the construction site), and the other is situated along the same direction, at the end of the construction site (measuring the emission contribution from the construction site) (Figure 1). The measurements were performed at the same time in two points, following two schedules: during the operation of the construction site (7 am–3 pm), measurements of about 8 h, and during the night shift (5 pm–3 pm), measurements of 22 h.
Initially, a diagnosis through on-site observation was carried out seeking to identify emissions risks, dust-generating activities during the different construction phases, including the observation of materials that were used in the production process, and the technologies used to execute the construction process.
Moreover, the measurement process followed a protocol of data collection, developed in order to standardize procedures and occasional variability, measure the pollution concentrations of particulate matter and evaluate the effects caused by the emission of these particles on the neighborhood. These findings were compared with the standards established by national and international rules.
Figure 1. Schematic positioning of equipment at a construction site. Adapted from [34].
Sustainability 06 07666 g001
The chemical and physical analysis of particles were carried out in a laboratory. The physical analysis was performed through the Mettler Toledo analytical balance from to LAPAT (Laboratório de Análise dos Processos Atmosféricos)/IAG (Instituto de Astronomia, Geofísica e Ciências Atmosféricas)/USP (University of São Paulo), used in order to obtain the sampled filter mass and the gravimetry. The concentration of particulate matter measured by a sampler is given by Equation (1). The concentration was calculated for PM2.5 8 h, PM10 8 h, TSP 8 h and PM10 22 h.
Equation (1). Particulate concentration formula:
C = m/QxT
where:
C = particulate concentration (mass/volume);
m = net mass collected on the filter or substrate (mass);
Q = volumetric flow rate of the sampler (volume/time);
T = duration of sampling (time).
The chemical analysis was accomplished by the X-ray florescence equipment, EDX 700 HS “Energy Dispersive X-Ray Spectrometer” model, from LAPAT/IAG/USP Shimadzu, which was used to quantify the periodic table elements with an atomic number from 11 to 82 (Na to Pb). Thereafter, the results derived from this analysis were converted into concentrations of each identified element by the WinQXAS (Windows Quantitative X-ray Analysis System) program, which aims to improve the data analysis of the X-ray florescence (XRF) through spectral line adjustments. This software allows the manipulation, visualization and simulation of spectral data obtained in the EDX and aims at determining the peak of the interested lines used in the concentration analysis. The X-ray florescence was performed for PM2.5 8 h, PM10 8 h and PM10 22 h, since the material of the filter was a polycarbonate membrane by Whatman. The type of TSP material filter (Teflon by Millipore) does not allow performing the X-ray fluorescence.
The sedimentation rate analysis through the reading of stick pads aims at identifying the percentage of the effective area coverage (EAC) per day. The EAC is calculated by subtracting the instrument reading from the reference area reading and then dividing by the number of days of exposure to give %EAC/day. Table 4 presents the typical levels of response for the reading of stick pads [35].
Table 4. Typical levels of response Hanby (2014). EAC, effective area coverage.
%EAC/dayResponse
0.2Noticeable
0.5Possible complaints
0.7Objectionable
2.0Probable complaints
5.0Serious complaints

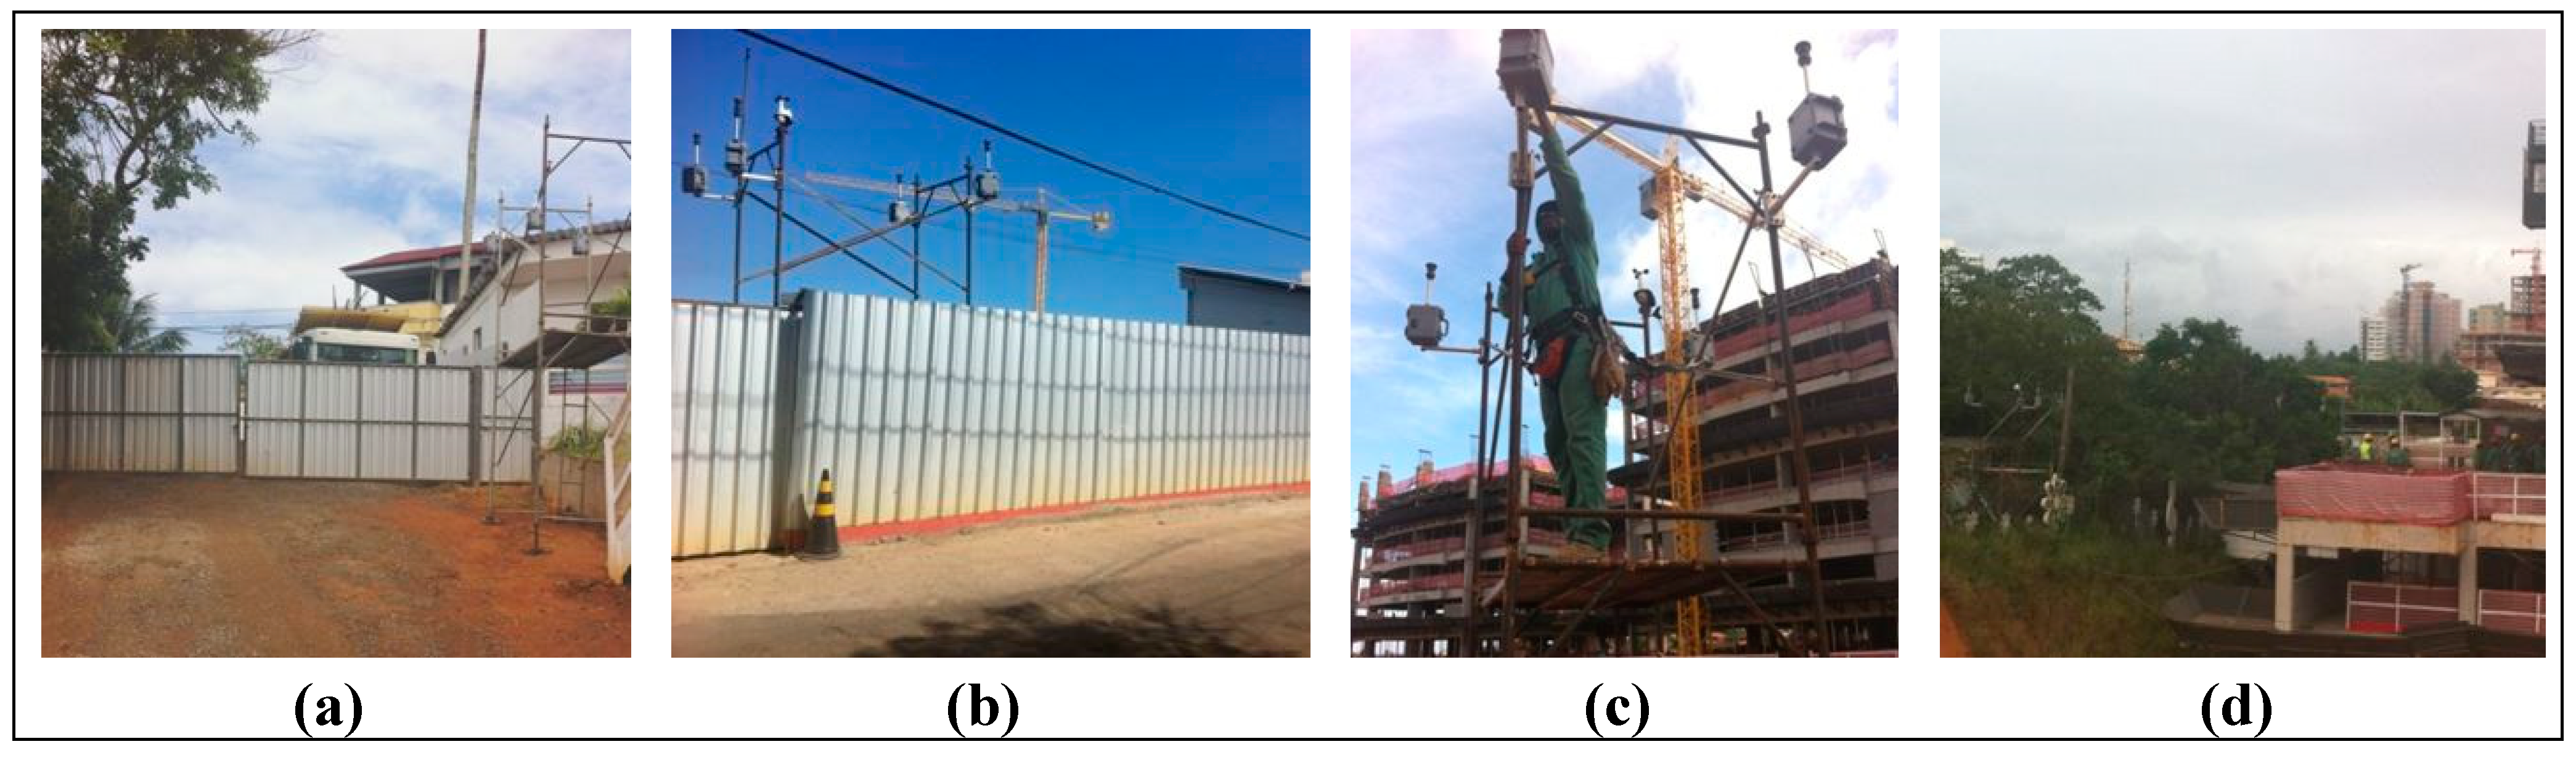
Characterization of the Construction Site
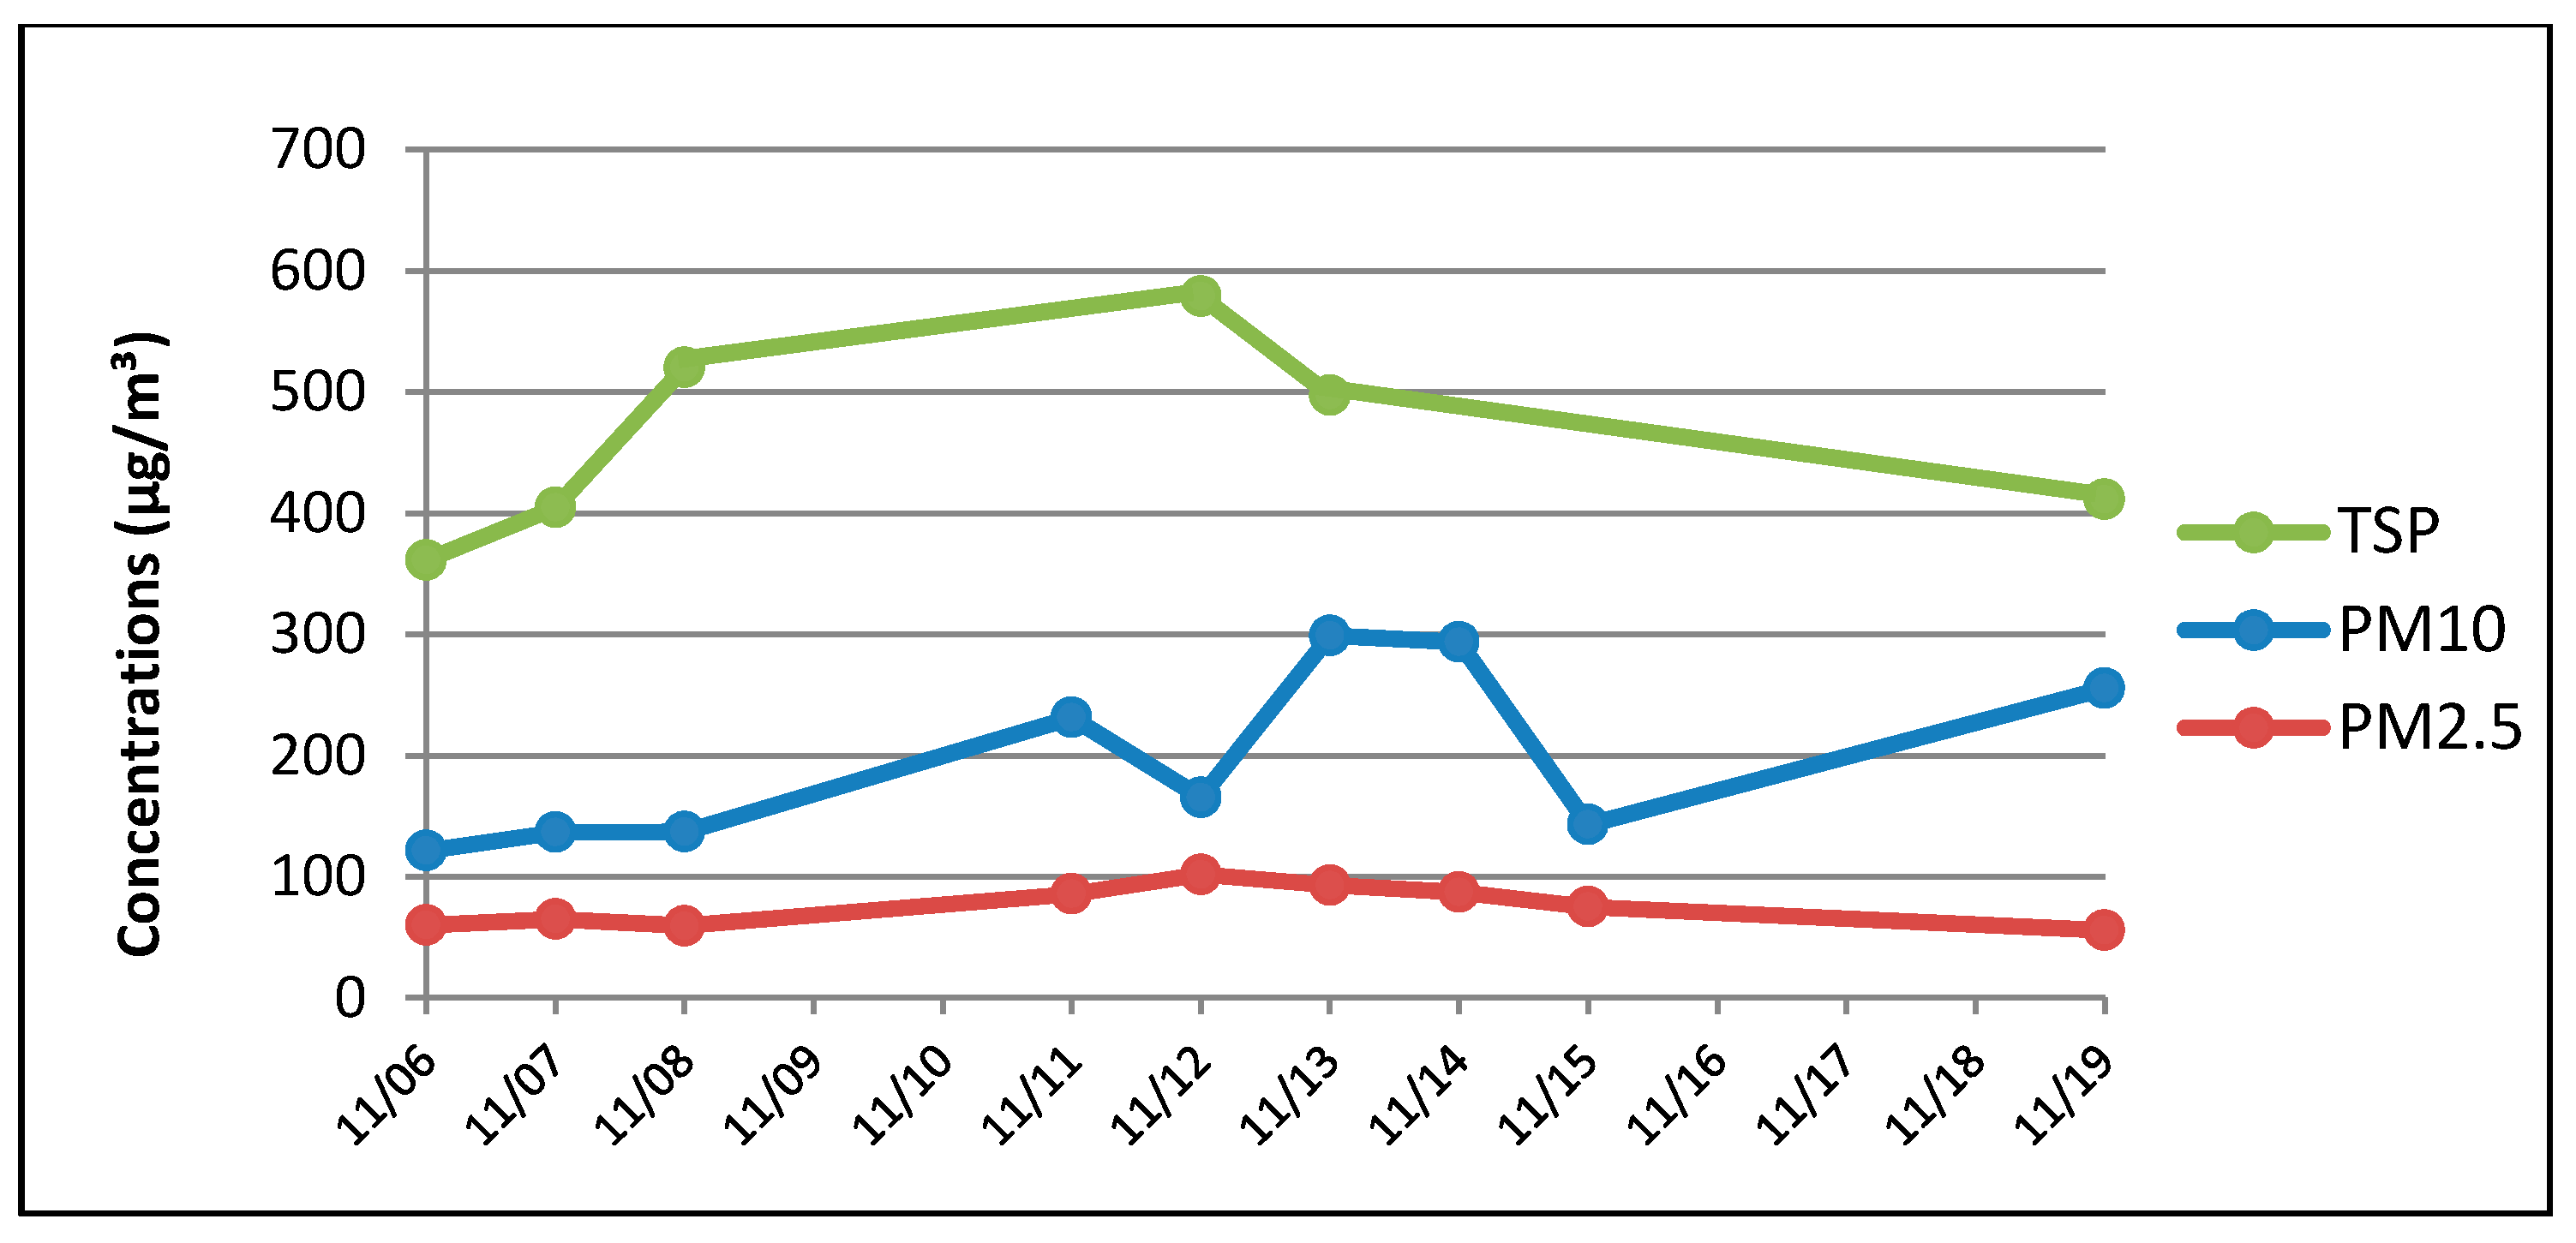
The construction site studied is located in Salvador, Bahia, Brazil, (latitude 12°57'46'' south, longitude 38°24'32'' west) at an altitude of 34 m. It has an area of 32,780 m², with the construction of 8 residential towers, each with 16 floors, totaling 464 housing units.
The construction site is located in a residential urban area (up to 2 floors) with the presence of flora and fauna, including a lake. Within an area of 100 m, there is no presence of primary pollution sources, such as the presence of other construction sites, industries, traffic routes and airports.
Although this study proposed to measure PM during the different construction phases, because the selected construction site had all construction phases in development simultaneously, this was not possible. During the measurement process, overlapping of the phases and consequent mixing of PM from them was observed, thus limiting the ability to analyze the influence of each construction phase and their emitting activities separately. Therefore, an adjustment of the methodology was required. The entry point was considered as a Fixed Point, since it was not shifted along the three different measurement phases, and the exit points were called Point 1, Point 2 and Point 3.
As already mentioned, a weather station was installed 5 days before the installation of the equipment. It is important to note that, depending on the season, time and hour, Salvador’s city wind ranges 360°. From the weather station data, the prevailing wind direction found was the southeast wind, especially from 7 am to 3 pm.
The equipment was installed in a fixed point at the main entrance of the construction site and in three distinct points (Point 1, Point 2 and Point 3), located at the construction site exit in different measurement phases. The MiniVols were allocated next to the activities that exhibited a predominance of the main phases of the construction site: Phase 1, earthworks (Point 1); Phase 2, superstructure (Point 2); and Phase 3, finishing (Point 3) (Figure 2).
Figure 2. Position of (a) fixed point and Points (b) 1; (c) 2 and (d) 3.
Sustainability 06 07666 g002
Data collection was carried out as follows:
  • Phase 1Measurement of Fixed Point and Point 1 held on the dates: 11/06/2013, 11/07/2013, 11/08/2013, 11/11/2013, 11/12/2013, 11/13/2013, 11/14/2013, 11/15/2013, and 11/19/2013. The sticky pads were installed in the neighborhood for 72 h at 5, 10, 20, 50 and 100 m.
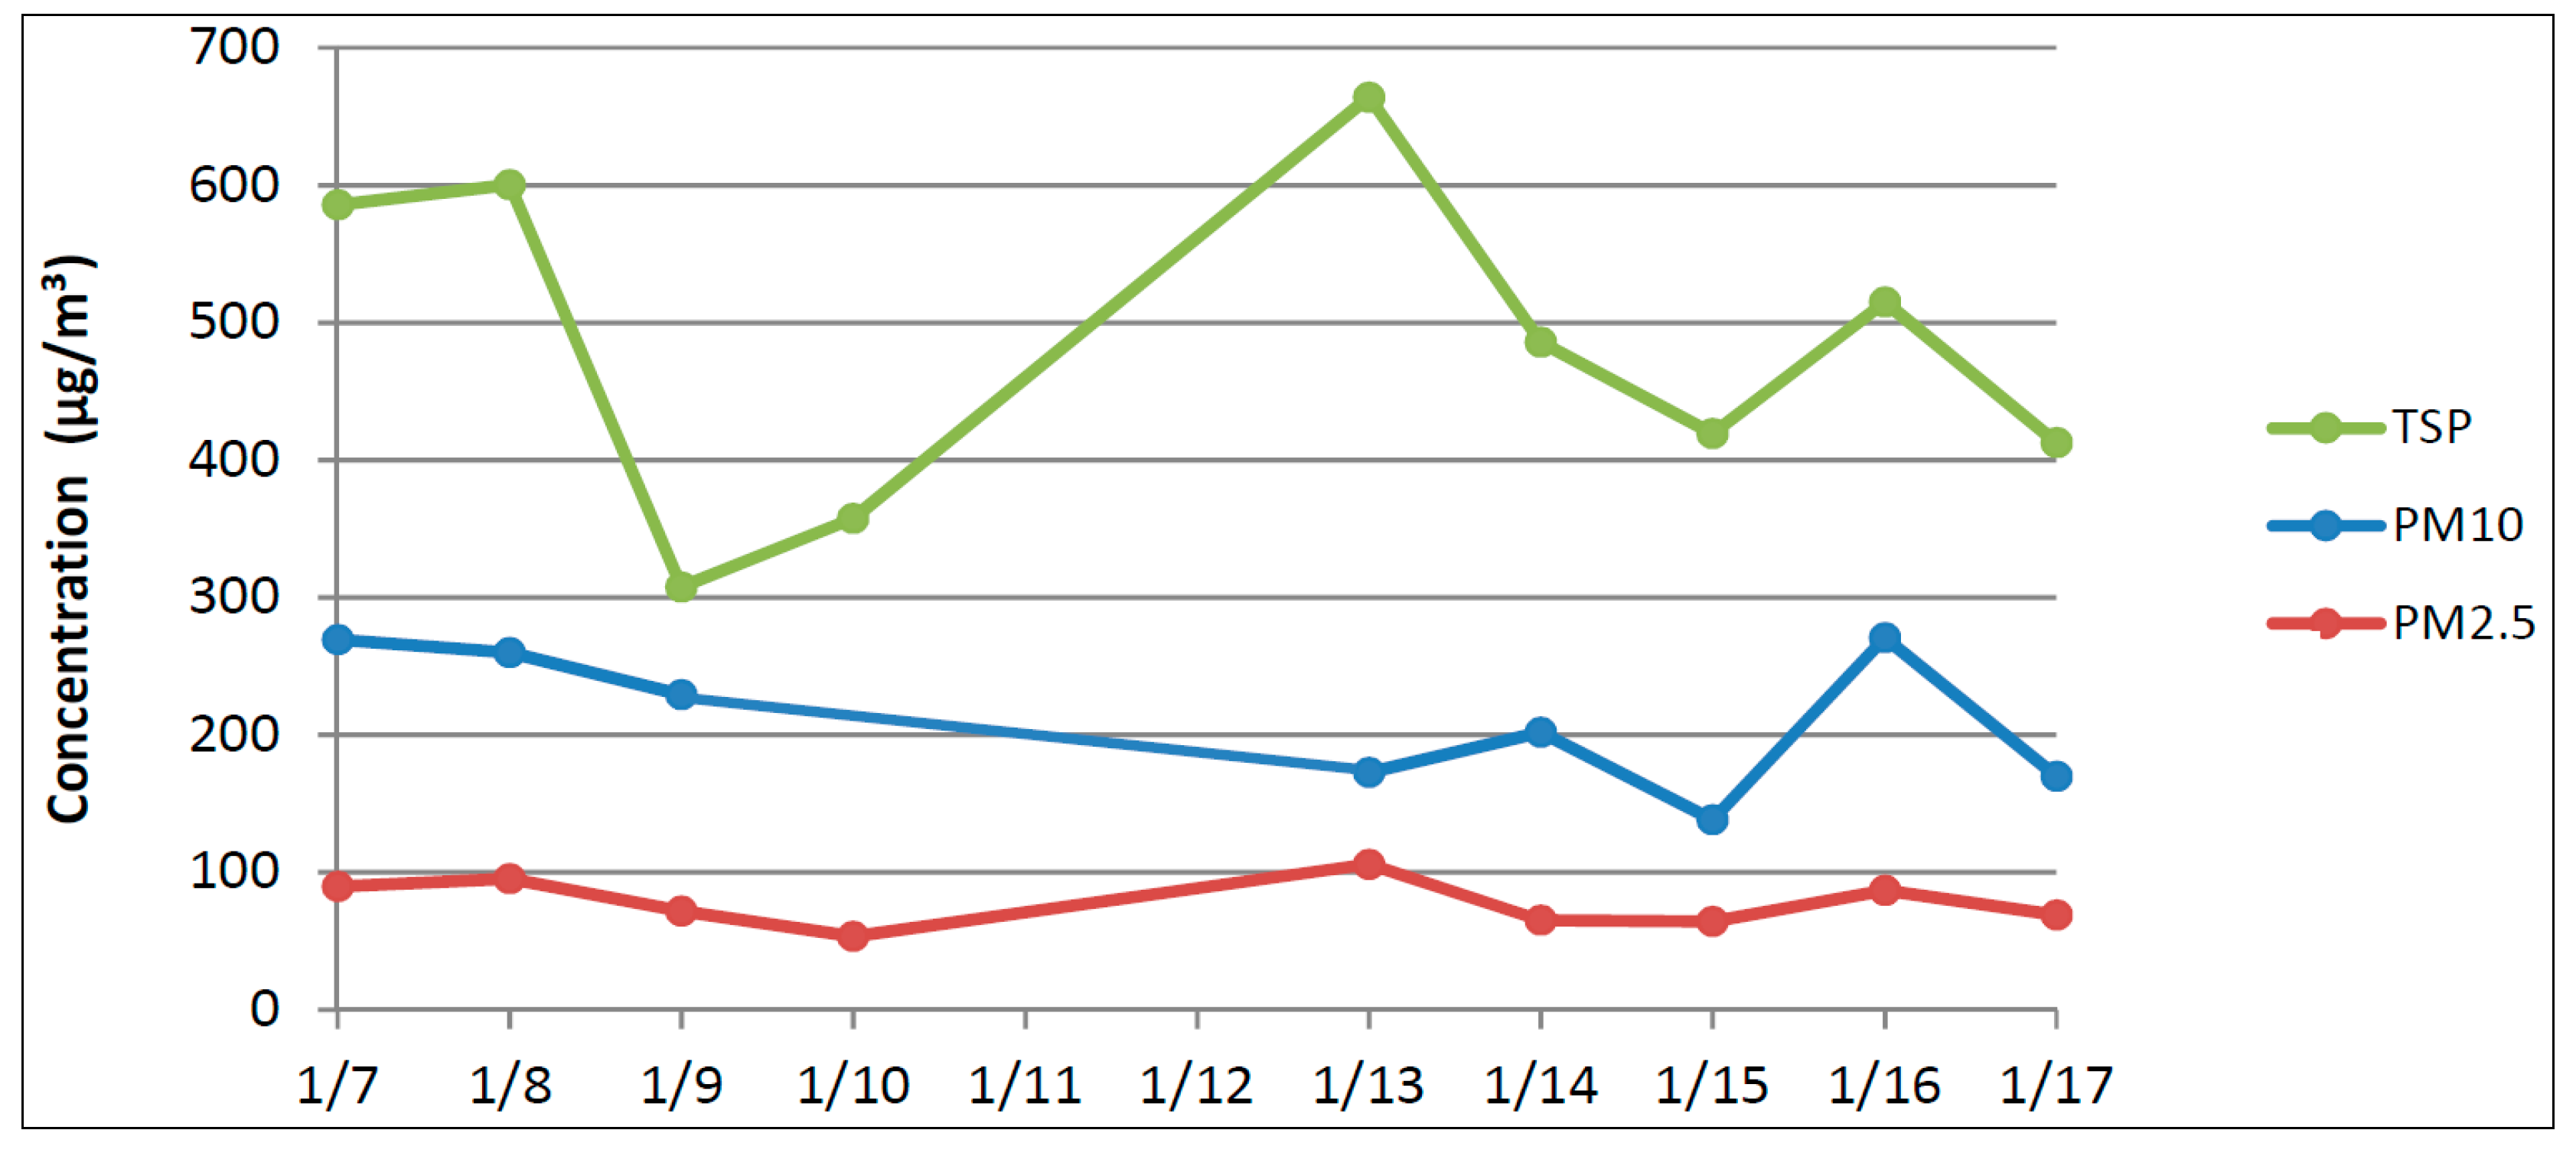
  • Phase 2—Measurement of Fixed Point and Point 2 held on the dates: 01/07/2013, 01/08/2014, 01/09/2014, 01/10/2014, 01/13/2014, 01/14/2014, 01/15/2014, 01/16/2014, and 01/17/2014. The sticky pads were installed in the neighborhood for 72 h at 5, 10, 20, 50 and 100 m.
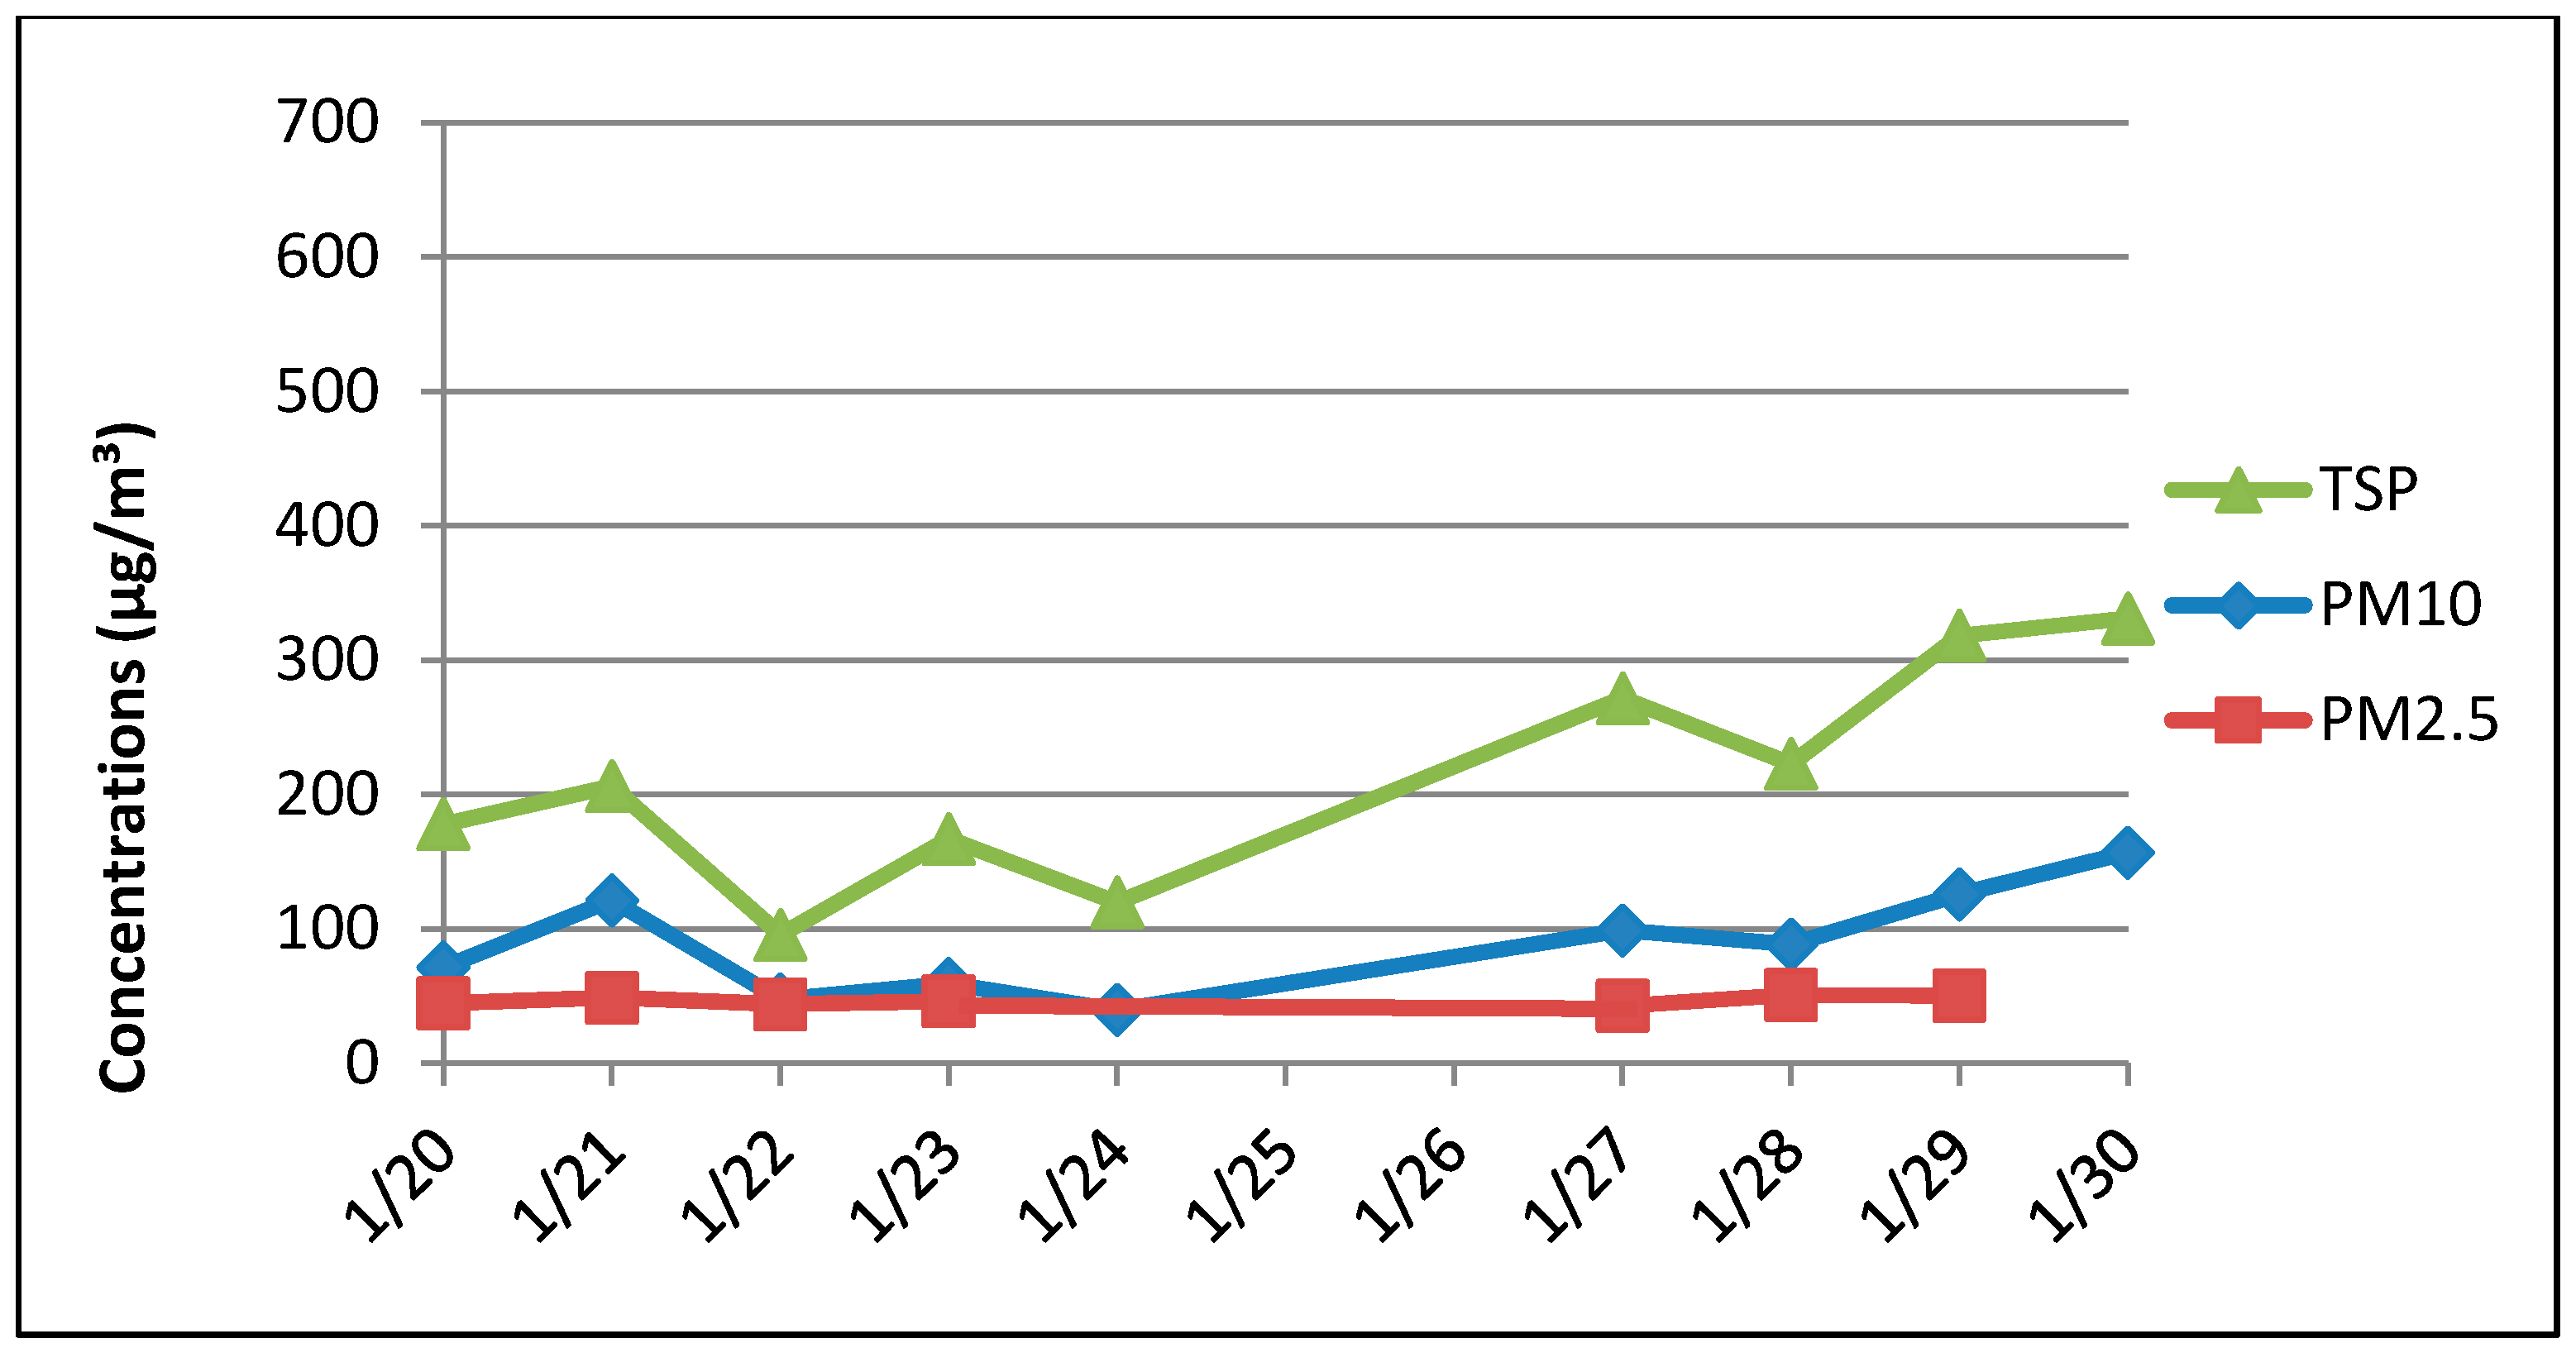
  • Phase 3—Measurement of Fixed Point and Point 3 held on the dates: 01/20/2014, 01/21/2014, 01/22/2014, 01/23/2014, 01/24/2014, 01/27/2014, 01/28/2014, 01/29/2014, and 01/30/2013. The sticky pads were installed in the neighborhood for 72 h at 5, 10, 20, 50 and 100 m.

4. Results and Discussion

This section presents the findings obtained for the three measurement periods (Phase 1, Phase 2 and Phase 3), divided into physical characterization, chemical characterization and sedimentation rate.

4.1. Physical Characterization of Points 1, 2, 3 and the Fixed Point

The samples collected during the construction site activities accumulated an extensive database, acquired by the MiniVols equipment (220 samples). However, the 22-h period of measurement at Points 1, 2 and 3 is not presented in this work due to sampling errors, since the gravimetry values found in their filters showed much lower values compared to the values for 8 h. The inconsistences in these findings could be caused by field measurement errors, laboratory weight procedure errors or equipment procedure errors. Due to the complexity of the exploratory study and because the physical and chemical analysis were performed after all three phase measurements, the authors could not precisely identify the reasons for the sampling errors. Therefore, only the fixed point 22-h period data was used for different measurement phases.
Table 5 presents the descriptive statistics of PM concentrations in µg/m³ at Points 1, 2 and 3 at Phases 1, 2 and 3, respectively. Table 6 presents the descriptive statistics of PM concentrations in µg/m³ at the fixed point at Phases 1, 2 and 3. Table 7 presents the weather conditions data per measurement day at Phases 1, 2 and 3. Table 8 presents the summary of the construction activities and dust control methods at Point 1, Point 2, Point 3 and the fixed point. Figure 3, Figure 4 and Figure 5 present the daily concentration results of PM concentrations in µg/m³ at Points 1, 2 and 3, respectively.
Table 5. Descriptive statistics of PM concentrations in µg/m³ at Points 1, 2 and 3.
Descriptive statisticsPoint 1, Phase 1Point 2, Phase 2Point 3, Phase 3
TSPPM10PM2.5TSPPM10PM2.5TSPPM10PM2.5
Maximum 578.86298.84101.91664.19270.70105.84331.13156.9150.96
Average 462.25198.0975.89483.12213.9477.85212.3190.0046.84
Median 454.32165.4875.15485.60215.3771.69206.3588.5046.24
Minimum 361.34121.5255.77307.65138.2853.2495.6339.7342.89
Standard Deviation 82.8171.6916.74119.1750.8817.1982.4839.433.21
Coefficient of Variation 18%36%22%25%24%22%39%44%7%
Table 6. Descriptive statistics of PM concentrations in µg/m³ at the fixed point.
Descriptive statisticsFix Point, Phase 1Fix Point, Phase 2Fix Point, Phase 3
TSPPM10 8 hPM10 22 hPM2.5TSPPM10 8 hPM10 22 hPM2.5TSPPM10 8 hPM10 22 hPM2.5
Maximum 448.28131.1178.3248.59327.88108.0163.2258.15608.97117.4656.8667.87
Average 339.0190.7153.2643.87287.4789.3151.7743.93325.0978.3046.9650.24
Median 333.5487.8241.1644.55297.4688.9743.2642.64274.7174.1233.2248.13
Minimum 183.3064.1848.5238.56222.3360.7453.2430.08125.3745.4348.3338.66
Standard Deviation 90.6523.9613.383.4037.6516.007.088.48145.3023.128.889.74
Coefficient of Variation 27%26%25%8%13%18%13%19%44%29%19%19%
Table 7. Construction activities and dust control methods at Phases 1, 2 and 3
Activities and MethodsPhase 1Phase 2Phase 3
Construction activities at different pointsPoint 1 Main activities: manual excavation, meso structure, razing of auger piles foundations, vehicular traffic on the soil, land transportation, truck traffic at the construction site.
Other activities around: superstructure, lift masonry, execution of self-leveling, floor, masonry cement, mortar coating execution, treatment for concrete and floor regularization with cement.
Point 2 Main activities: execution of reinforced concrete (columns, beams and slabs), lift masonry, mortar execution, and masonry shaft.
Other activities around: interior and exterior finishes (ceramic coating (wall), mortar coating, marble and granite fillet door), plumbing and electrical installation systems, waterproofing with asphalt blanket and crystallized waterproofing.
Point 3 Main activities: external and internal mortar finishing activities, grouting masonry façade, ceramic coating (wall), crystallized waterproofing, countertops marble and granite, lining plasterboard plates, sanding (wall and ceiling).
Other activities around: execution of reinforced concrete (columns, beams and slabs), lift masonry, mortar execution and masonry shaft.
Construction activities at Fix PointMain activities: transportation of material, moving vehicles and the surrounding areas of construction activities in general.
Other activitiesaround activities of the neighborhood.
Dust control methodsSprinkling water to the routes inside of the jobsite
Careful traffic route
All trucks entering and leaving site were covered
Sprinkling water to the routes inside of the jobsite
Careful traffic route
All trucks entering and leaving site were covered
Sprinkling water to the routes inside of the jobsite
Careful traffic route
All trucks entering and leaving site were covered
Netting system around the tower to mitigate dusty façade mortar activities
Table 8. Weather Condition data per day of measurement at Phase 1, Phase 2 and Phase 3.
Phases/DatesHumidity (%)Atmospheric Pressure (mmHg)Temperature (°C)Wind Speed (m/s)PluviometryPrevailing Southeast wind (% per day)
Phase 1
11/06/201369755.824.40.90.011.1
11/07/201377756.126.41.31.444.4
11/08/201369758.829.21.40.00.0
11/11/201366758.230.11.60.017.6
11/12/201367758.229.91.00.064.7
11/13/201374758.328.91.90.029.4
11/14/201372759.428.72.31.00.0
11/15/201374760.027.81.60.235.3
11/19/201376759.627.84.70.20.0
Phase 2
01/07/201477756.326.41.31.444.4
01/08/201480755.525.91.80.022.2
01/09/201482755.125.00.90.211.1
01/10/201489756.325.20.93.20.0
01/13/201478758.527.01.40.00.0
01/14/201478758.227.41.40.022.2
01/15/201483756.726.51.51.80.0
01/16/201473756.827.01.00.033.3
01/17/201486757.025.41.11.80.0
Phase 3
01/20/201477756.527.81.20.00.0
01/21/201476759.428.80.60.00.0
01/22/201481759.827.70.76.617.6
01/23/201471759.529.10.70.05.9
01/24/201476758.426.81.40.00.0
01/27/201475760.129.71.10.00.0
01/28/201476758.627.91.11.80.0
01/29/201472758.529.42.00.00.0
01/30/201466758.929.61.70.00.0
Figure 3. Daily concentration results of TSP, PM10 and PM2.5 in µg/m3 at Point 1 (7 am–3 pm).
Sustainability 06 07666 g003
Figure 4. Daily concentration results of TSP, PM10 and PM2.5 in µg/m3 at Point 2 (7 am–3 pm).
Sustainability 06 07666 g004
Figure 5. Daily concentration results of TSP, PM10 and PM2.5 in µg/m3 at Point 3 (7 am–3 pm).
Sustainability 06 07666 g005
By analyzing Table 5 and Figure 3, Figure 4 and Figure 5, it is possible to notice that the TSP showed the highest concentrations in the three different phases with average concentrations of 462.25 µg/m3, 483.12 µg/m3 and 212.31 µg/m3, at Point 1, Point 2 and Point 3, respectively.
Besides, the data showed that Point 2 was the most environmentally impacted by concentrations of particulate matter for the three particle sizes (TSP, PM10 and PM2.5) during the studied period when compared with Point 1 and Point 3. Point 2 emitted TSP, PM10 and PM2.5 with average concentrations of 483.12 µg/m3, 213.94 µg/m3 and 77/85 µg/m3, respectively. At Point 1, the average concentrations were 462.25 µg/m3, 198.09 µg/m3 and 75.89 µg/m3, and at Point 3, the average concentrations were 212.31 µg/m3, 90.00 µg/m3 and 46.84 µg/m3 (Table 5). It is important to note that Point 1 and Point 2 emitted a similar PM concentration average of the three fractions.
Concerning the fixed point, it is possible to observe that there is less of a difference between average PM concentration (TSP, PM10 8 h, PM10 22 h and PM2.5) data from the different measurement phases (Phase 1, Phase 2 and Phase 3) (Table 6). In addition, there is not a correlation between PM concentrations from the fixed point to the other points at the same measurement phase. This occurred because the fixed point was installed at the entrance of the construction site and was not under the same PM influence as Point 1, Point 2 and Point 3 at Phase 1, Phase 2 and Phase 3, respectively. This can be justified by the large size of the construction site. From the fixed point to Point 1, the distance was 195.8 m; to Point 2, it was 132.34 m, and to Point 3, it was 210.64 m. The construction activities identified at this fixed point were almost the same for the three measurement periods (Table 7) and were related to transportation of material, moving vehicles and the surrounding areas of construction activities in general. Moreover, the particles collected at the fixed point may have been derived from the activities occurring in the neighborhood.
By analyzing Table 8, it is possible to understand the weather conditions during the three measurement periods. The humidity was higher than 60%, with low variation along each phase. The range of atmospheric pressure (755–760 mmHg) and of the average temperature (Phase 1: 24–30 °C; Phase 2: 25–27 °C; and Phase 3: 27–29 °C) had low variation during the three measurement phases. Concerning pluviometry, on 60% of the measurement days, the value found was 0 or 0.2 mm; on one day, it was 3.2 mm in Phase 2, and on another day, it was 6.6 mm in Phase 3. It is possible to assume that for this study, the low variation of humidity, temperature and atmospheric pressure had a low influence on the PM concentration.
Most samples were taken during calm (0–0.2 m/s), light air (0.3–1.5 m/s) and light breeze (1.6–3.3 m/s) wind speed conditions apart from one isolated situation (11/19/2013) taken under gentle breeze (3.4–5.4 m/s) wind conditions, which was according to the Beaufort scale [36]. Through the data, it was observed that most of the maximum PM concentration was associated with higher wind speeds. Therefore, this suggested that that wind speed had a major influence on PM concentration in this study compared to the other weather condition variables.
It is important to note that using a statistical regression curve, no significant correlation was found between any weather condition variable and PM concentration for this study.
Aiming at better understanding regarding the highest and lowest PM concentration values obtained, the meteorological data during the study were analyzed, focusing on these days (Table 8).
The highest concentration of TSP (664.19 μg/m3) was recorded at Point 2 on 01/13/2014, and on this day, there was the absence of the southeast wind; the average speed wind was 1.4 m/s; the humidity was 78%, and there was no rain. The lowest concentration of TSP at Point 2 (307.65 μg/m3) was obtained on 01/09/2014 with a prevailing southeast wind of 11.1% compared to the winds of the day, with an average speed of 1.1 m/s; the humidity was 82%, and 0.2 mm of rain accumulated.
It was observed that on the day of the highest concentration, the environmental condition could not be guaranteed to be related to the concentration level found, because the meteorological data obtained on this day tend to favor a low concentration level, except the average of the wind speed. However, there is an assumption that there was a contribution of prevailing winds from other winds directing the PM to the device, adding to higher PM emissions due to construction activities on this day. Regarding the day presenting the lowest PM concentration, the obtained value was expected, due to the southeasterly wind, high humidity and presence of rain during this day.
The highest concentration of PM10 (270.70 μg/m3) was recorded at Point 2 on 01/16/2014 with the prevailing southeast wind of 33.3% compared to the winds of the day with an average speed of 1.0 m/s; the humidity was 73% (the lowest humidity recorded in the period), and there was no rain. The lowest concentration of PM10 at this Point (138.28 μg/m3) was obtained on 01/15/2014, and on this day, the southeast wind was absent; the humidity was 83%, and 1.8 mm of rain fell.
Regarding environmental conditions, it was observed that on the day of the highest concentration, there was an average prevalence of southeast wind that tended to direct the PM, together with high humidity, even with the absence of rain. On the day of the lowest concentration, the weather conditions showed no southeast wind and high humidity, and there was the presence of rain. Therefore, the meteorological data are consistent with both findings.
The highest concentration of PM2.5 (105.84 μg/m3) was recorded at Point 2 on 01/13/2014 (the same day of the highest TSP concentration), in which there was the absence of the southeast wind; the average speed wind was 1.4 m/s; the humidity was 78%, and there was no rain. The lowest concentration of PM2.5 at this Point (53.24 μg/m3) was obtained on 01/10/2014, and there was no southeast wind; the average speed wind was 0.9 m/s, the humidity was 89% (highest humidity recorded in the period), and the rain accumulation was 2 mm.
As already mentioned, it was observed that on the day (01/13/2014) of the highest concentration, the environmental condition could not be guaranteed to be related to the concentration level found, because the meteorological data obtained on this day tend to favor a low concentration level, except the wind speed. However, there is an assumption that there was a contribution of other prevailing wind directions that directed the PM to the device, adding to higher PM emissions due to construction activities on this day. Regarding the day of the lowest concentration, the obtained value was expected, due to the presence of a southeast wind, high humidity and the occurrence of rain on this day.
According to the data collected, it is possible to affirm that the construction site activities influenced the environment through a higher emission of TSP during the studied period. TSP are particles that have lower permanence in the atmosphere, therefore depositing near the emission sources; that is, near the immediate neighborhood.
The analysis of PM10 concentrations (22 h) at the fixed point at Phase 1, 2 and 3 (Table 6) indicates that the values obtained were always below the concentrations of the primary and secondary standards of the Brazilian CONAMA Resolution Number 3 [24] (150 µg/m3–24 h). The highest value was 78.32 µg/m3, which was measured on the following days, November 18 and 19, 2013, of Phase 1. However, data from this research sometimes exceeded the most stringent data of WHO [25], in relation to the Interim Target (IT-3) for 24 h, 75 μg/m3. Brazilian standards are outdated if compared to the standards established by WHO and international standards.

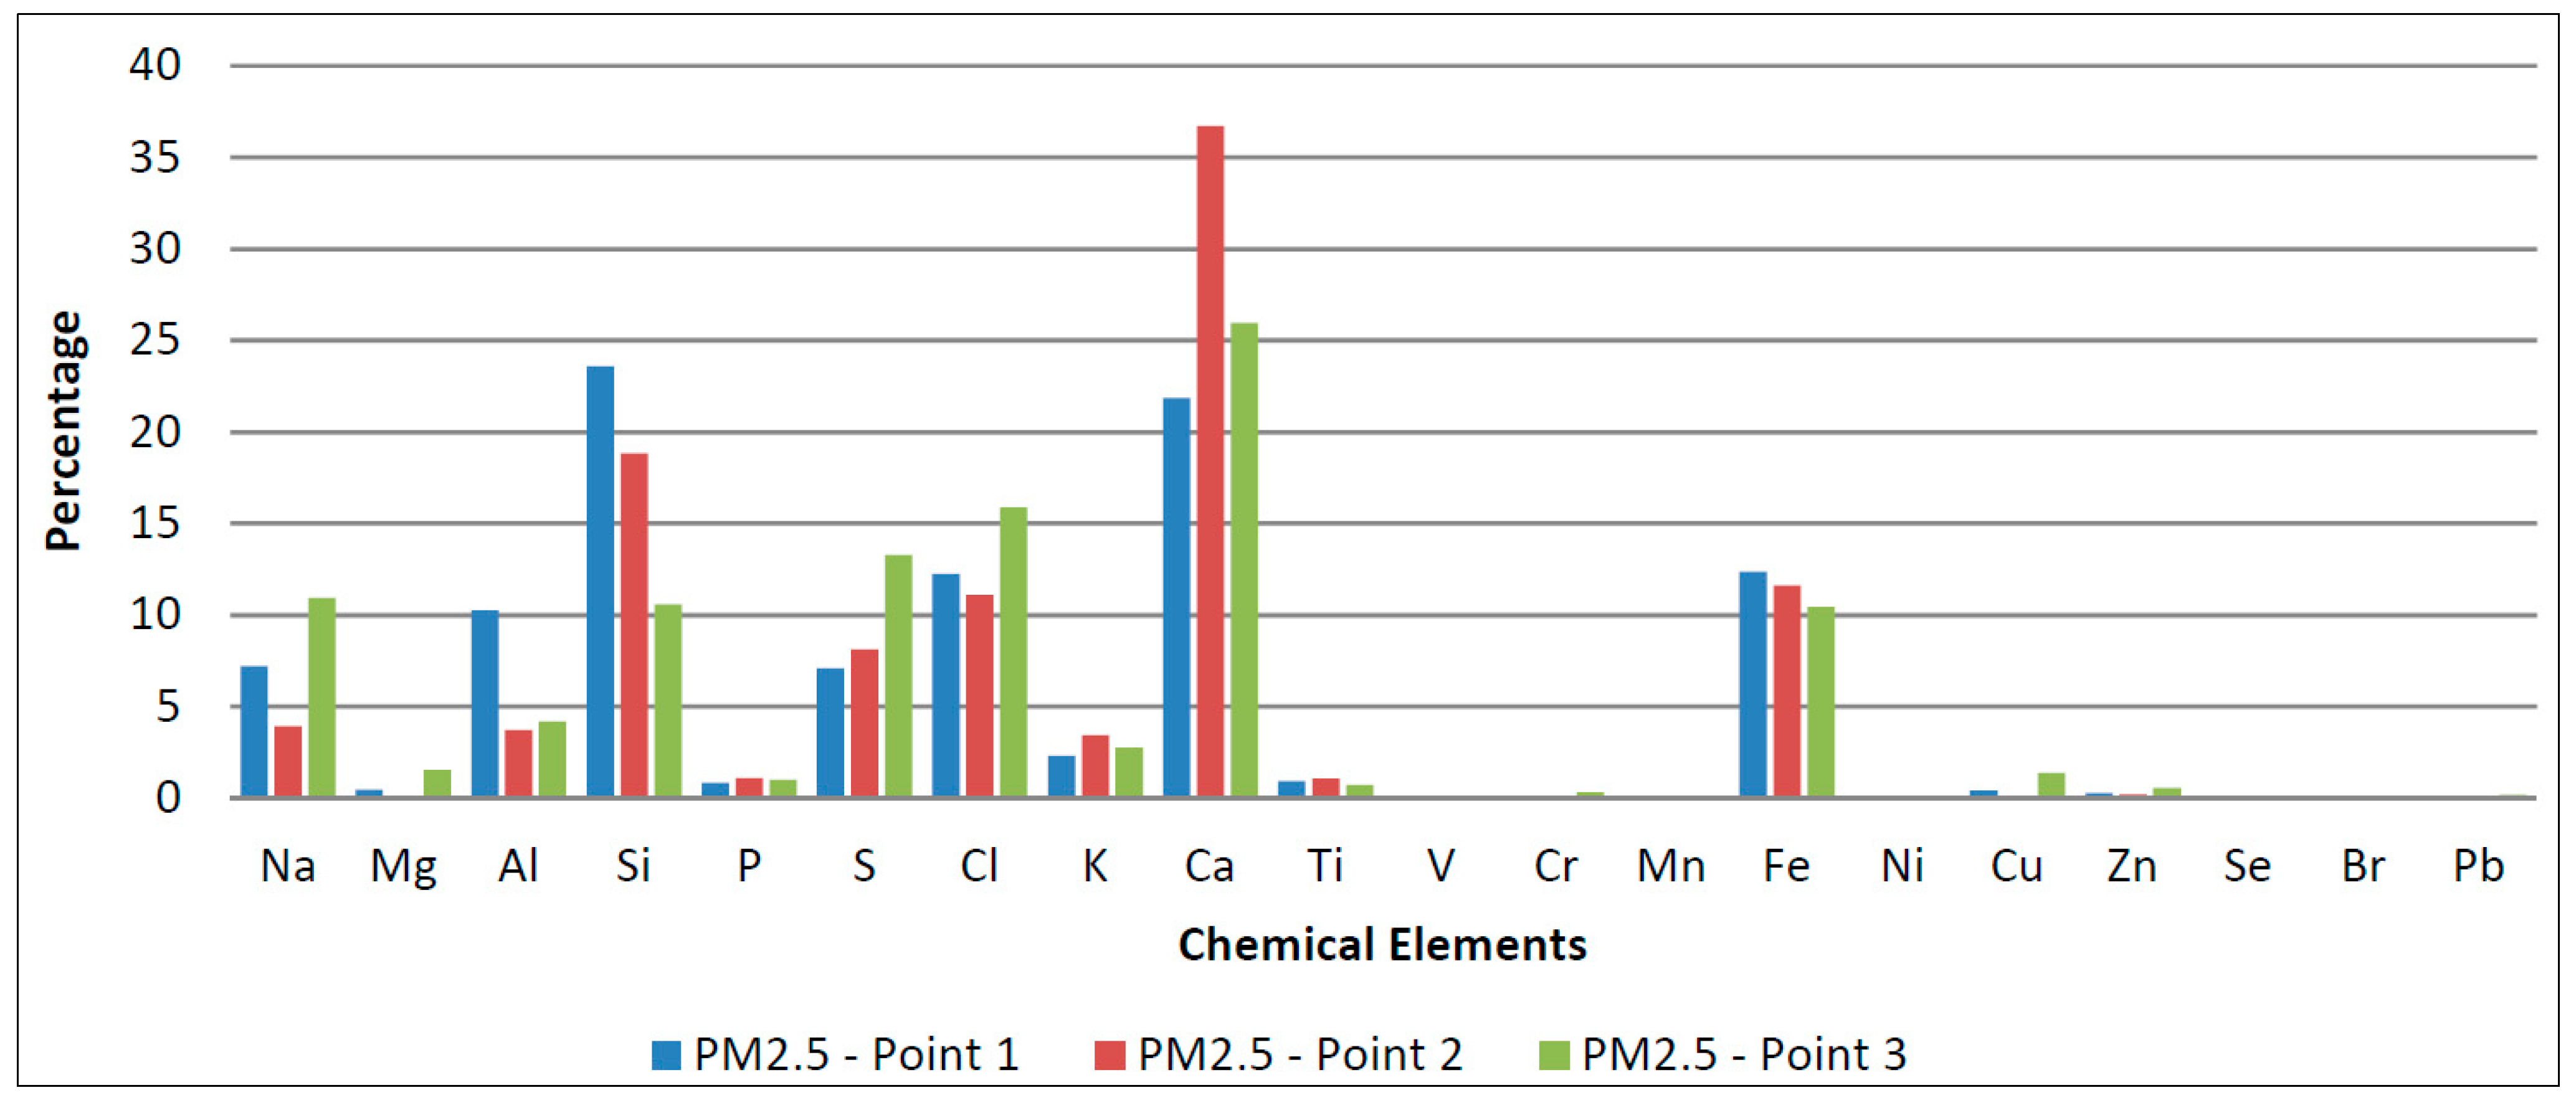
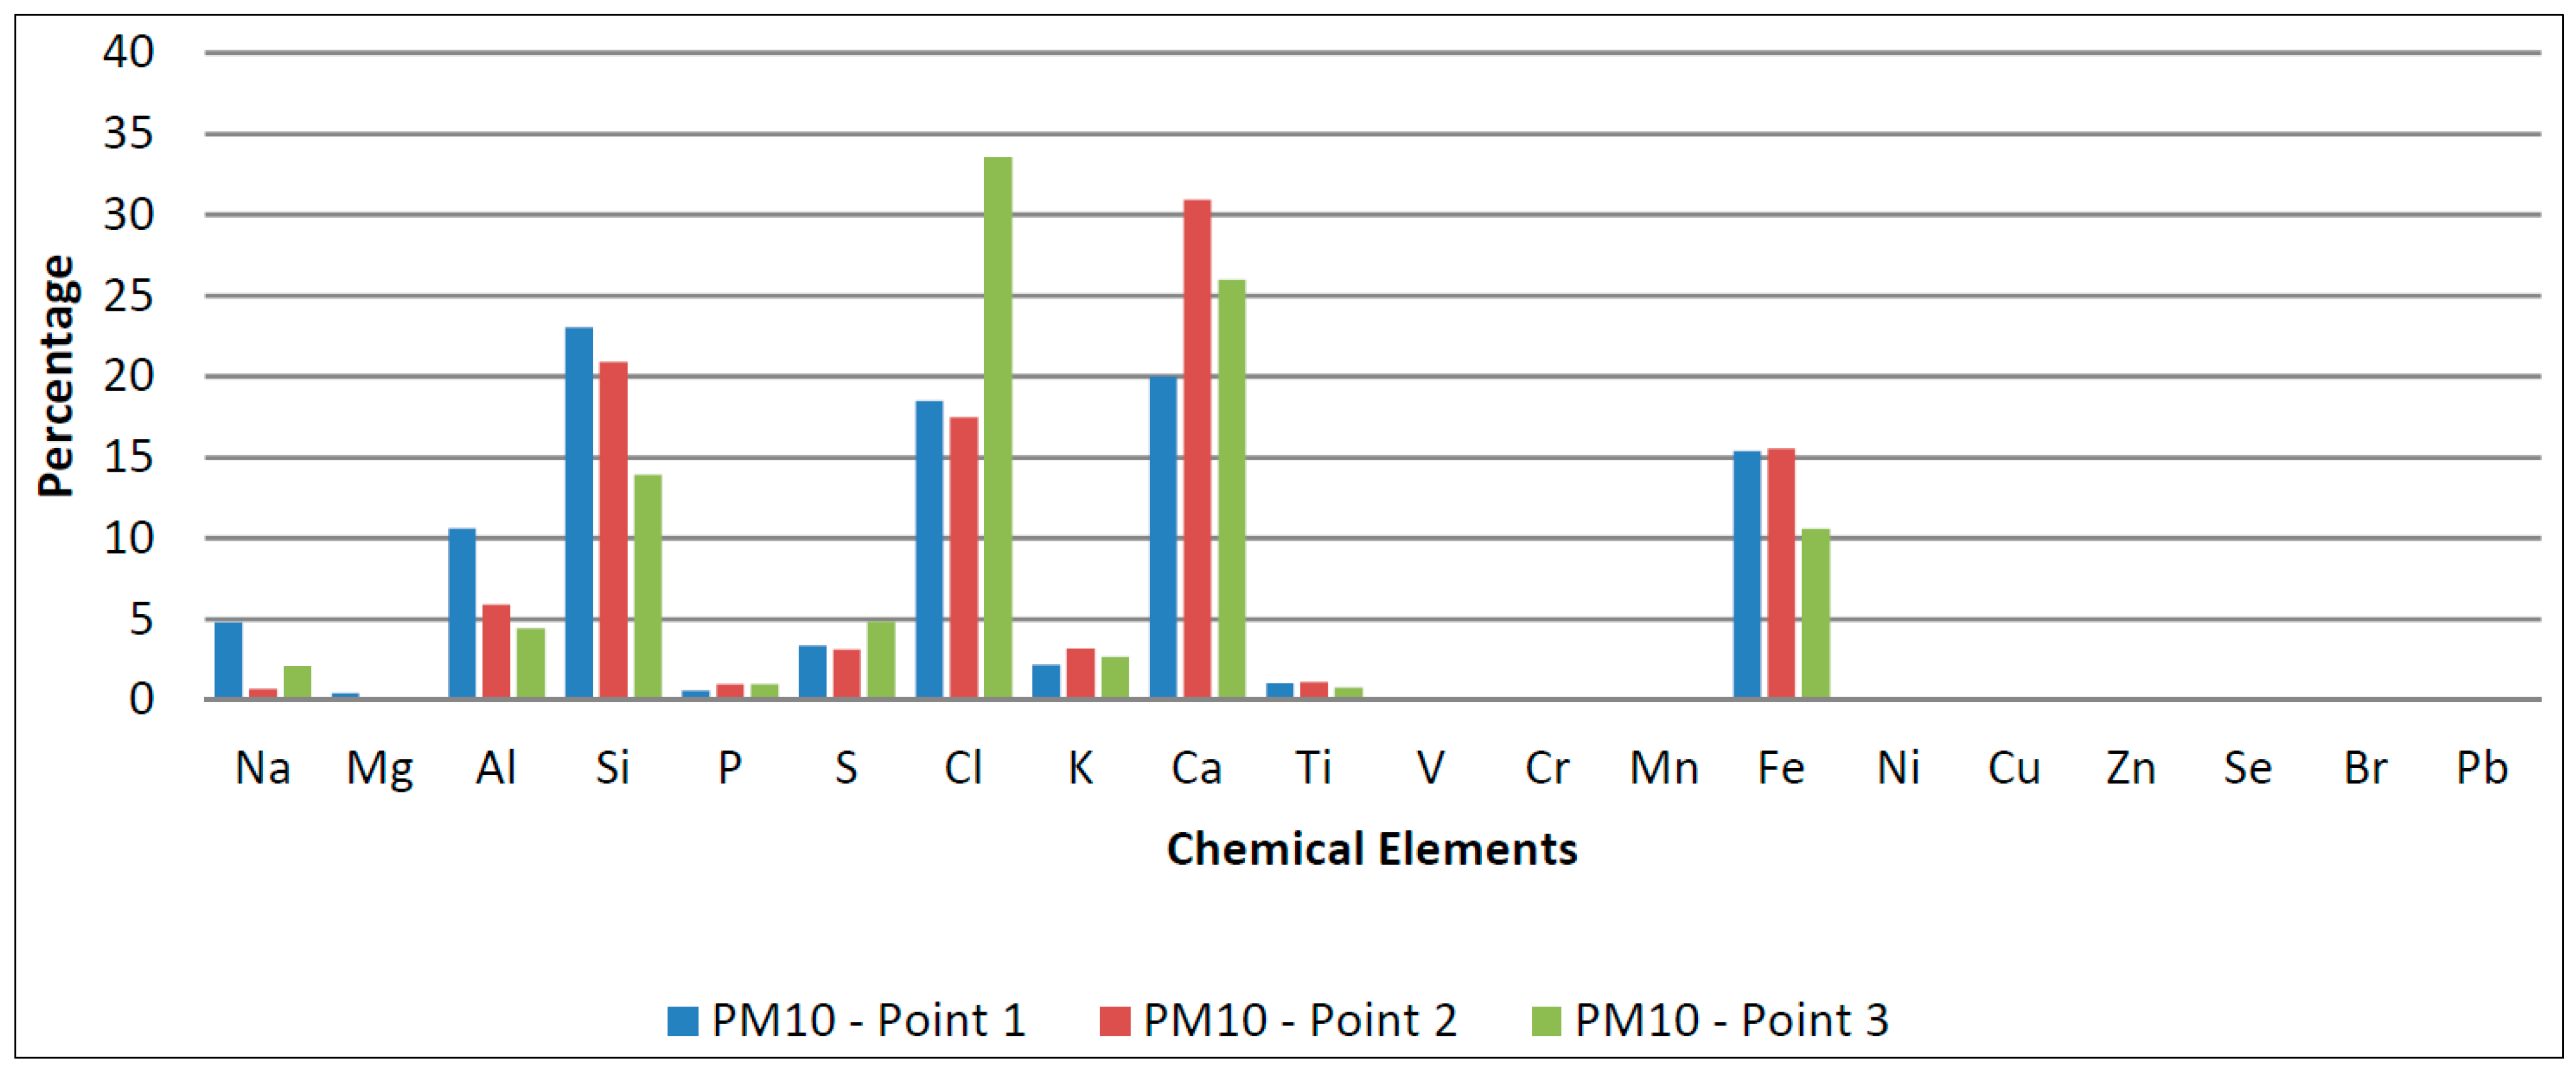
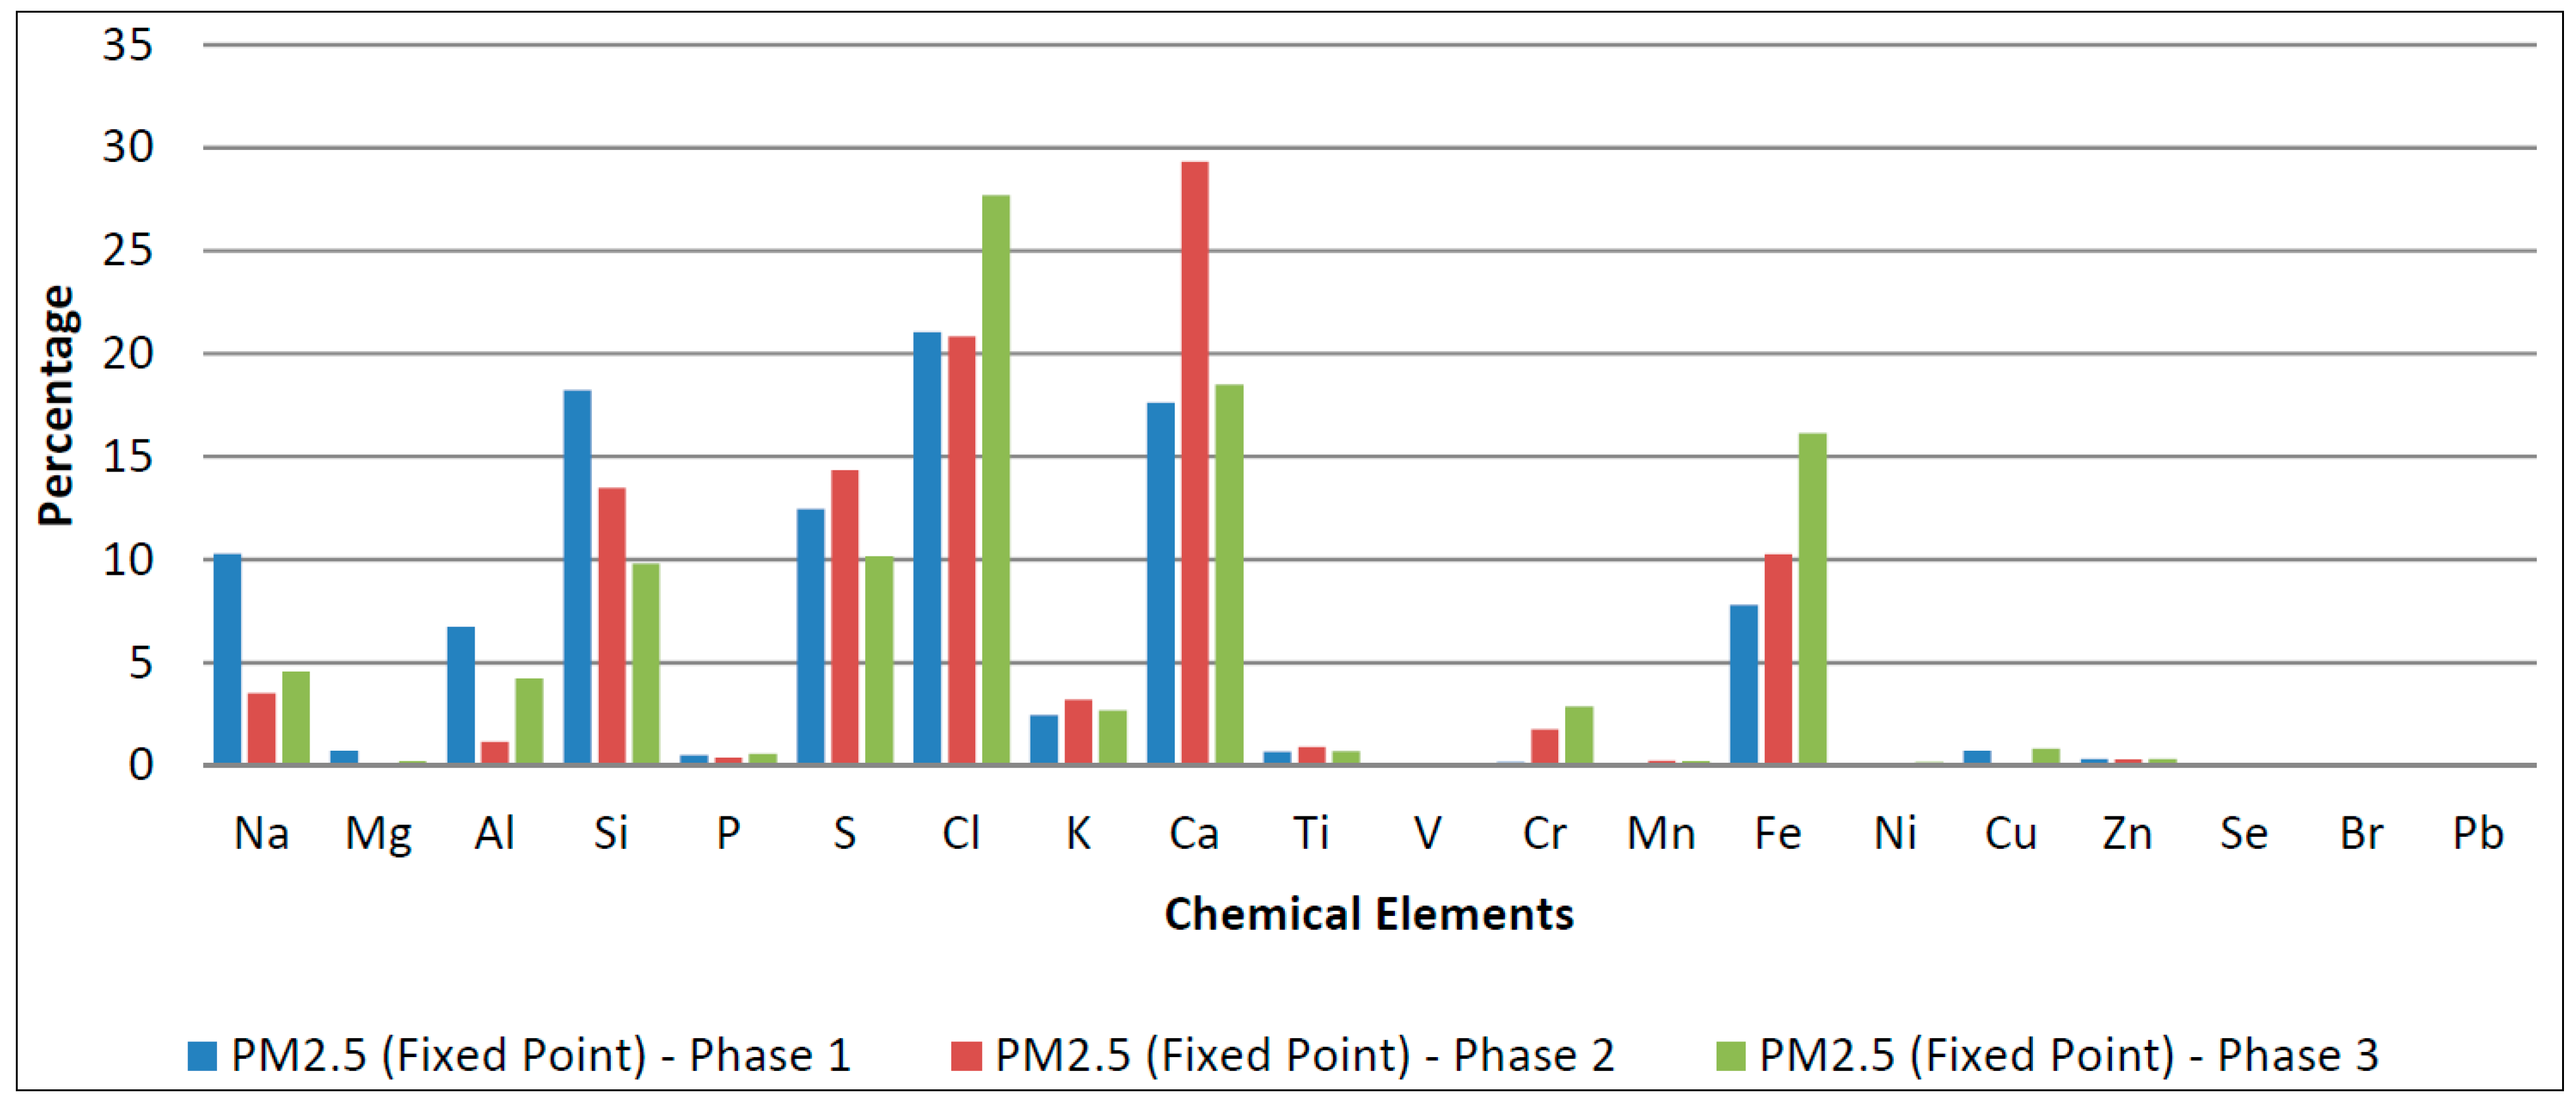
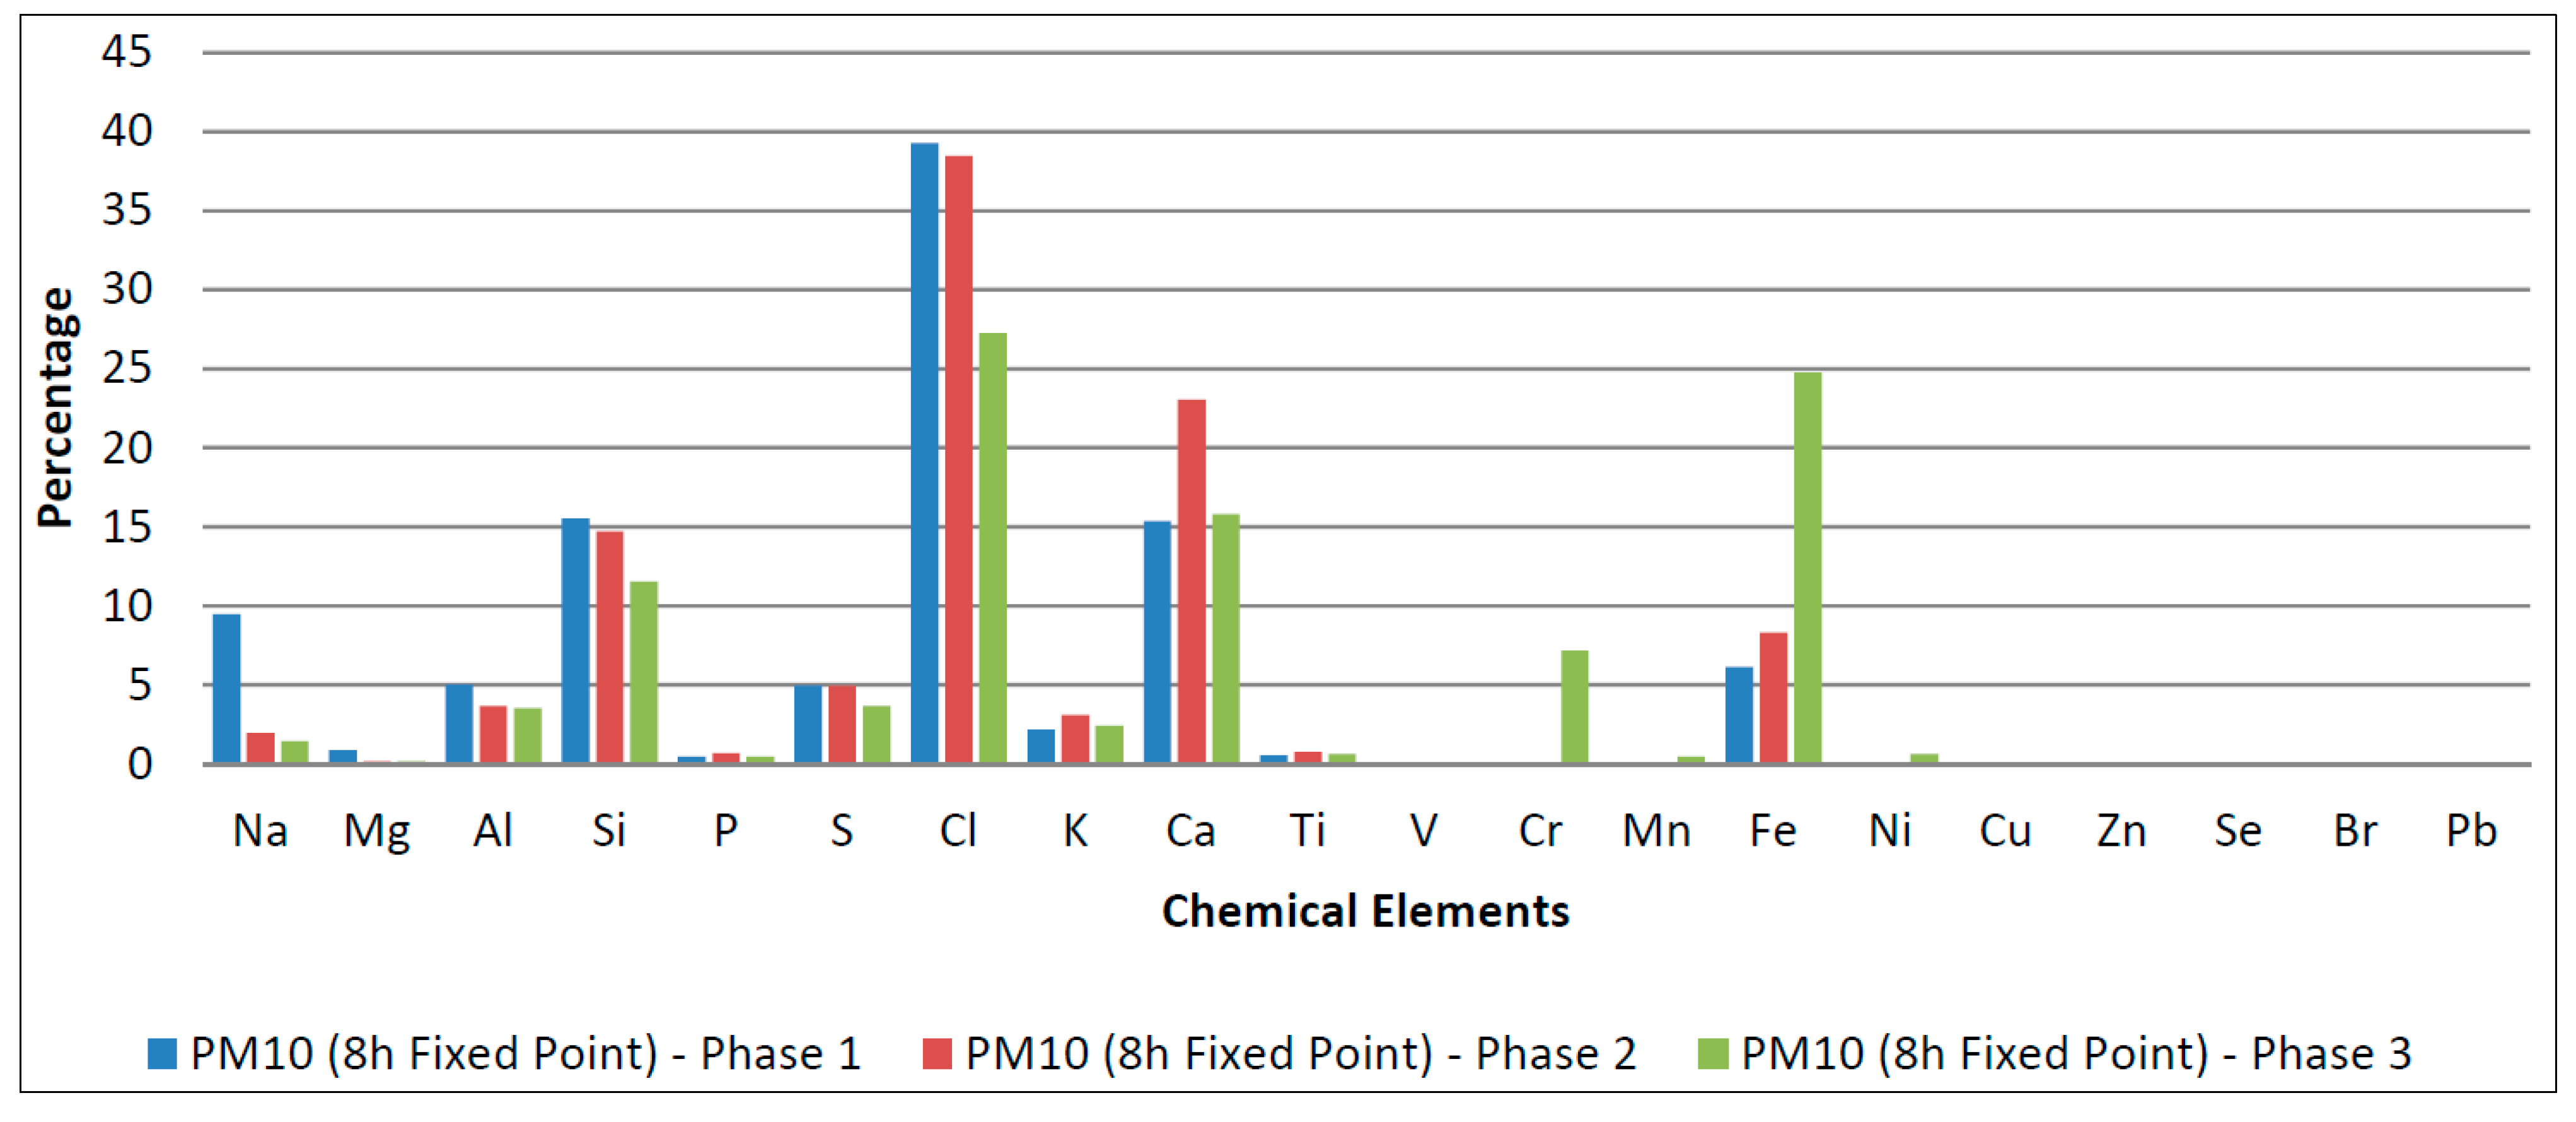
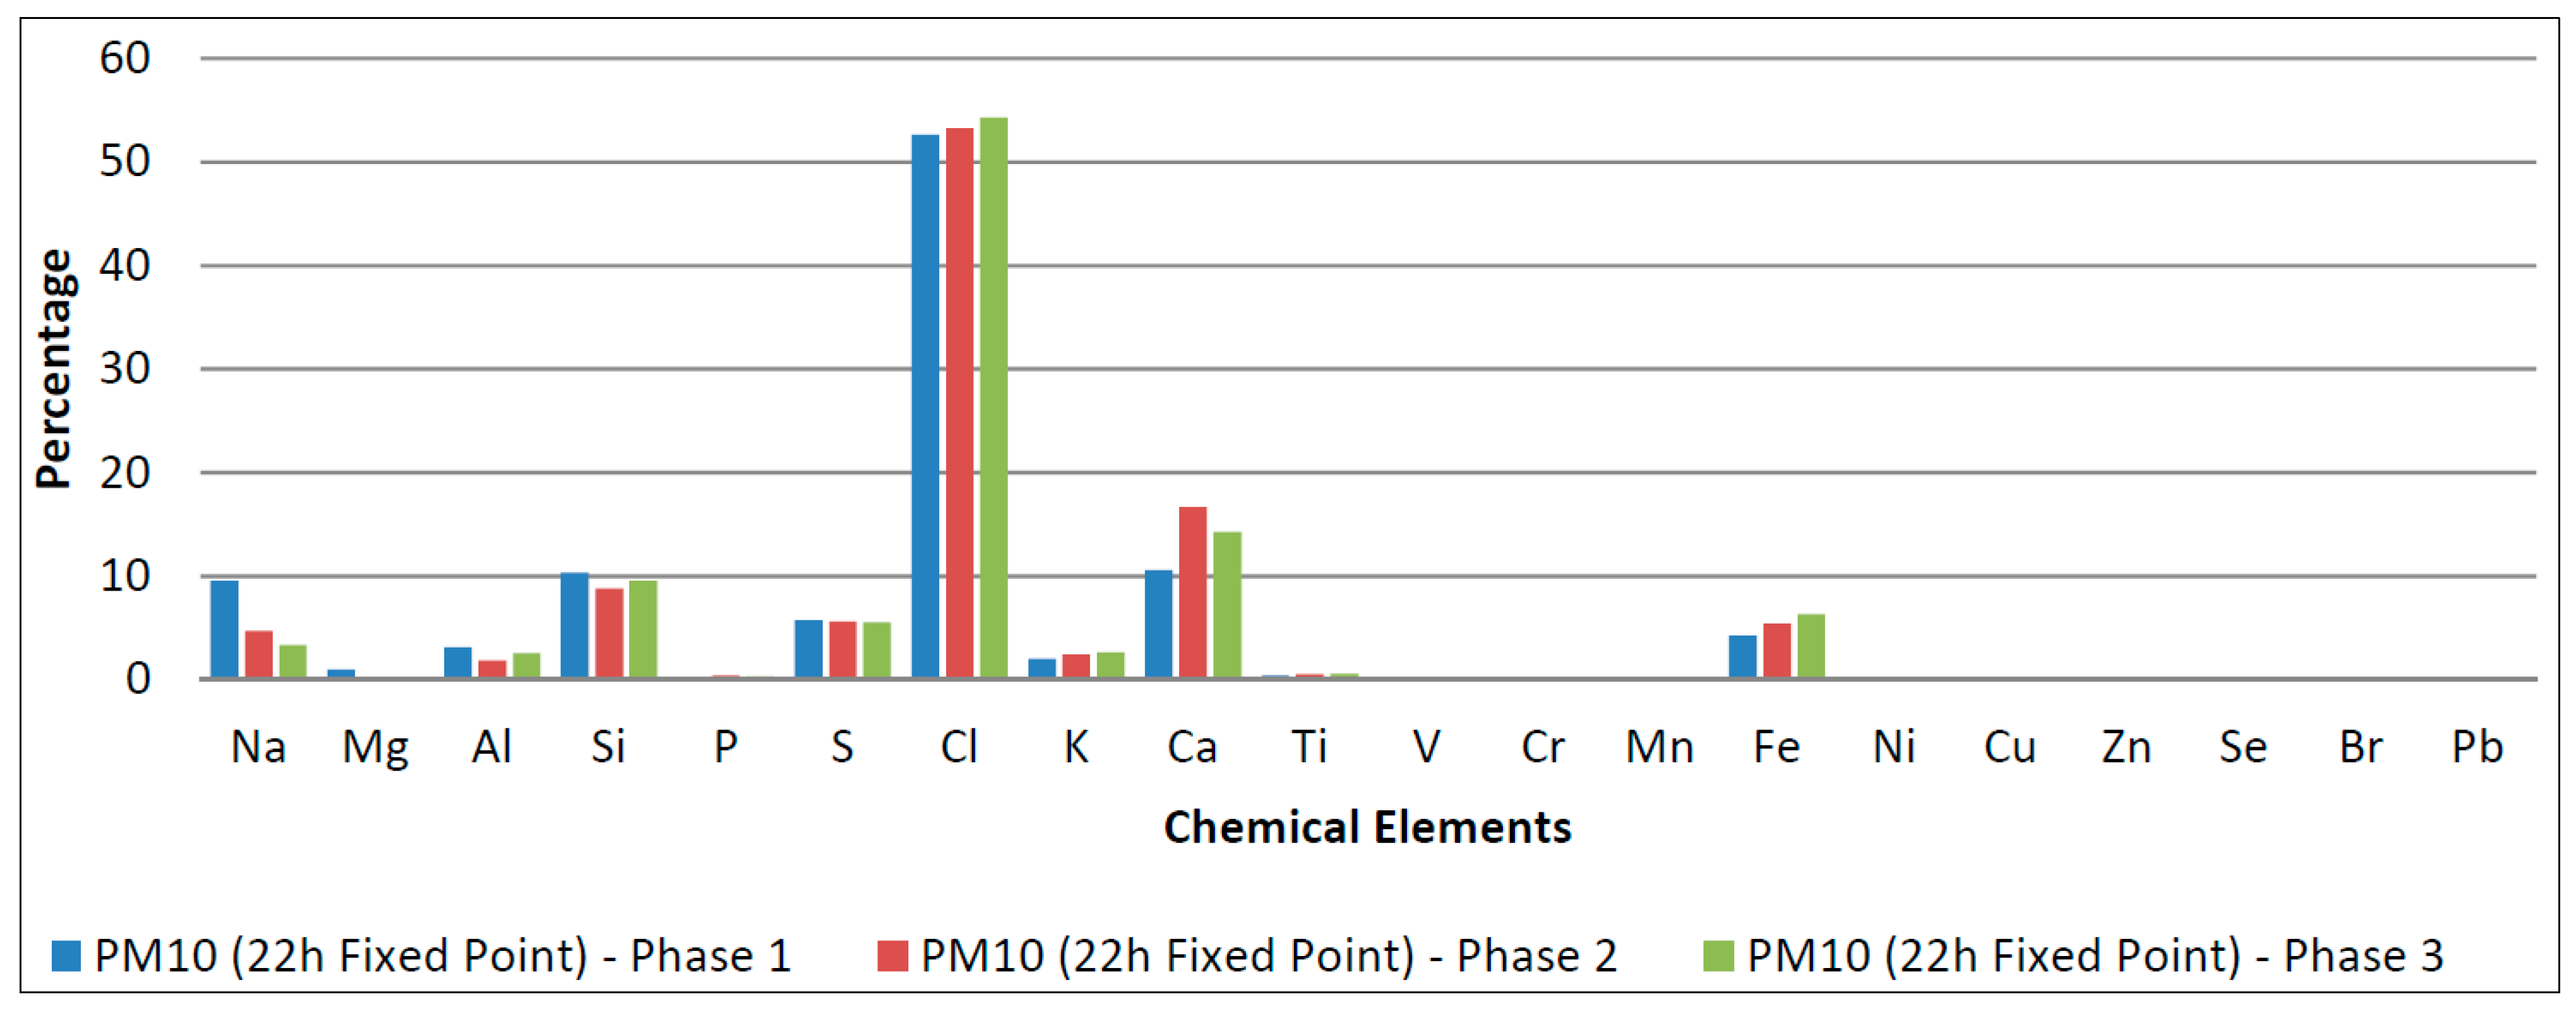
4.2. Chemical Characterization of Points 1, 2, 3 and the Fixed Point

From the chemical analysis, a similar behavior was observed between the phases that can be better visualized in Figure 6, Figure 7, Figure 8, Figure 9 and Figure 10. It was not possible to identify the specific activity that emitted these PM, due to the fact that the activities on the construction work site (earthmoving, reinforcing concrete, lifting of masonry, plastering, among others) were being conducted at the same time as the measurement period. In addition, these activities used materials with similar chemical profiles.
Figure 6. PM2.5, percentage of chemical elements (Points 1, 2 and 3).
Sustainability 06 07666 g006
Figure 7. PM10, percentage of chemical elements (Points 1, 2 and 3).
Sustainability 06 07666 g007
Figure 8. PM2.5, percentage of chemical elements (fixed point).
Sustainability 06 07666 g008
Figure 9. PM10 (8 h), percentage of chemical elements (fixed point).
Sustainability 06 07666 g009
Figure 10. PM10 (22 h), percentage of chemical elements (fixed point).
Sustainability 06 07666 g010
At Points 1, 2 and 3, the presence of the same elements was observed, independent of the measurement phase, and the more expressive presence of the elements Ca, Si, Cl, Al and Fe in proportions that follow similar performances (Figure 6 and Figure 7). Sometimes, there is the presence of a few peaks in relation to other phases, such as Ca, that for PM2.5 presented a concentration of 22% at Point 1, 37% at Point 2 and 26% at Point 3. For PM10, a Ca concentration of 20% was observed at Point 1, 31% at Point 2 and 26% at Point 3.
The chemical data of PM2.5 and PM10 of the fixed point was not different between Points 1, 2 and 3 in which the presence of the same elements was observed, independent of the measurement phase, with a more expressive presence of the elements Ca, Si, Cl, Al and Fe (Figure 8 and Figure 9).
Concerning the chemical data of the PM10 (8 h) and the PM10 (22 h) of the fixed point, again, there were no significant differences, taking into account the presence of the same elements independent of the measurement phase and the more expressive presence of the elements Cl, Ca, Si, Al, Fe and Na. Comparing the graphics of Figure 9 and Figure 10, an enrichment of the elements Cl and Na during the night period (PM10–22 h measurement) was observed, as had been predicted, which can be directly associated with the marine aerosol.

4.3. Sedimentation Rate

The sticky pad results showed that the neighborhood is susceptible to emissions from the construction activities or neighborhood activities at its worst level, since the results presented “serious complaints” in all collections, except at Phase 3 for the measurements of 50 m, which presented probable complaints (see Table 9). However, there is no guarantee that all PM adhered on the stickers had come from the construction activity, since they could receive some contributions from surrounding neighboring areas.
Table 9. Sticky pad reading response.
Meters/PhaseReference area readingInstrument readingEAC%EAC/dayResponse
Phase 1
58767206.67Serious complaints
108769186.00Serious complaints
209074165.33Serious complaints
509175165.33Serious complaints
1009379144.67Serious complaints
Phase 2
59275175.68Serious complaints
109676206.67Serious complaints
209276165.33Serious complaints
508774134.33Serious complaints
1009380134.33Serious complaints
Phase 3
58472124.00Serious complaints
1089593010.00Serious complaints
209080103.,33Serious complaints
50918562.00Probable complaints
1009280124.00Serious complaints

4.4. Discussion

Based on the analysis of the collected data in three phases using the proposed methodology, the need for adjustments in some of the methodological procedures adopted was observed in order to obtain satisfactory data according to the reality of the construction site.
In order to evaluate and validate the findings collected during the study, some meetings were carried out with two specialists (Rosana Astolfo, laboratory specialist and MSc in Geosciences of the Astronomy, Geophysics and Atmospheric Sciences Institute, University of São Paulo and Jesuino Romano, manager of the Division of Technology Assessment of Air Quality, Company of Technology Environmental Sanitation) in air quality from the environmental agencies and universities, based on their experience in the assessment of the air quality of vehicle emissions, industry emissions, re-suspension and public health.
The advantages and disadvantages of the typology of the construction site selected for the study was an important topic discussed. As already mentioned, the project studied is characterized by its large and complex construction site, in which several construction activities occurred at the same time and over the entire measurement period of the study. It is important to highlight that this construction site was chosen initially because it was possible to validate the methodology in the three different construction phases over a short time period. However, because the construction site has overlapping phases, it was not possible to identify the contribution of each specific construction phase. The suggestion is the installation of MiniVols on smaller construction jobsite areas in order to better control the measurement process and identify if there are specific contributions of PM due to different construction phases.
Regarding the chemical analysis, the X-ray fluorescence (XRF) analysis technique was used in this study, which provides only chemical elements. The results show that the chemical profile of the PM collected was similar among them, since it showed almost the same chemical elements. Therefore, it was not possible to specify the percentage contribution of each construction phase in the PM in this study. However, other techniques can be used in such studies, such as X-ray diffraction, which provides the chemical compounds. In this research, X-ray diffraction analysis was not used, because the size of the filter does not allow the collection of sufficient material for such analysis.
The measurement of sedimentation rates performed with the sticky pads provided insufficient data for evaluating the impact on the neighborhood, because the PM captured on the stickers came from the construction activities and the surrounding neighboring areas, instead of only the construction site. However, the sticky pad can be tested within the construction jobsite in order to collect the PM emissions from the construction activities, as an alternative and fast method to understand the level of response in terms of PM emission.

5. Conclusions

This work contributes with a methodology to evaluate the emission of particulate matter on construction jobsites from an environmental perspective, taking into consideration different construction phases, despite the limitation pointed out within the paper. This methodology allows for quantifying and characterizing the PM and also enables further intervention through mitigation measures in order to reduce the pollution.
However, corroborating Castelanni [37], particulate emission monitoring is a challenging technical field, not only because of the specific accuracy and performance of particulate monitors, but also due to the harsh environment in which they must continuously operate. Specifically, in the construction industry, the challenge is increased by the complexity and unique characteristics of each construction product and production process. The amount of variables include different construction activities, as well as on-road vehicles associated with the construction site and on machinery, which occurs simultaneously during the whole day without a visible pattern, influencing the emission of PM from different sources. The emission of the PM will also depend on the technology and management control methods used by each project. Finally, the weather condition variables influence the emission concentration of PM.
The paper also shows that the literature about particulate matter from an environmental perspective on construction jobsites is still scarce, so there is much knowledge yet to be explored on this subject. Furthermore, there is a need for more quantitative data concerning the PM emissions in the construction industry, similar to the effort to quantify and establish parameters for construction and demolition wastes over the last decade. There is a need for better understanding about the type, size and concentration of these particles in different construction phases, as well as the impact of this on the neighborhood and construction workers.
The findings show that the activities on construction sites emit different types of particles with environmental impacts through a higher emission of TSP. The concentration values obtained for PM10 22 h in this study did not exceed the limits set by the Brazilian standards established by CONAMA Resolution Number 03; however, some of the level of concentration measured exceeded the standards set by the World Health Organization that represent an increase in short-term mortality.
What is more, this work shows the importance of monitoring the weather condition parameters, such as temperature, humidity and wind direction, in order to gain a better understanding of the behavior of the air pollution. The air quality depends on the quantity of the particulate matters emissions, but also the way in which the atmosphere reacts to their concentration or dispersion. However, due to the exploratory nature of this study, focusing on finding the most suitable methodology for determining PM concentrations around construction sites, and the limited amount of information on the measured concentration, it was not possible to correlate weather condition variables to PM concentration.
In addition, the findings show that Point 2, which was mostly influenced by the superstructure construction activities, was the most environmentally impacted by the PM concentration. However, due to the size and the complexity of the construction site studied, mainly the overlapping of the construction activities during the entire period of the study, there is a need for better investigation concerning the influence of different construction phases on PM emission.
The methodology and results of this research can provide starting points for further studies aimed at measuring particulate matter emissions on construction sites. Some recommendations for future research are:
(1)
to develop studies on construction sites to support specific parameters of air quality for the building,
(2)
to develop specific studies for each phase of construction, such as earthwork, superstructure and finishing,
(3)
to develop specific studies to correlate weather condition variables with PM concentration and
(4)
to develop and implement studies to evaluate technological and management solutions for the reduction of PM emissions from construction sites.

Acknowledgments

We are grateful to the Cantechis Project (Technologies for Sustainable Construction on Social Housing Jobsites), Ministry of Science, Technology and Innovation, trough FINEP (Financiadora de Estudos e Projetos) and CNPq (Conselho Nacional de Desenvolvimento Científico e Tecnológico) and the Ministry of Education, CAPES (Coordenação de Aperfeiçoamento de Pessoal de Nível Superior), for the financial support and to LAPAT (Laboratório de Análise dos Processos Atmosféricos)/IAG (Instituto de Astronomia, Geofísica e Ciências Atmosféricas)/USP (University of São Paulo) and CETESB (Company of Technology Environmental Sanitation) for the technical support.

Author Contributions

Dayana B. Costa, Ingrid P. S. Araújo and Rita J. B. de Moraes conceived and designed the study with the support of the Cantechis Project researchers. Ingrid P. S. Araújo performed the data collection and analysis with the support of Rita J. B. de Moraes. Ingrid P. S. Araújo wrote the Portuguese version of the manuscript with the support of Rita J. B. de Moraes. Dayana B. Costa provided academic advice throughout the process, wrote the English version and revised the manuscript.

Conflicts of Interest

The authors declare no conflict of interest.

References

  1. Levin, H. Systematic Evaluation and Assessment of Building Environmental Performance (SEABEP). In Proceedings of the Second International Conference of Buildings and Environment Performance, Paris, France, 28–29 November 1997; pp. 9–12.
  2. Cho, Y.K.; Alaskar, S.; Bode, T.A. BIM—Integrated sustainable material and renewable energy simulation. In Construction Research Congress 2010. Innovation for Reshaping Construction Practice; Ruwanpura, J., Mohamed, Y., Lee, S., Eds.; American Society of Civil Engineers: Banff Alberta, AL, Canada, 2010; pp. 288–297. [Google Scholar]
  3. Tah, J.H.M.; Abanda, H.F. Sustainable building technology knowledge representation: Using Semantic Web techniques. Adv. Eng. Inf. 2011, 25, 547–558. [Google Scholar] [CrossRef]
  4. Cohen, A.J.; Anderson, H.R.; Ostro, B.; Pandey, K.D.; Krzyzanowski, M.; Künzli, N.; Gutschmidt, K.; Pope, A.; Romieu, I.; Samet, J.M.; et al. The global burden of disease due to outdoor air pollution. J. Toxicol. Environ. Health A 2005, 68, 1301–1307. [Google Scholar]
  5. Councils London. Guidance Note Construction Sites–MODULE 3; Local Government: Air Quality Toolkit, London, UK, 2010.
  6. Resende, F. Atmospheric Pollution Emission of Particulate Matter: Evaluation and Control at Construction Sites of Buildings. Master’s Dissertation, University of São Paulo, São Paulo, Brazil, 2007; p. 232. [Google Scholar]
  7. Councils London. The Control of Dust and Emissions from Construction and Demolition—Best Practice Guidance; Councils London: London, UK, 2006. [Google Scholar]
  8. Amor, R. The development of sustainable: Construction planning system. J. Inf. Technol. Constr. 2012, 17, 1874–4753. [Google Scholar]
  9. Greenspan, C.A.; Moure-Eraso, R.; Wegman, D.H.; Oliver, C. Occupational hygiene characterization of a highway construction project: A pilot study. Appl. Occup. Environ. Hyg. 1995, 10, 50–58. [Google Scholar] [CrossRef]
  10. Blute, N.A.; Woskie, S.R.; Greenspan, C.A. Exposure Characterization for Highway Construction Part I: Cut and Cover and Tunnel Finish Stages. Appl. Occup. Environ. Hyg. 1999, 14, 632–641. [Google Scholar] [CrossRef]
  11. Kjell, T.; Bergdahl, I.A.; Nilsson, T.; Järvholm, B. Occupational exposure to particulate air pollution and mortality due to ischaemic heart disease and cerebrovascular disease. Occup. Environ. Med. 2007, 64, 515–519. [Google Scholar] [CrossRef] [PubMed]
  12. Maioli, B.G. Quantification and Characterization of Fine Particulate Matter (PM2.5) in the Metropolitan Region of Vitória, ES. Master’s Thesis, Technology Center, Federal University of Espírito Santo, Vitória, Brazil, 2011; p. 118. [Google Scholar]
  13. Daly, A.; Zannetti, P. An Introduction to Air Pollution—Definitions, Classifications, and History. Chapter 1 of Ambient Air Pollution; Zannetti, P., Al-Ajmi, D., Al-Rashied, S., Eds.; The Arab School for Science and Technology (ASST), The Enviro Comp Institute: Freemont, CA, USA, 2007. [Google Scholar]
  14. Schwartz, J.; Zanobetti, A.; Bateson, T.F. Mortality and Morbidity among Eldery Residents of Cities with Daily PM Measurements. In Revised Analyses of Time-Series Studies of Air Pollution and Health Boston; Health Effects Institute: Boston, MA, USA, 2003; pp. 25–58. [Google Scholar]
  15. Peters, A.; Pope, C.A., III. Cardiopulmonary mortality and air pollution. Lancet 2002, 360, 1184–1185. [Google Scholar] [CrossRef] [PubMed]
  16. Gualtieri, M.; Mantecca, P.; Corvaja, V.; Longhin, E.; Perrone, M.G.; Bolzacchini, E.; Camatini, M. Winter fine particulate matter from milan induces morphological and functional alterations in human pulmonary epithelial cells (A549). Toxicol. Lett. 2009, 188, 52–62. [Google Scholar] [CrossRef] [PubMed]
  17. USEPA-United States Environmental Protection Agency. Air Quality Criteria for Particulate Matter; EPA/600/P-99/002aF; USEPA-United States Environmental Protection Agency: Washington, DC, USA, 2004; p. 900. [Google Scholar]
  18. Environment Agency. Monitoring of Particulate Matter in Ambient Air around Waste Facilities; Technical Guidance Document (Monitoring), M17; Environment Agency: Rotherham, UK, 2004. Available online: http: //www.environment-agency.gov.uk (accessed on 8 May 2013).
  19. Milford, J.B.; Davidson, C.I. The size of particulate trace elements in the atmosphere. Rev. J. Air Pollut. Control Assoc. 1985. [Google Scholar] [CrossRef]
  20. Kelly, F.J.; Fussell, J.C. Size source and chemical composition as determinants of toxicity attributable to ambient particulate matter. Atmos. Environ. 2012, 60, 504–526. [Google Scholar] [CrossRef]
  21. Seigneur, C. Current status of air quality models for particulate matter. J. Air Waste Manag. Assoc. 2001, 51, 1508–1521. [Google Scholar] [CrossRef] [PubMed]
  22. Sielicki, P.; Janik, H.; Guzman, A.; Namieśnik, J. The progress in electron microscopy studies of particulate matters to be used as a standard monitoring method for air dust pollution. Crit. Rev. Anal. Chem. 2011. [Google Scholar] [CrossRef]
  23. CETESB—Company of Technology Environmental Sanitation. Report of São Paulo Air Quality. Available online: http://www.cetesb.sp.gov.br/Air/air_health.asp (accessed on 8 May 2013).
  24. CONAMA—National Environment Council. CONAMA Resolution Number 3. Available online: http://www.mma.conama.gov.br/conama (accessed on 8 May 2013).
  25. WHO–World Health Organization. Air quality guidelines for particulate matter, ozone, nitrogen dioxide. In Global Update 2005,Summary of Risk Assessment; WHO–World Health Organization: Geneva, The Swiss, 2006. [Google Scholar]
  26. Lee, S. Fine particulate matter measurement and international standardization for air quality and emissions from stationary sources. Fuel V. 2010, 89, 874–882. [Google Scholar] [CrossRef]
  27. USEPA—United States Environmental Protection Agency. Particulate Matter (PM) Standards—Review Completed in 2006. Available online: http://www.epa.gov/ttn/naaqs/standards/pm/s_pm_cr.html (accessed on 8 May 2013).
  28. European Parliament; Council of the European Union. Directive 2008/50/EC of the European Parliament and the Council of 21 May 2008 on Ambient Air Quality and Cleaner Air for Europe. Available online: http://eur-lex.europa.eu/LexUriServ/LexUriServ.do?uri=OJ:L:2008:152:0001:0044:EN:PDF (accessed on 10 August 2014).
  29. Croes, B.; Schneider, J.; Hedley, A. Air quality management approaches and evidence of effectiveness. In NERAM Guidance Document on Air Quality Risk Management; Network for Environmental Risk Assessment & Management: Waterloo, ON, Canada, 2007; pp. 99–154. [Google Scholar]
  30. US Department of the Interior, Bureau of Land Management. BLM Socorro Field Office RMPR/EIS 33 Air Quality Impact Analysis; US Department of the Interior, Bureau of Land Management: Washington, DC, USA, 2003.
  31. Airmetrics. Minivol Operation Manual; Airmetrics: Eugene, OR, USA, 2011. Available online: http://www.airmetrics.com (accessed on 20 April 2014).
  32. Walliman, N. Research Methods: The Basics; Routledge: New York, NY, USA, 2011. [Google Scholar]
  33. Dawson, C. Introduction to Research Methods: A Practical Guide for Anyone Undertaking a Research Project Paperback; How To Books Ltd.: Oxford, UK, 2009. [Google Scholar]
  34. Resende, F.; Cardoso, F.F.; Costa, D.B.; Melo, A.; Araújo, I.P.S.; Moraes, R.J.B.; Porfiro, A. Methodology for Measuring the Concentration of Particulate Material in Construction Sites. In Proceedings of the SIBRAGEC 2013—8th Brazilian Symposium of Construction Management and Economics, Innovation and Sustainability, Brazilian Association of the Built Environment Technology (ANTAC). Salvador, Brazil, 18–20 November 2013.
  35. Hanby, I. Calibration & Use of the Sticky Pad Reader Guidelines for Use of the Sticky Pad Reader. Available online: http://www.hanby.co.uk/CAL%20&%20USE%20SPR.htm (accessed on 29 September 2014).
  36. Huler, S. Defining the Wind: The Beaufort Scale, and How a 19th-Century Admiral Turned Science into Poetry; Three Rivers Press, Crown Publishing Group: New York, NY, USA, 2004. [Google Scholar]
  37. Castelanni, B.; Morini, E.; Filipponi, M.; Nicolini, A.; Palombo, M.; Cotana, F.; Rossi, F. Comparative analysis of monitoring devices for particulate content in exhaust gases. Sustainability 2014, 6, 4287–4307. [Google Scholar] [CrossRef]

