1. Introduction
The Indoor Environment Quality (IEQ) and the Comfort level to be guaranteed to building occupants, become essential factors to take in account when developing an efficient building design. This importance is testified both by the development of experimental sustainability assessment methods such as the SBTool [
1], which, among others categories does take in account building occupant’s global comfort, by the design standards now available, such as EN 15251 [
2], or by the reward value that environmental certification protocols, such as LEED (Leadership in Energy and Environmental Design), BREEAM (Building Research Establishment Environmental Assessment Methodology), ITACA (Innovazione e Trasparenza degli Appalti e Compatibilità Ambientale) and others, assign to a design exercise that takes into account these factors. It must be highlighted that in recent years the building industry has been giving a priority track to energy saving technologies, both through the development of technological systems with high energy efficiency [
3], and promoting the issue of fit for purpose national regulations/standards [
4]; less attention was devoted to IEQ improvement and associated monitoring procedures. This has been reflected also in recent versions of environmental certification protocols like LEED v2009, as Watson [
5] reported and as Altomonte
et al. [
6] analyzed in particular with respect to IEQ satisfaction by the users.
This is most probably linked to the fact that investments that generate energy savings can be more easily justified from the financial point of view and can be more easily implemented in a design strategy with respect to improvement in IEQ, where uniformly accepted classification and monitoring procedure are yet not established. Among others, Watson, in a more recent analysis [
7], was reporting an average increase of 5% in the productivity of the personnel inside US commercial buildings LEED certified where IEQ was improved, while Wargocki
et al. [
8], among many other different studies, correlate the poor internal air quality with the Sick Building Syndrome (SBS) and decrease of productivity.
Even if the correlation between the IEQ and the occupants’ productivity is still an argument of discussion, establishing procedures and effective methods of evaluation of the IEQ is in any case an attractive field of research that is investigated in literature with different approaches. Heinzerling
et al. [
9] conducted a literature survey on the different method of evaluation of IEQ, highlighting how the currently available methods can be based on a combination of subjective and objective measures or are based on objective measurements made and compared against a fixed set of criteria that determine what assessment class the measurement falls into. Relevant consideration with respect to the available evaluation criteria are that:
- •
No uniform standards to perform objective measurements are available, both in terms of time and space rendering,
- •
Different IEQ factors weighting schemes and assessment class are proposed,
- •
Inter-category relationships between IEQ factors are not considered,
- •
Assessment scales considered are variable.
The diversity of the issues involved in the considerations above encourages the development of research programs that can give a contribution in defining standards procedure for the assessment and monitoring of IEQ in the build environment. The final aim of such research should be to define procedures that can join the “energy saving driven” design process with a “global comfort driven” one.
In [
9], different IEQ factors weighting schemes available in literature, related to office spaces, are compared. However, the different models are not compared on the same survey database, neither uniform criteria of evaluation nor acceptance can be associated to the different methods. Scope of this preliminary case study is to set the procedures for a comparative study between different IEQ factors weighting methods, based on a single survey database.
In accordance with the approach used by most of the environmental certification protocols, the method shall be defined for a specific building type (residential, commercial, etc.). For the development of this study, a specific building category is considered, i.e., university training spaces. The selected type of environment provides a larger sample of simultaneous users per sqm, allowing, when considering user surveys in a single space, to collect more reliable observation from the statistical point of view.
2. IEQ Factors Evaluation: Objective and Subjective Method
The number of factors considered when assessing IEQ is variable. Common practice in standard engineering studies is to take in account four parameters, i.e., the thermal, acoustical, visual comfort, and the air quality.
Some studies, such as [
10,
11,
12], take into account many additional parameters, related to ergonomics and overall internal environment (available space, privacy, furniture, finishing, cleanness,
etc.) or other social/psychological/cultural factors, which certainly do have effects on the global comfort assessment by the users but are not part of the scope of work of this study.
The evaluation of comfort level in a building with respect to the four factors considered in this study, can be achieved through objective or subjective measurements:
An objective measurement consists in the collection of physical values for one or more parameters associated to each single IEQ factor (globe temperature, air speed, air temperature, humidity for thermal comfort, illuminance for visual comfort, concentration of CO2, CO and PMtot for air quality, weighted A equivalent continuous noise level for acoustical comfort, etc.). Such measurements can be taken with variable space and time rendering, depending on the aim of the study.
A subjective measurement is a survey performed through questionnaires where the assessment of different factors and overall satisfaction level is obtained directly through the opinion of the users. As for the objective measurements, time variable and user distribution in the building (space variable) are to be considered.
The two type of measurements generate two different main methods in assessing the IEQ:
Subjective-objective method: objective measurements are combined with subjective measurements using experimental models. Such models are based on equation that correlates the number of satisfied occupants with a physical value for each IEQ parameter (the coefficients of such equations are obtained through experimental data fitting). The number of satisfied occupants for each IEQ category is combined (with an experimental weighting scheme) to calculate an overall satisfaction index. Such an index is used to assess the space or building comfort against defined levels. Examples for such methods can be found in [
13,
14,
15,
16,
17].
Objective criteria: objective measurements are compared with a fixed set of values, considering also for how long a value is observed to define in which category the space/building falls in with respect to a single IEQ factor or to the overall IEQ. In such an approach, subjective measurements can be collected (for validation) but are not part of the assessment process. Examples can be found in the method proposed by Marino
et al. in [
18] and similar.
The case study presented in this paper is aimed at comparing different subjective-objective methods, with particular focus on the models used to correlated single IEQ factors with overall occupant satisfaction, using the same sample of users, with simultaneous subjective and objective measurements.
This case study is aimed to set up a method of comparison using a small sample of users, allowing to define the procedures to be implemented in further research on a larger scale. The comparison will address the following aspects:
measurement procedures
statistical significance of the coefficients obtained through data fitting procedures
differences in the weighting schemes obtained with different models
variability of the weighting scheme against the user's time of exposure in the building
The case study is focused on comfort assessment in classroom/training spaces, but useful references are obtained also from studies developed for different type of buildings, such as office spaces; likewise the procedures of comparison used for classrooms, can be applied also for studies of different type of buildings.
3. IEQ Models
Within the development of reliable building comfort assessment methods, this paper is part of a study focused on models available to correlate the different IEQ factor with respect to the global comfort. As observed by Humphreys [
19], it is possibly not the right approach to look for a universal weighting scheme that can describe the contribution that each single IEQ factor provides in determining the global comfort level, while more effective results could be obtained in one to one category comparison. Once specific conditions (climatic, building function, architectural) are set, having a weighting scheme can be useful in prioritizing building improvement interventions, or in continuous monitoring of building performances an additional application could be found checking variation on the weighting scheme during the building life cycle.
The models available in literature to correlate the single IEQ factors with the global comfort are based on algorithms where the single coefficient are obtained through numerical data fitting on subjective measurements database. Depending on the type of function selected to describe the relationship between single IEQ factors and global comfort, different algorithms are applicable.
3.1. Multivariate Linear Regression Algorithm
In case linear dependency is chosen, multivariate linear regression can be used to obtain the coefficient from a database, as in [
20]. In such a model, the correlation between occupant satisfaction on the single IEQ factor and overall satisfaction can be expressed as:
where ×1, ×2, ×3, ×4 and y are respectively the occupant satisfaction against each single IEQ factor, and the overall satisfaction;
b0,
b1 …
b4 are the correlation factors and e is an error due to the exclusion from the model of external factors. In order to define values of
b0,
b1 …
b4 required by the model, and the consequent weighting scheme, a multivariate linear regression algorithm can be used, fitting the values of the coefficients on the database composed by the single occupant satisfaction values collected with subjective measurements. The algorithm used has the following form:
3.2. Multivariate Logistic Regression Algorithm
An alternative model takes in account a non linear dependency between IEQ factors and overall satisfaction, such the one used by Wong et al in [
17], where a logistic distribution function is used, which can be expressed as follows (in the general forms where n parameters are considered):
in the specific case where
n = 4 (and using alternative form):
In order to evaluate the coefficient of the equation above using a data fitting procedure, a different algorithm has to be used with respect to the linear case, due to the non-applicability of the homoskedasticity of residuals hypothesis. In this case the maximum likelihood method is used, starting from the logit form of the equation:
Without going into the details, the set of equations that allows to solve with respect to β0 … β4, can be obtained deriving the likelihood function and setting the equations equal to 0 (maximum). The set of equations has an open solution. The numerical solver available in standard software, such as MATLAB, allows to determine the values of β0 … β4 that better fit the model on a database of subjective measurements.
3.3. Multivariate Linear Regression Algorithm Based on Dummy Variables
An alternative approach is used by Kim and De Daer in [
21], using a theory based on the Kano model for market analysis. In such a model, linear correlation function is used to link the single IEQ factors and overall satisfaction, but having each single IEQ factor associated with dummy variables (a variable which can be set only on 0–1 values). The Dummy variables assume the following values:
xi1 = 1 ; xi2 = 0 if the occupant is satisfied of the IEQ factor
xi1 = 0 ; xi2 = 0 if the occupant is neutral on the IEQ factor
xi1 = 0 ; xi2 = 1 if the occupant is NOT satisfied of the IEQ factor
With such hypothesis the correlation function can be written as follows:
where:
y = the overall satisfaction
xij = dummy variable associated to the i-factor considered (j = 1, 2 for each i-factor)
n = number of IEQ factors considered
b0, b11, b12, …, bn1, bn2 = coefficient that can be determined through linear regression (as described for standard linear correlation function)
This algorithm allows to obtain two separate coefficients for each single IEQ factor considered, which provide a weighting scheme both for negative and positive user’ advice. These coefficients are useful to identify symmetrical and asymmetrical effects that the single IEQ factor has on the overall satisfaction. Following the same wording proposed by Kano, the single factors can be classified as follows:
if bi1 = bi2 = Proportional factors (factors that affect the overall satisfaction in the same way, being the user advice positive or negative)
if bi1 > bi2 = Bonus factors (factors that affect positively the overall satisfaction when the user advice on IEQ factor is positive, while negative advice is not affecting the overall satisfaction)
if bi1 < bi2 = Basic factors (factors that affect negatively the overall satisfaction when the user advice on IEQ factor is negative while positive advice is not affecting the overall satisfaction)
This approach can be useful when a significant number of factors are considered, in order to have a quick overview on the effects that each single factor has on the overall satisfaction, and can provide guidance in defining convenient improvement strategies.
3.4. Alternative Algorithms
A promising approach to describe correlations could be found in the implementation of artificial neural networks (ANN). Small reference are available in literature, but some applicable results can be found in Sofoglu [
22], where an ANN model is fitted on objective measurements, linking the concentration of a number of pollutants in office space with the observed frequency of occupants showing sick building syndrome symptoms per square meter. Extending the method, a similar approach could be used to correlate the single IEQ factors and overall satisfaction of the occupants with on-time objective measurements, provided that the ANN black box is populated with a sufficiently large data set.
4. Experimental Section: Case Study Description
As anticipated, the aim of this case study was to set the procedures to develop a large-scale study, both to collect subjective and objective measurements and to select effective methods of comfort assessments based on such measurements. The test set up and procedures are described below.
4.1. Objective Measurements Test Set up
For the purpose of this small-scale case study, only one survey campaign has been performed and all measurements were taken in one single day, during the winter of 2013/2014 inside one classroom within the engineering faculty of the University of Roma Tre. The future development of the large-scale study shall include both winter and summer measurements. During the survey, the outside temperature was 12 °C, partially cloudy, 65% humidity.
Within the university premises, and, in particular, in the classroom where the measurement were performed, the centralized air conditioning plant was operational.
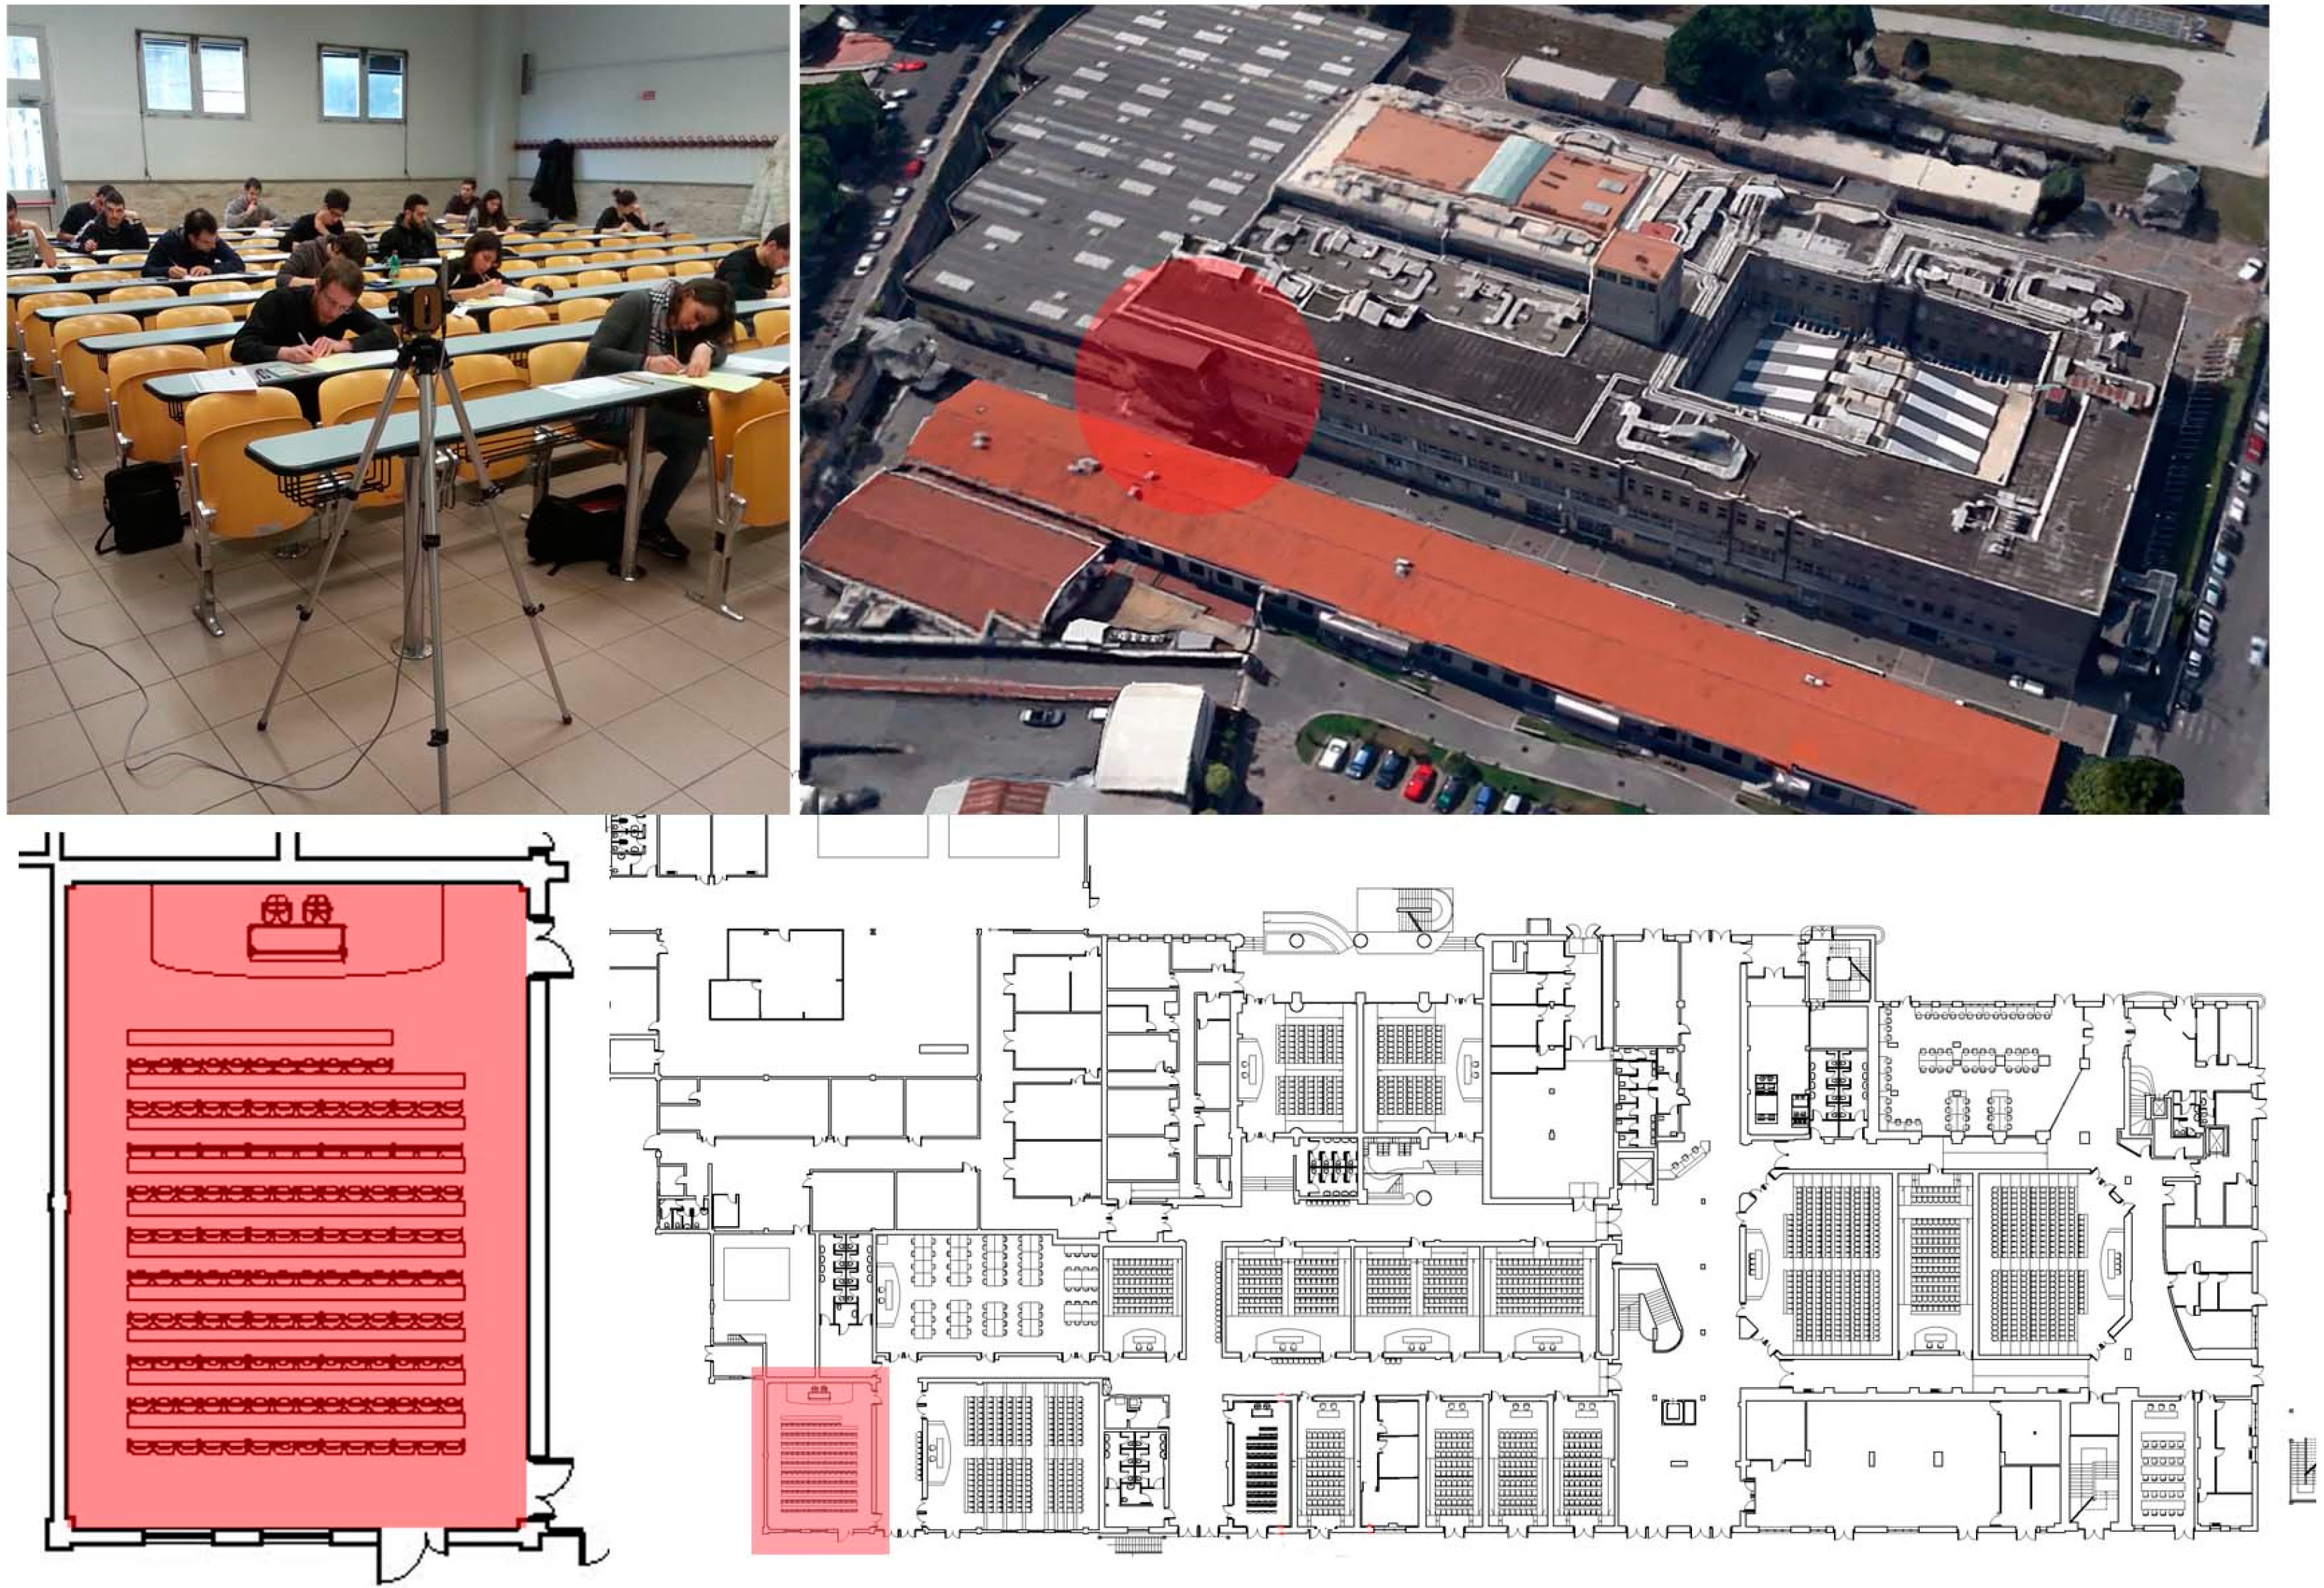
Figure 1 shows the localization of the space within the university premises and the measurement process performed together with subjective measurements.
An IEQ measurement station type BABUC A was used, collecting the values for air temperature, globe temperature, relative humidity, air speed, illuminance, CO and CO2 concentration, and weighted A equivalent continuous noise level.
The objective and subjective measurements were taken looking for two different time of exposure of the occupants, i.e., 15 min and 2 h (i.e., before and after an exam) in order to evaluate the variability of the survey results against time of exposure in a building coupled with the effect of the psychological stress caused by the exam on the users.
Figure 1.
Measurement location.
Figure 1.
Measurement location.
4.2. Subjective Measurements
The sample was composed by 17 occupants. Questionnaires were distributed to the same sample at two different times, simultaneously with respect to objective measurements, in order to evaluate differences with respect to time of exposure. The questionnaires were collected immediately after completion in order to guarantee independency in the results. The questionnaire was obtained from the standard ISO 10551:1995, and is presented in
Table 1.
Table 1.
Questionnaire for subjective measurement.
Table 1.
Questionnaire for subjective measurement.
| With Respect to the categories on the right, DO YOU THINK THIS ENVORONMENT IS: (choose one option only) | THERMAL COMFORT | ACOUSTIC COMFORT | VISUAL COMFORT | AIR QUALITY | GLOBAL COMFORT |
|---|
| Satisfactory (the activities can be properly performed) | 0 | 0 | 0 | 0 | 0 |
| Not completely Tolerable | 1 | 1 | 1 | 1 | 1 |
| Hardly Tolerable | 2 | 2 | 2 | 2 | 2 |
| Unbearable | 3 | 3 | 3 | 3 | 3 |
5. Results and Discussion
The results of the measurements collected and of the analysis performed on such database are discussed below. Taking in account the limited size of the sample considered, it is important to highlight that the quantitative result described hereinafter are not the aim of this study, which is basically devoted to identify useful inputs to develop the study on a larger scale.
5.1. Objective Measurements
The objective measurements collected are summarized in
Table 2 and
Table 3. The tables presents the values of the different IEQ parameters measured in the four corners of the classroom, and the associated average values, with reference to the two different times of data collection,
i.e., 9:45 am and 11:30 am. The measured IEQ parameters are:
T (air temperature),
Tdry (dry-bulb temperature),
Thum (wet-bulb temperature),
Urel (relative humidity),
Tpr (dew point temperature),
Tglob (globe temperature),
Va (Air speed),
Leq (weighted A equivalent continuous noise level),
Lux (illuminance),
CO2 (CO
2 Concentration), and
CO (CO concentration).
Table 2.
Objective measurements at 9:45 am.
Table 2.
Objective measurements at 9:45 am.
| Survey Time: 9:45 am | Objective Measurements |
|---|
| Location: | Corner 1 | Corner 2 | Corner 3 | Corner 4 | Average | u.m. | |
|---|
| T | 24.11 | 24.57 | 24.72 | 24.45 | 24.46 | C° | THERMAL |
| Tdry | 25.06 | 24.83 | 24.95 | 24.07 | 24.73 | C° |
| Thum | 16.09 | 16.2 | 16.54 | 16.12 | 16.24 | C° |
| Urel | 36.60% | 37.40% | 37.20% | 41.10% | 38.08% | % |
| Tpr | 9.12 | 9.43 | 9.6 | 9.93 | 9.52 | C° |
| Tglob | 23.77 | 23.01 | 24.16 | 23.84 | 23.70 | C° |
| Va | 0.2 | 0.12 | 0.1 | 0.06 | 0.12 | m/s |
| Leq | 71 | 66.4 | 70 | 63.6 | 67.75 | dBa | ACOUSTICAL |
| Lux | | | | | 360.00 | lx | VISUAL |
| CO2 | | | | | 890.00 | ppm | IAQ |
| CO | | | | | 1.40 | mg/m3 |
Table 3.
Objective measurements at 11:30 am.
Table 3.
Objective measurements at 11:30 am.
| Survey Time: 11:30 am | Objective Measurements |
|---|
| Location: | Corner 1 | Corner 2 | Corner 3 | Corner 4 | Average | u.m. | |
|---|
| T | 24.15 | 23.865 | 22.89 | 23.46 | 23.59 | C° | THERMAL |
| Tdry | 23.2 | 21.825 | 21.56 | 21.03 | 21.90 | C° |
| Thum | 15.74 | 15.02 | 14.91 | 14.8 | 15.12 | C° |
| Urel | 43.60% | 46.70% | 44.50% | 49.50% | 46.08% | % |
| Tpr | 10.02 | 9.88 | 9.48 | 9.89 | 9.82 | C° |
| Tglob | 24 | 23.9 | 21.83 | 22.21 | 22.99 | C° |
| Va | 0.05 | 0.085 | 0.05 | 0.04 | 0.06 | m/s |
| Leq | 71 | 73 | 71 | 71 | 71.50 | dBa | ACOUSTICAL |
| Lux | | | | | 360.00 | lx | VISUAL |
| CO2 | | | | | 950.00 | ppm | IAQ |
| CO | | | | | 1.60 | mg/m3 |
Based on this set of data, it would be possible to calculate the predicted percentage of dissatisfied users (separately with respect to the thermal environment, indoor air quality, aural environment and illumination level, at working plane) using equations available in literature, of which coefficients shall be obtained through a multivariate logistic regression data fitting procedure, based on a sufficiently large database of objective and subjective measurements. Such database is not available for the specific case, thus, just for procedure set up, the four equations proposed in [
17] are used.
The four equations provide the percentage of satisfied users (Φ = 1, 2, 3, 4) with respect to each one of the four IEQ factors, against the value of selected parameters, namely:
Parameter ζ
1 = PDD (calculated on the basis of the well-established standard [
23]), for the thermal environment,
Parameter ζ2 = CO2 concentration, for the air quality (CO concentration is not considered),
Parameter ζ3 = noise level in dba, for aural environment,
Parameter ζ4 = illuminance in lux, for illumination level.
The coefficients of the four equations are fitted on measures collected in office spaces in Hong Kong. Even if the functions are not directly applicable to this case study, with the aim to set up a procedure, the level of acceptance of the IEQ factors is calculated using the measured values of IEQ parameters, in order to be compared with the results of the subjective survey, discussed below. The Results are summarized in
Table 4 and
Table 5.
Table 4.
Predicted percentage of Satisfied users–9:45 am.
Table 4.
Predicted percentage of Satisfied users–9:45 am.
| 9:45 am |
|---|
| THERMAL | IAQ | ACOUSTICAL | VISUAL |
|---|
| Parameter associated to Ieq Factor | ζ1 | ζ2 | ζ3 | ζ4 |
| U.m. | PDD | ppm | dba | lux |
| 10.20 | 890.00 | 67.75 | 360.00 |
| Predicted percentage of Satisfied users | Φ1 | Φ2 | Φ3 | Φ4 |
| 0.90 | 0.94 | 0.61 | 0.73 |
Table 5.
Predicted percentage of Satisfied users–11:30 am
Table 5.
Predicted percentage of Satisfied users–11:30 am
| 11:30 am |
|---|
| THERMAL | IAQ | ACOUSTICAL | VISUAL |
|---|
| Parameter associated to Ieq Factor | ζ1 | ζ2 | ζ3 | ζ4 |
| U.m | PDD | ppm | dba | lux |
| 8.30 | 950.00 | 71.50 | 360.00 |
| Predicted percentage of Satisfied users | Φ1 | Φ2 | Φ3 | Φ4 |
| 0.92 | 0.93 | 0.49 | 0.73 |
5.2. Subjective Measurement Results
Table 6 presents the distribution of the votes obtained from the questionnaires, with reference to each IEQ factor and overall satisfaction, in the two time frames.
Table 6.
Distribution of the votes in subjective measurements.
Table 6.
Distribution of the votes in subjective measurements.
| Questionnaires 9:45 am |
| VOTE | THERMAL | IAQ | ACOUS. | VISUAL | GLOBAL |
| unbearable | 3 | 0 | 1 | 0 | 0 | 0 |
| hardly tolerable | 2 | 1 | 0 | 4 | 0 | 1 |
| not completely tolerable | 1 | 2 | 3 | 6 | 1 | 3 |
| Satisfactory (the activities can be properly peformed) | 0 | 14 | 13 | 7 | 16 | 13 |
| AVERAGE | 0.24 | 0.35 | 0.82 | 0.06 | 0.29 |
| ST. DEV. | 0.56 | 0.79 | 0.81 | 0.24 | 0.59 |
| Questionnaires 11:30 am |
| VOTE | THERMAL | IAQ | ACOUS. | VISUAL | GLOBAL |
| unbearable | 3 | 0 | 1 | 1 | 0 | 0 |
| hardly tolerable | 2 | 0 | 1 | 4 | 0 | 1 |
| not completely tolerable | 1 | 5 | 2 | 7 | 3 | 3 |
| Satisfactory (the activities can be properly peformed) | 0 | 12 | 13 | 5 | 14 | 13 |
| AVERAGE | 0.29 | 0.41 | 1,06 | 0.18 | 0.29 |
| ST. DEV. | 0.47 | 0.87 | 0.90 | 0.39 | 0.59 |
With reference to the results of the questionnaires presented above, the following aspects can be highlighted:
In both the timeframes of sampling it results that the worst average vote (the higher the number, the worst is the level of satisfaction) is related to the aural environment. This result is also in accordance with the prediction presented in
Table 4 and
Table 5, where it was shown that the lowest number of satisfied users was expected with respect to the noise level, both at 9:45 am and 11:30 am.
The predicted variation of satisfied users with respect to the conditions measured at 9:45 am and 11:30 am (see
Table 4 and
Table 5) is quite in accordance with the variation of the Average vote obtained from the survey. A lack of accuracy can in any case justified by the fact that the equations used are not fitted on data base collected in the environment of this case study.
The average vote on global comfort does not change in the two timeframes considered, while the average vote against the different IEQ factors is variable. This means that weighting scheme that associates the level of satisfaction against the global comfort and single IEQ factors is variable with the time of exposure of the user in the building.
5.3. IEQ Weighting Scheme Comparison
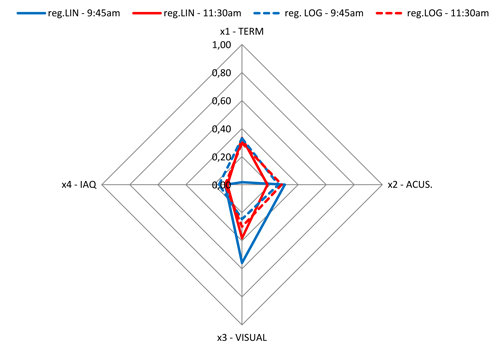
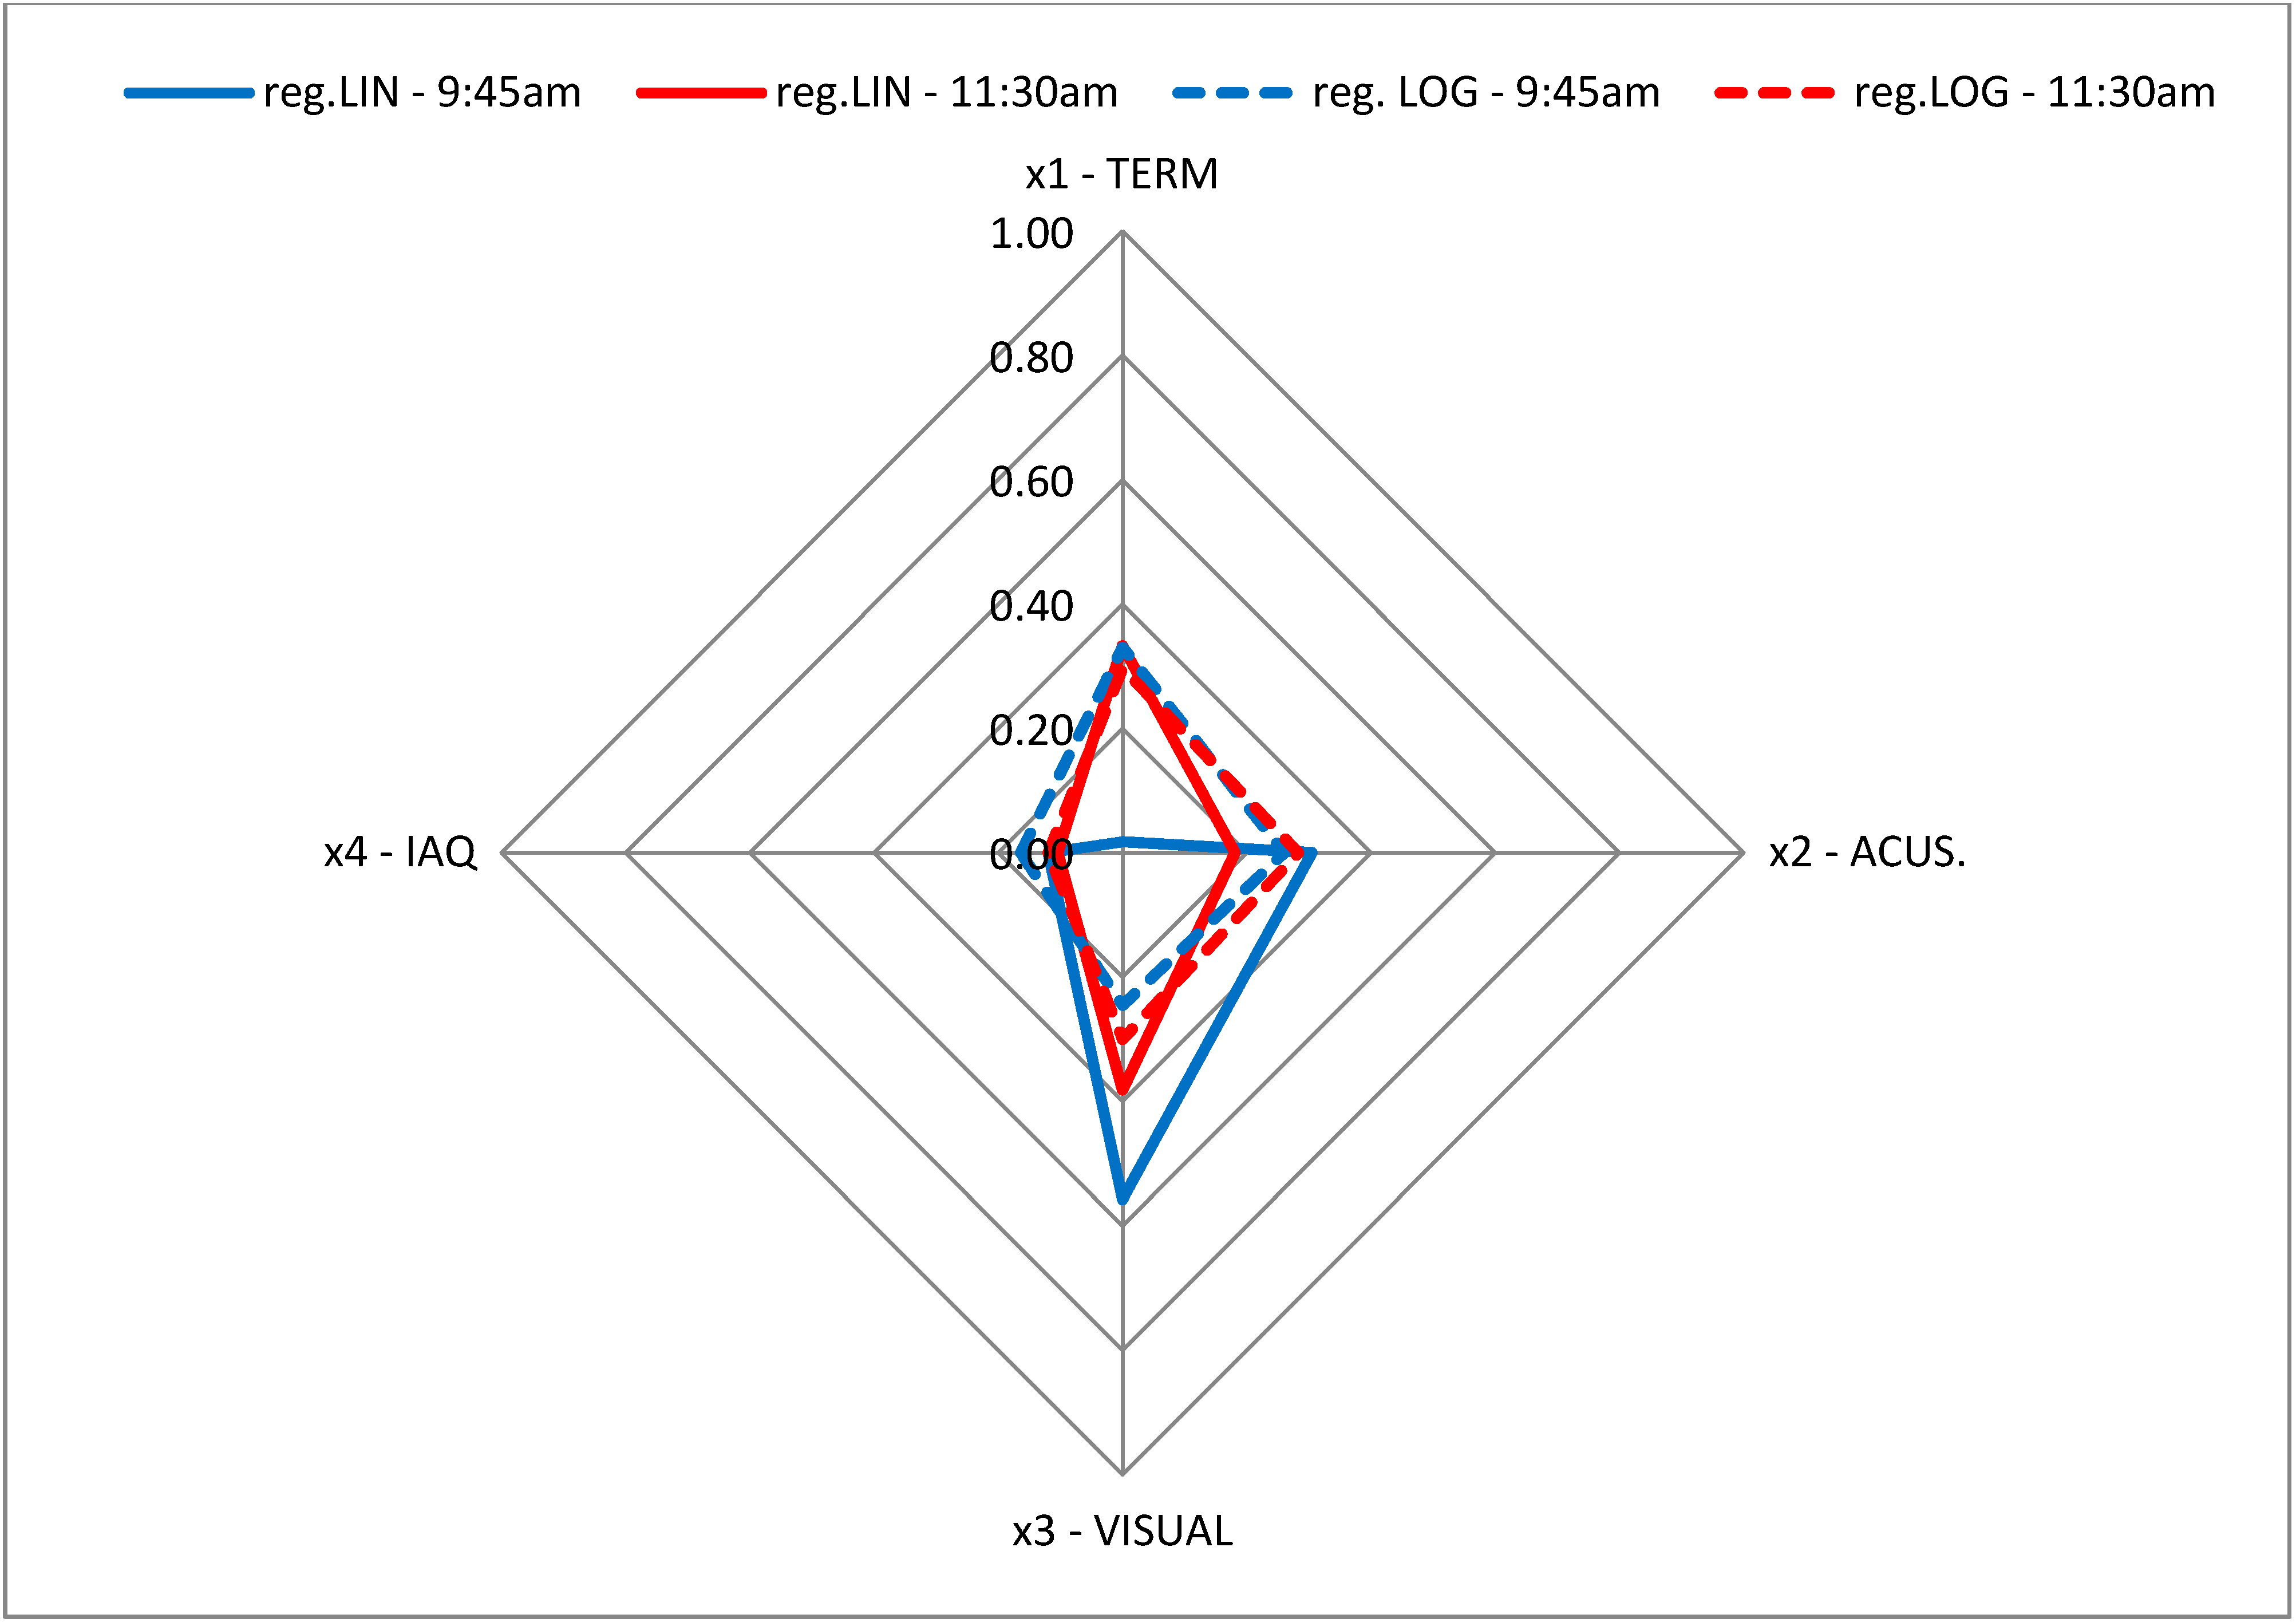
The votes collected have been used to identify the coefficients in both the multivariate linear regression and the multivariate logistic regression algorithms, separately for each time frame. Weighting coefficients are standardized and normalized. The weighting schemes obtained are summarized in
Table 7 and
Figure 2.
Table 7.
Weighting schemes obtained with multivariate linear and logistic regressions.
Table 7.
Weighting schemes obtained with multivariate linear and logistic regressions.
| MULTIVARIATE LINEAR REGRESSION |
| 9:45 am |
| x1-TERM | x2-ACUS. | x3-VISUAL | x4-IAQ |
| b1 | b2 | b3 | b4 |
| 0.02 | 0.31 | 0.56 | 0.12 |
| 11:30 am |
| x1-TERM | x2-ACUS. | x3-VISUAL | x4-IAQ |
| b1 | b2 | b3 | b4 |
| 0.33 | 0.18 | 0.38 | 0.10 |
| MULTIVARIATE LOGISTIC REGRESSION |
| 9:45 am |
| x1-TERM | x2-ACUS. | x3-VISUAL | x4-IAQ |
| k1 | k2 | k3 | k4 |
| 0.33 | 0.26 | 0.25 | 0.16 |
| 11:30 am |
| x1-TERM | x2-ACUS. | x3-VISUAL | x4-IAQ |
| k1 | k2 | k3 | k4 |
| 0.30 | 0.28 | 0.30 | 0.12 |
Figure 2.
Weighting scheme obtained with linear and logistic regression algorithms.
Figure 2.
Weighting scheme obtained with linear and logistic regression algorithms.
In both cases, linear and logistic regression data fitting, did not provided coefficients with sufficient statistic reliability (in some cases p close to 1), which was expected due to the very small size of the sample. With similar processes, in the literature referenced above, good statistical reliability was obtained with samples composed of nearly, or more than, 300 occupants.
It can be noted that even if coefficients have different variability in the two models, logistic regression provide more similar values, while linear regression over/underestimate the values of the higher and smaller coefficients.
The weighting scheme shows a significant variability with respect to time of exposure, which again is even more amplified in the linear regression model. In any case, the inclusion in the model of coefficients which can take in account the time of exposure of the occupants to weight the vote seems a hypothesis to be investigated to take into account such variability in the results.
6. Conclusions
The analysis of the available literature shows that additional efforts are required in order to define effective occupant satisfaction and global comfort assessment methods. When available, such methods shall gain a similar relevance to energy saving procedures in the design process. Space and time rendering protocols shall be established in order to better compare and select the most appropriate procedures. With respect to the models used to correlate the single IEQ factors with overall occupant satisfaction, different approaches are available and new ones shall be developed. The weighting schemes between different IEQ categories obtained with such models, although not very useful to define a universal rule, can be considered an additional instrument to prioritize building interventions or to develop continuous monitoring procedures during the building life cycle.
The results obtained in this preparatory case study, provide some relevant information to develop a larger-scale survey and data analysis. The key issues identified are the following:
Subjective measurements sample size and models reliability—the coefficient of the models obtained with the data fitting are not always statistically reliable: in order to define a model with sufficient predictive ability, fitting the data on a larger sample (min 300 subjects) is required.
Structure of subjective measurements questionnaires—the number of questions for each IEQ factor tends to distort the weight of the factor with respect to the overall satisfaction. It is convenient to simplify the questionnaire used with a uniform set of questions: for each IEQ factor only acceptability—not acceptable shall be asked. As an option, these basic questions could be integrated, with a second set asking to provide a review of each factor using the ASHRAE (American Society of Heating, Refrigerating and Air Conditioning Engineers ) scale (+3, −3).
Prediction of satisfied users against each single IEQ factor—the equations available in literature seem suitable to predict the level of satisfaction of the users for a given value of IEQ parameters, provided that a data fitting procedure is performed on a database populated with a set of measurements that covers all the typical conditions of the environment.
Correlation model comparisons—it was noted a significant variability in the coefficients obtained from the data set related to two different sampling times. The linear regression algorithm tends to overestimate the bigger coefficient, while the logistic regression coefficient is more stable. In this sense, the adoption of a non-linear model (as reg.log) appears more promising for IEQ factors and overall comfort correlation. The linear regression showed higher statistical reliability with respect to the logistic regression, which probably is due to the limited sample size.
Variability of the weighting scheme with respect to the time of exposure—the preliminary data obtained shows that the weighting scheme can be variable with the time of exposure of the users in the same indoor space. Further study shall address this point in order to investigate if correction coefficients associated to the time of exposure can efficiently take in account this aspect.
New correlation models—ANN network model has to be investigated. The inclusion of time dependency in the models should be investigated.


