Article

Alternative Testing Methods for Predicting Health Risk from Environmental Exposures

1
Center for Environmental Toxicology, Environmental Protection and Health Prevention Agency-Emilia-Romagna Region (Arpa-ER), I-40126 Bologna, Italy
2
Department of Experimental, Diagnostic and Specialty Medicine-Cancer Research Section, University of Bologna, I-40126 Bologna, Italy
3
Center for Urban Areas, Environmental Protection and Health Prevention Agency-Emilia-Romagna Region (ER-EPA), I-40126 Bologna, Italy
4
Public Health Service, Emilia-Romagna Region, I-40126 Bologna, Italy
5
Environmental Protection and Health Prevention Agency-Emilia-Romagna Region (ER-EPA), I-40126 Bologna, Italy
*
Author to whom correspondence should be addressed.
Sustainability 2014, 6(8), 5265-5283; https://0-doi-org.brum.beds.ac.uk/10.3390/su6085265
Submission received: 11 June 2014 / Revised: 1 August 2014 / Accepted: 4 August 2014 / Published: 13 August 2014

Abstract

:
Alternative methods to animal testing are considered as promising tools to support the prediction of toxicological risks from environmental exposure. Among the alternative testing methods, the cell transformation assay (CTA) appears to be one of the most appropriate approaches to predict the carcinogenic properties of single chemicals, complex mixtures and environmental pollutants. The BALB/c 3T3 CTA shows a good degree of concordance with the in vivo rodent carcinogenesis tests. Whole-genome transcriptomic profiling is performed to identify genes that are transcriptionally regulated by different kinds of exposures. Its use in cell models representative of target organs may help in understanding the mode of action and predicting the risk for human health. Aiming at associating the environmental exposure to health-adverse outcomes, we used an integrated approach including the 3T3 CTA and transcriptomics on target cells, in order to evaluate the effects of airborne particulate matter (PM) on toxicological complex endpoints. Organic extracts obtained from PM2.5 and PM1 samples were evaluated in the 3T3 CTA in order to identify effects possibly associated with different aerodynamic diameters or airborne chemical components. The effects of the PM2.5 extracts on human health were assessed by using whole-genome 44 K oligo-microarray slides. Statistical analysis by GeneSpring GX identified genes whose expression was modulated in response to the cell treatment. Then, modulated genes were associated with pathways, biological processes and diseases through an extensive biological analysis. Data derived from in vitro methods and omics techniques could be valuable for monitoring the exposure to toxicants, understanding the modes of action via exposure-associated gene expression patterns and to highlight the role of genes in key events related to adversity.

1. Introduction

Among all of the strategies seeking for the relationships between exposure to chemicals and the effects on human health, the predictive toxicology approach has the potential to better identify biological effects from exposure to environmental mixtures and predict the final health outcome, by using in vitro methods supported by high throughput approaches and linking them to known key steps in disease progression. Alternative methods to animal testing are considered as suitable tools to support hazard identification and are also of growing interest for predicting the toxicological risks.
The simultaneous presence of a huge number of different chemicals at low concentrations could often result in misleading characterization of the hazard associated with complex mixtures, leading to underestimation of the risk, since the possible additive or more than additive interactions among chemicals could not be properly identified [1]. Airborne particulate matter (PM) could be regarded as the prototypical example, as it is nearly impossible to identify and measure all components in the PM extracts. Moreover, individual pollutants in airborne PM samples are often under the acceptable concentration level established by the current legislations and near or even under the method detection limits. In this context, the establishment of in vitro methods able to characterize the toxic effects and the carcinogenic potential of mixtures could be relevant for hazard and risk assessment.
Numerous scientific studies have linked exposure to environmental pollution to a variety of acute and chronic health adverse outcomes, including mortality and cardiovascular and respiratory diseases [2]. In October, 2013, the International Agency for Research on Cancer (IARC) classified outdoor air pollution as “carcinogenic to humans” (Group 1) [3].
The prediction of carcinogenicity is still a major issue, since cancer is a multifactorial process consisting of a sequence of stages. The in vivo rodent bioassay is currently considered to be the reference test for the evaluation of the carcinogenicity end-point, but, for economic and technical reasons, it is rarely suitable for mixtures of environmental origin. Among in vitro tests reproducing several stages of the multiphasic process of carcinogenesis, the cell transformation assays (CTAs) appear to be the most suitable tools to predict the carcinogenic properties of chemicals [4,5] and to evaluate the carcinogenic risk associated with environmental samples. The suitability of CTAs, as a model to forecast the carcinogenic potential of chemicals, was recently confirmed by the results of the prevalidation study coordinated by European center for validation of alternative methods (ECVAM) aiming at assessing the predictivity and reproducibility of in vitro CTAs in the carcinogenicity testing of chemicals [6,7]. The exposure of immortalized embryonic mouse fibroblasts to chemicals having a transforming ability resulted in the loss of the contact-inhibition and the onset of morphologically-transformed foci [8].
In this study, we evaluated the combined effect of multiple chemicals in real environmental mixtures, using alternative testing strategies, including a model to highlight the toxic and transforming properties of urban airborne samples and microarray-based transcriptomics to identify genes modulated as a consequence of the exposure to air samples collected at different sites.
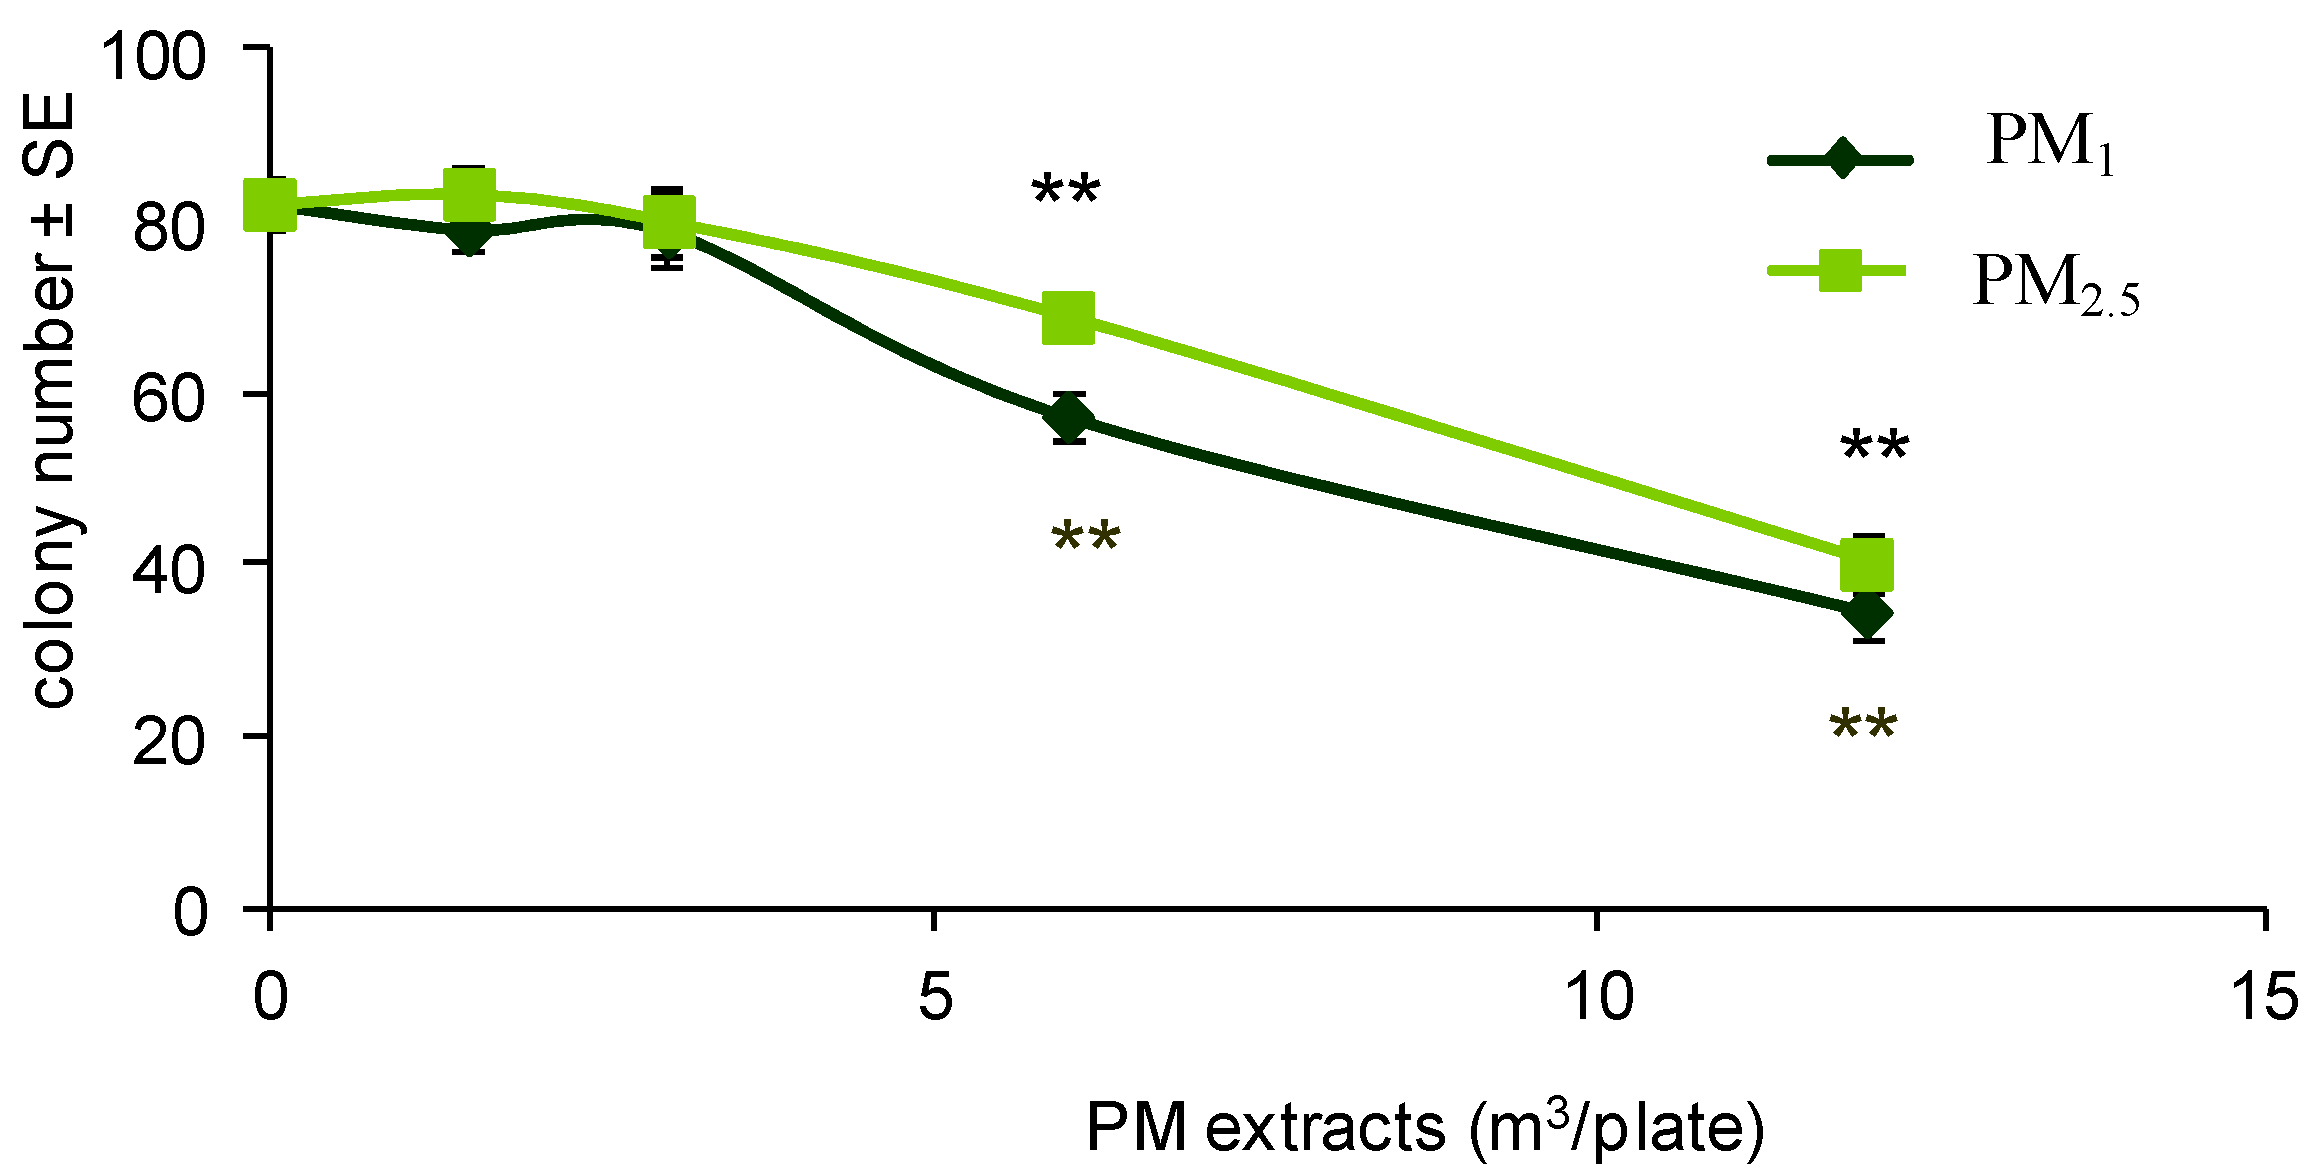
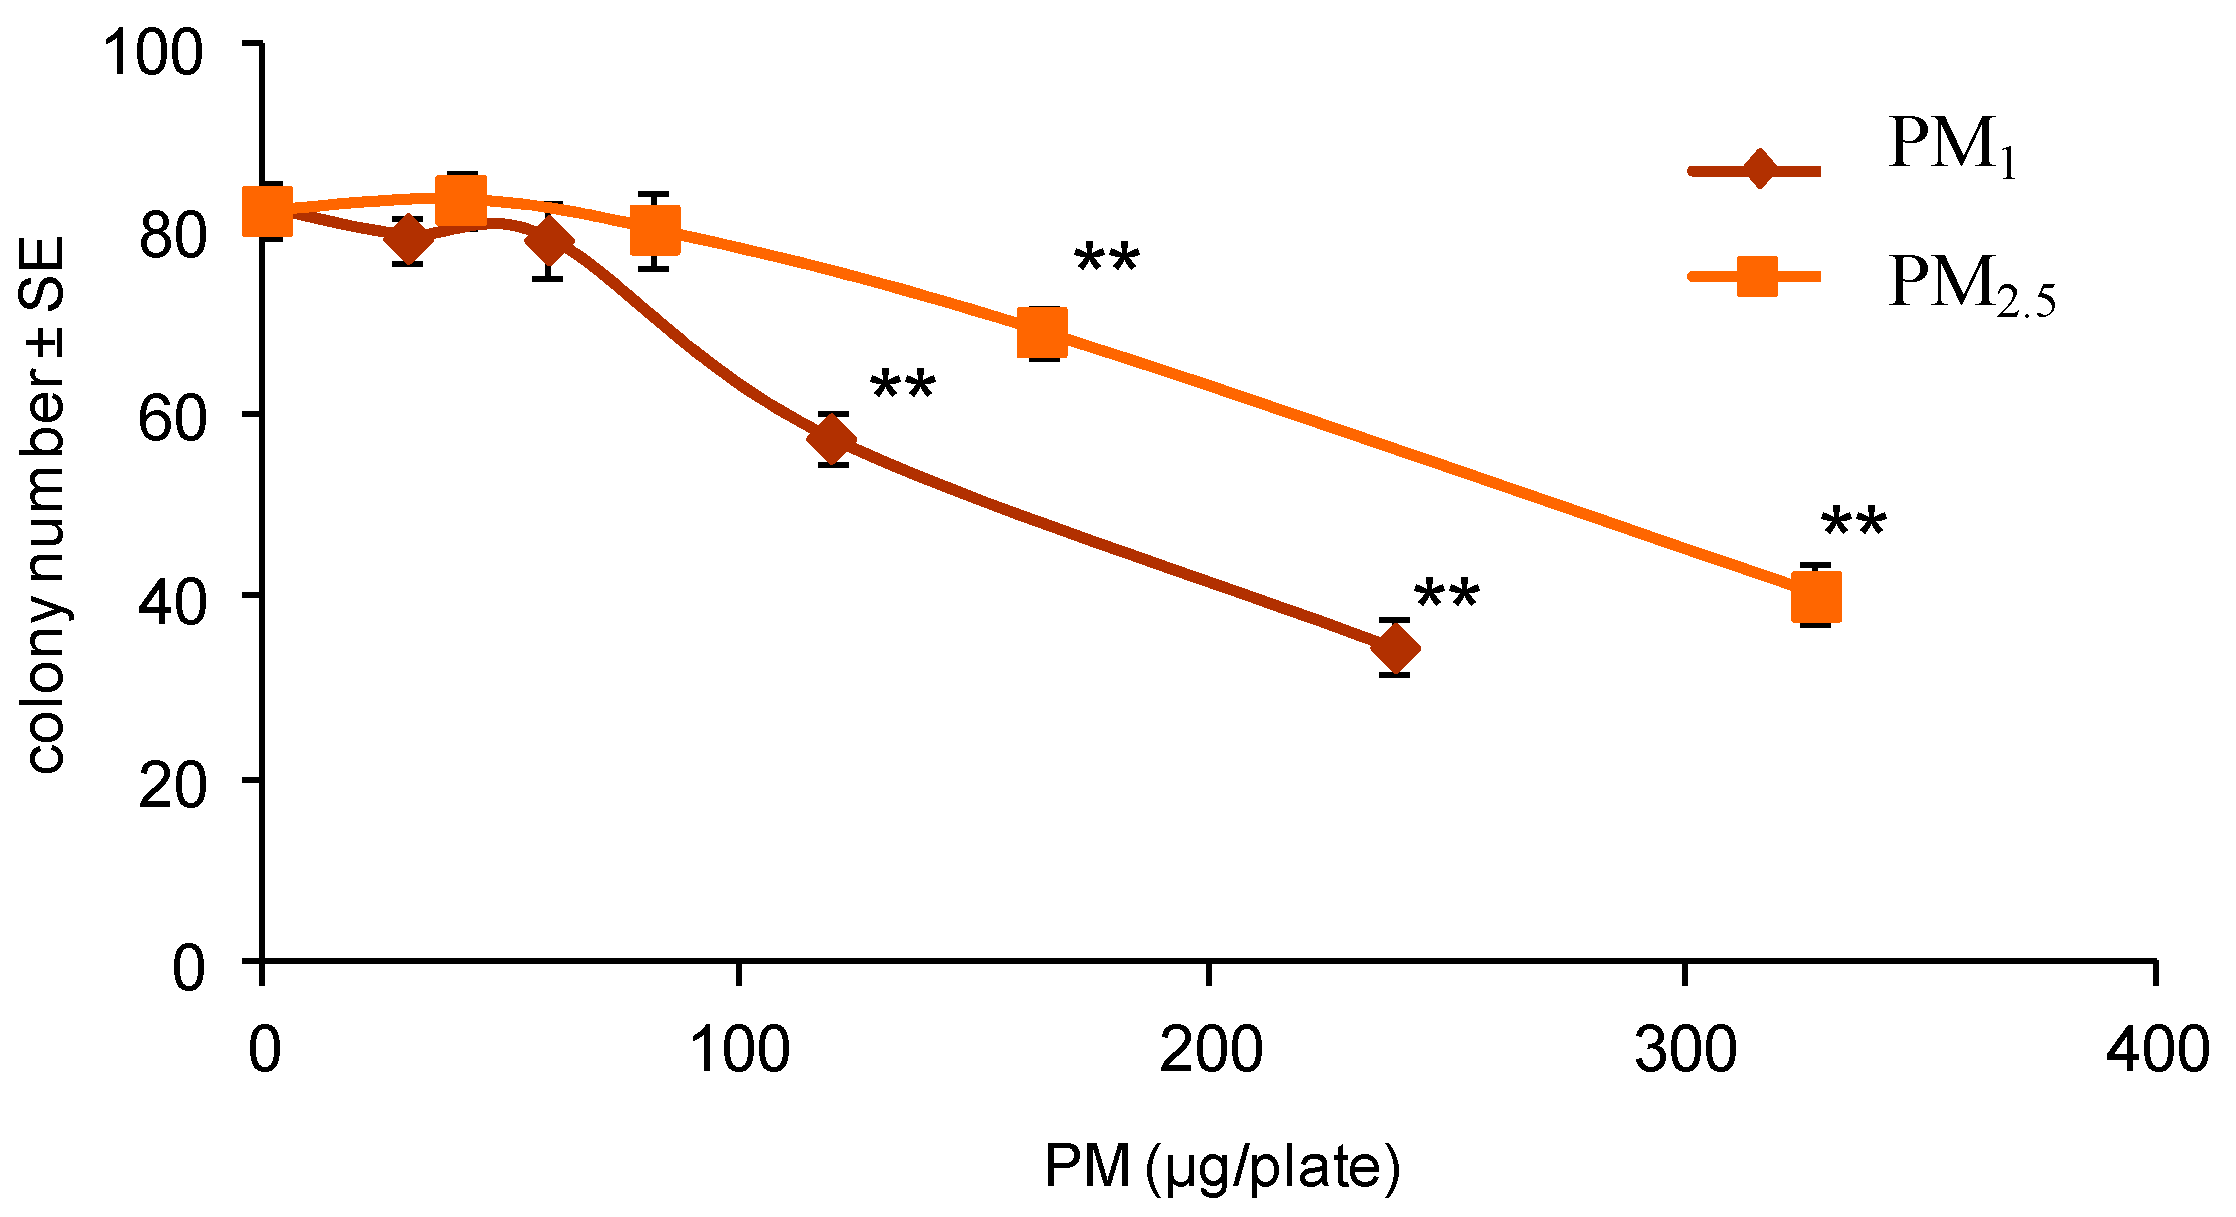
A 3T3 CTA was performed by treating cells with PM extracts. The air samples of PM2.5 and PM1 were collected during different seasons at a site that is located in the northern area of the city of Bologna. This site is considered the urban background. The organic extracts from the collected samples were evaluated for cytotoxicity and transforming activity in order to identify dose-related effects possibly associated with different aerodynamic diameters or airborne chemical components.
The integration of omics techniques with in vitro methodologies helps in clarifying the mode(s) and/or mechanism(s) of action of cell transformation following environmental exposure. The functional genomics, based on the microarray technology, could assess the impact of exposure to multiple cellular processes within a single experiment, providing information about the metabolic, signaling and regulatory networks of cells affected by mixtures. The generated signatures can be used also to derive possible biomarkers of toxicity and exposure.
It has been reported that exposures to environmental complex mixtures often affect the cell growth and several signaling pathways involved in initiating repair, allowing adaptation and promoting survival [9], suggesting that the exposure of cells to organic PM extracts could induce the modulation of genes involved in similar pathways and processes.
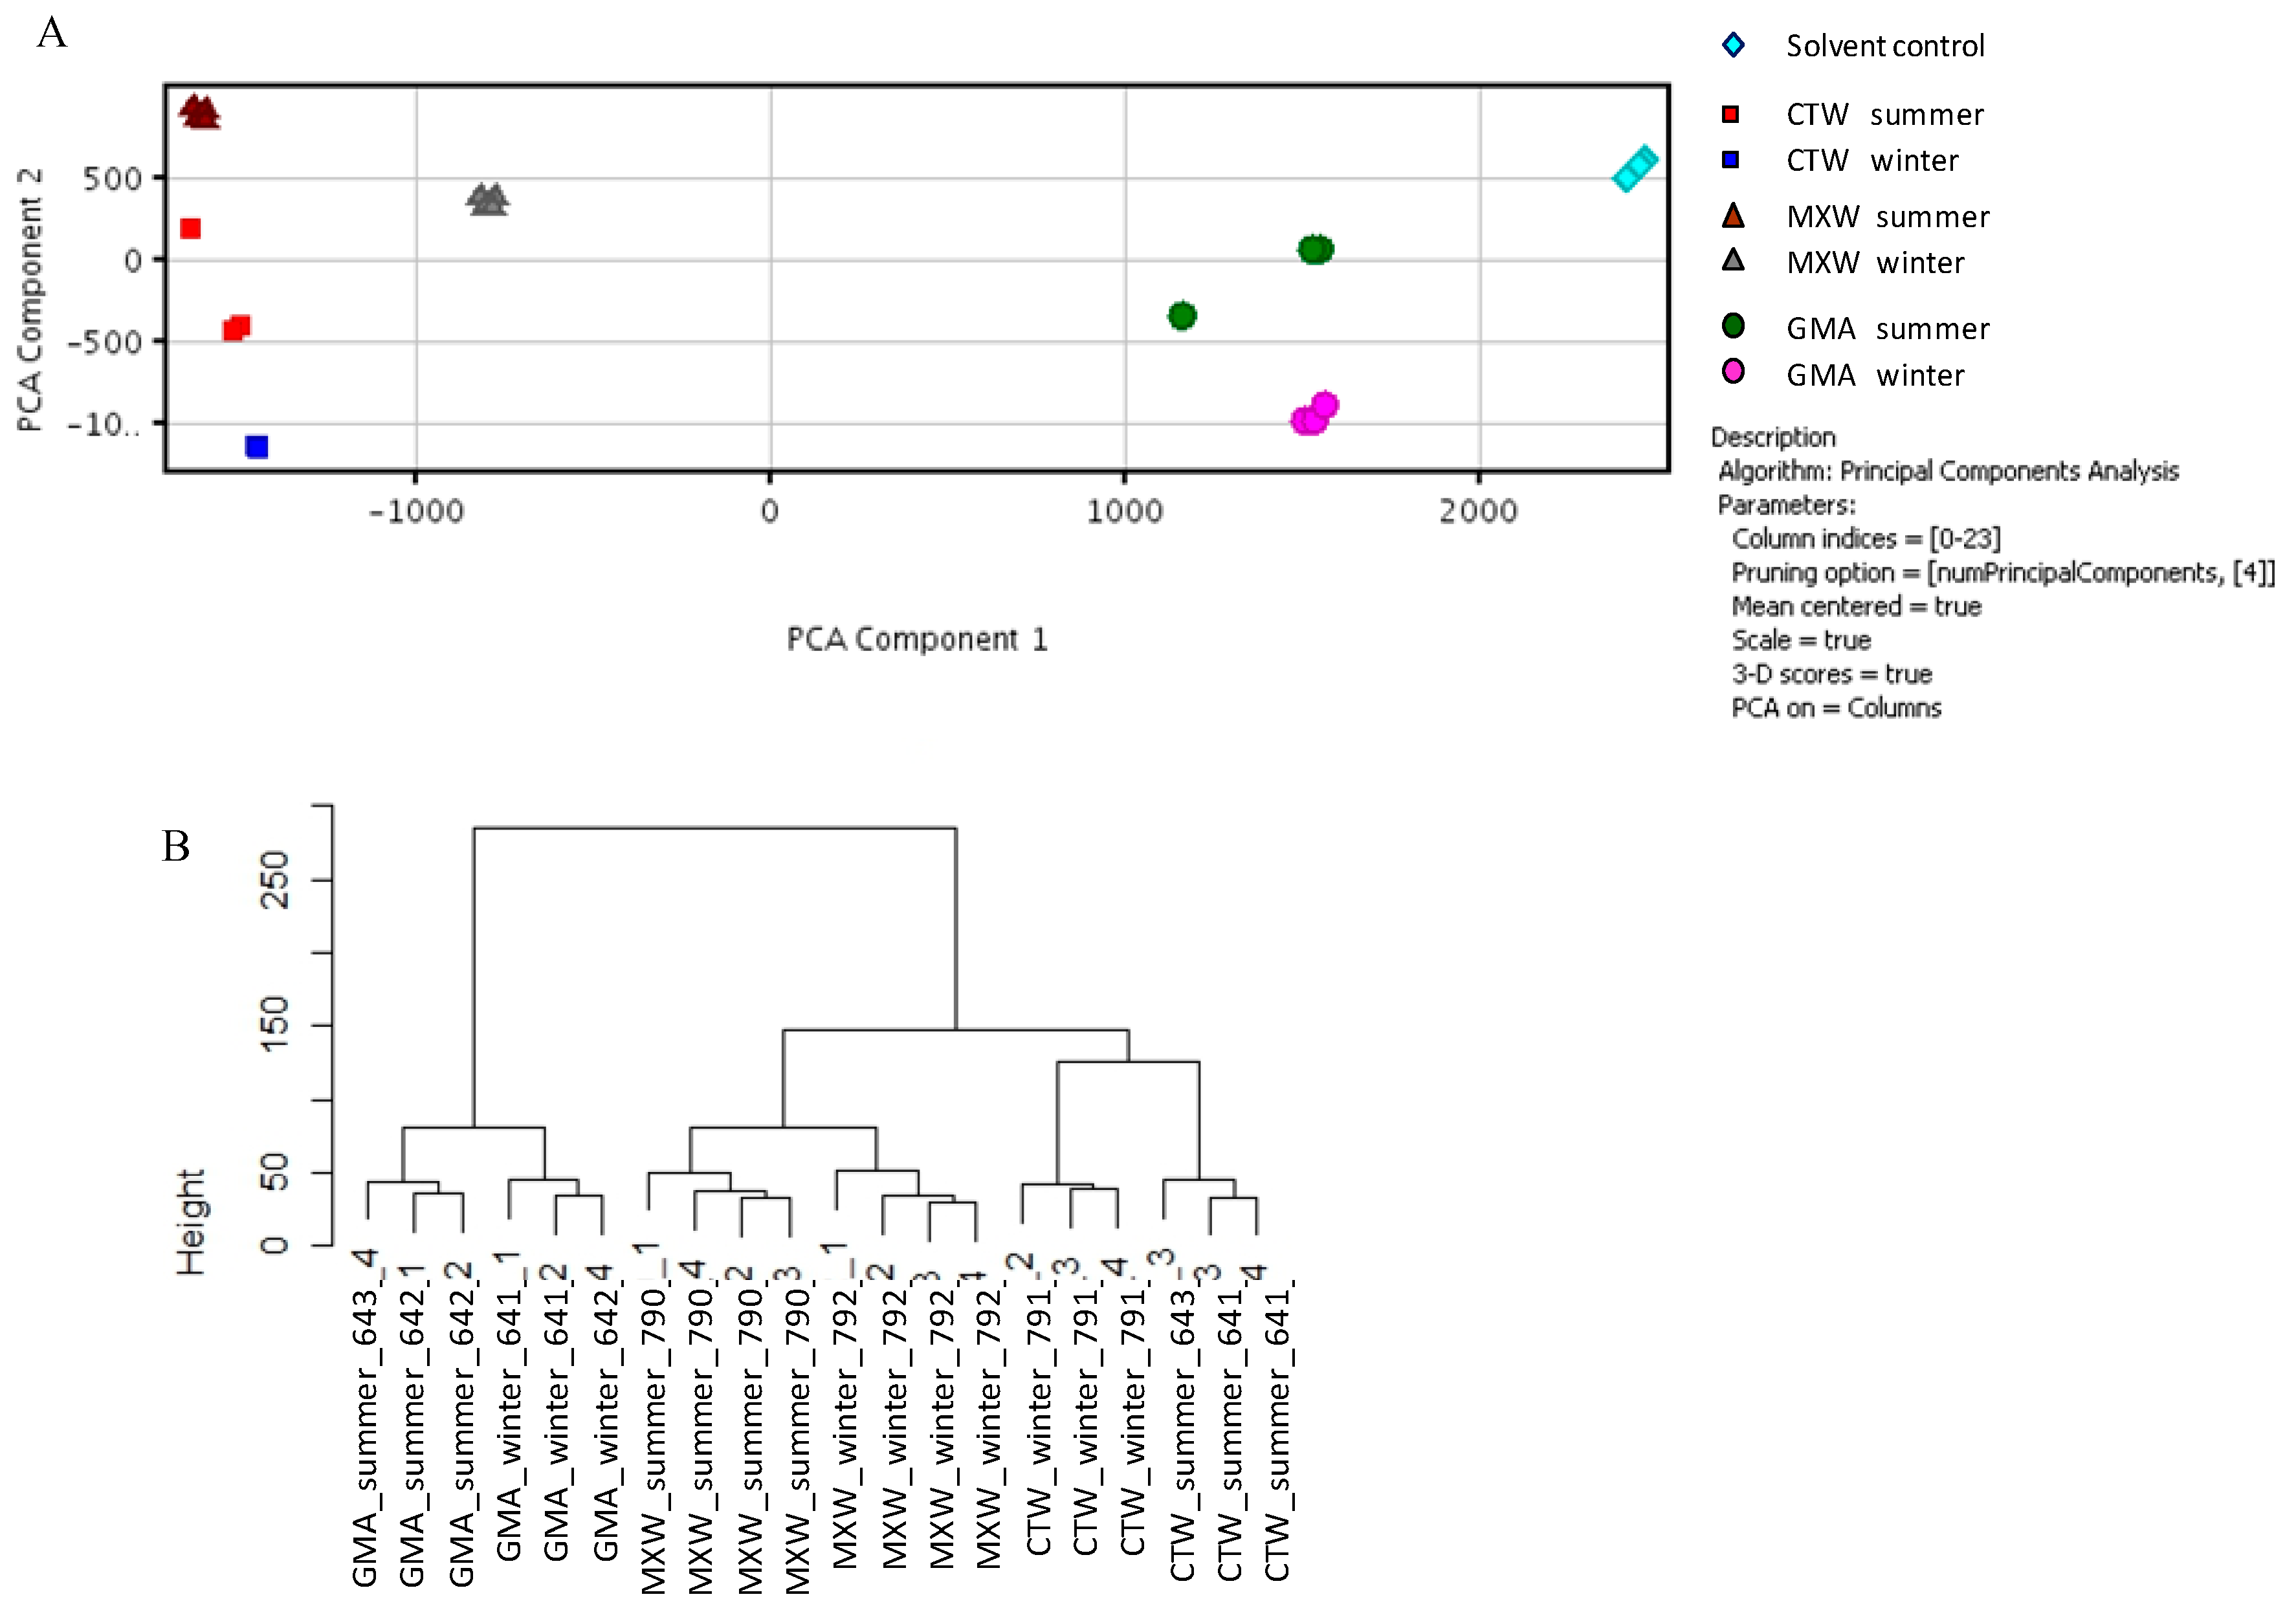
To confirm previous findings, gene expression profiles of A549 cells treated with organic extracts derived from PM2.5 collected at three sites in the surroundings of Bologna were obtained. The sampling sites were differently impacted by pollutant sources present in the sampling area.
The A549 cell line, derived from a human lung adenocarcinoma, was chosen as the cellular target for transcriptomic studies, since it has been previously confirmed to be a useful in vitro model to study the PM effects on lung cells [10,11]. Indeed, A549 exhibits characteristics resembling human alveolar type II cells [12]. The identification lists of genes affected by the treatment was used to identify the biological pathways and processes involved in the cellular response and eventually relate them to adverse health outcomes associated with PM2.5 exposure.

2. Materials and Methods

2.1. Cells

Cell cultures were routinely maintained in a humidified incubator with an atmosphere of 5% CO2 in air at 37 °C. The BALB/c 3T3 A31-1-1 cell line was purchased from the Health Science Research Resource Bank (Osaka, Japan). The cells were grown in minimum essential medium (MEM) with 10% fetal bovine serum (FBS), cryoconserved in MEM 10% FBS solution containing 5% dimethyl sulfoxide (DMSO) and used for the CTAs at Passages 3–5 from arrival. For the transformation assays, only sub-confluent cells (about 70% confluence) were used. The target cells were not maintained in culture beyond the third passage after thawing. The A549 cells (ATCC CCL185) were used for the microarray experiments. They were obtained from LGC standards Co. and were grown in F12K medium with 10% FBS.

2.2. Air Samples

The PM2.5 and PM1 used for the CTAs were sampled in an urban background site during autumn, 2012 (October 23–November 12, 2012). The PM2.5 fraction was collected by the high volume air flow sampler, Air Flow PM2.5-HVS (UNI-EN 14907 compliant, suction flow 500 L/min, Air Monitoring Systems-Analitica, Pesaro-Italy). Air Flow polyurethane foam (PUF) (suction flow 200 L/min, Air Monitoring Systems-Analitica, Pesaro-Italy), which could collect simultaneously gas (using PUF-polyurethane foam) and PM1, was used for PM1 sampling. For the microarray experiments, samples of PM2.5 were collected daily by low volume air flow samplers (Skypost TCR TECORA) during summer, 2008, (June 13–July 24, 2008) and winter, 2009 (January 15–March 12, 2009). A brief description of the sampling site is reported in Table 1.
Table 1. Sampling sites for toxicological analysis. PM, particulate matter.
NameDescriptionSampling PeriodPM2.5 (µg/m3)PM1 (µg/m3)Toxicological Assay
Supersiteurban background site located in the northern area of the City of BolognaAutumn27.2719.86Cytotoxicity assay (CTA)
MXWsite located in the surroundings of Bologna and impacted by the waste-to-energy plantSummer23.33NDMicroarray experiments
Winter35.42ND
CTWsite located in the surroundings of Bologna and impacted by all of the same sources as MXW, except the waste-to-energy plantSummer21.11ND
Winter34.47ND
GMAUrban background site located in the southern area of Bologna (public park)Summer18.74ND
Winter29.56ND
The gravimetric data were obtained daily by weighing the filters before and after collection. The filters were pooled to obtain seasonal samples and extracted with acetone, using a Soxhlet apparatus, then reduced to dryness and dissolved in DMSO at 800 m3 equivalents/mL. The treatment solutions were prepared by diluting the stock solutions in the culture media immediately before using. The final concentration of the vehicle DMSO was 0.5%.

2.3. Cell Transformation Assay

2.3.1. Morphological Transformation Assay

The transformation assay was performed as previously reported [13,14] with minor modifications. Cells were seeded at a density of 3 × 10⁴ cells/60 mm dish, incubated for 48 h and then exposed to the PM2.5 extracts at concentrations ranging from 1.5 to 12 m3 equivalents. Ten replicates were carried out. Untreated BALB/c 3T3 A31-1-1 cells and solvent-treated cells were used as negative controls. Positive controls were represented by cells treated with the well-known carcinogen, methylcholanthrene (3-MCA, CAS number 56-49-5, Sigma–Aldrich, purity 98%, final concentration 4 µg/mL). After 48 h, the treatment medium was removed and replenished with fresh normal culture medium. Cells were maintained in culture for 4 weeks, with bi-weekly medium changes, then fixed with methanol, stained with 10% aqueous Giemsa and scored for foci formation.
The scoring of foci was carried out according to the recommended guidelines [15]. Only foci considered as positive (type III), showing deeply basophilic, dense multilayering of cells, random cell orientation at all parts of the focus edge, invasion into the surrounding contact-inhibited monolayer and domination of spindle-shaped cells were counted. Foci of less than 1 mm in diameter were not scored.
Results were reported as: (I) the number of positive plates (plates with foci/scored plates); (II) the mean number foci/plate ± standard error (SE); and (III) the transformation frequency (TF), calculated on the cells that survived after chemical exposure. TF is expressed as a function of the total number of foci for treatment divided by the number of surviving cells estimated from the clonal efficiency observed in the cytotoxicity assay performed in parallel with the transformation.
The percentage of plates with foci with respect to the scored plates was calculated according to the Fisher–Yates test of significance in 2 × 2 contingency tables. The statistical analysis of the foci distribution was performed by the Mann–Whitney unpaired t-test. The TF significance was analyzed by the comparison of the Poisson rates, after verifying that the TF values would fit the Poisson distribution. The linear regression analysis and the Cochran–Armitage test for positive trends were applied to the TF dose-response curve in the cell transformation assay.

2.3.2. Colony Forming Efficiency Assay

The cytotoxicity assay was performed by seeding exponentially growing BALB/c 3T3 A31-1-1 cells at 250 cells/60 mm dish (Falcon, Becton Dickinson, Oxford, U.K.) in five replicates for each treatment. Plates were incubated at 37 °C in a 5% CO2 humidified atmosphere for 48 h. Then, cells were exposed to different concentrations of the environmental samples for 48 h. At the end of this period, the treatment was removed, and fresh culture medium was added to the plates. Cells were maintained in culture for 8–10 days, then fixed with methanol, stained with 10% aqueous Giemsa and scored for colony formation. Only colonies containing more than 50 cells were counted [16,17]. Untreated BALB/c 3T3 A31-1-1 cells and solvent-treated cells were used as negative controls.
The results were expressed as: (I) the mean number of colonies/plate ± standard error (SE); (II) the absolute clonal efficiency (ACE), i.e., the fraction of cells that survived chemical treatment with respect to the number of seeded cells; and (III) the relative clonal efficiency (RCE), which estimates the percent reduction of cell clonal efficiency in treated groups as compared to that of the relative control (vehicle-treated cells). The difference between the mean colony number in the treated group compared to the control group was evaluated by the Student’s t-test. The RCE was analyzed by the chi-square test of significance in 2 × 2 contingency tables. The relationship between the assayed doses and RCE was analyzed by using the linear regression analysis.

2.4. Microarray Experiments

A549 cells at a density of 2 × 10⁵ were seeded in 60-mm plates and incubated at 37 °C in a 5% CO2 humidified atmosphere. After 48 h, the cells were treated with PM2.5 extracts (8 m3 equivalents) for 4 h. At the end of the incubation time, total RNA was isolated from cells by using TRIzol Reagent (Life Technologies, Carlsbad, CA, USA) and purified on an RneasyR affinity column (Qiagen, Valencia, CA, USA). RNA quantification and quality were assessed respectively by a Nanodrop 1000 (Thermo Scientific, Wilmington, DE, USA) and an Agilent bioanalyzer 2100 using the RNA Nano kit (Agilent Technologies, Santa Clara, CA, USA).
Fluorescently-labeled cRNA was generated starting from 1 µg of total RNA by using the Low RNA Input Fluorescent Linear Amplification Kit (Agilent Technologies) according to the instructions from the supplier (Agilent Technologies). Cyanine 3-CTP (Cy3) (Perkin-Elmer, NEN Life Science, Boston, MA, USA) -labeled cRNAs were combined and purified with QIAquick spin columns (Qiagen) and then applied to the oligonucleotide slides (Whole Human Genome Microarray kit, 4 × 44 K), according to the Agilent 60-mer oligomicroarray processing protocol (G4140-90040_One-Color_GE_5.7, available online at Agilent Technologies) [18].
Slides were scanned in the Cy-3 channel with an Agilent’s High-Resolution C Scanner (Agilent, G2565AA). Scanned images were analyzed by the Agilent Feature Extraction software 9.1 to derive the raw intensity data used in the next steps of analysis.

3. Results and Discussion

3.1. Cell Transformation Assay

The CTA was performed treating cells with equivalent doses (m3) of organic extracts of PM2.5 or PM1 in order to highlight possible differences in the transforming or cytotoxic potential of the mixtures of chemicals associated with particles with different aerodynamic diameters.
The results from CTA conducted with PM2.5 and PM1 samples have been accepted, as all of the established acceptability criteria were fulfilled. As shown in Table 2, the positive control (3-MCA, 4.0 µg/mL) induced a significant increase in morphological transformation (10 plates positive/10 plates total, 75 foci), while the negative control (control-vehicle DMSO 0.5%) did not induce any increase in the same endpoint. Moreover, the total number of transformed foci detected in the positive control plates was two-times (or more) higher than the number observed in the DMSO-treated plates.
None of the organic extracts of PM2.5 or PM1 induced a significant increase in the average number of transformed foci/plate or in the transformation frequency of BALB/c 3T3 A31-1-1 cells (Table 2). Therefore, these samples were considered negative in the in vitro CTA, as they did not exhibit any transforming activity.
Table 2. The effects of the treatment with organic extracts of PM2.5 samples on the transformation rate of BALB/c 3T3 A31-1-1 cells. 3-MCA, methylcholanthrene.
TreatmentPlates with Foci/Plates Scored Mean No. of Transformed Foci/Plate ± SE RCE (%)TF (×10−4)
Untreated cells0/100960
DMSO 0.5%0/1001000
3-MCA 4.0 µg/mL10/10 a7.50 ± 0.78 b59 c12.91 d
PM1 (m3) 0
1.52/100.20 ± 0.13960.21
30/100960
60/10070 c0
120/9042 c0
PM2.5 (m3)
1.51/100.20 ± 0.201010.20
30/100980
60/10084 c0
121/100.10 ± 0.1049 c0.21
RCE = relative clonal efficiency; TF = transformation frequency. a Significantly different from control (solvent-treated plates) for the Fisher–Yates test of significance in 2 × 2 contingency tables (p < 0.01). b Significantly different (p < 0.01) from controls (solvent-treated cells) for the Mann–Whitney unpaired t-test. c Significantly different (p < 0.01) from controls (solvent-treated cells) for the chi-square test of significance in 2 × 2 contingency tables. d Significantly different (p < 0.01) from controls (solvent-treated cells) for the Poisson test.
The colony-forming efficiency assay was also performed in parallel with the CTA to calculate the number of cells surviving the chemical treatment, as well as to detect possible differences in the toxic response to environmental mixtures (Figure 1).
Figure 1. Cytotoxic effects induced by organic extracts of PM2.5 and PM1 (m3/plate).
Sustainability 06 05265 g001
** Significantly different from control (solvent-treated plates) for the t-test, one tailed (p < 0.01).
PM2.5 or PM1 organic extracts were both able to induce significant dose-dependent cytotoxicity as confirmed by linear regression analysis (PM2.5 p = 0.005; PM1 p = 0.003).
Previously reported data strongly support the use of in vitro alternative methods for the assessment of toxicity, genotoxicity or transforming potential of environmental mixtures extracted from particulate matter [19,20,21,22,23]. It has been reported that PM exhibits different toxicological characteristics according to the pollution source [20,23,24]. Moreover, biological effects are most associated with the fine and ultrafine fractions [24,25,26,27,28]. When considering treatments at equivalent volumes, no appreciable differences in the toxic behavior of PM2.5 or PM1 extracts were identified in our study that were possibly related to the aerodynamic diameter (Figure 1). When the dose-response curve was plotted as the function of the PM weight, PM1 appeared much more toxic (Figure 2), as confirmed by the calculation of the IC50 values (PM2.5 IC50 = 320.25 µg/plate; PM1 IC50 = 195.59 µg/plate).
Figure 2. Cytotoxic effects induced by organic extracts of PM2.5 and PM1 (µg/plate).
Sustainability 06 05265 g002
** Significantly different from control (solvent-treated plates) for the t-test, one tailed (p < 0.01).
The toxicological effects of airborne particulate have been correlated with the total amount of polycyclic aromatic hydrocarbons (PAHs) or modified PAHs measured in the extracts or in the sampled air [20,29,30,31,32,33,34]. Some PAHs and nitro-PAHs induce transformation in BALB/c 3T3 cells or in Bhas42 cells, which originates from the oncogenic transfection of 3T3 cells [35,36]. In 2010, IARC revised the classification of PAHs for carcinogenicity, taking into account the epidemiological evidence and results from bioassays and mechanistic in vitro studies that were available at the time [37]. From studies on binary mixtures of PAHs characterized by different carcinogenic potencies, it has been hypothesized that PAHs exhibit an additive behavior at high doses, which became more than additive at low and very low doses. The effect at higher doses could be due to metabolic saturation [37].
Recently, it has been demonstrated that it is not possible to predict the transforming potential of airborne samples from the quantity of PAHs in the samples, even if the TF correlates with the total amount of PM [23].
This finding supports the use of multiple approaches to evaluate the toxic potential of environmental pollutants, because they give a more complete picture of the real hazard of the environmental exposures. Environmental samples are complex mixtures of several chemicals, playing different roles in carcinogenesis, through different mechanisms of action, possibly leading to synergistic effects on the same outcome. The simple quantification of single carcinogenic compounds is not a proper approach to address such a complexity. Several airborne samples collected at the same site during different seasons will be analyzed in the near future, to confirm the reported possible differences in toxic outcomes correlated with the aerodynamic particle diameter.

3.2. Gene Expression

3.2.1. Experimental Design and Data Analysis

The experimental design was selected to minimize possible sources of technical and biological variability. A549 cells were exposed for 4 h to 8 m3 of PM2.5 extracts obtained from the MXW, CTW and GMA sites. DMSO solution (0.5%) was used as the negative control. Three biological replicates were performed from three different thawing A549 cells. Then, three technical replicates of microarray experiments were carried out by using mRNA pooled from the biological replicates.
The raw intensity data were normalized and filtered to remove the low intensity data and flagged features (saturated, not uniform or not above background in at least 50% of samples). To identify differentially expressed genes in the dataset, which included 23 samples belonging to seven experimental groups, the statistical tests (one-way ANOVA or t-test) implemented in GeneSpring GX were applied. The treatment with PM2.5 extracts elicited the modulation of 15,012 genes (one-way ANOVA, p < 0.01, Bonferroni correction). In Figure 3A, the principal component analysis (PCA) obtained by plotting the signal intensity of the differentially expressed genes is reported. The hierarchical cluster analysis of the transcriptional profile relative to the entire A549 microarray probe set filtered for low intensity values is presented in Figure 3B.
PCA, as well as hierarchical clustering suggested that the transcriptional response induced by PM2.5 extracts on A549 cells is affected more by the sampling site than the sampling season. Based on cluster distances, CTW and MXW samples appeared to differ more from the solvent-control-treated sample than from the sample collected at the urban background GMA site.
To evaluate the transcriptional effects related to the sites, further analysis were performed by using, for each site, the average values among winter and summer treatments. The results of the t-test are shown in Table 3. For each comparison, the number of differentially expressed genes (all, up- and down-regulated) with FDR < 0.01 (false discovery rate, Benjamini–Hochberg) and an absolute fold-change value greater than 1.5 was reported. The relatively high number of downregulated genes could imply the shutdown of many cellular processes immediately following the toxic insult [38].
Figure 3. PCA analysis and hierarchical clustering of the treatments based on the transcriptional profiles of the tested extracts in A549 cells. (A) PCA analysis of the treatments based on 15,012 differentially expressed genes (one-way ANOVA analysis) in A549 cells; (B) hierarchical cluster analysis (distance: Euclidean; linkage rule: Ward’s) of the transcriptional profile relative to the entire A549 microarray probe set filtered for low intensity values (log2 intensity value > 3, 29,312 genes). (Please provide a clearer figure with high resolution.)
Sustainability 06 05265 g003
Table 3. The number of differentially expressed genes in A549 cells (t-test, false discovery rate (FDR) < 0.01, absolute fold-change value greater than 1.5).
TitleA549 (t-test, FDR < 0.01, Fold-Change > 1.5)
Site
AllUpDown
MXW vs. GMA15305201010
CTW vs. GMA1305391914
MXW vs. CTW279142137

3.2.2. Biomarkers of Exposure

It has been reported that the majority of the environmental mixtures upregulate the gene expression, inducing pleiotropic responses in the cells, which eventually affects genes involved in the oxidative stress response, immune/inflammation response, xenobiotic metabolism, coagulation and fibrinolysis, proto-oncogenes, heat-shock response, DNA repair and extracellular matrix degradation [9]. Among modulated genes, heme oxygenase 1 (HMOX1), which is a marker of oxidative stress, and CYP1A1 are always upregulated by exposure to environmental mixtures of particulate matter, suggesting that long-term exposure to fine particles could represent an important health risk. Samples containing polycyclic aromatic hydrocarbons, dioxins and dioxins-like compounds could modulate the expression of genes involved in xenobiotic metabolism as CYP1A1 and CYP1B [39].
The expression fold-change values for CYP1A1, CYP1B1 and HMOX1 in A549 cells after the exposure to PM2.5 extracts are reported in Figure 4 on the Y-axis. The modulation of the expression of the markers of environmental exposure was confirmed for the genes involved inxenobiotic metabolism.
Figure 4. Gene expression analysis of CYP1A1, CYP1B1 and HMOX1 with respect to the solvent control. (A) Winter; (B) summer.
Sustainability 06 05265 g004

3.2.3. Biological Interpretation

The bioinformatics tool, Pathway-Express, was used (Intelligent Systems and Bioinformatics Laboratory [40]) to achieve a deeper understanding of the biological role and the interactions of the identified genes [41].
Pathway-Express was applied to each gene listed in Table 3 to extract from the Kyoto Encyclopedia of Genes and Genomes (KEGG) pathways (KEGG Kyoto Encyclopedia of Genes and Genomes) [42] the information to calculate the impact factor (IF), including the normalized fold change of the differentially expressed genes, the statistical significance of the set of pathway genes and the topology of the signaling pathway. This tool provided two types of p-values for each pathway, a classical p-value and a gamma p-value, derived from the impact analysis [41].
Table 4 reports all statistically significant KEGG pathways with an impact factor (IF) greater than 10 and a gamma p-value < 0.05.
We observed a general trend of gene down-modulation across the affected pathways. The same differentially expressed genes were shared between the two samples collected at the MXW and CTW sites. This result gives evidence for similar biological effects from the exposure to these samples and marks a dramatic difference with respect to the sample collected at GMA.
The leukocyte transendothelial migration pathway (Figure 5), as well as other pathways involved in the cell-cell and cell-substratum interactions, was affected in both of these comparisons. The modulation of the strength and extent of cell-cell or cell-substratum adhesion could be highly relevant in cellular processes requiring major changes in plasticity. Thus, the inhibition of cytoskeletal components and the disturbance of the adhesion systems could be accompanied by the acquisition of the locomotor phenotype and the increased motility of cells. Similar results were reported after acute exposure of human bronchial epithelial cells to whole cigarette smoke in vitro [38]. The observed inhibitory effect of smoke on the expression of genes involved in cellular adhesion provides a possible mechanism for smoke-induced epithelial permeability and has been associated with the development of diseases.
Table 4. Pathway-Express analysis: a list of KEGG pathways, ranked for the impact factor value, that resulted in being transcriptionally perturbated (impact factor (IF) > 10, gamma p-value < 0.05).
A549 Pathway-Express Analysis
MXW vs. GMACTW vs. GMAMXW vs. CTW
Cell adhesion molecules (CAMs)Cell adhesion molecules (CAMs)Antigen processing and presentation
Leukocyte transendothelial migrationLeukocyte transendothelial migrationPhosphatidylinositol signaling system
Adherens junction Adherens junction
Phosphatidylinositol signaling systemPhosphatidylinositol signaling system
Antigen processing and presentationCircadian rhythm
Tight junctionPathways in cancer
Focal adhesionNotch signaling pathway
Circadian rhythmNon-small cell lung cancer
Pathways in cancerEndometrial cancer
Insulin signaling pathwayUbiquitin mediated proteolysis
ErbB signaling pathwayWnt signaling pathway
Regulation of actin cytoskeletonBladder cancer
Endometrial cancerThyroid cancer
ShigellosisFocal adhesion
Pathogenic Escherichia coli infectionTight junction
T cell receptor signaling pathwayVibrio cholerae infection
Wnt signaling pathway
Alzheimer’s disease
GnRH signaling pathway
Type II diabetes mellitus
Notch signaling pathway
Colorectal cancer
MAPK signaling pathway
Renal cell carcinoma
Vibrio cholera infection
Figure 5. Leukocyte transendothelial migration KEGG, as obtained from Pathway-Express analysis of the lists for MXW vs. GMA (a) and CTW vs. GMA (b) in A549 cells. Red: upregulation. Blue: downregulation.
Sustainability 06 05265 g005
Furthermore, the KEGG “pathways in cancer” resulted in being significantly perturbated (IF > 10, gamma p-value < 0.05) by performing the analysis with the list of differentially expressed genes from the MXW vs. GMA and CTW vs. GMA comparison. Among the modulated genes, the downregulation of p53 and CASP8, an initiator caspase of the apoptotic cascade, were recorded. The implication of p53 in cell death is well documented [43]. In normal cells, this tumor suppressor is present in an active form and is maintained at a low level of expression. However, following DNA damage, p53 is rapidly activated by transcription and phosphorylation at different sites. Cell death can be induced by p53, either directly, by activating mitochondrial proapoptotic pathways, or indirectly, by acting as a transcription factor for proapoptotic genes. These results suggest that, even if we were unable to highlight the transforming effects in the BALB/c 3T3 CTA, the observed cytotoxicity may reflect p53 signaling pathway-mediated apoptosis as a critical step related to oxidative stress.
Data from Pathway-Express analysis were confirmed by gene set enrichment analysis (GSEA). Table 5 shows the number of KEGG enriched by considering an FDR < 0.25 for the CTW vs. MXW comparison and an FDR > 0.25 for the other comparisons. The specific KEGG pathways are then reported in Table 6. The transcriptional response to PM extracts was significantly enriched in GMA, and subsequently, the same processes were downregulated in MXW and CTW.
Table 5. Gene set enrichment analysis (GSEA): the number of gene sets (KEGG pathways) enriched in A549 after treatment with the PM2.5 extracts.
A549
GSEAKEGG Pathways (FDR < 0.25)
VersusMXWCTWGMA
Enriched in
MXW/00
CTW16/1
GMA9886/
In Table 6, the list of the 16 KEGG pathways that resulted in being significantly enriched (FDR < 0.25) in CTW vs. MXW is reported. The transcriptional effects on cell adhesion were confirmed by GSEA, which also underlined the enrichment in biological processes converging on glycolysis/diabetes and cancer. GSEA results did not show any significant enrichment when comparing MXW with GMA, while the comparison between CTW and GMA highlighted one significantly enriched KEGG, systemic lupus erythematosus (SLE). GSEA results substantially confirmed and deepened Pathway-Express outputs. There is increasing evidence that 70% to 90% disease risks are associated with exposure to environments, including the internal environment (body) and the external environment [44]. Autoimmune diseases are thought to be affected by environmental pollutants, and SLE has been linked to occupational exposures, including silicate and asbestos. Interestingly, the main gene pathway that is affected by PM exposure is represented by leukocyte transendothelial migration, with the upregulation of cell adhesion molecules (CAMs). The upregulation of CAMs has been described in vasculopathy and vasculitis, which are the typical complications of SLE, characterized by the deposition of immune complexes in endothelium, endothelial activation and inflammatory cell infiltration [45].
Table 6. GSEA analysis. The list of KEGG pathways, ranked for enrichment score, significantly enriched (FDR < 0.25) in A549 cells in CTW vs. MXW. For the MXW vs. GMA and CTW vs. GMA comparisons, the list of the first five KEGG pathways, ranked for enrichment score (FDR > 0.25), is reported.
A549 GSEA Analysis KEGG Pathways
Enriched in MXW vs. GMASignificantly Enriched in CTW vs. GMASignificantly Enriched in CTW vs. MXW
Oxidative PhosphorylationSystemic Lupus Erythematosus (significant)VEGF Signaling Pathway
Parkinson’s Disease Oxidative PhosphorylationGlycine Serine and Threonine Metabolism
Protein ExportParkinson’s DiseaseMaturity Onset Diabetes of The Young
Systemic Lupus ErythematosusIntestinal Immune Network For Iga ProductionColorectal Cancer
Biosynthesis of Unsaturated Fatty AcidsNeuroactive Ligand Receptor InteractionProstate Cancer
Pentose Phosphate Pathway
Leukocyte Transendothelial Migration
B-Cell Receptor Signaling Pathway
Regulation of Actin Cytoskeleton
Hedgehog Signaling Pathway
Primary Immunodeficiency

4. Conclusions

The evaluation of the toxicity and carcinogenicity of complex mixtures by alternative methods to animal bioassays could help in the prediction of risk linked to carcinogenic compounds present in the environmental sample.
The association between results derived from in vitro toxicology assays, expression profiles and health outcomes needs further characterization before gene expression profiling data could be completely incorporated into the risk-assessment process. However, the global gene expression profiling performed in vitro demonstrated that, despite the difference in the cell types, microarray platforms, incubation time and PM sources and doses, common sets of genes and pathways were modified by PM exposure, and the results were consistent with those observed in animal studies [
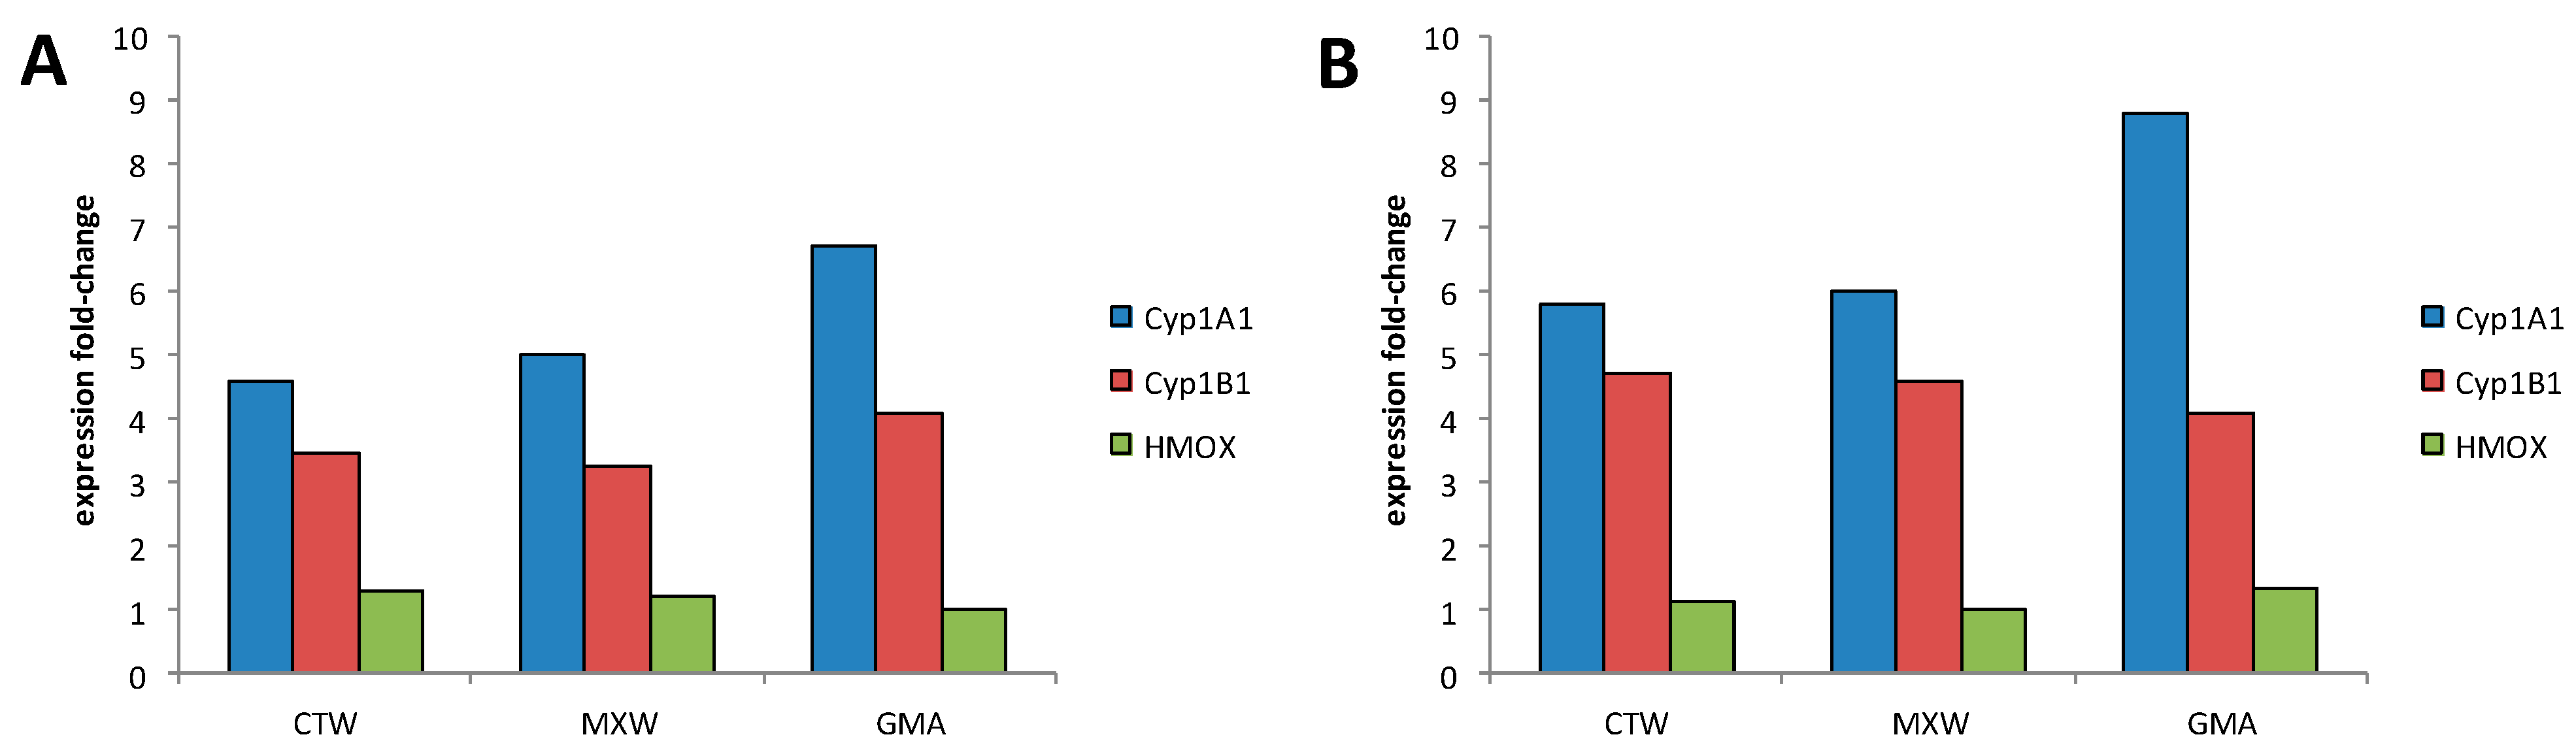
46]. Our data on biomarkers of exposure confirmed the induction of common genes related to xenobiotic metabolism and, to a lesser extent, oxidative stress. Our results demonstrated also that it is possible to differentiate environmental samples on the bases of transcriptomic profiles, stressing differences that could be possibly related to local sources of pollution. Moreover, the identification of the involvement of the adhesion process in pathways underlying the adverse health effects induced by PM could be used as supporting evidence for human exposure studies.
These findings strongly support our approach, suggesting that gene expression data coupled with in vitro assays could drive the identification of indicators of adverse health effects due to a complex mixture exposure and could be valuable in supporting the prediction of risk from environmental exposure.

Acknowledgments

This work was supported by the Emilia Romagna Region (“Moniter project” and “Supersite project”). We would like to thank the Environmental Mutagenesis Thematic Laboratory—Environmental Protection and Health Prevention Agency-Emilia Romagna (ER-EPA) for the preparation of the PM extracts.

Author Contributions

Annamaria Colacci coordinated all of the research activities within the two work packages on toxicology; she also deeply revised the manuscript. Monica Vaccari coordinated the experimental activity on CTAs, contributed to the study design and prepared the first draft of the manuscript. Maria Grazia Mascolo drafted the microarray results and contributed to the data revision and figures and tables preparation. Francesca Rotondo, Cristina Zanzi and Stefania Serra performed the in vitro experiments and CTA data collection and collation. Elena Morandi performed the microarray experiments and the Pathway-Express and GSEA analysis of microarray data. Daniele Quercioli contributed to the study design for gene expression, analyzed the microarray data and performed the statistical analysis. Stefania Perdichizzi critically revised the gene expression data and contributed to the biological interpretation of the gene pathways. Vanes Poluzzi coordinated the activities related to ambient air sampling, PM measurements and chemical determinations. Paola Angelini coordinated the activities related to human health included in the Moniter and Supersite projects. Sandro Grilli contributed to the study design. Franco Zinoni is a member of the Steering Committee of the Supersite project and a scientific advisor.

Conflicts of Interest

The authors declare no conflict of interest.

References

  1. Jarvis, I.W.; Dreij, K.; Mattsson, A.; Jernstrom, B.; Stenius, U. Interactions between polycyclic aromatic hydrocarbons in complex mixtures and implications for cancer risk assessment. Toxicology 2014, 321, 27–39. [Google Scholar] [CrossRef]
  2. Pope, C.A., 3rd; Burnett, R.T.; Krewski, D.; Jerrett, M.; Shi, Y.; Calle, E.E.; Thun, M.J. Cardiovascular mortality and exposure to airborne fine particulate matter and cigarette smoke: Shape of the exposure-response relationship. Circulation 2009, 120, 941–948. [Google Scholar]
  3. Loomis, D.; Grosse, Y.; Lauby-Secretan, B.; Ghissassi, F.E.; Bouvard, V.; Benbrahim-Tallaa, L.; Guha, N.; Baan, R.; Mattock, H.; Straif, K. The carcinogenicity of outdoor air pollution. Lancet Oncol. 2013, 14, 1262–1263. [Google Scholar] [CrossRef]
  4. Vasseur, P.; Lasne, C. Oecd detailed review paper (drp) number 31 on “Cell transformation assays for detection of chemical carcinogens”: Main results and conclusions. Mutat. Res. 2012, 744, 8–11. [Google Scholar] [CrossRef]
  5. Lilienblum, W.; Dekant, W.; Foth, H.; Gebel, T.; Hengstler, J.G.; Kahl, R.; Kramer, P.J.; Schweinfurth, H.; Wollin, K.M. Alternative methods to safety studies in experimental animals: Role in the risk assessment of chemicals under the new european chemicals legislation (reach). Arch. Toxicol. 2008, 82, 211–236. [Google Scholar]
  6. Vanparys, P.; Corvi, R.; Aardema, M.; Gribaldo, L.; Hayashi, M.; Hoffmann, S.; Schechtman, L. Ecvam prevalidation of three cell transformation assays. Altex 2011, 28, 56–59. [Google Scholar] [CrossRef]
  7. Corvi, R.; Aardema, M.J.; Gribaldo, L.; Hayashi, M.; Hoffmann, S.; Schechtman, L.; Vanparys, P. Ecvam prevalidation study on in vitro cell transformation assays: General outline and conclusions of the study. Mutat. Res. 2012, 744, 12–19. [Google Scholar]
  8. Kakunaga, T. Critical review of the use of established cell lines for in vitro cell transformation. IARC Sci. Publ. 1985, 67, 55–73. [Google Scholar]
  9. Sen, B.; Mahadevan, B.; DeMarini, D.M. Transcriptional responses to complex mixtures: A review. Mutat. Res. 2007, 636, 144–177. [Google Scholar]
  10. Gualtieri, M.; Mantecca, P.; Corvaja, V.; Longhin, E.; Perrone, M.G.; Bolzacchini, E.; Camatini, M. Winter fine particulate matter from milan induces morphological and functional alterations in human pulmonary epithelial cells (a549). Toxicol. Lett. 2009, 188, 52–62. [Google Scholar] [CrossRef]
  11. Roig, N.; Sierra, J.; Rovira, J.; Schuhmacher, M.; Domingo, J.L.; Nadal, M. In vitro tests to assess toxic effects of airborne pm(10) samples. Correlation with metals and chlorinated dioxins and furans. Sci. Total Environ. 2013, 443, 791–797. [Google Scholar] [CrossRef]
  12. Foster, K.A.; Oster, C.G.; Mayer, M.M.; Avery, M.L.; Audus, K.L. Characterization of the a549 cell line as a type II pulmonary epithelial cell model for drug metabolism. Exp. Cell Res. 1998, 243, 359–366. [Google Scholar] [CrossRef]
  13. Mascolo, M.G.; Perdichizzi, S.; Rotondo, F.; Morandi, E.; Guerrini, A.; Silingardi, P.; Vaccari, M.; Grilli, S.; Colacci, A. Balb/c 3t3 cell transformation assay for the prediction of carcinogenic potential of chemicals and environmental mixtures. Toxicol. In Vitro 2010, 24, 1292–1300. [Google Scholar] [CrossRef]
  14. Colacci, A.; Mascolo, M.G.; Perdichizzi, S.; Quercioli, D.; Gazzilli, A.; Rotondo, F.; Morandi, E.; Guerrini, A.; Silingardi, P.; Grilli, S.; et al. Different sensitivity of balb/c 3t3 cell clones in the response to carcinogens. Toxicol. In Vitro 2011, 25, 1183–1190. [Google Scholar] [CrossRef]
  15. Sasaki, K.; Bohnenberger, S.; Hayashi, K.; Kunkelmann, T.; Muramatsu, D.; Poth, A.; Sakai, A.; Salovaara, S.; Tanaka, N.; Thomas, B.C.; et al. Photo catalogue for the classification of foci in the balb/c 3t3 cell transformation assay. Mutat. Res. 2012, 744, 42–53. [Google Scholar] [CrossRef]
  16. Group, I.N.E.W. Cellular and molecular mechanisms of cell transformation and standardization of transformation assays of established cell lines for the prediction of carcinogenic chemicals: Overview and recommended protocols. Cancer Res. 1985, 45, 2395–2399. [Google Scholar]
  17. Franken, N.A.; Rodermond, H.M.; Stap, J.; Haveman, J.; van Bree, C. Clonogenic assay of cells In Vitro. Nat. Protoc. 2006, 1, 2315–2319. [Google Scholar] [CrossRef]
  18. Agilent Technologies. Available online: www.chem.agilent.com (accessed on 11 August 2014).
  19. Billet, S.; Abbas, I.; le Goff, J.; Verdin, A.; Andre, V.; Lafargue, P.E.; Hachimi, A.; Cazier, F.; Sichel, F.; Shirali, P.; et al. Genotoxic potential of polycyclic aromatic hydrocarbons-coated onto airborne particulate matter (pm 2.5) in human lung epithelial a549 cells. Cancer Lett. 2008, 270, 144–155. [Google Scholar] [CrossRef]
  20. Colacci, A.; Vaccari, M.; Silingardi, P.; Horn, W.; Mascolo, M.G.; Perdichizzi, S.; Rotondo, F.; Poluzzi, V.; Belladonna, V.; Grilli, S. In vitro endpoints to profile risks associated with waste incineration. Toxicol. Lett. 2007, 172, S113–S114. [Google Scholar]
  21. De Kok, T.M.; Hogervorst, J.G.; Briede, J.J.; van Herwijnen, M.H.; Maas, L.M.; Moonen, E.J.; Driece, H.A.; Kleinjans, J.C. Genotoxicity and physicochemical characteristics of traffic-related ambient particulate matter. Environ. Mol. Mutagen. 2005, 46, 71–80. [Google Scholar] [CrossRef]
  22. Don Porto Carero, A.; Hoet, P.H.; Verschaeve, L.; Schoeters, G.; Nemery, B. Genotoxic effects of carbon black particles, diesel exhaust particles, and urban air particulates and their extracts on a human alveolar epithelial cell line (a549) and a human monocytic cell line (thp-1). Environ. Mol. Mutagen. 2001, 37, 155–163. [Google Scholar] [CrossRef]
  23. Ohmori, K.; Sato, Y.; Nakajima, D.; Kageyama, S.; Shiraishi, F.; Fujimaki, T.; Goto, S. Characteristics of the transformation frequency at the tumor promotion stage of airborne particulate and gaseous matter at ten sites in japan. Environ. Sci. Process. Impacts 2013, 15, 1031–1040. [Google Scholar] [CrossRef]
  24. De Kok, T.M.; Driece, H.A.; Hogervorst, J.G.; Briede, J.J. Toxicological assessment of ambient and traffic-related particulate matter: A review of recent studies. Mutat. Res. 2006, 613, 103–122. [Google Scholar] [CrossRef]
  25. Englert, N. Fine particles and human health—A review of epidemiological studies. Toxicol. Lett. 2004, 149, 235–242. [Google Scholar] [CrossRef]
  26. Grahame, T.J.; Schlesinger, R.B. Health effects of airborne particulate matter: Do we know enough to consider regulating specific particle types or sources? Inhal. Toxicol. 2007, 19, 457–481. [Google Scholar] [CrossRef]
  27. Kampa, M.; Castanas, E. Human health effects of air pollution. Environ. Pollut. 2008, 151, 362–367. [Google Scholar] [CrossRef]
  28. Novak, J.; Hilscherova, K.; Landlova, L.; Cupr, P.; Kohut, L.; Giesy, J.P.; Klanova, J. Composition and effects of inhalable size fractions of atmospheric aerosols in the polluted atmosphere. Part ii. In vitro biological potencies. Environ. Int. 2014, 63, 64–70. [Google Scholar] [CrossRef]
  29. De Martinis, B.S.; Kado, N.Y.; de Carvalho, L.R.; Okamoto, R.A.; Gundel, L.A. Genotoxicity of fractionated organic material in airborne particles from sao paulo, brazil. Mutat. Res. 1999, 446, 83–94. [Google Scholar] [CrossRef]
  30. Zhao, X.; Wan, Z.; Zhu, H.; Chen, R. The carcinogenic potential of extractable organic matter from urban airborne particles in shanghai, china. Mutat. Res. 2003, 540, 107–117. [Google Scholar] [CrossRef]
  31. McDonald, J.D.; Eide, I.; Seagrave, J.; Zielinska, B.; Whitney, K.; Lawson, D.R.; Mauderly, J.L. Relationship between composition and toxicity of motor vehicle emission samples. Environ. Health Perspect. 2004, 112, 1527–1538. [Google Scholar] [CrossRef]
  32. Gabelova, A.; Valovicova, Z.; Horvathova, E.; Slamenova, D.; Binkova, B.; Sram, R.J.; Farmer, P.B. Genotoxicity of environmental air pollution in three european cities: Prague, Kosice and Sofia. Mutat. Res. 2004, 563, 49–59. [Google Scholar] [CrossRef]
  33. Sharma, A.K.; Jensen, K.A.; Rank, J.; White, P.A.; Lundstedt, S.; Gagne, R.; Jacobsen, N.R.; Kristiansen, J.; Vogel, U.; Wallin, H. Genotoxicity, inflammation and physico-chemical properties of fine particle samples from an incineration energy plant and urban air. Mutat. Res. 2007, 633, 95–111. [Google Scholar] [CrossRef]
  34. Kang, Y.; Cheung, K.C.; Wong, M.H. Polycyclic aromatic hydrocarbons (pahs) in different indoor dusts and their potential cytotoxicity based on two human cell lines. Environ. Int. 2010, 36, 542–547. [Google Scholar] [CrossRef]
  35. Asada, S.; Sasaki, K.; Tanaka, N.; Takeda, K.; Hayashi, M.; Umeda, M. Detection of initiating as well as promoting activity of chemicals by a novel cell transformation assay using v-ha-ras-transfected balb/c 3t3 cells (bhas 42 cells). Mutat. Res. 2005, 588, 7–21. [Google Scholar] [CrossRef]
  36. Sasaki, K.; Mizusawa, H.; Ishidate, M.; Tanaka, N. Establishment of a highly reproducible transformation assay of a ras-transfected balb 3t3 clone by treatment with promoters. Basic Life Sci. 1990, 52, 411–416. [Google Scholar]
  37. International Agency for Research on Cancer. IARC Monographs on the Evaluation of Carcinogenic Risks to Humans; WHO Document Production Services: Geneva, Switzerland, 2010. [Google Scholar]
  38. Maunders, H.; Patwardhan, S.; Phillips, J.; Clack, A.; Richter, A. Human bronchial epithelial cell transcriptome: Gene expression changes following acute exposure to whole cigarette smoke in vitro. Am. J. Physiol. Lung Cell Mol. Physiol. 2007, 292, L1248–L1256. [Google Scholar]
  39. Musafia-Jeknic, T.; Mahadevan, B.; Pereira, C.; Baird, W.M. Long-term effects of a standardized complex mixture of urban dust particulate on the metabolic activation of carcinogenic polycyclic aromatic hydrocarbons in human cells in culture. Toxicol. Sci. 2005, 88, 358–366. [Google Scholar] [CrossRef]
  40. Intelligent Systems and Bioinformatics Laboratory. Available online: http://vortex.cs.wayne.edu/projects.htm (accessed on 11 August 2014).
  41. Draghici, S.; Khatri, P.; Tarca, A.L.; Amin, K.; Done, A.; Voichita, C.; Georgescu, C.; Romero, R. A systems biology approach for pathway level analysis. Genome Res. 2007, 17, 1537–1545. [Google Scholar]
  42. KEGG Kyoto Encyclopedia of Genes and Genomes. Available online: http://www.genome.jp/kegg/ (accessed on 11 August 2014).
  43. Pietsch, E.C.; Sykes, S.M.; McMahon, S.B.; Murphy, M.E. The p53 family and programmed cell death. Oncogene 2008, 27, 6507–6521. [Google Scholar] [CrossRef]
  44. Bogdanos, D.P.; Smyk, D.S.; Invernizzi, P.; Rigopoulou, E.I.; Blank, M.; Sakkas, L.; Pouria, S.; Shoenfeld, Y. Tracing environmental markers of autoimmunity: Introducing the infectome. Immunol. Res. 2013, 56, 220–240. [Google Scholar] [CrossRef]
  45. Sun, W.; Jiao, Y.; Cui, B.; Gao, X.; Xia, Y.; Zhao, Y. Immune complexes activate human endothelium involving the cell-signaling hmgb1-rage axis in the pathogenesis of lupus vasculitis. Lab. Investig. 2013, 93, 626–638. [Google Scholar] [CrossRef]
  46. Huang, Y.C. The role of in vitro gene expression profiling in particulate matter health research. J Toxicol. Environ. Health B Crit. Rev. 2013, 16, 381–394. [Google Scholar] [CrossRef]

