1. Introduction
Global warming has affected Korea by contributing to increased localized heavy rainfall, leading to floods and resulting in substantial and repetitive damages [
1]. Floods have been a key concern in Korea’s water resources policy, since they not only cause material damages but also cause significant loss of life [
2]. Therefore, the government implements structural and non-structural flood damage prevention policies to reduce flood damages.
Structural and non-structural measures have been implemented to cope with the resultant flood damages [
3]. Structural measures are strategies to control floods using a variety of structures, such as seawalls, dams, levees, and channels. Non-structural measures, as their name suggests, are not built, and they include directing land use away from hazardous areas, flood risk mapping, educating citizens by disseminating information on floods and flood-risk areas, protecting sensitive areas, using early warning systems, undertaking risk communication and sensitization, and devising and managing insurance arrangements [
4,
5]. Structural measures to prevent flood damage are based on estimations of predicted damages, and their effectiveness can be quantitatively determined. However, these measures are rarely cost effective and may modify the environment around them. On the other hand, while non-structural measures are relatively more economical and cost effective over the long term, it is difficult to analyze their preventive effects.
Thus, there is a need to determine how these structural and non-structural measures can be applied to produce the desired effects. To do so, first, the effects of the structural and non-structural measures on flood damage prevention should be verified reliably. We examine the rational basis of numerous studies that used structural and non-structural measures as data sources for flood risk analysis, to appraise the respective flood prevention policies and assess the costs of flood risk management.
Some studies on structural mitigation measures have estimated the amount of flood damages from existing structural defenses. Lung-Sheng
et al. [
6] evaluated the efficacy of three types of structural measures proposed for flood damage prevention by using hydrological analysis and hydraulic routings. Ahn [
7] simulated alternative solutions to structural measures used during flood drainage and analyzed the efficacy of flood mitigation measures. However, non-structural measures were limited to production of a flood inundation map and a qualitative assessment of its effectiveness. Poussin
et al. [
8] estimated the effect of structural measures on reducing flood damage, as well as cost effectiveness for homes, through a survey conducted in three sample regions in France. Some structural measures were shown to diminish flood damage but it was suggested that damage differs depending on regional characteristics.
Studies on non-structural measures include Schröter
et al. [
9], who used survey data to quantify the damage mitigation effects of flood forecasting and warning time. Faisal
et al. [
10] performed on-site investigations and interviews of residents in areas damaged by the 1988 flood. Other studies have analyzed the effects of education on flood damages management. Manoloche [
11] cited US data indicating that high quality delivery of education, planning, and response resulted in a 70 percent reduction in insured damages over a 10-year period for commercial premises. Assuming a business-as-usual scenario, Somek [
12] suggested that the flood risk strategies including community education in Victoria, Canada, could reduce the potential for flood risk in the next 50 years from CAD 745.5 million to CAD 410.6 million.
Other studies have considered not only structural and non-structural measures but also the social, economic, and environmental factors that cause flood damage. Jonkman
et al. [
13] analyzed the direct and indirect effects of flood damage control efforts through a framework that integrates economic, political, social, and psychological damage factors. Naturally, data on structural measures was also included in these studies. Dawson and Hall [
14] conducted a simulation risk analysis of climate change, shoreline management, and socioeconomic scenarios along the coast of England. Van Stokkom
et al. [
15] investigated flood mitigation scenarios that account for climate change and the vulnerability of the floodplain area in the Netherlands. dos Santos and Tavares [
16] tries to prioritize flood risk management strategies based on territorial (physical, demographic and socioeconomic data) and damage data, differentiating three contiguous watersheds. In conclusion, these studies showed that, among the many factors contributing to flood damage, socioeconomic factors are extremely important. In a study looking at the influence of geological factors, Gutiérrez
et al. [
17] proposed that karst landscapes are particularly susceptible to natural disasters, including floods. Furthermore, development and land use that does not take this into account will lead to further destruction of the karst landscape and ultimately worsen any damage caused by natural disasters.
Thus, all the previous studies focused on quantitative and policy implications of flood mitigation measures. However, some of these studies suffer certain limitations. First, while some researchers used appropriate methods to assess the effects of structural measures, the ability of the data to provide comprehensive results is restricted, because the data did not cover important geophysical, social, and economic characteristics. In other words, the geophysical, social, and economic variables employed in these studies did not consider regional variations. In general, such data are difficult to obtain, and as such, they cannot be used to construct indexes. Thus, proxy indexes have been used to generalize the results. Second, it is difficult to verify the effects of non-structural measures because of analytical or design limitations, such as heavy reliance on surveys, the analytical hierarchy process, and/or fragmentary comparative analysis. Third, the existing studies do not implement an analysis of actual proof of flood damage mitigation measures in long-term. There is therefore a need for analytical methods that not only address different aspects of flood damages but also accomplish this with high reliability. Therefore, the objectives of this study are to empirically analyze the characteristics of flood damages in Korea and the effects of flood damage prevention measures employed in the country, both structural and non-structural, on the extent of flood damages.
2. Experimental Method
This study comprises three steps: (1) development of the research design; (2) analysis of flood damage characteristics in Korea; and (3) analysis of the effects of mitigation measures on flood damage prevention. The first step involves a theoretical appraisal of the structural and non-structural measures for flood damage mitigation in Korea. Thereafter, hypotheses are devised to determine the prevention effects and choose the measurable and applicable variables. Then, relevant data are collected for the analysis. By considering major flood events, the second step examines the characteristics of flood damages in Korea, using a qualitative analysis of spatial and temporal changes and trends in social and environmental conditions, including precipitation. The third step analyzes the effects of flood damage mitigation prevention measures using an intervention time series model. The presentation of the analytical results is followed by a discussion of the policy significance of the results.
2.1. Research Design
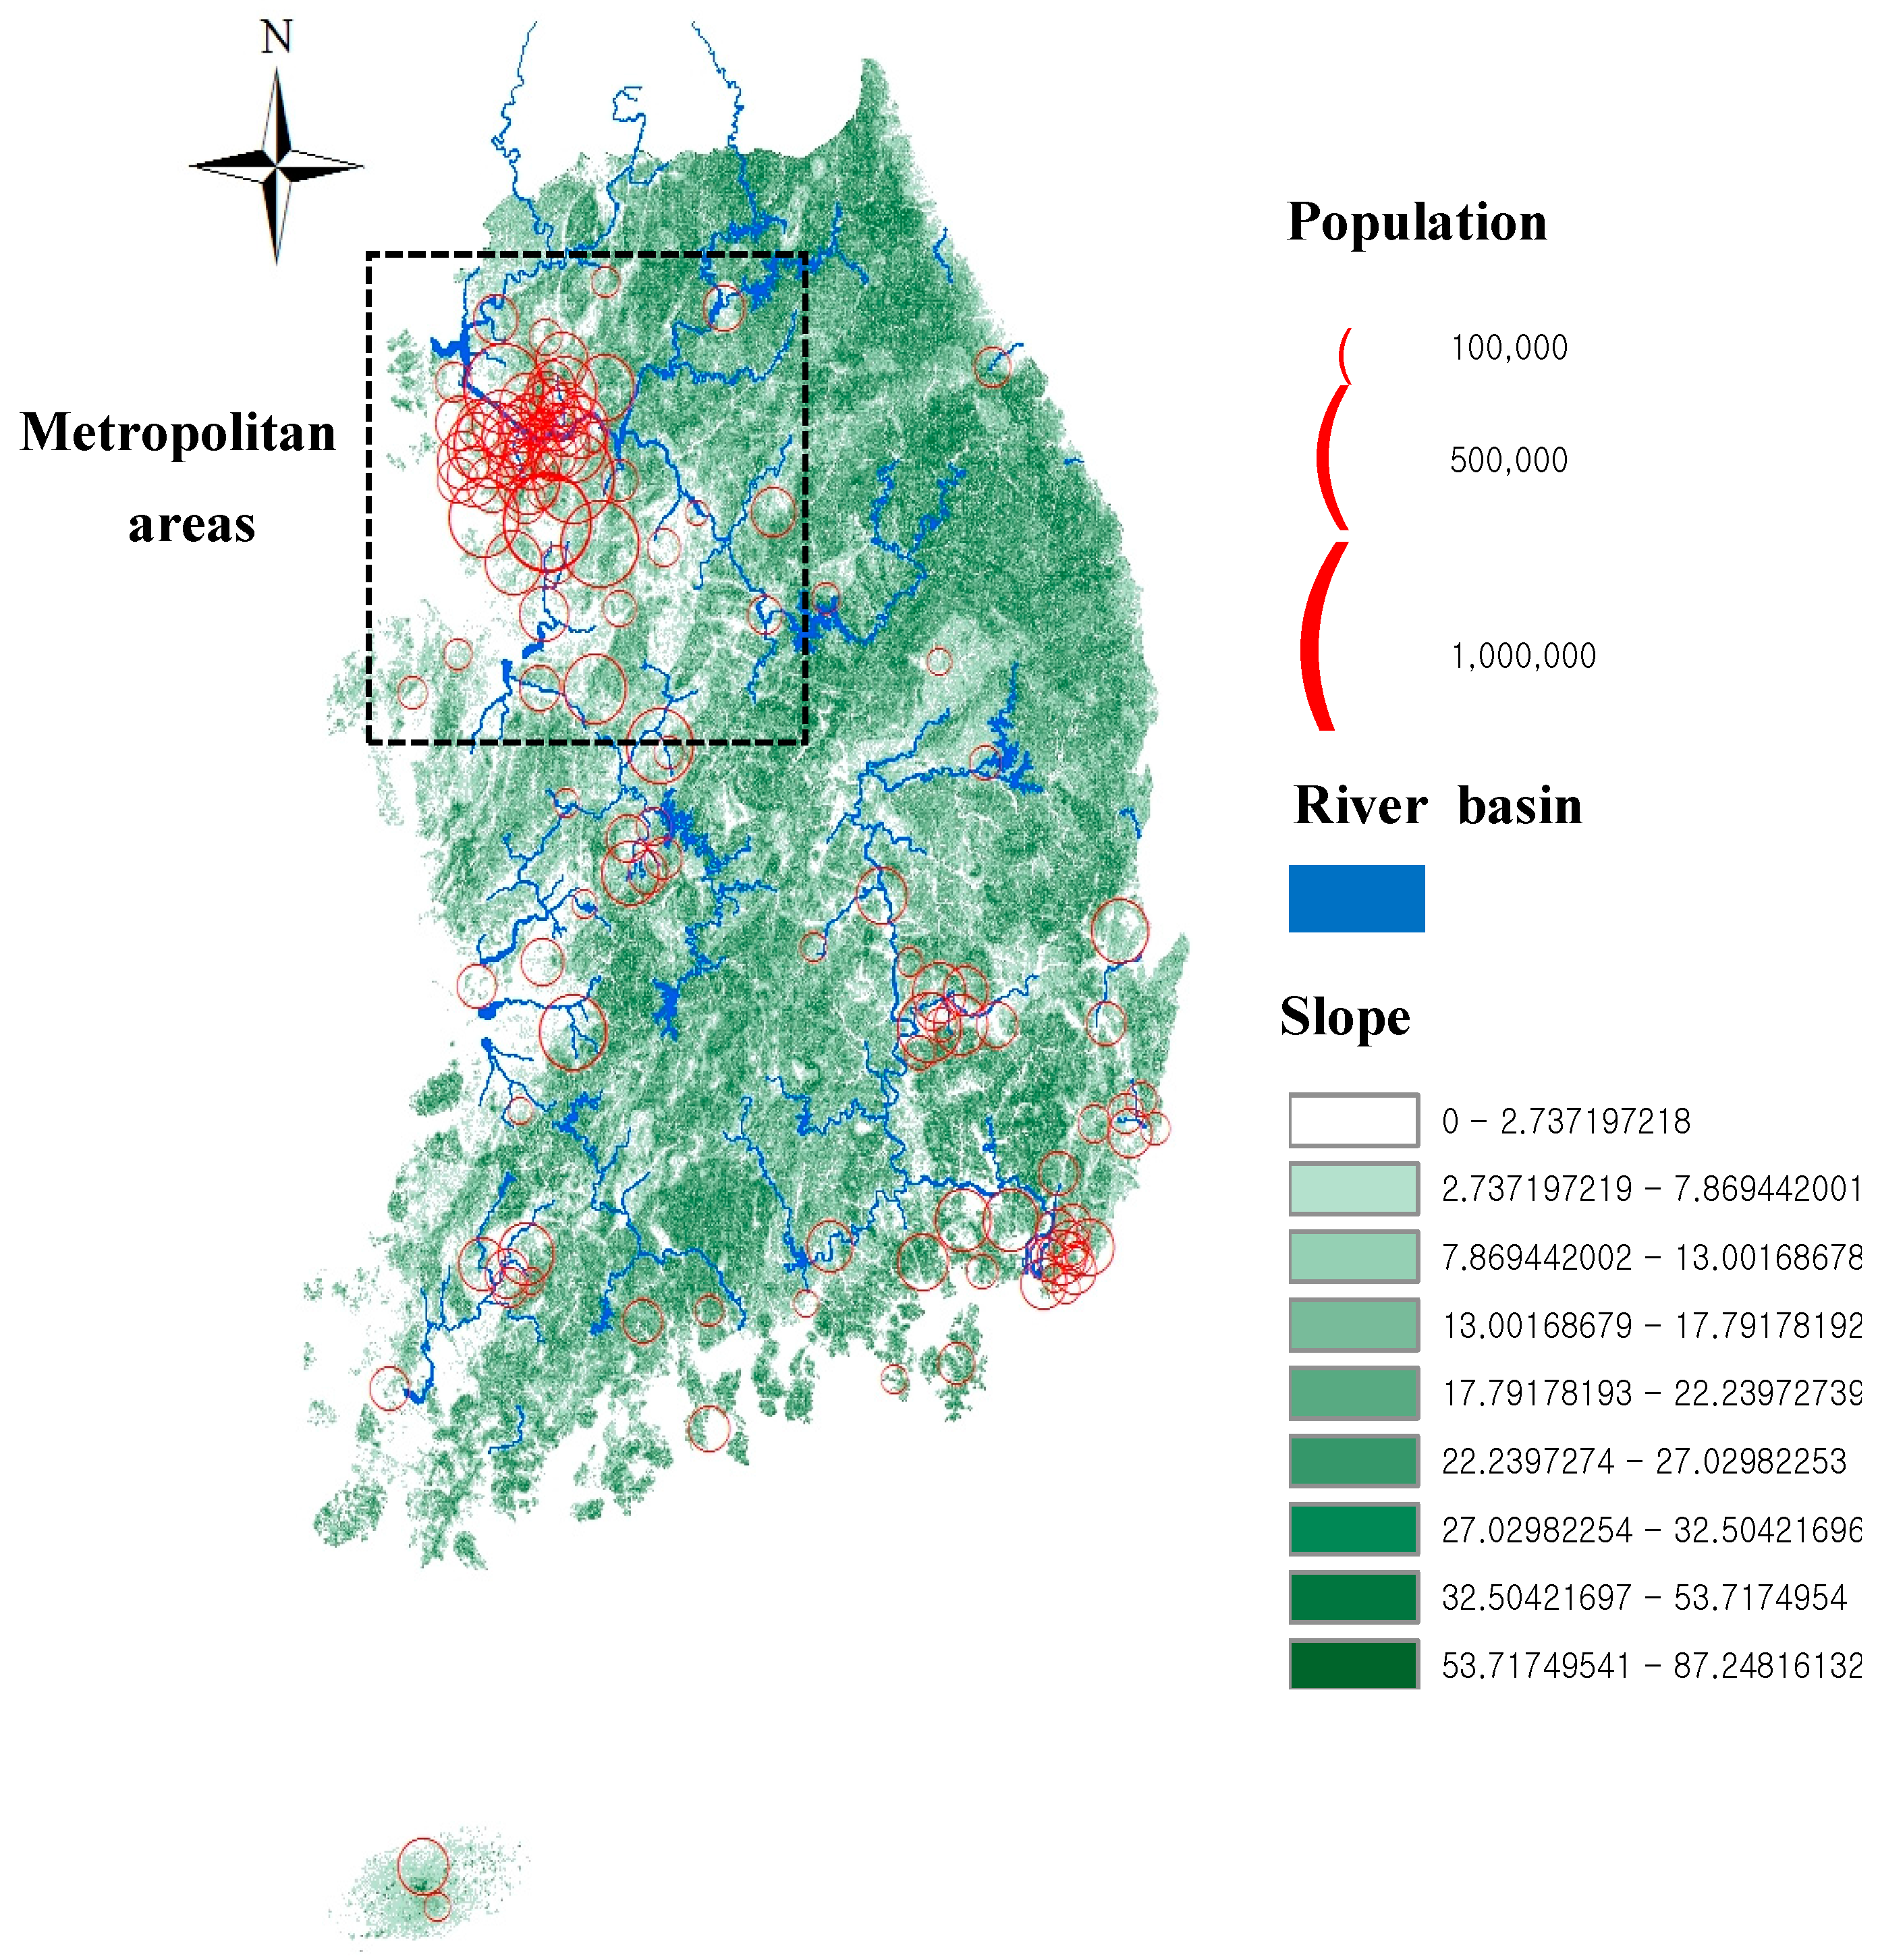
The study area covers the entire territory of the Republic of Korea. Korea is a peninsula and the total land area including its islands measures 12,833 km
2. Over 70 percent of the land is mountainous [
18]. Mountains with an altitude of more than 1000 m above sea level are located in the eastern part, while urban settlements are prominent in the western part, which consists of low and flat hilly plains (see
Figure 1). Korea is home to 4 rivers—the Han, Nakdong, Geum and Yeongsan—which give rise to 14 major tributaries. The rivers are highly prone to flooding because of their short water course extensions and steep slopes in the mountainous areas. The thin soil cover and low moisture-containing capacity cause frequent weathering and erosion during and after heavy rain. The resulting soil runoff accelerates flood damages. The country’s capital houses 24,988,368 people, nearly half of the Korean population (49.25 percent) [
19] (see
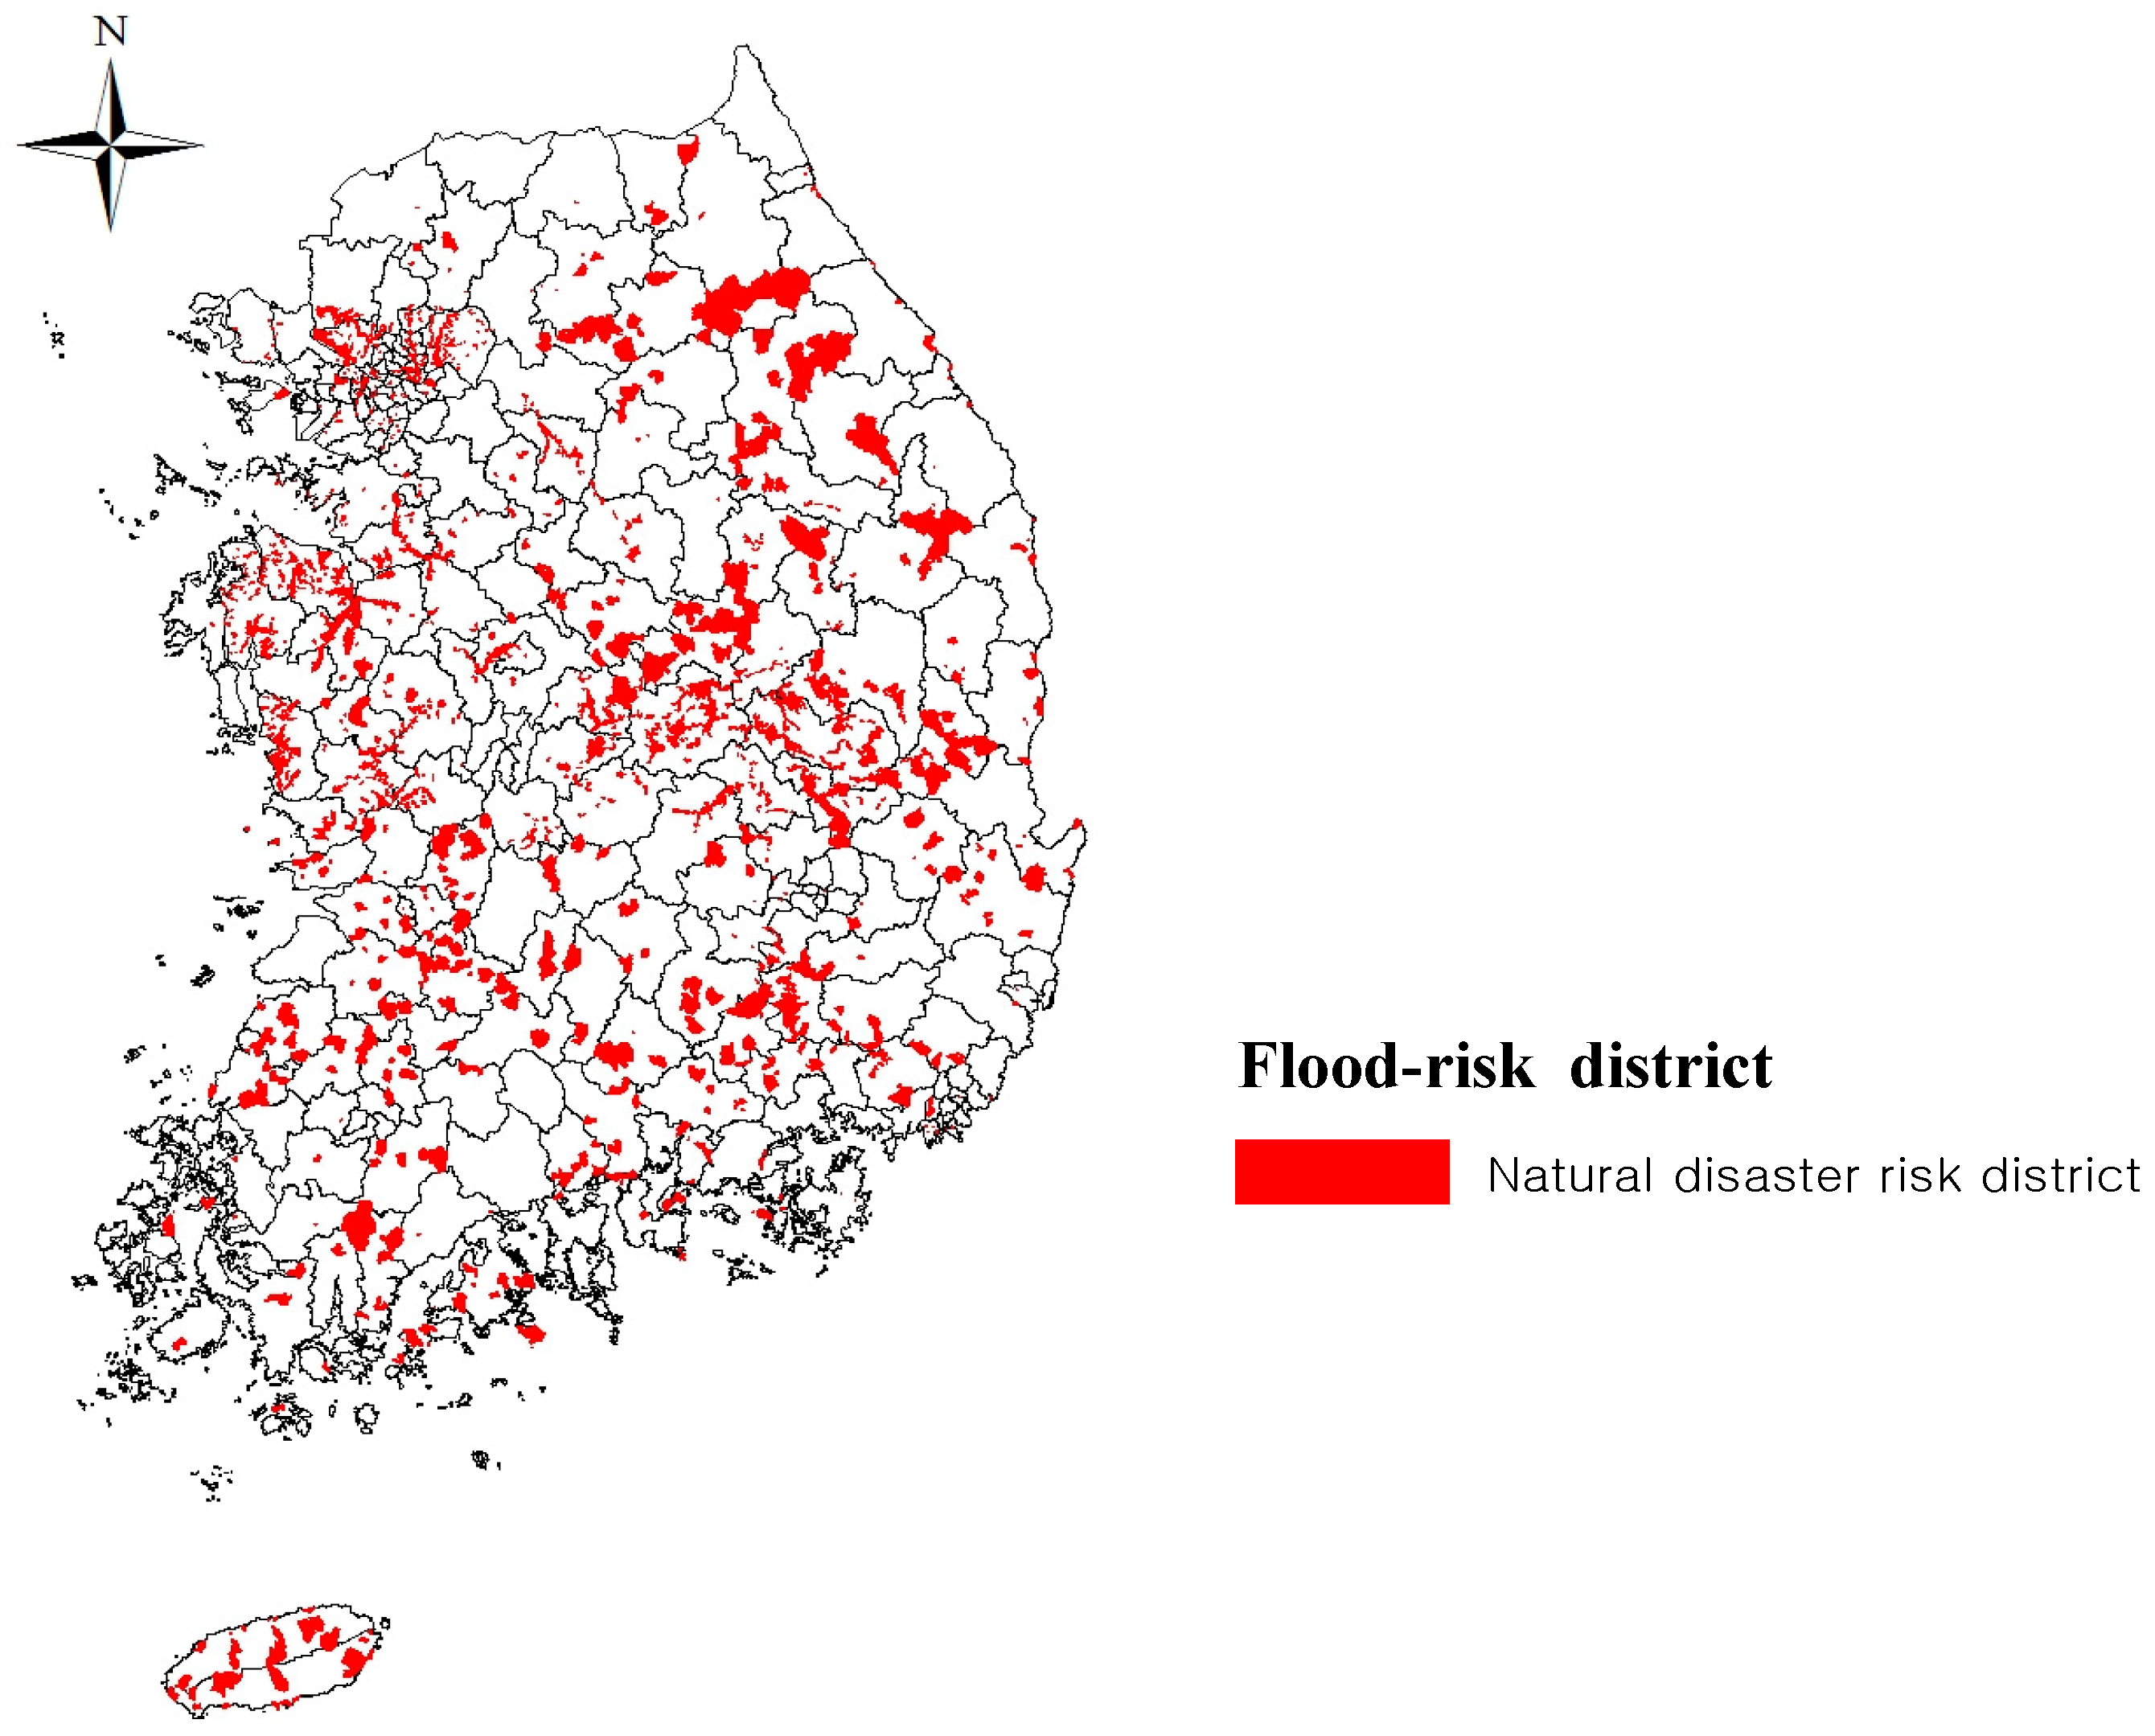
Figure 1). In total, 3,407,417 people live in such flood-risk areas (the phrase “flood-risk areas” include “areas prone to flood‘ and ’natural hazard zone”) (7.2 percent of the national population) and among them, 1,023,344 that are aged under 14 or over 65, classed as vulnerable, equaling 2.16 percent of the national population (see
Figure 2).
To analyze the effects of mitigation measures on flood damage prevention in Korea, it is necessary to understand the current policies related to floods. Korea’s flood damage prevention mitigation measures can be summarized as follows. Structural measures, including large-scale river management and flood control projects, have been conducted annually and consistently since 1964, in compliance with the amendments to the River Act and the Comprehensive National Development Plan, and the terms of the loans secured from the Asian Development Bank. Some of the structural river management and flood control measures have taken the form of embankment and dam construction projects, the effects of which have been experienced since 1965. Regarding the non-structural measures, as of the mid-2010s, most of them (except for prior evacuation plans) continue to be in their early stages of development, and are, therefore, considered insufficient at this time. Prior evacuation plans aimed at protecting human lives have been in place since the 1990s, with their positive effects bearing fruit since 1991, particularly after computerized weather forecasts became possible. These technologies include the Masscomp System (Massachusetts Computer Corporation), which was implemented in 1990, and the personal computer communications network, which was established in 1991 in Korea.
Figure 1.
Korea’s mountains and urban size.
Figure 1.
Korea’s mountains and urban size.
Figure 2.
Korea’s flood-risk areas (source: [
20]).
Figure 2.
Korea’s flood-risk areas (source: [
20]).
Two questions emerge from this review of flood damage prevention mitigation measures. First, how have damages from floods in Korea changed? This question suggests the need to analyze the characteristics of flood damages across time and space. Second, are the current flood damage prevention mitigation measures effective? This question implies that there is a need to empirically analyze the effects of social, economic, and environmental factors on flood damages. To address the effects of flood damage prevention mitigation measures in Korea, the following general research hypothesis is devised: Structural and non-structural flood damage mitigation measures in Korea influence flood damage prevention.
The study area spans the entire territory of the Republic of Korea. The data employed in the study relevant to flood damages include data on damages to human lives (fatalities and missing persons), sizes of the flood-affected areas (ha), and the extent (amount) of damage to (1) buildings, (2) farmland, (3) ships, (4) crops, and (5) and public facilities, and other damages. Importantly, data on the monetary extent of damages are not suitable for time series analysis because such amounts are estimated at once, as opposed to considering the increase in the actual and asset values over time. In other words, the monetary value of damages is closely related to the growth of the national economy. Meanwhile, by considering flood damage mitigation measures, Korea deducts that River management and flood control have been implemented as a structural manner and Prior evacuation plans have been practiced as a non-structural measures. On the basis of these, we referred to the studies on the flood-affected area governed by River management [
21] and flood control, and an early warning system is efficient in reduction of damages to human life as the reason to use variables [
22]. Therefore, this study uses the data on damages to human life and flood-affected areas to analyze the effects of the policies relevant to each non-structural and structural measure, respectively. Additional data are collected from the Annual Disaster Statistical Review [
20], which is published by the government, and the Water Resources Management Information System from 1958 to 2013 (amounting to a considerable period of 55 years). The specific hypotheses addressed by these data are as follows.
H1 = River management and flood control in Korea, which began in 1964, resulted in effects attributable to structural measures after 1965.
H2 = Prior evacuation plans in Korea, which were first implemented in 1991, resulted in effects attributable to non-structural measures after 1991.
2.2. Analyzing Flood Damage Characteristics
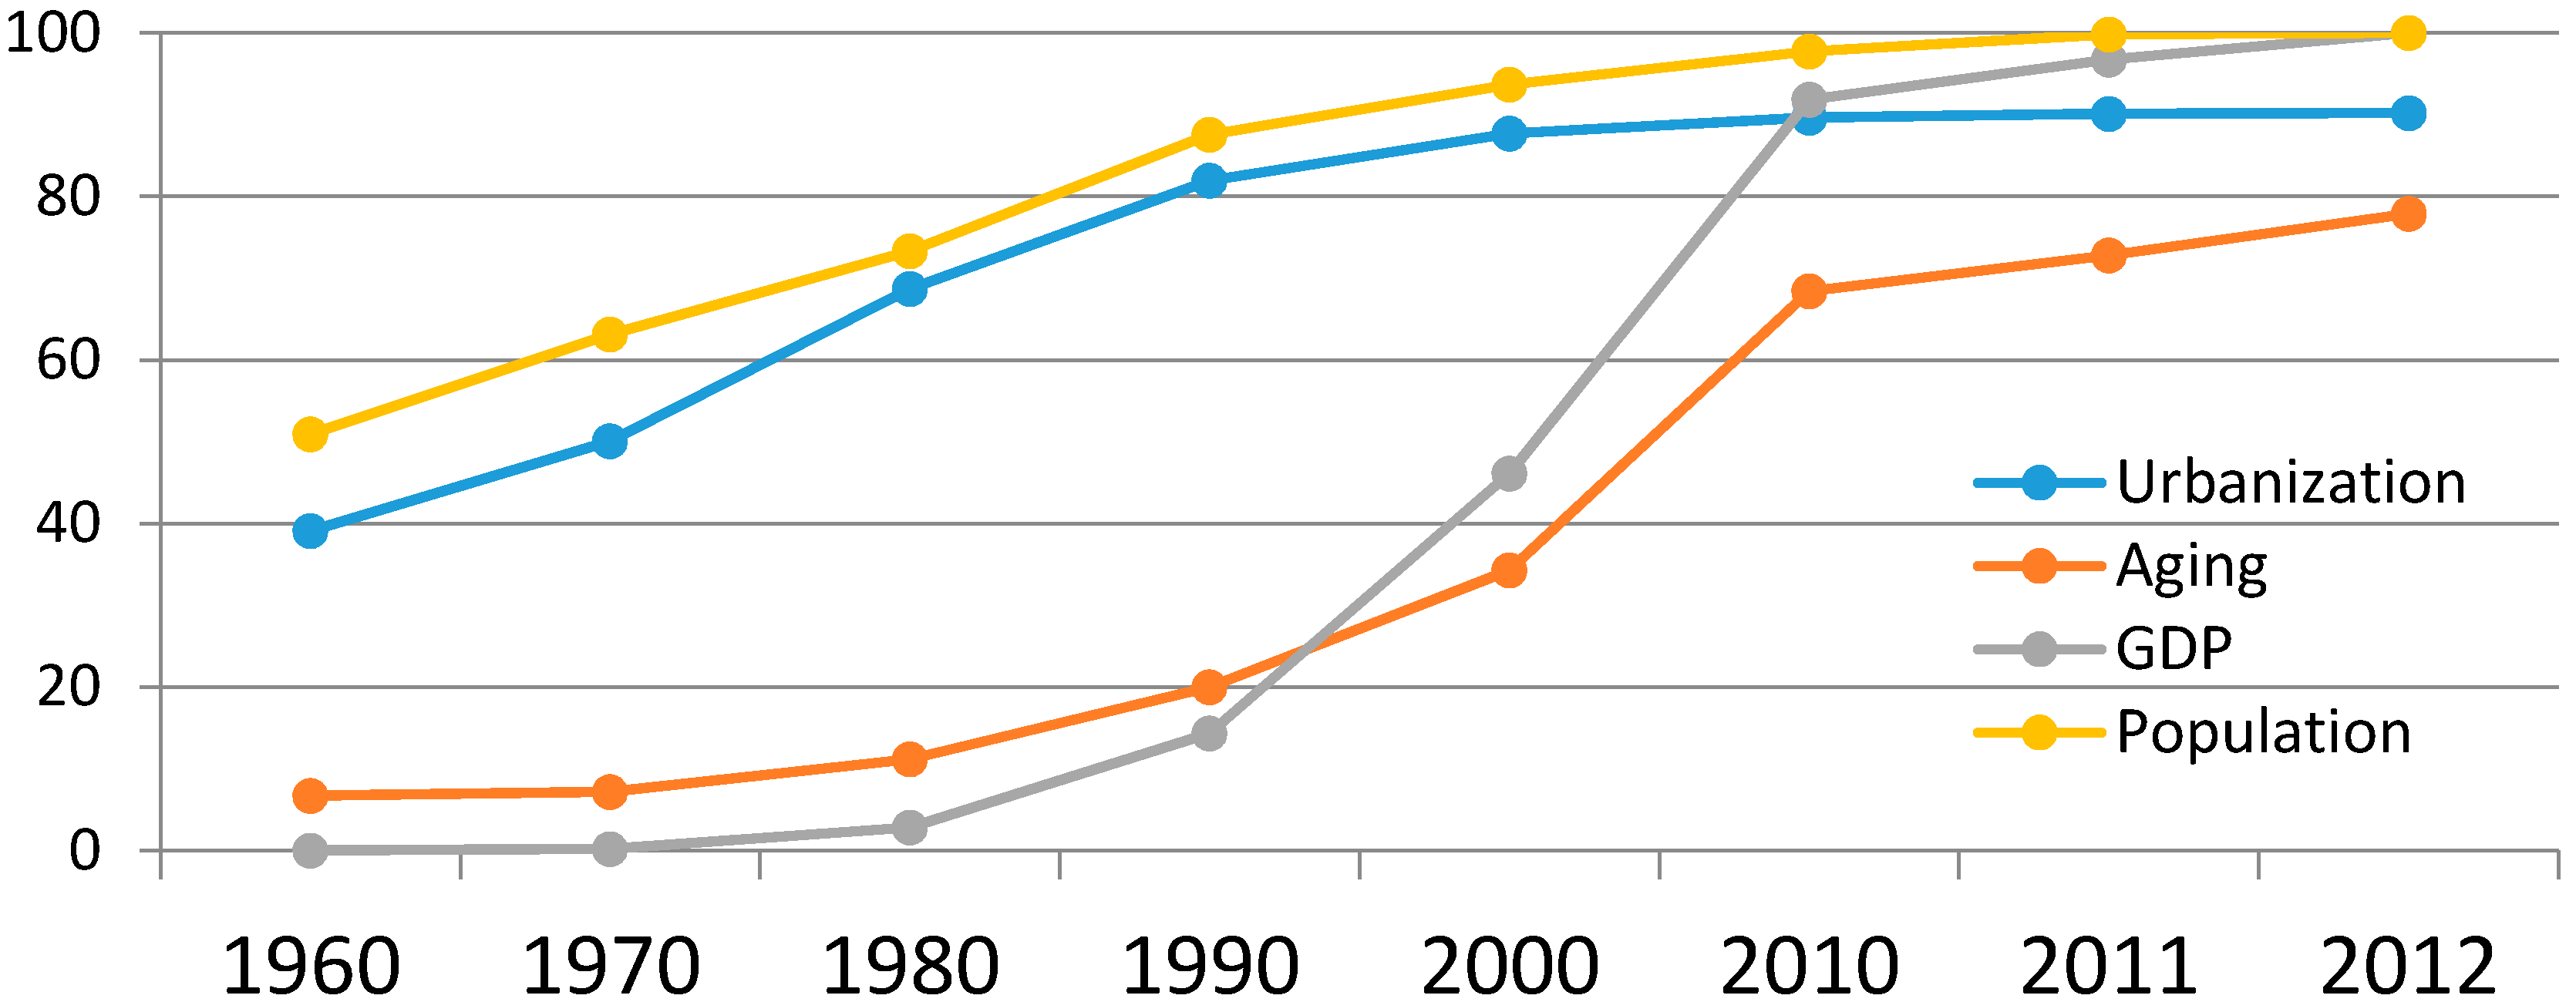
With respect to flooding, the social and economic environments and precipitation have a significant influence on material damages and damages to human life, and they are the key factors determining flood size and temporal–spatial distribution. Because the frequency of flood events and the extent of the resultant damages vary across space and time, it is necessary to analyze the relevance of socioeconomic indexes to flood damages and the manner in which changes in precipitation quantitatively relate to floods that cause major damages. The major flood events in Korea are selected based on several aspects. The period of the case study was from 1960 to 2010 and results were divided into urban and non-urban areas. This research aims to draw time and spatial features from macroscopic perspectives. The factors included in this analysis are shown in
Table 1.
Table 1.
Methodology for analyzing flood damage characteristics.
Table 1.
Methodology for analyzing flood damage characteristics.
| Flood Damage Characteristic | Factors |
|---|
| Socioeconomic status and trends | Population, Gross Domestic Product (GDP), urbanization rate, index of aging |
| Precipitation status and trends | Period of precipitation, and magnitude and frequency of extreme precipitation |
| Events and extent of flood damages | Period of damage, areas affected, details of damage, nature of damage |
| Causes of flooding |
| Temporal characteristics |
| Spatial characteristics (urban and non-urban areas, as classified by National Land Planning and Utilization Act, 2015) |
2.3. Analyzing the Effects of Flood Damage Prevention Mitigation Measures
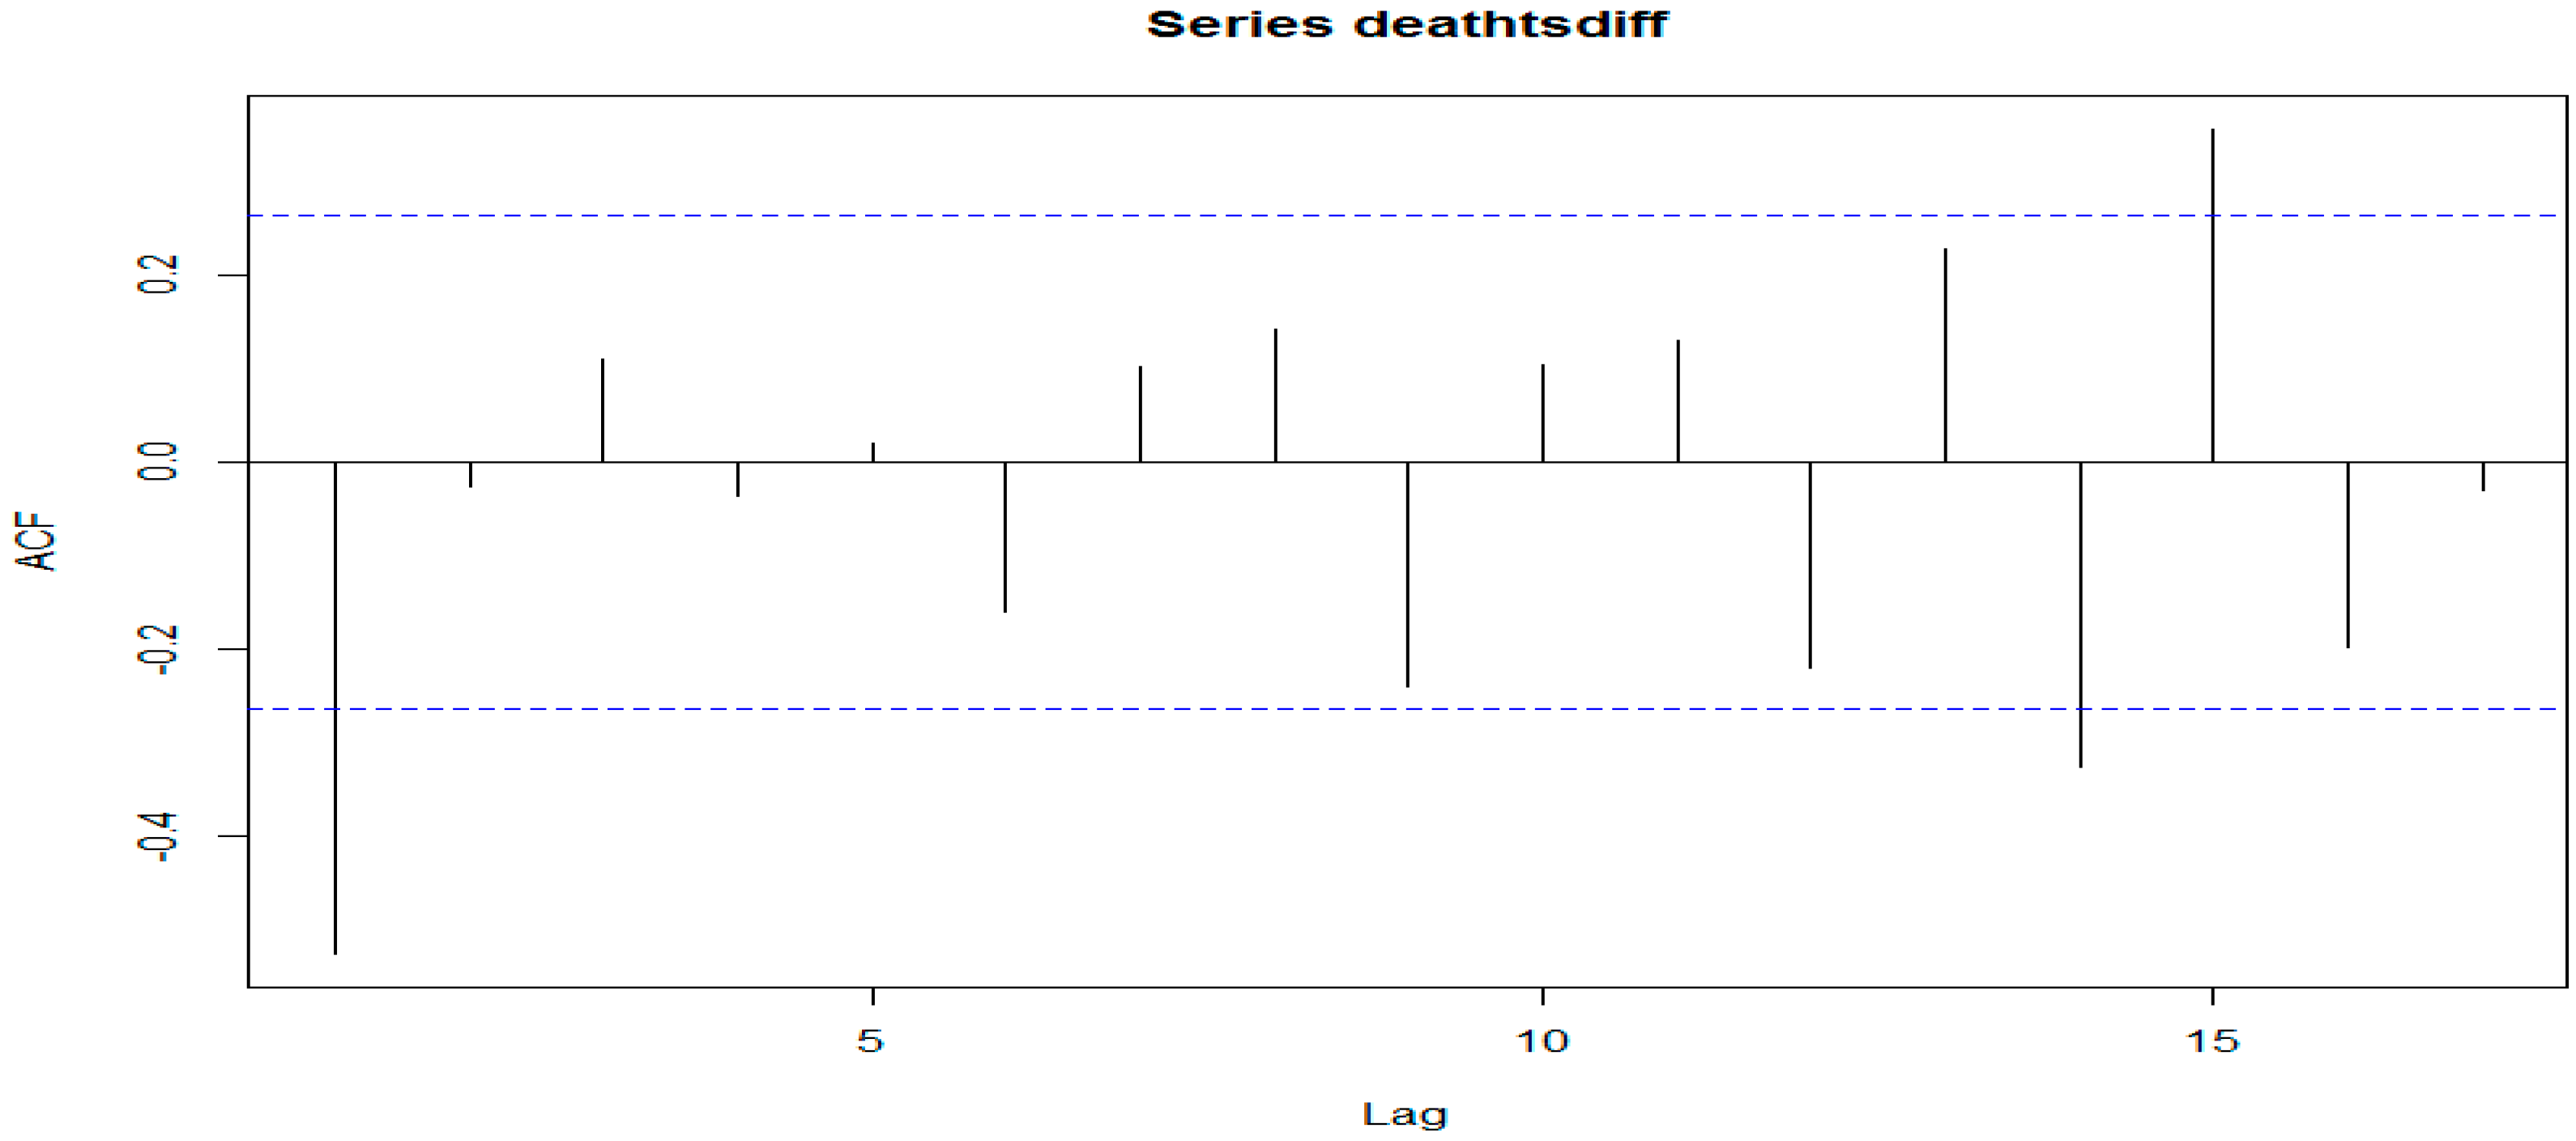
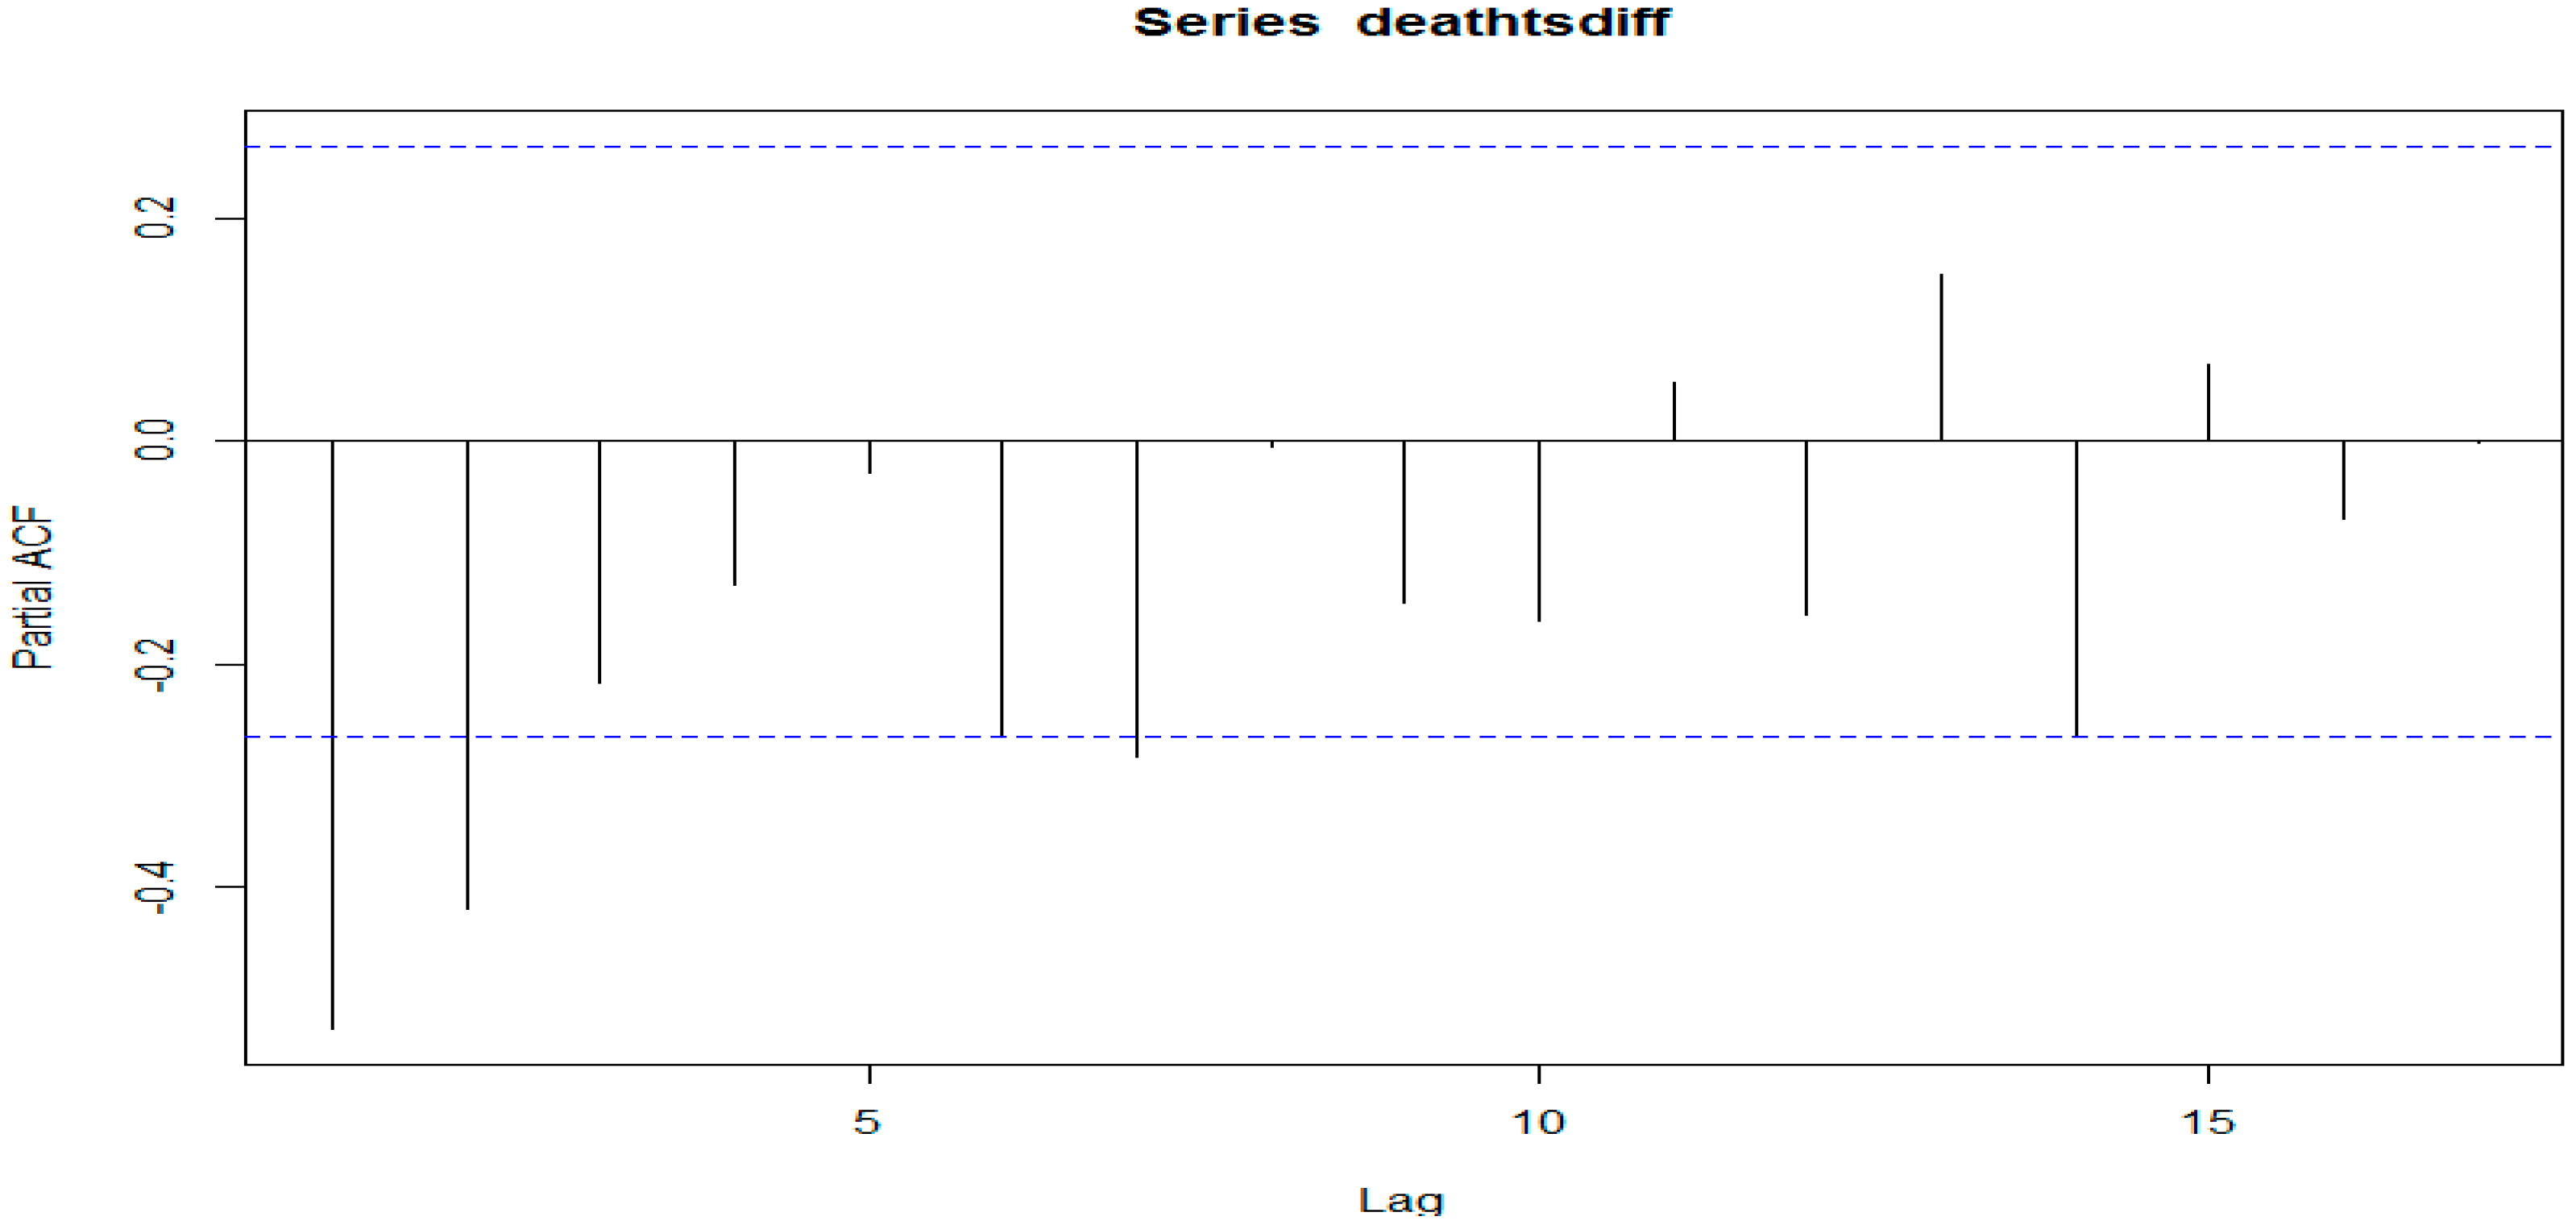
This study quantitatively analyzes the effects of flood damage prevention measures using the Auto-Regressive Integrated Moving Average (ARIMA) time series methodology. This analysis is used to construct the model and test the hypotheses while employing the time series data. It helps to determine trends and predict the future [
23]. This method uses external events as independent variables and is useful to assess whether those events actually influenced the outcome variable when the timing of the intervention and cause are known and for estimating the effects of the same.
The ARIMA model consists of p past factors (auto-regressive factors) and q confounding factors (moving average factors) with , which represents the integrated elements. Therefore, it is expressed as ARIMA (p, d, q), where p = autoregressive factor, q = moving average factor, and d = difference.
The ARIMA model can be expressed by Equation (1):
where
t refers to time;
B denotes the backward shift operator, that is,
BXt =
Xt –
1;
Yt refers to the raw data,
is a constant,
(
B) is the autoregressive value, and
θ(
B) denotes the average values of movement.
The intervention time series model assumes that if time series
Yt with no intervention follows the ARIMA (
p,
d,
q) model, external shock has an additive effect. This probability model represents the structural changes in the time series data when it reaches a new state after an intervention from the stable state or when it cannot reach a balanced state after the intervention. This notion can be expressed as Equation (2).
where,
(
B)
/θ(
B)
at is the estimated ARIMA (
p,
d,
q) model, and
ω(
B)
Bb/δ(
B) represents the intervening variables.
B refers to the delay time of intervention effects,
ω(
B) denotes the expected effects of early intervention,
δ(B) refers to the persistent effects of the intervention, and
It refers to the intervening variables. The intervening variables take two forms, pulse function and step function, according to the duration of a certain event. The pulse function,
Pt(T), is used when a given event occurs at a point in
t and its effect influences only that point (defined in Equation (3)). The step function,
St(T), is used when a certain event occurs at a point in
t and its effect has a continuous influence even after the point of occurrence, as shown in Equation (4).
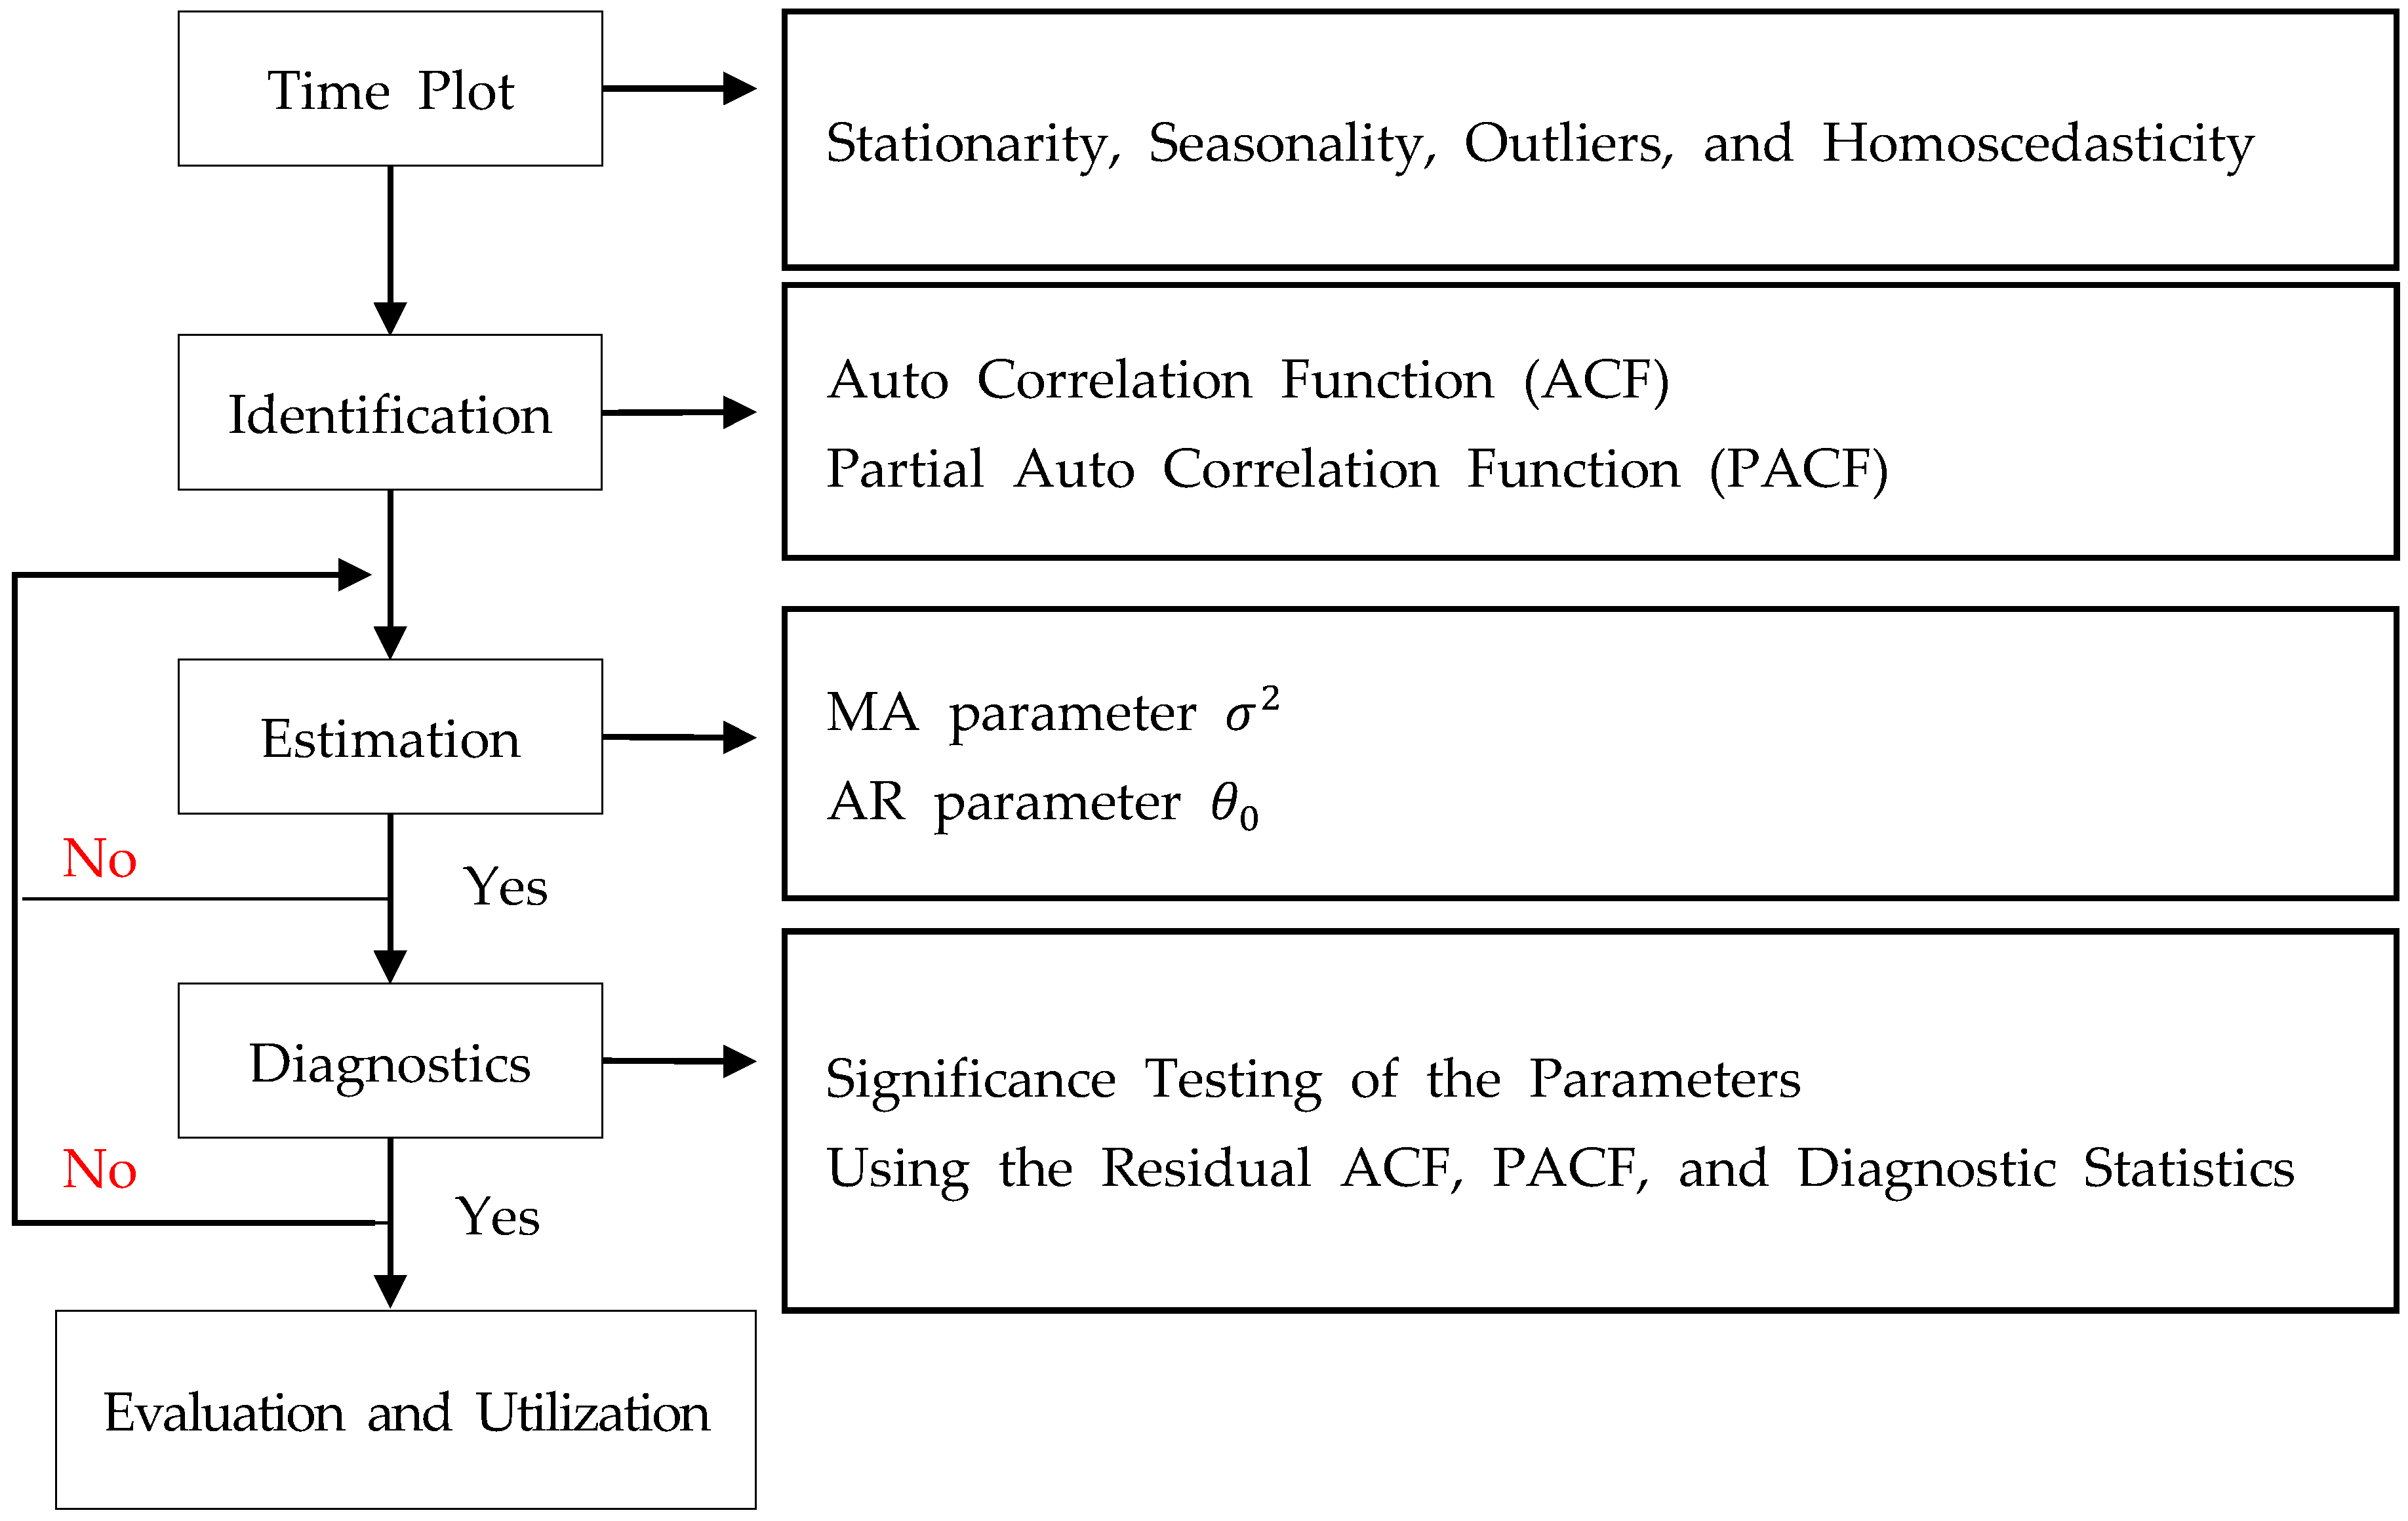
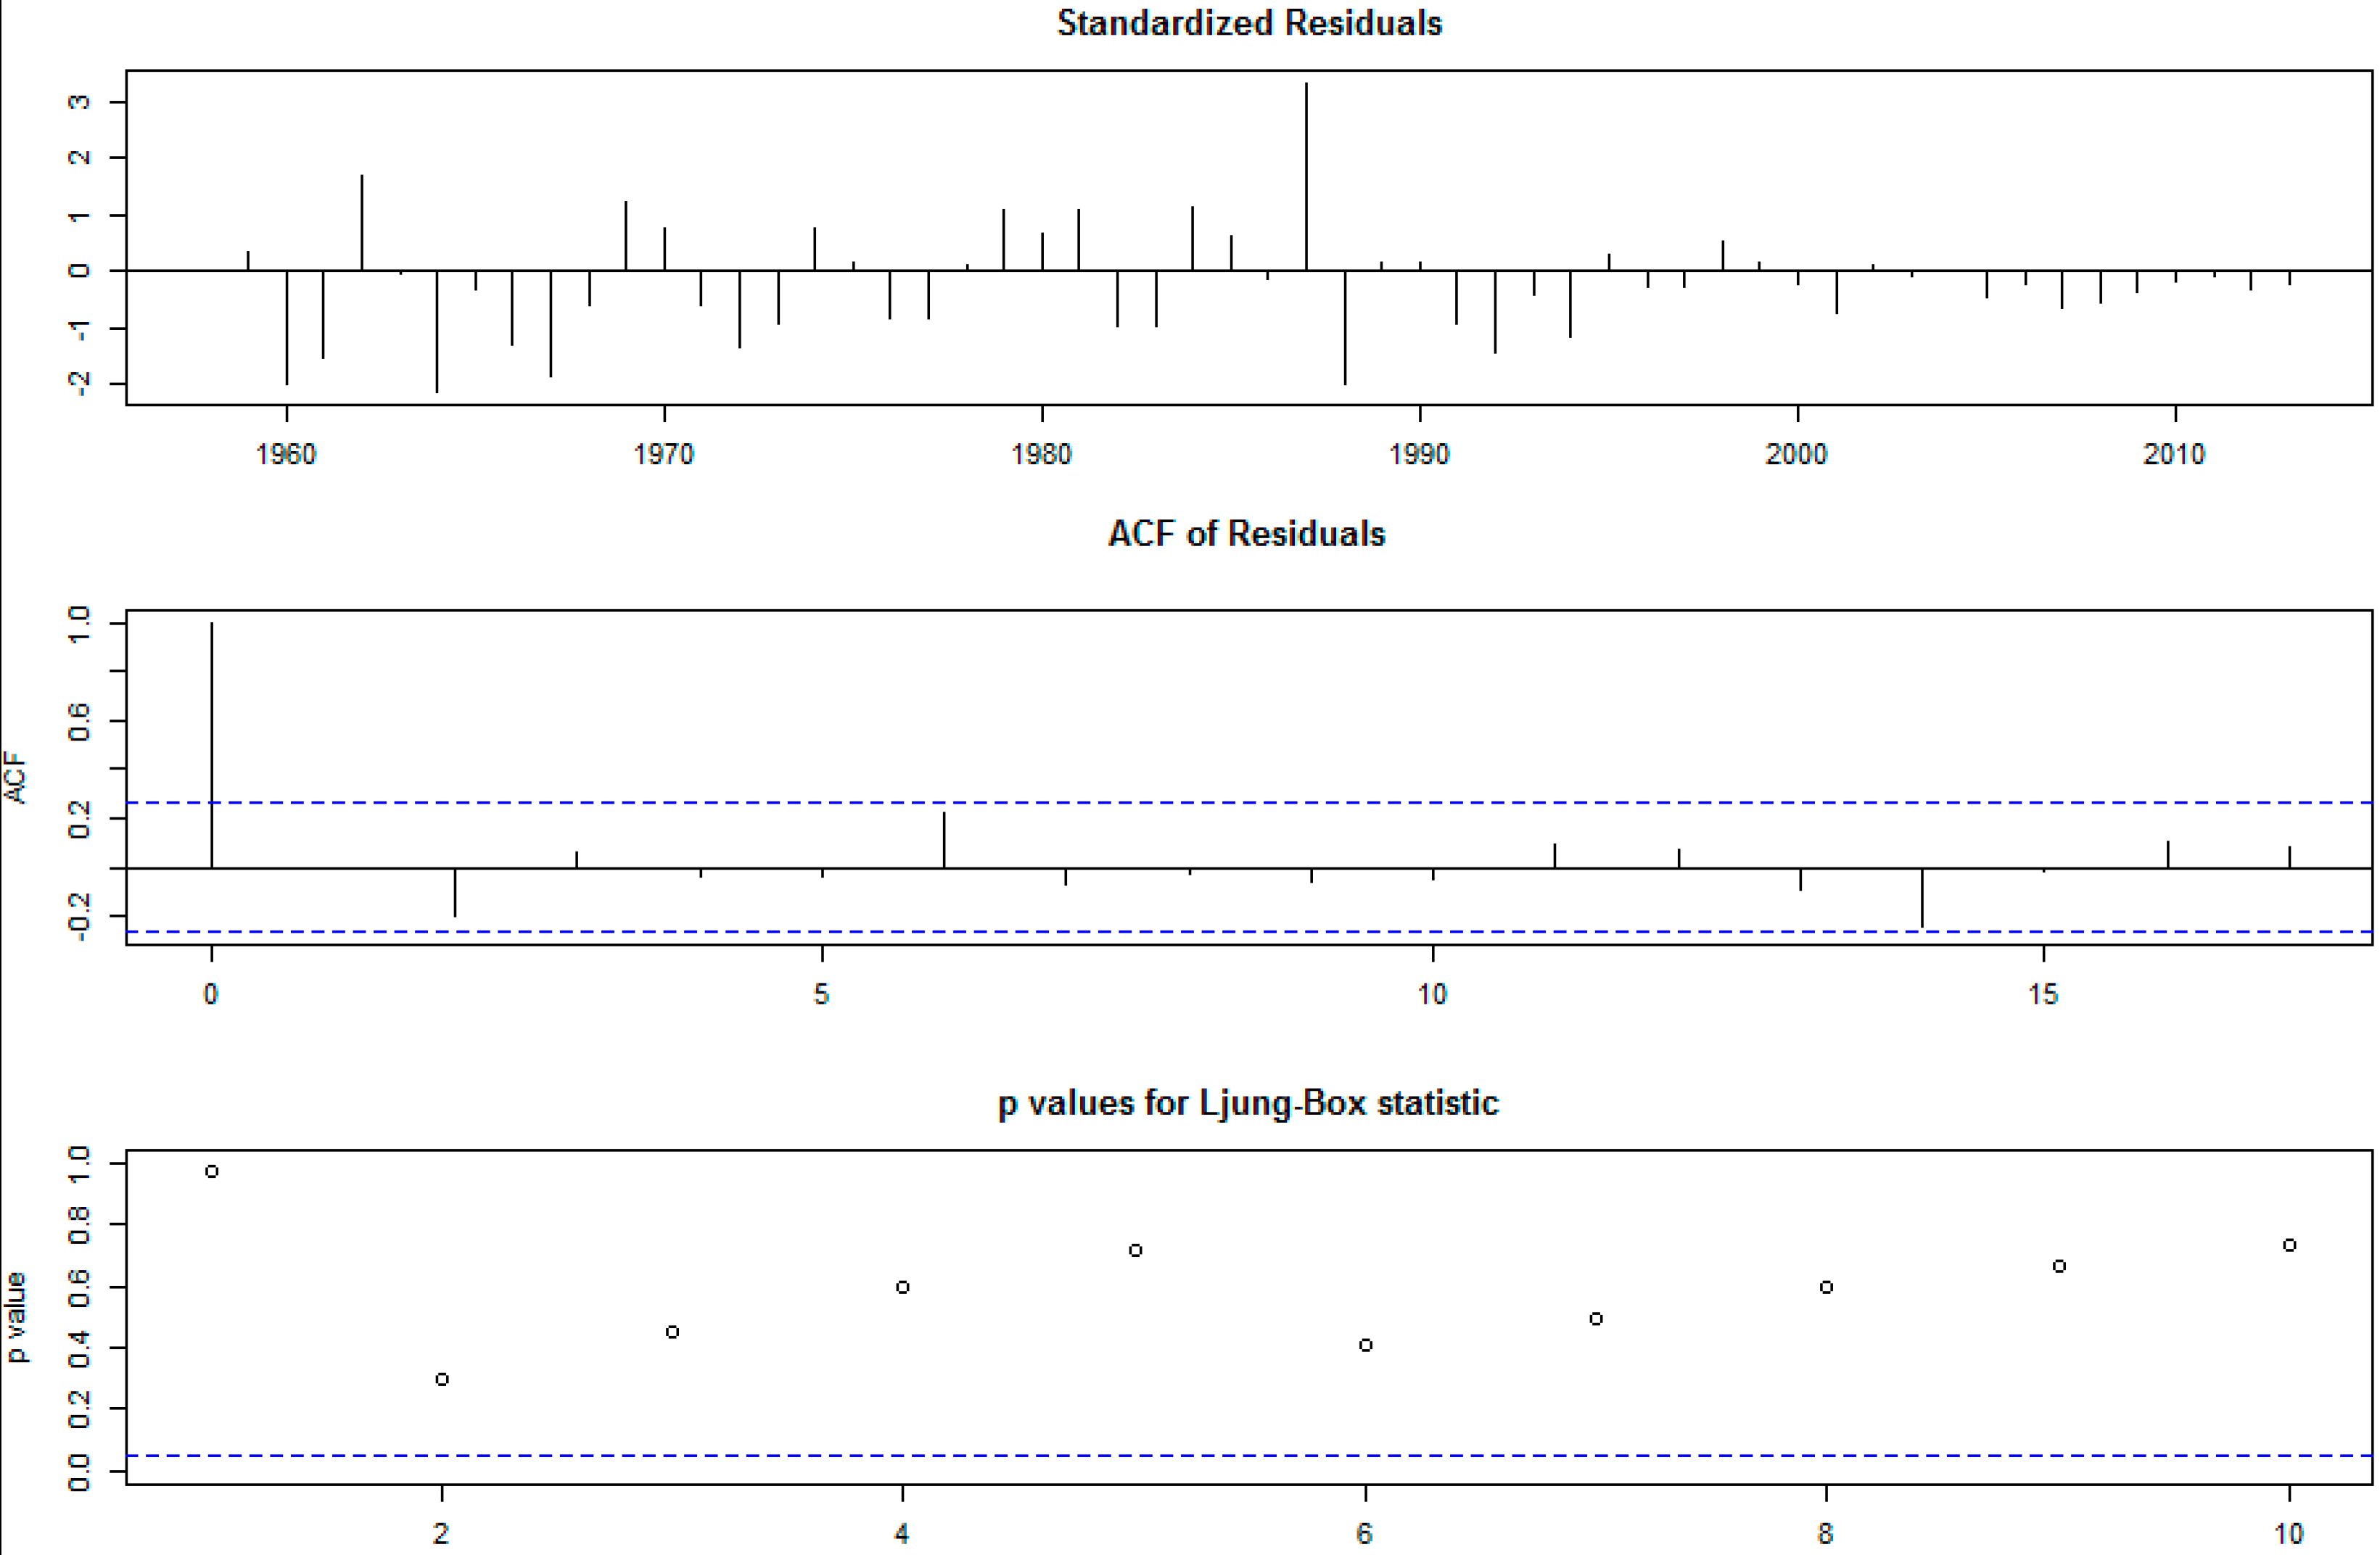
The assessment of the transfer function model is similar to the procedure for the ARIMA model. For estimation and verification of the intervention time series model, statistics are repeated throughout the process of identifying, estimating, and diagnosing the model that reflects the intervening variable,
ω(
B)
Bb/δ(
B), after estimating and diagnosing the ARIMA model,
φ(
B)
/θ(
B)
at. This method was developed by Box and Jenkins [
23] (see
Figure 3).
Figure 3.
Model development (Source: [
23]).
Figure 3.
Model development (Source: [
23]).
4. Discussion
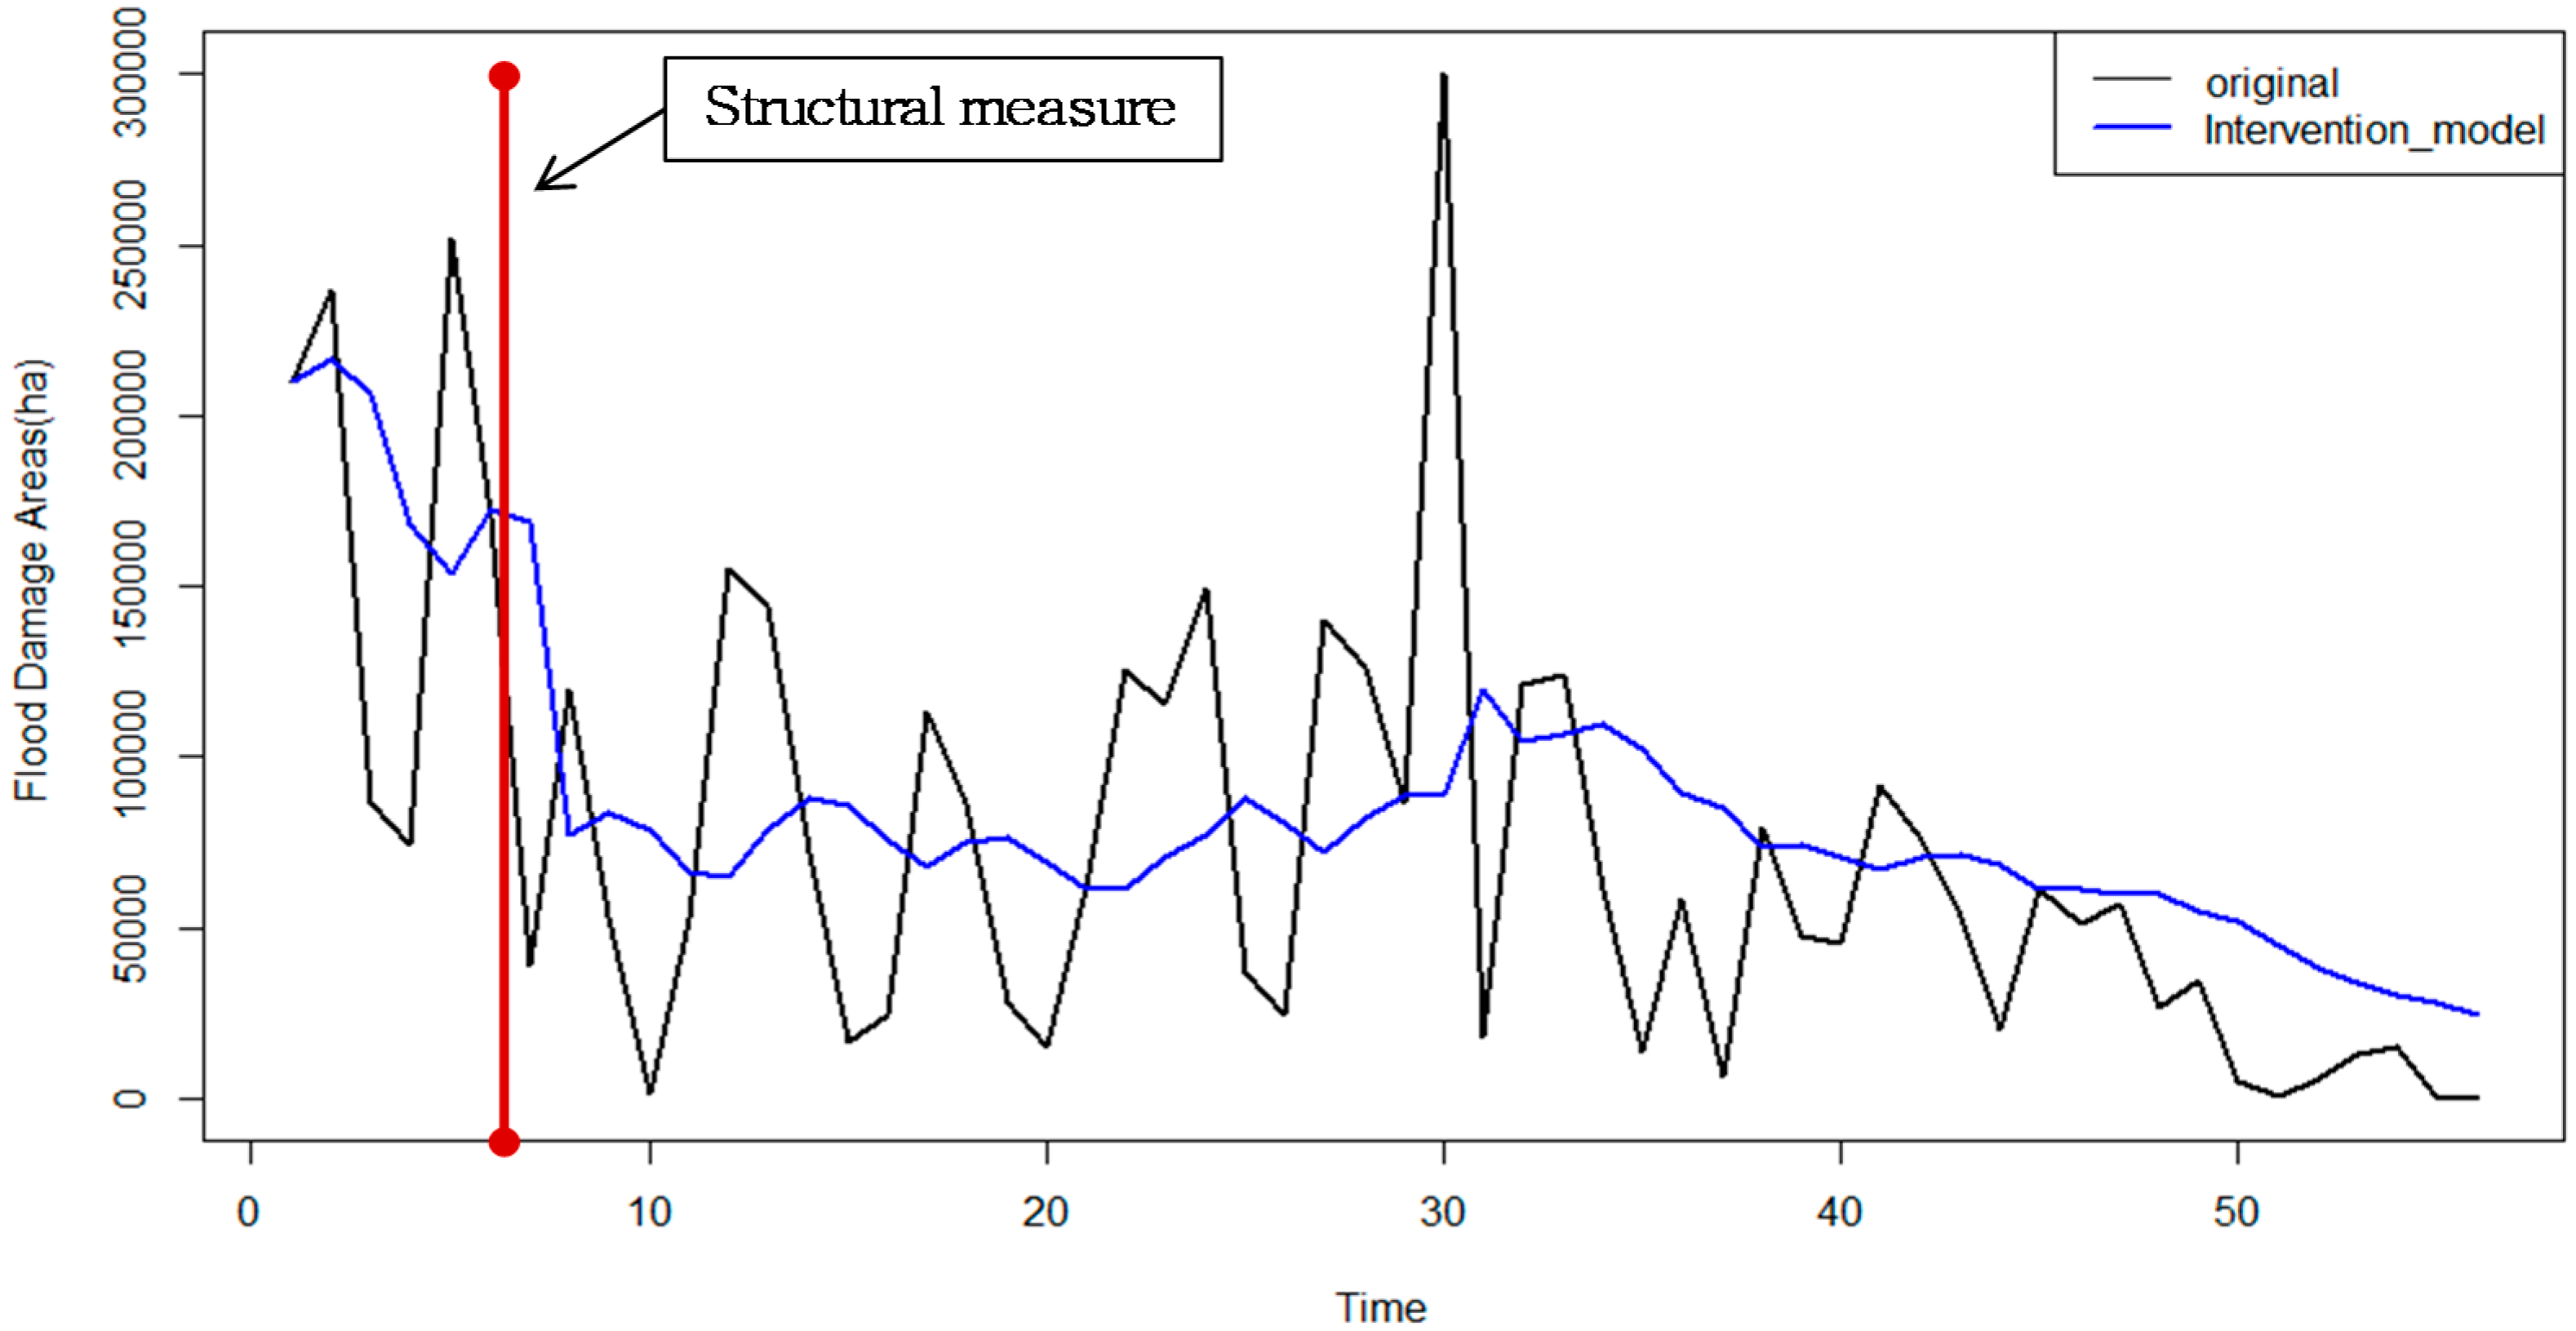
As stated previously, some of the important policy interventions that influenced mitigation of flood damages in Korea refer to structural measures, such as river management and flood control projects, which started in 1965, and non-structural measures, such as prior evacuation plans, which started in 1991.
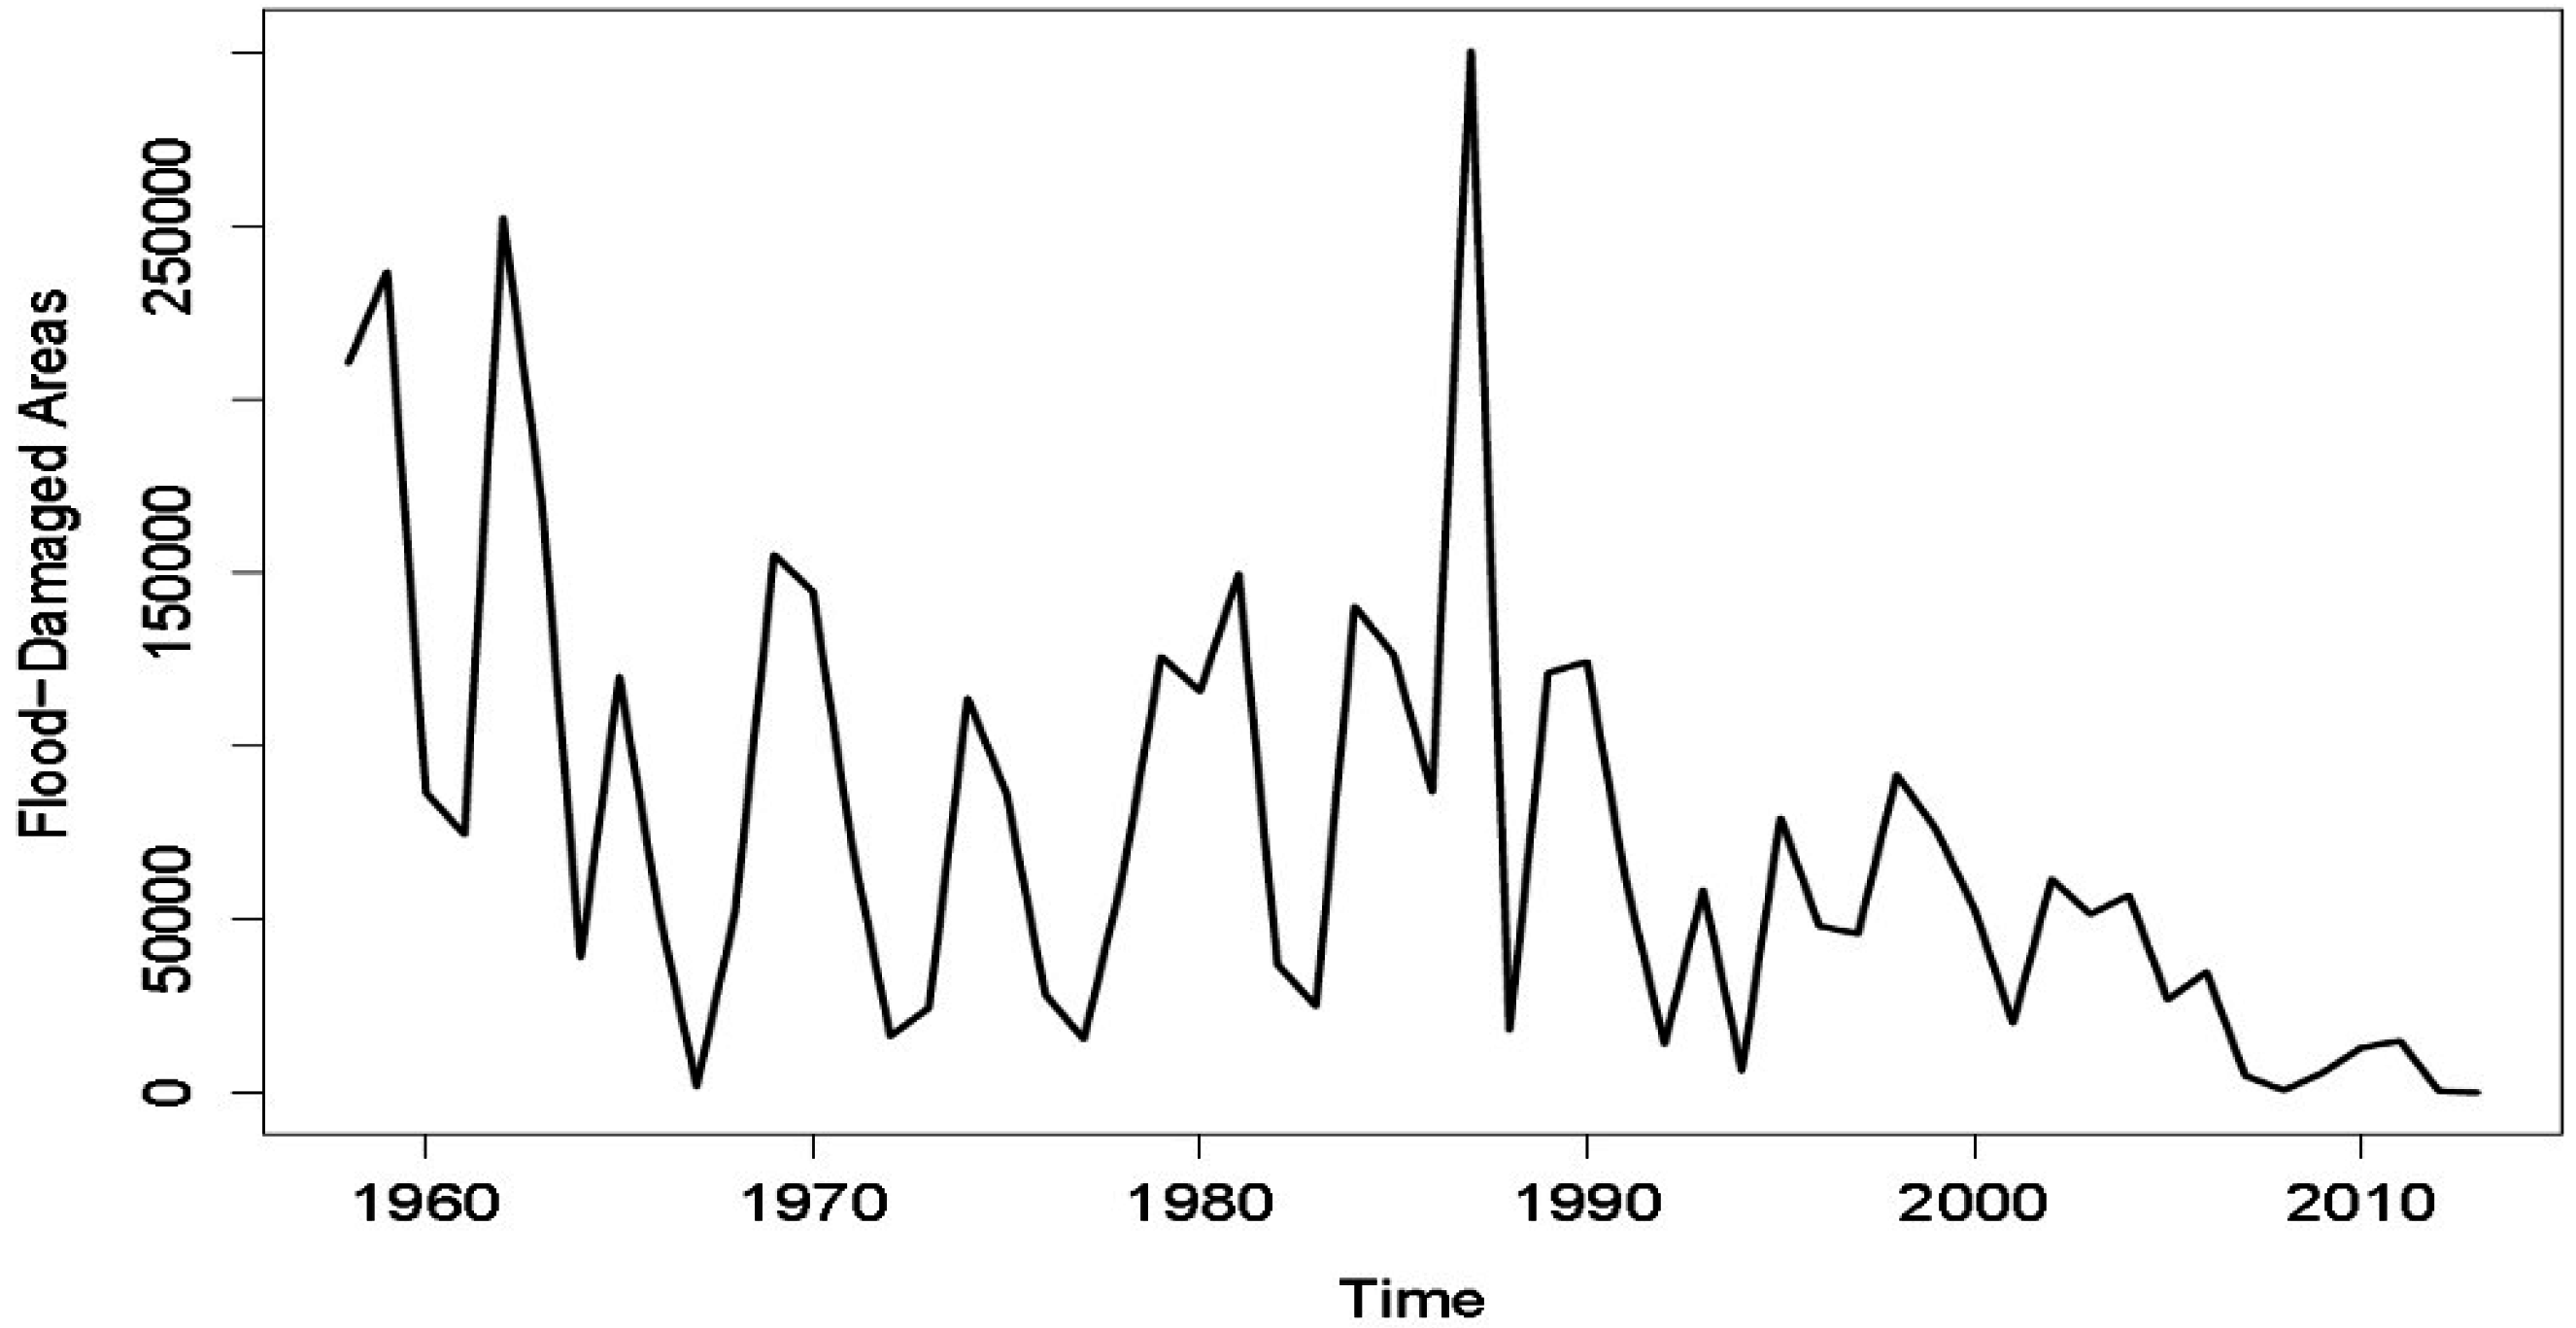
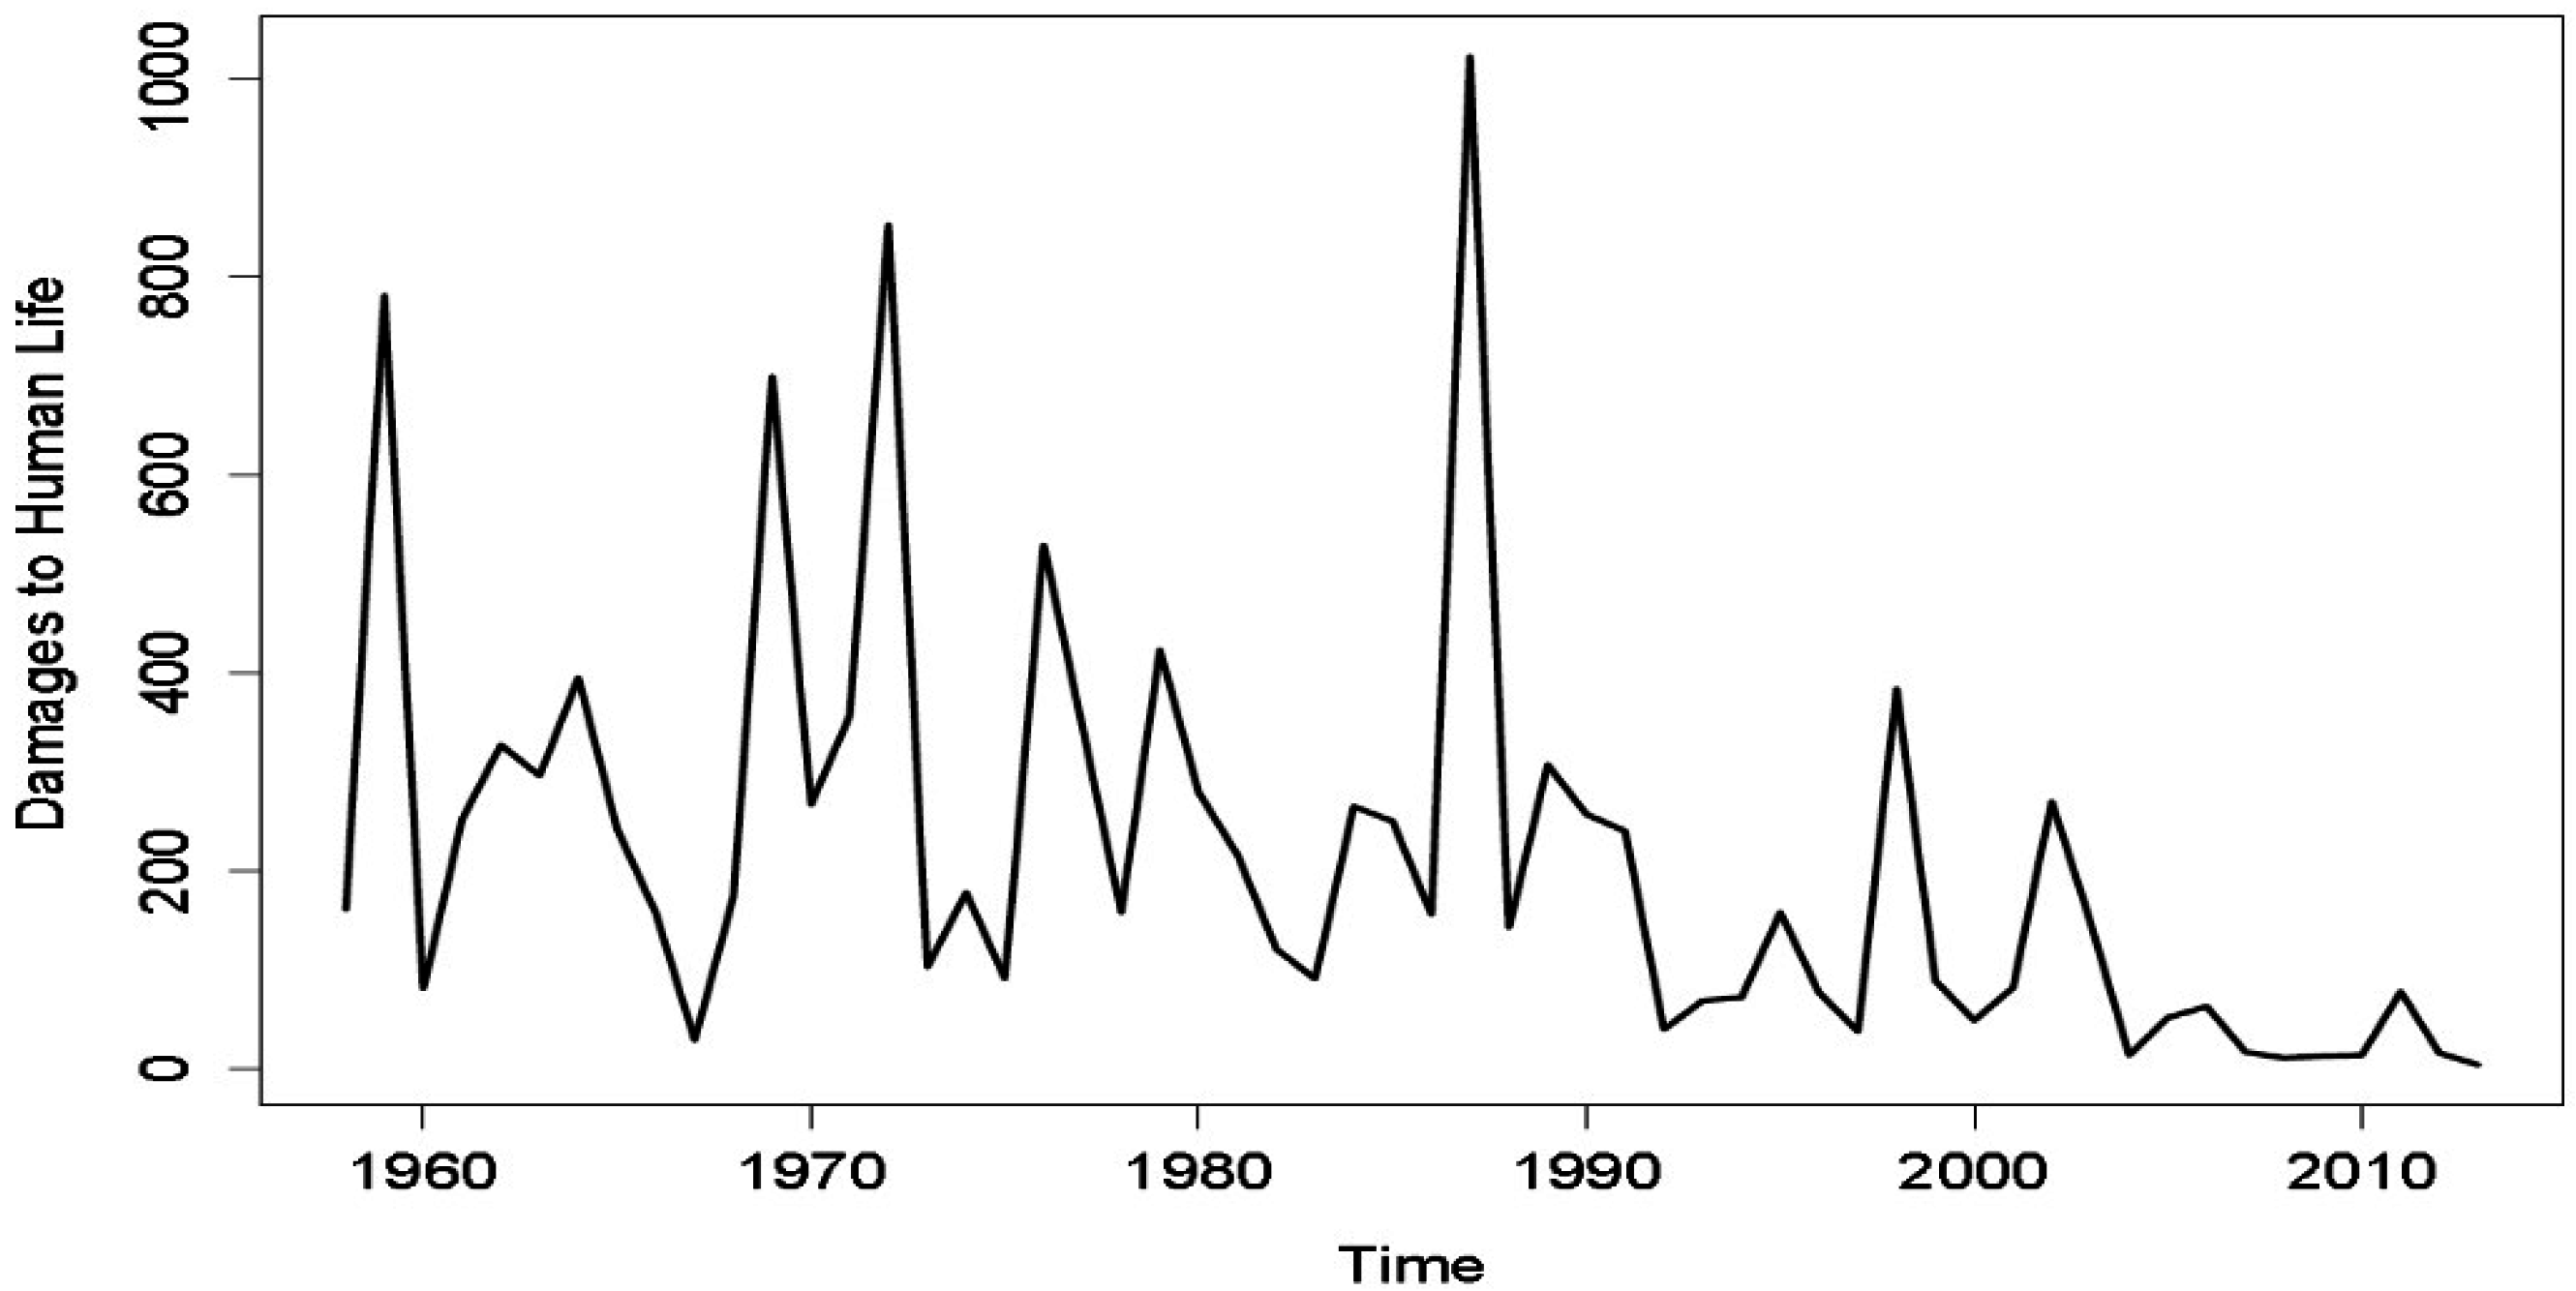
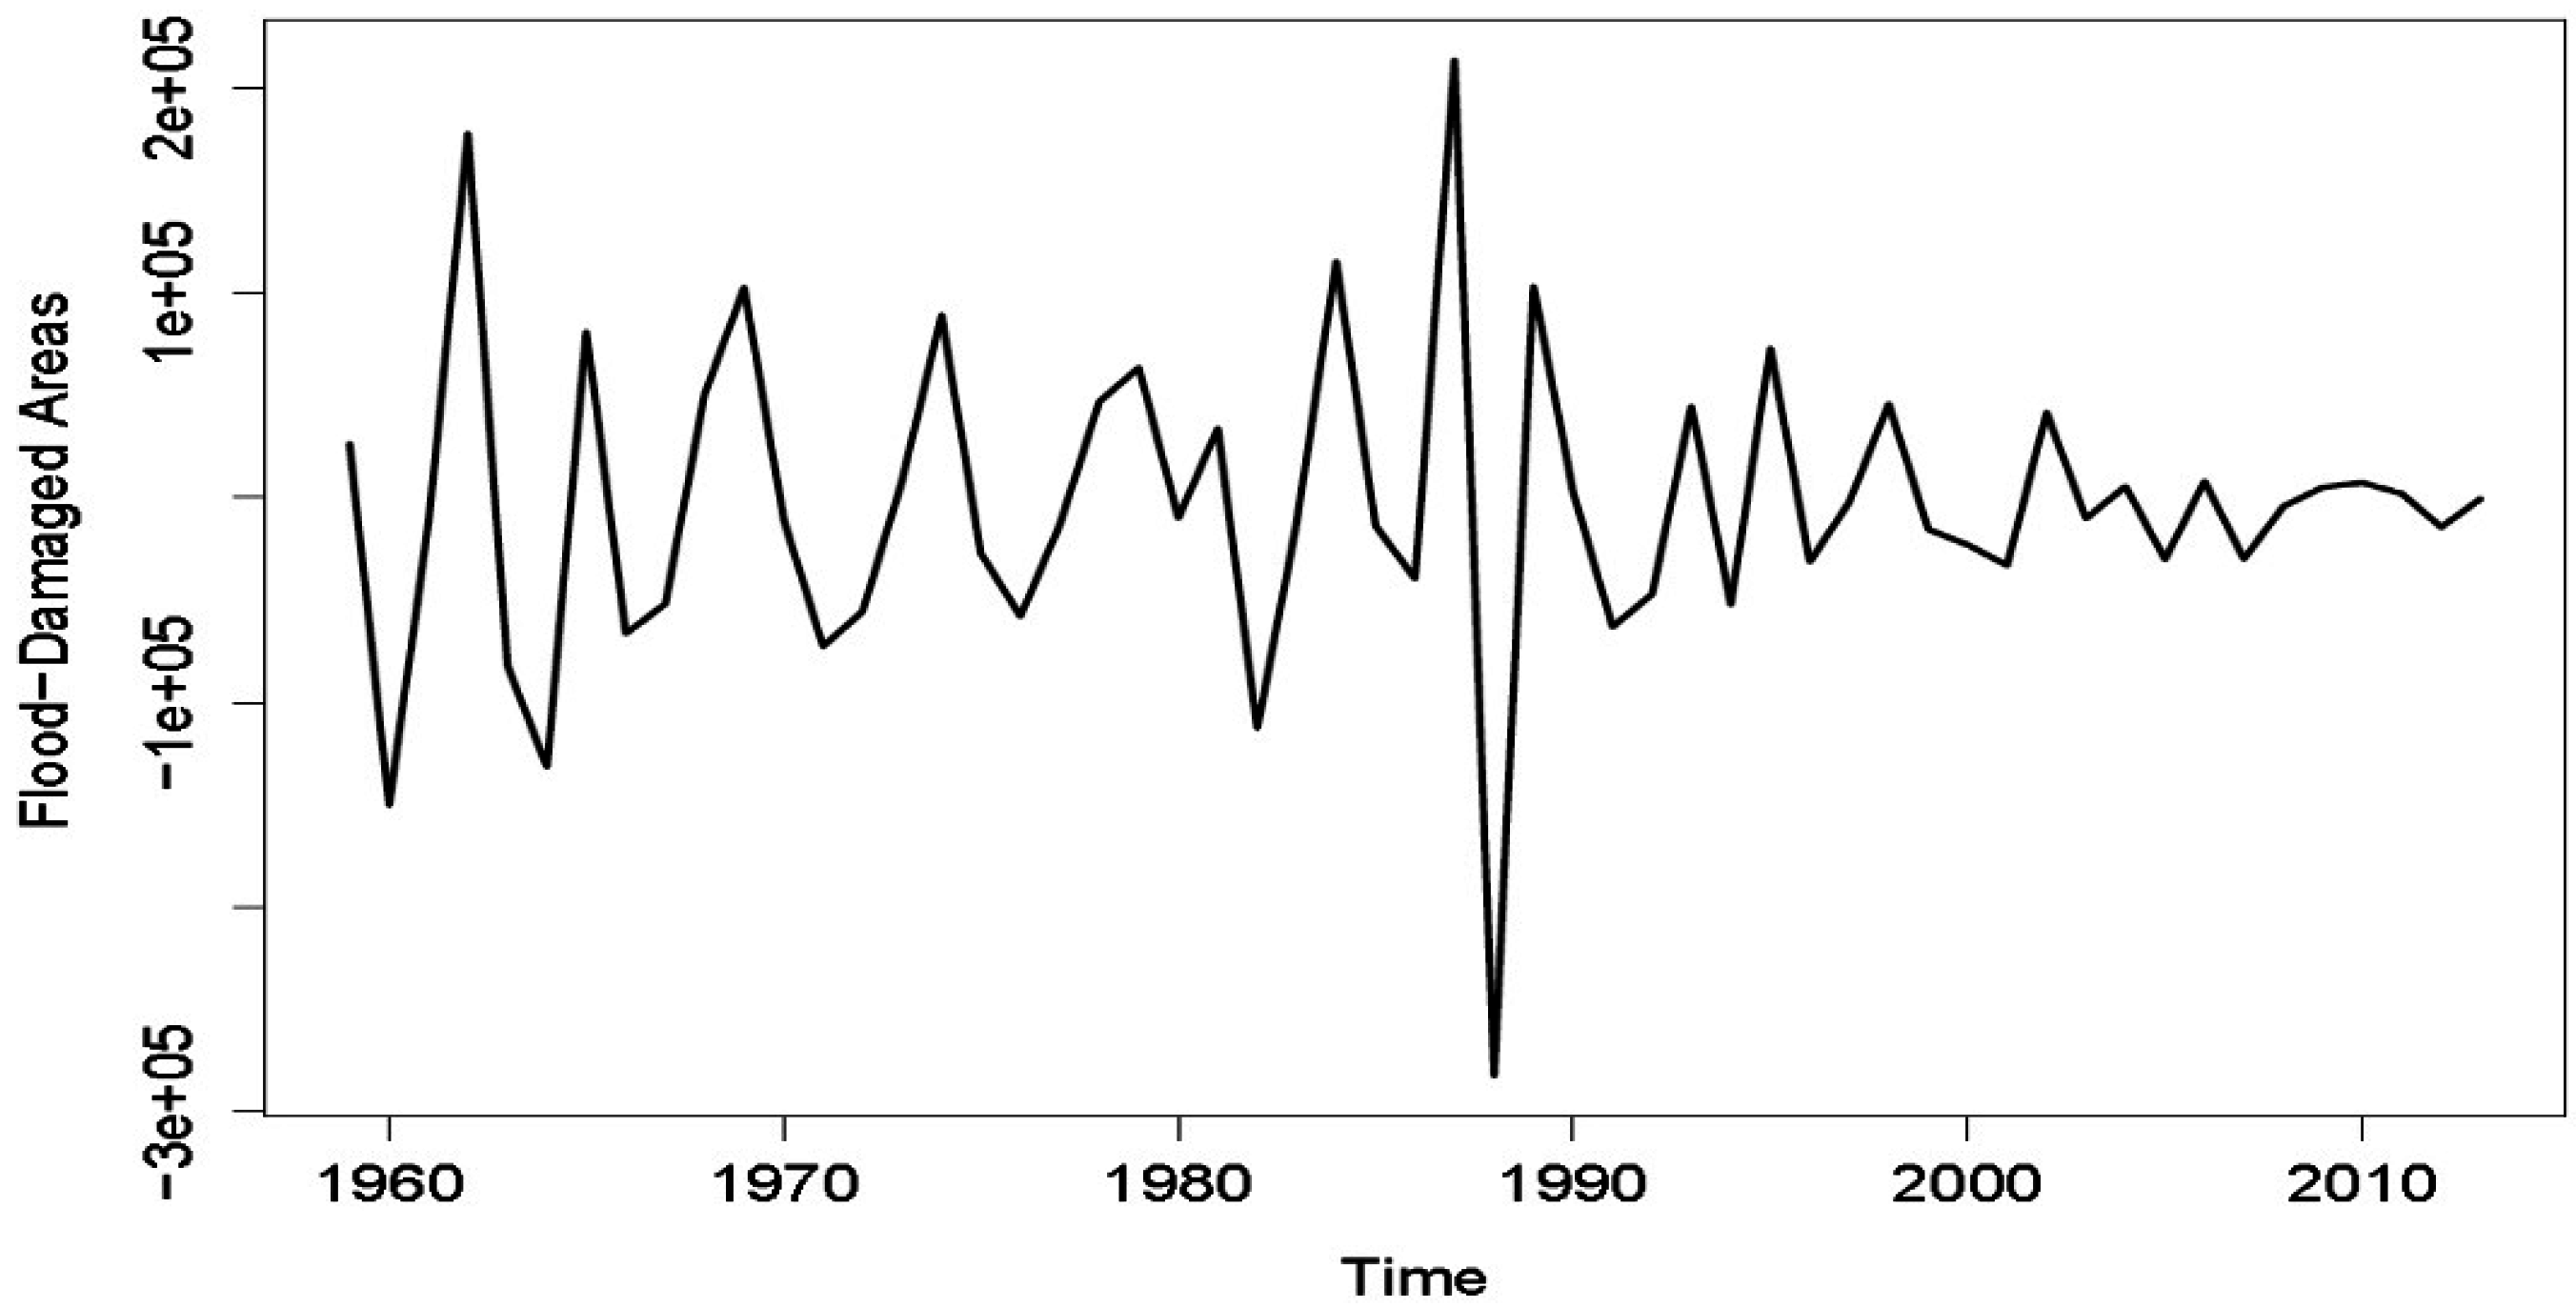
Figure 17 and
Figure 18 illustrate these policy interventions.
Figure 17.
Raw data and the estimated intervention model (structural measures).
Figure 17.
Raw data and the estimated intervention model (structural measures).
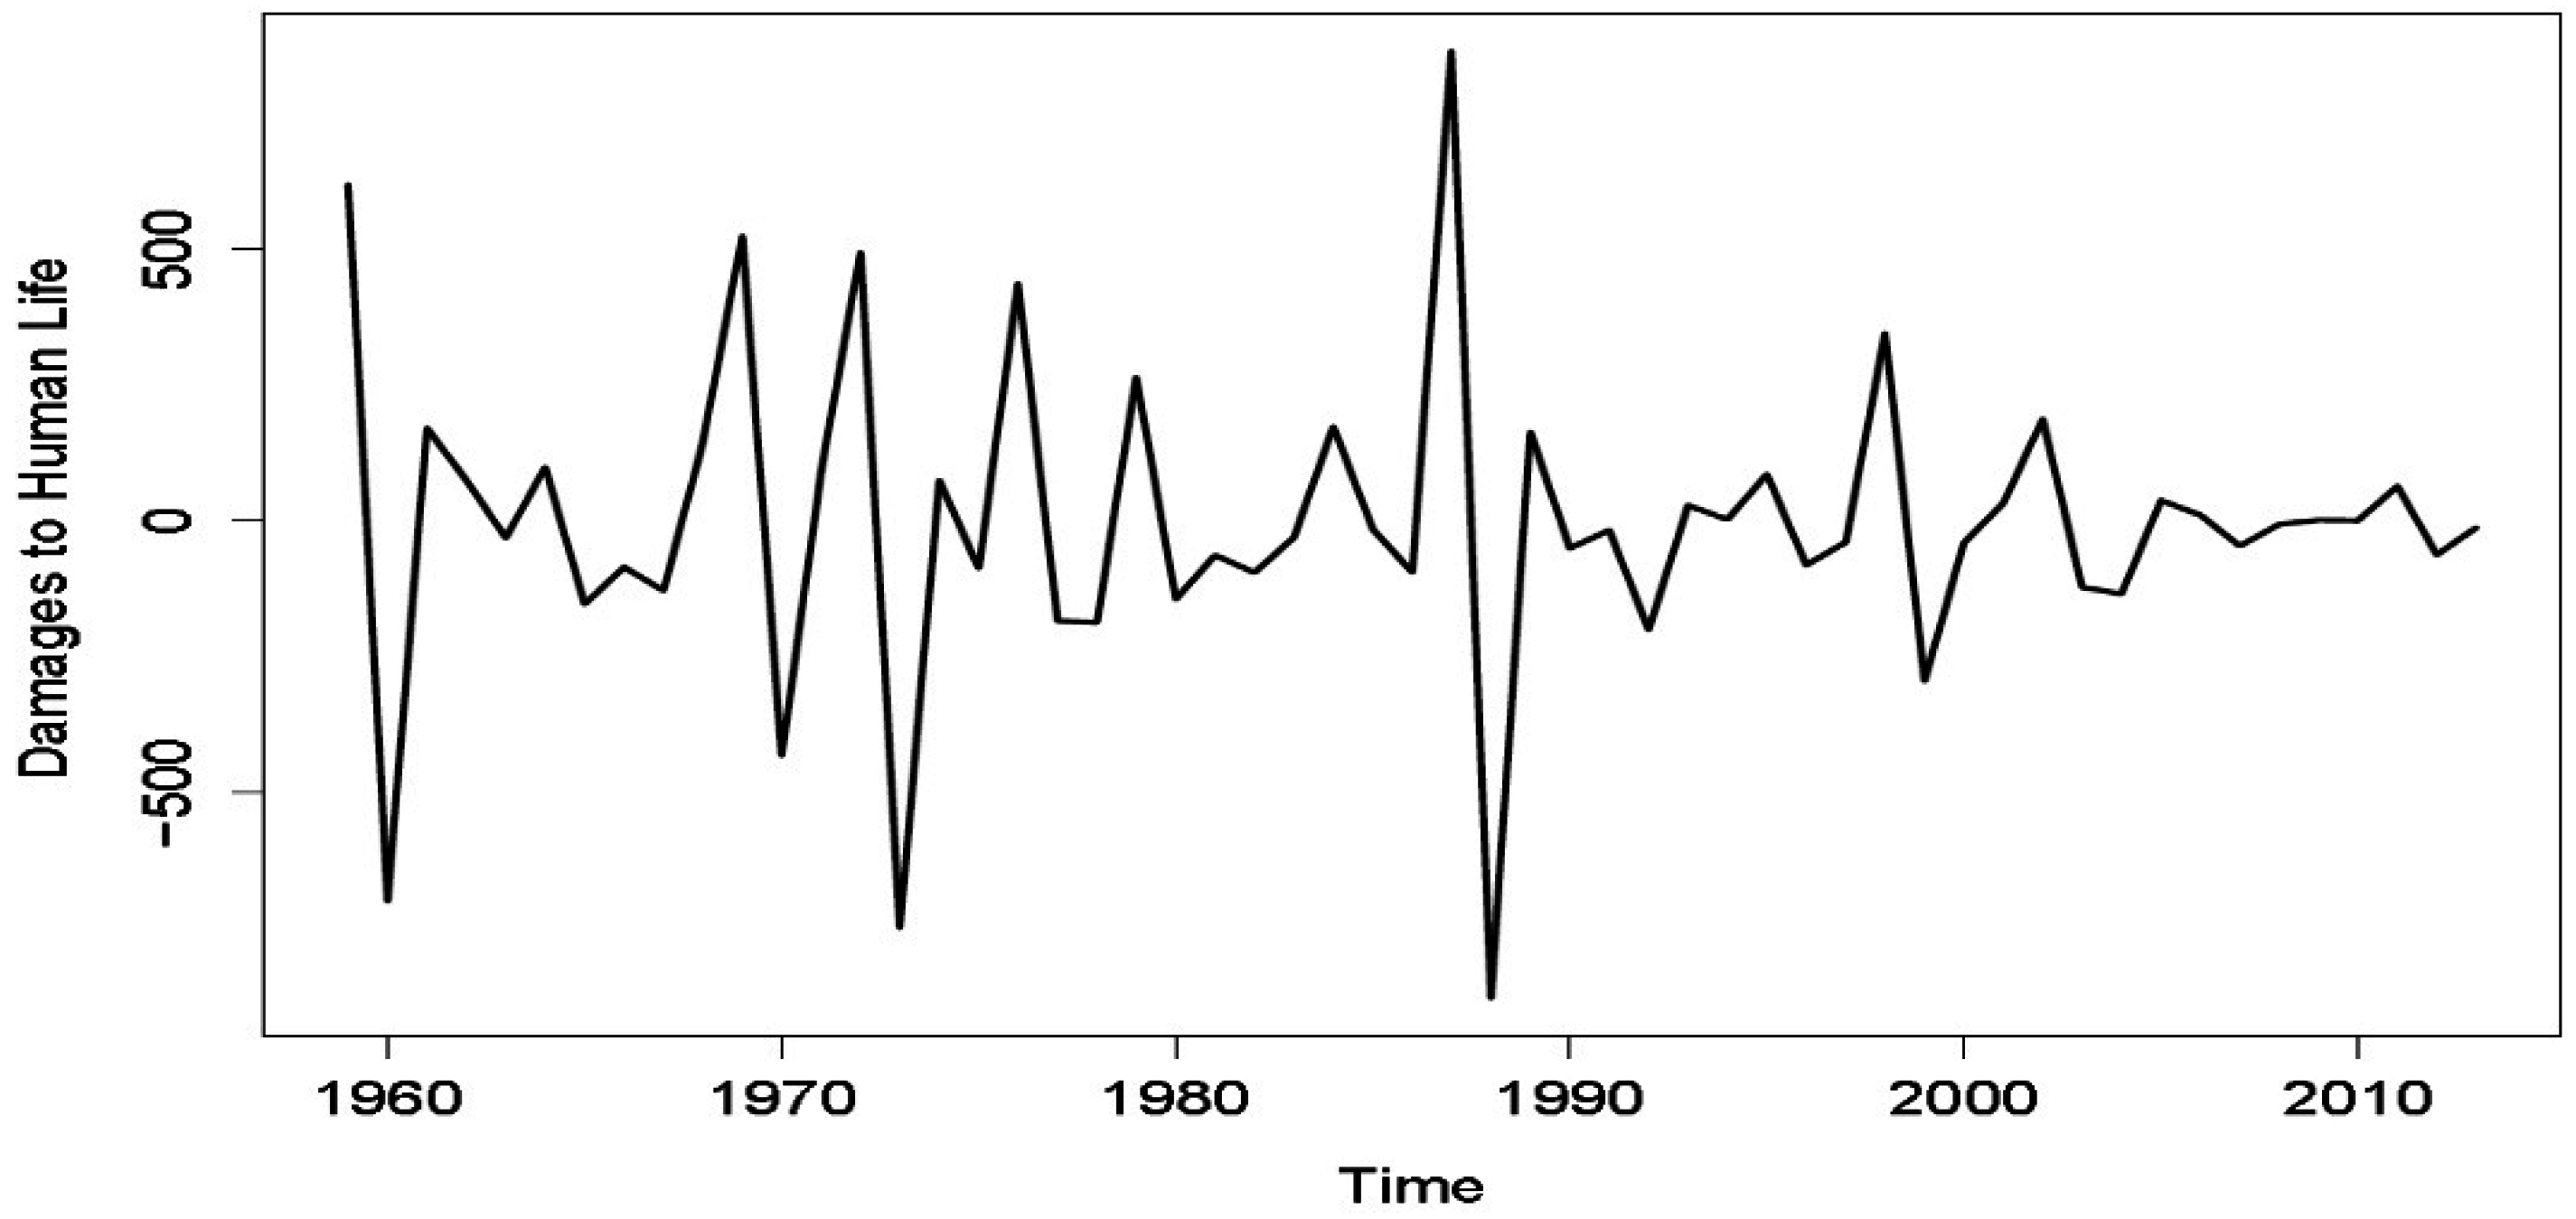
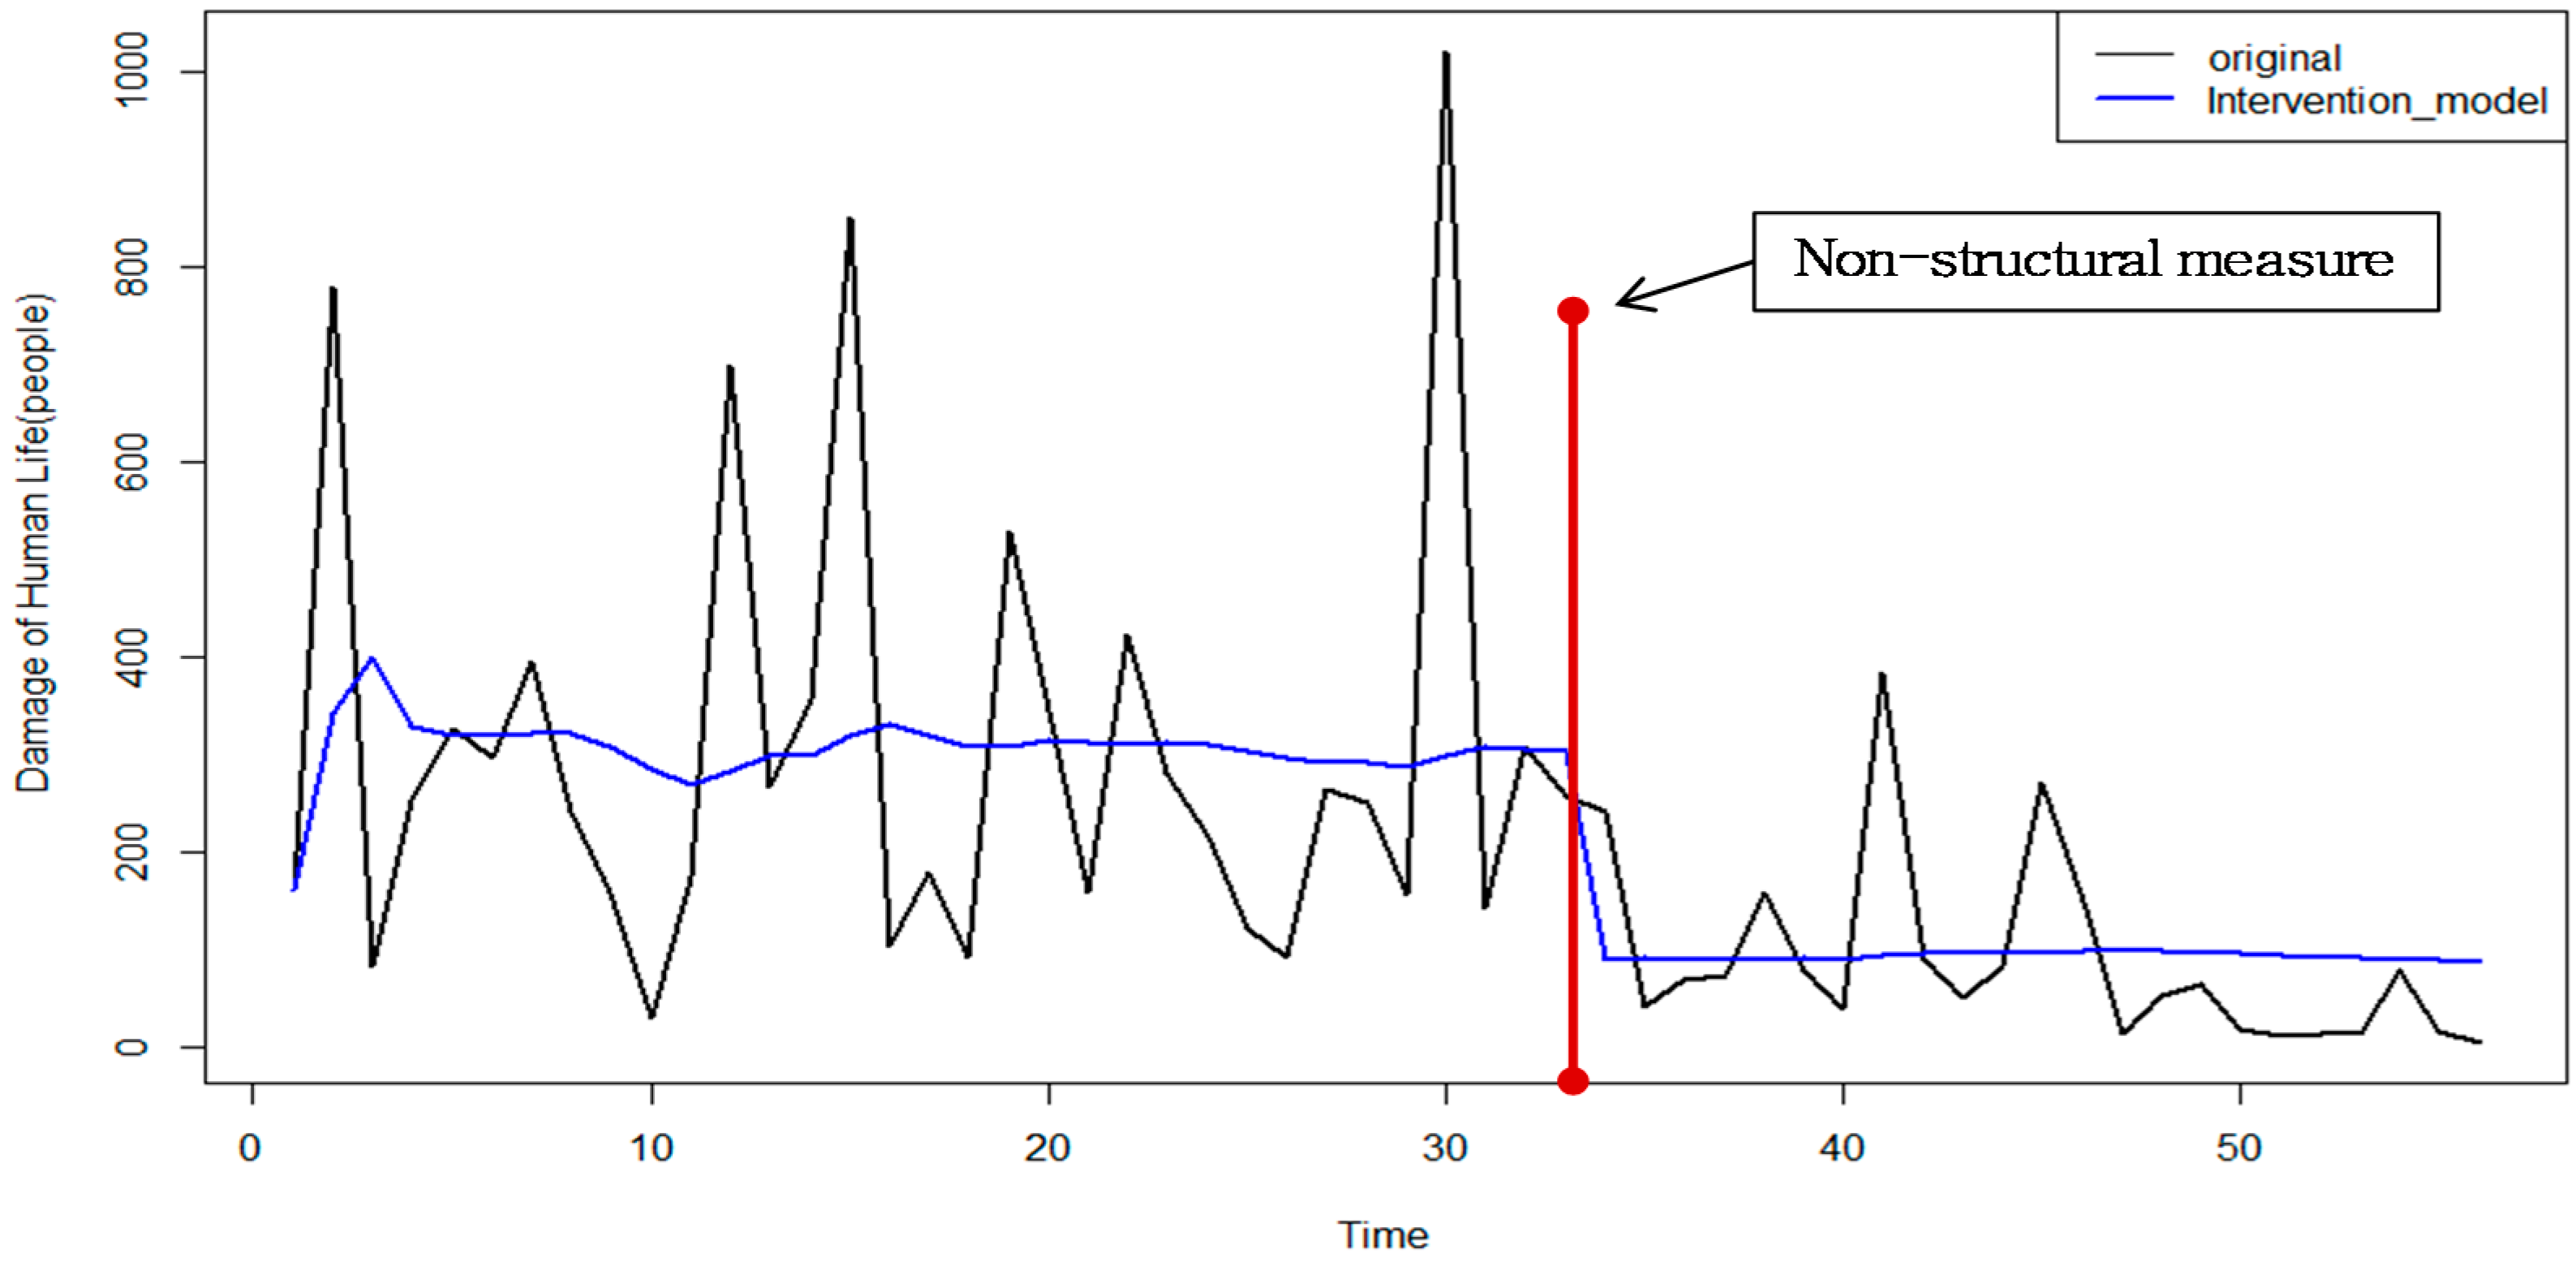
Figure 18.
Raw data and the estimated intervention model (non-structural measures).
Figure 18.
Raw data and the estimated intervention model (non-structural measures).
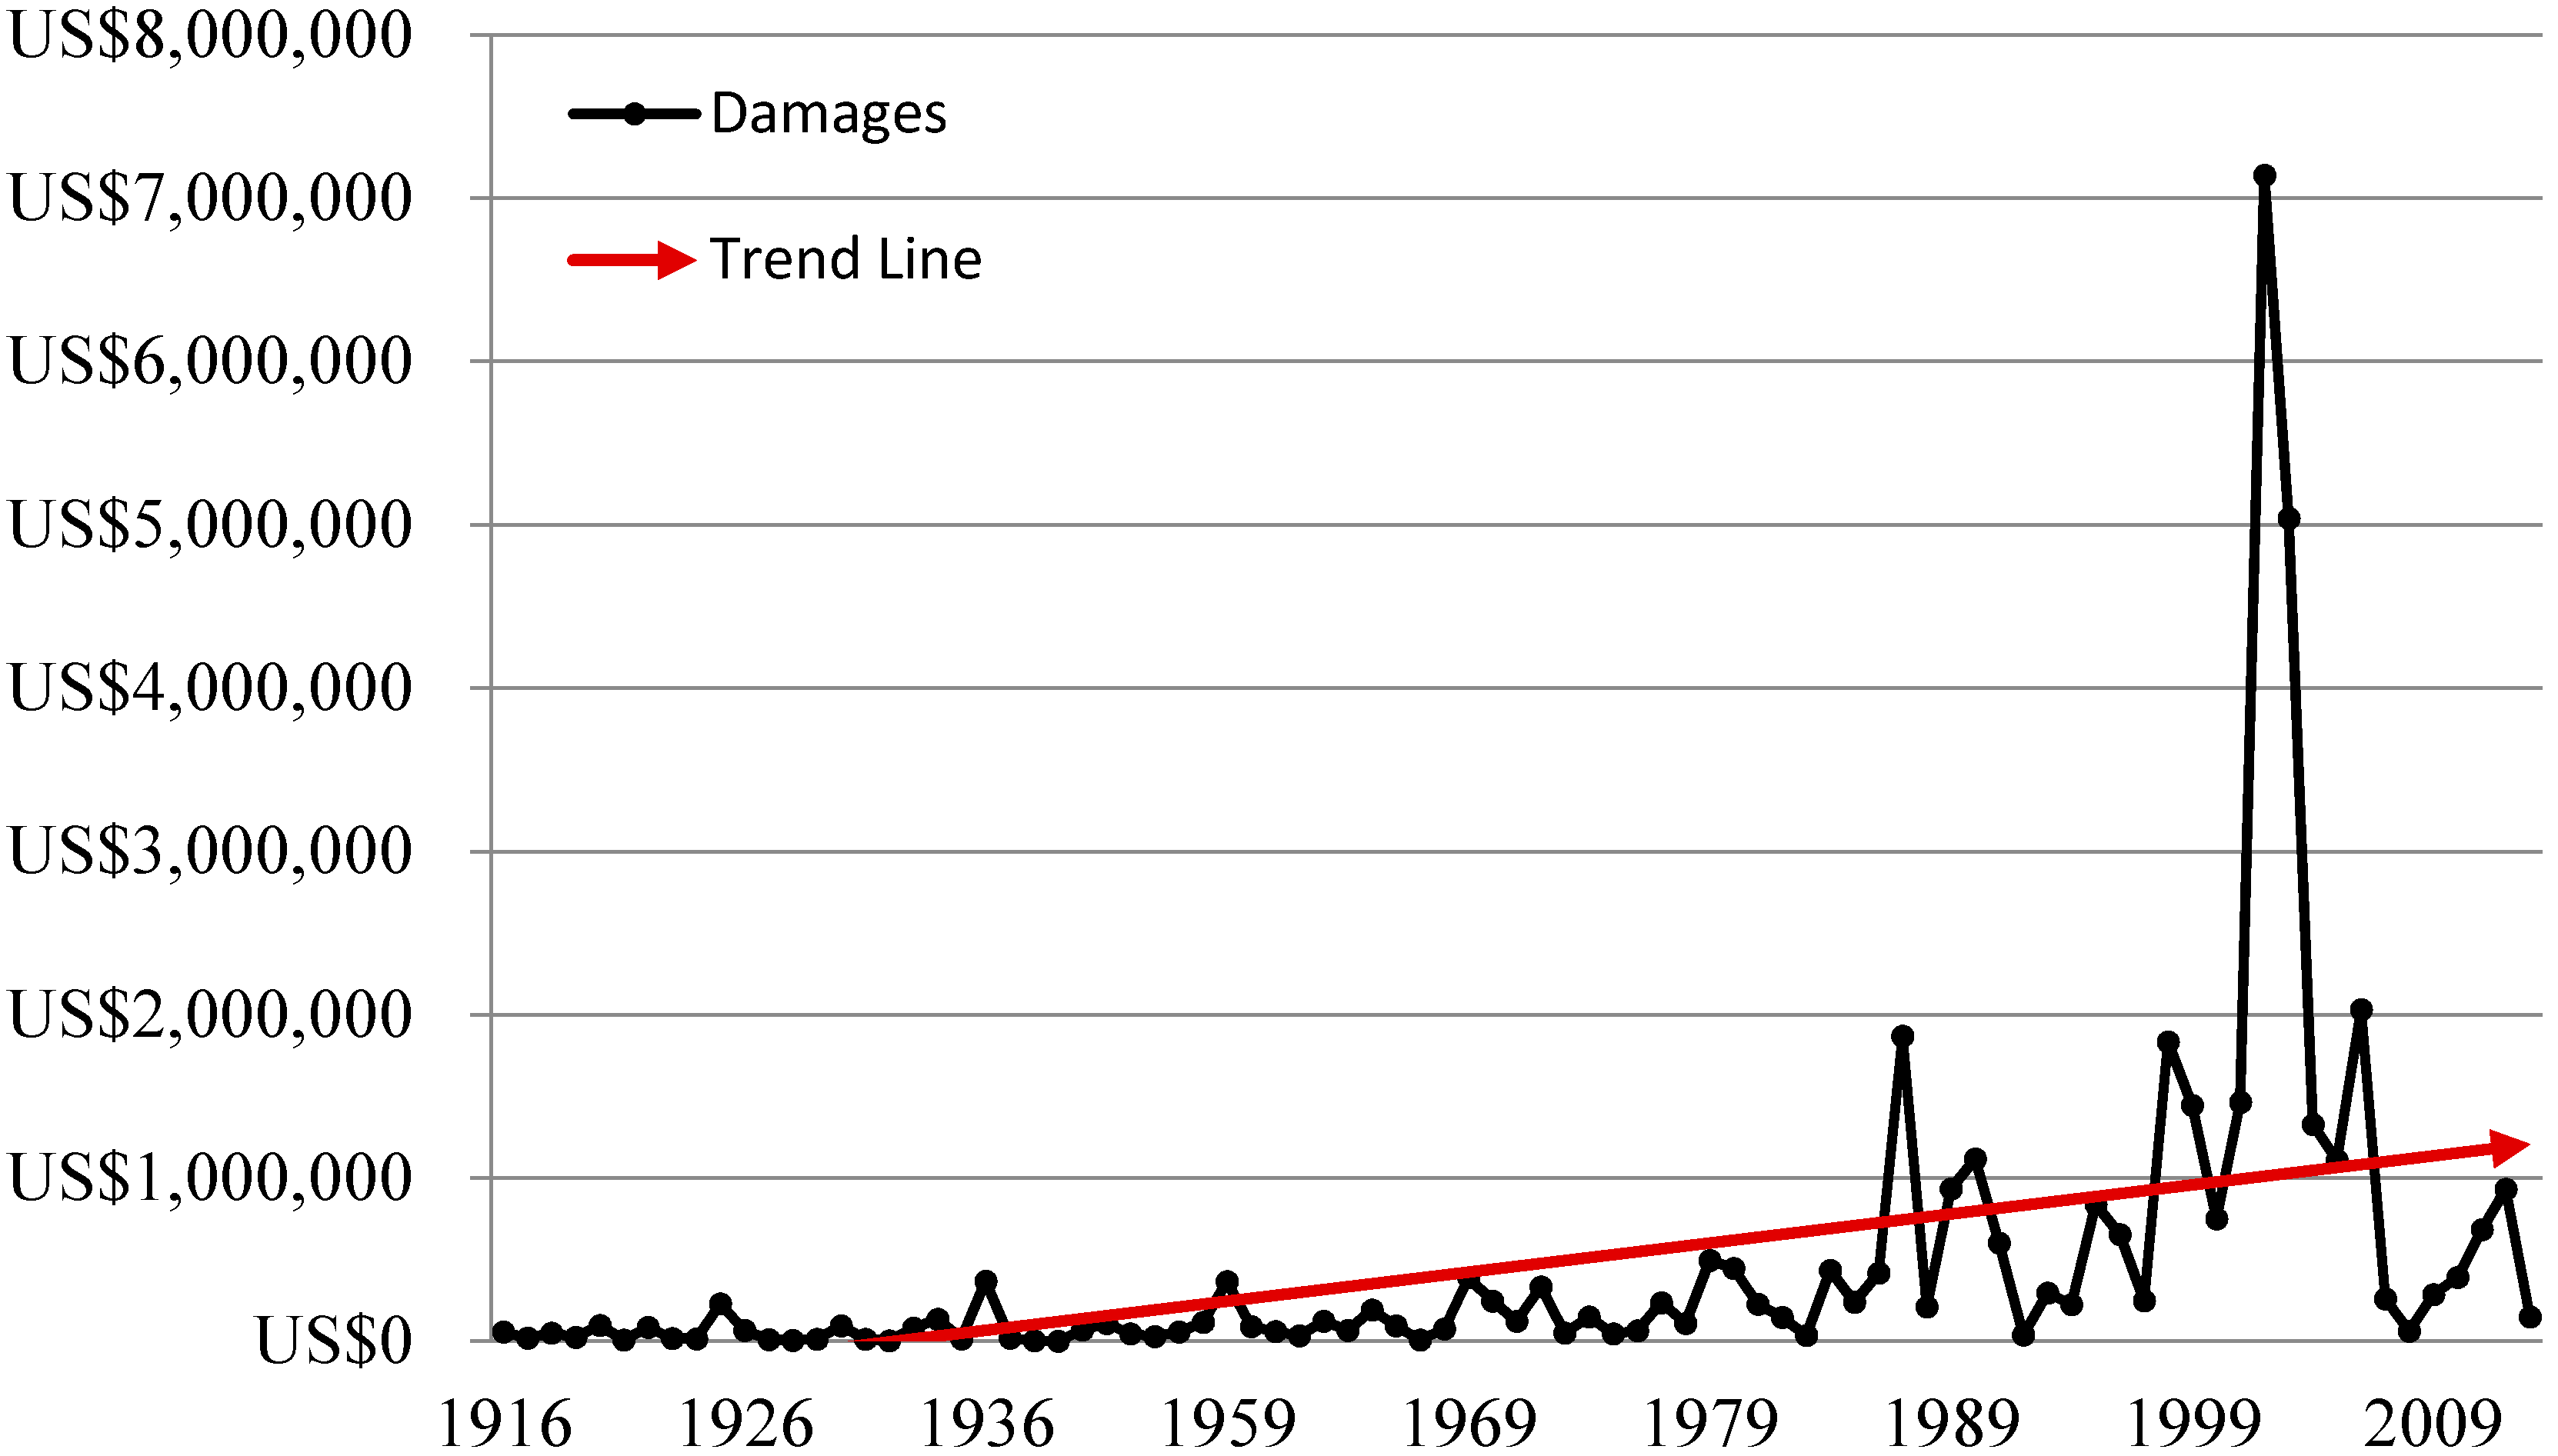
First, the intervention effects of the structural measures gradually influenced flood damages after policy implementation. The size of the intervention effects can be mainly attributed to the continuous and annual structural river management and flood control projects since 1965. However, the reduction in the size of the flooded areas does not necessarily mean lower flood damages, because the monetary amount of damages to public facilities and private property continues to increase (
Figure 19).
Moreover, when the monetary amount of the flood damages is divided by the number of unit areas, flood damages are shown to have increased compared to those before 1960. This is because the rapid economic growth in Korea has increased the urbanization rate by 90 percent over the past 50 years, resulting in a rise in the area of impermeable surfaces and increased run-off in urban areas. Rivers were paved over to be used as roads or for residential development, and the narrowing of the river width distorts the water flow. As a result, flood damages, which had mostly occurred in non-urban areas, such as agricultural lands, now occur frequently in urban areas [
27]. Although flood damages continue to occur in non-urban areas, mostly caused by obsolete defense facilities and poor river management, the resulting damages are expected to be relatively greater in the cities because of their higher densities of goods and population.
Figure 19.
Trend in flood damages from 1916 to 2013, except 1945 to 1957 (conversion basis price in USD, 2013) (source: [
20]).
Figure 19.
Trend in flood damages from 1916 to 2013, except 1945 to 1957 (conversion basis price in USD, 2013) (source: [
20]).
The analysis of the effects of interventions for non-structural measures indicates that damages to human life decreased over the study period by 216 people on average. Further, the effects of the interventions occurred immediately upon implementation, substantially owing to prior evacuation measures based on improved weather information and communications. This result verifies the benefits of flood forecasting and warning systems as argued by the 2014 UNISDR Report [
22]. Similar conditions exist in Japan and Bangladesh. Japan introduced computerized weather forecasts in 1959, and damages to human life rapidly decreased from 1960 to the present. In addition, this change is closely correlated with the television penetration rate [
28]. An analysis of damages to human life caused by major cyclones in coastal Bangladesh showed that the number of fatalities decreased from 138,882 in 1991 to 134 in 1997, after the forecasting system was implemented [
29].
Current damages to human life are mainly caused by flash floods in the mountainous areas (about 70 percent of Korean territory is mountainous with scattered basins), indiscreet development, and inappropriate land use in areas vulnerable to flood damages. In 2007, damages to human life by floods were attributed to rapidly rising streams in the valleys, and river overflow; 46 of every 50 people who suffered damage resided in the mountainous areas [
30]. Other damages were caused by rampant cutting of forests and the construction of sprawling amusement parks (amounting to 50 deaths in 1998) [
30]. Additional details on this topic can be found in studies that analyzed the causes of flood damages in Korea [
31,
32].
Thus, in summary, while the flood-affected areas decreased in size through policy intervention effects, namely, the amendment to the River Act, the flood damages
per se (flood prevention effects) did not decrease. Thus, Korea needs a specific policy/intervention that addresses flood damages. Regarding non-structural measures, this study finds that the flood forecasting and warning systems in Korea are insufficient at this time, and that it is important to accurately predict and notify the public about imminent floods to reduce the associated damages. Moreover, the administrative agencies must be criticized for not taking the necessary steps to prevent sprawling development in mountainous areas or other areas vulnerable to floods.
Table 4 lists the policy recommendations for structural and non-structural measures based on this study’s results.
Table 4.
Policy recommendations for structural and non-structural measures.
Table 4.
Policy recommendations for structural and non-structural measures.
| Category | Content |
|---|
| Structural measures | The existing facilities should be reinforced. Many dams and embankments on big and small rivers in Korea were constructed many decades ago; hence, the repair work, such as functional reinforcement, must be performed in light of the significant changes to rainfall patterns since then. Moreover, repair and upgrading can prevent obsolescence of the embankment facilities and reduce future risk of destruction.
The natural environment of the damaged rivers should be recovered. Even in the absence of their ecological or landscape functions, rivers can prevent floods by reducing the flow velocity.
Mitigation measures for urban areas must be established. While damages caused by poor drainage of inner basins are severe in urban areas, the measures to solve this problem are presently insufficient. Drainage facilities should be continually expanded and managed, and the coordination between rainwater and flood control measures should be improved. |
| Non-structural measures | The ability to forecast floods to cope with local flash flooding caused by extreme weather must be enhanced. A rainfall-flood forecasting system should be created and technologies related to flood forecasting should be implemented to facilitate immediate response to all meteorological and hydrological situations that could influence the rapidly changing river flows that occur in floods.
The government must adequately and promptly warn residents and order evacuations in emergencies. To this end, the government must draw up a plan for flood-related laws and integrate the administrative system.
Flood damages must be prevented by rational land-use planning and management. It is necessary to establish the pre-meditated approaches to land use that limit the construction of buildings in vulnerable areas. |
5. Conclusions
The objectives of this study were to empirically analyze the characteristics of flood damages in Korea and the effects of Korea’s structural and non-structural flood prevention mitigation measures on the extent of flood damages from 1958 to 2013 (a period of 55 years).
First, we theoretically discussed the structural and non-structural mitigation measures for flood damage prevention, upon which we based our general hypothesis and variable selection. Then, we performed a qualitative analysis using data on measures of human, social, economic, and precipitation characteristics as well as events causing flood damages, to examine changes and trends over space and time. Finally, we analyzed the effects of flood prevention measures in an intervention time series model to arrive at conclusions and develop policy suggestions.
The major results of this study are as follows:
The intervention effects of structural and non-structural measures analyzed using time series data covering the past 55 years were significant. Structural intervention effects emerged slowly in flood-affected areas, whereas the non-structural effects on damages to human life were immediate
The analysis of the characteristics of flood damages found that structural measures did not reduce flood damages, because no measures accounted for flood risk factors, or changes to the socioeconomic factors and population growth, which accompany rapid urbanization. On the other hand, non-structural measures, including prior (prevention) planning based on information from computerized weather information systems, were successful in reducing flood damages
Based on the overall results of this study, we provided policy suggestions for flood mitigation measures in Korea. For structural measures, we suggested upgraded reinforcements and management of the existing facilities, ecosystem recovery for damaged rivers, and new/modernized flood mitigation measures for urban areas. For non-structural measures, we suggested enhanced flood forecasting, revamping the legal regulations on flood control, and new and rational land-use plans
This study is important because its results demonstrate the effects of existing policy measures on flood damages control in Korea and because it employs reliable analytical methods to suggest potential future flood damage prevention mitigation measures and sound policy decisions.


