1. Introduction
In the current efforts to obtain a low carbon energy system, new relationships are emerging between mediating technologies and various types of end-users. Smart technologies are being implemented in many countries including Norway, where the rollout of Smart Meter Systems in people’s homes is expected to be finalized by 1 January 2019. The EU aims to have smart meters installed in 80% of households by 2020. Such metering systems do not require action by the user in order for electricity consumption to be measured and registered. In comparison, self-recording is common in Norway today, which implies that the change to automatic metering is likely to make end-users less engaged in recording than today. Moreover, when used in combination with automated payment and billing systems, it is likely that electricity consumption will become even more invisible to end-users than what has usually been the case.
It has been pointed out that apart from when they pay the electricity bill, end-users are rarely concerned with their electricity consumption. Instead people tend to focus on the services made possible by electricity, such as heating, cooking and cleanliness (e.g., [
1,
2]). Electricity use forms part of home practices which are characterized by routinized behavior often associated with socially conditioned “purposes” [
3]. Gram-Hanssen [
4] gives the following illustrative example to highlight the challenge for energy conservation policy: “When you are cooking, the goal is to serve a dinner and not to save energy.” In the light of these routinized practices where energy is implicated and used for quite different purposes than conservation, the rollout of smart meters and automated payment imply a risk of reducing people’s awareness of the links between energy use and resulting consumption, when no other measures are introduced. Electricity will become more invisible.
Nonetheless, the literature indicates that the introduction of direct feedback through in-home displays may be a promising means to compensate for the growing invisibility of electricity. In response to such findings, authorities in some countries such as the UK require that suppliers provide their customers with in-home displays together with the smart meters. The assumptions underlying such initiatives follow the logic of information measures which build on the so-called “information-deficit” model described by Wilhite and Ling [
5]: Increased feedback leads to increased awareness or knowledge which induces changes in energy behavior and decreased consumption [
6]. The model presumes that customers are motivated to reduce consumption for financial, environmental or other reasons, and that the provision of real-time electricity consumption data will lead to increased awareness or knowledge at the consumer end. Moreover, the model presumes that the new, internalized knowledge will lead to behavioral changes. This approach, rooted in behaviorist models for social change, has been criticized for good reason by many scholars working from a practice theory framework [
6,
7,
8,
9]. In the present discussion, we seek to combine insights from both practice theory and more behavioristic oriented models when accounting for the effects of displays.
We present findings from a grounded, qualitative study on the use of in-home displays in Norway. Initiated as a research project, 33 families received a display and were later interviewed in their homes. We examine the extent to which the use of displays modified daily practices and affected electricity consumption, as perceived by the respondents. The analysis will disclose that the families differed in terms of how the display affected everyday life, and we contribute this variation to some significant contextual factors.
2. The Background Literature
One of the underlying barriers to electricity savings in households is that electricity is largely an invisible good, which means that it tends to escape human consciousness and reflexivity [
10,
11,
12]. The fact that most energy use is invisible to the consumer makes it challenging for users to get a clear idea of how much they are using, how their use changes over time, how it relates to meaningful benchmarks, how it is distributed among different purposes, and how it would be affected by different energy-saving measures. However, the use of different types of information measures might mitigate the invisibility of electricity and lead households to more often implement electricity saving measures. As Grønhøj
et al. [
13] have shown: “Feedback made household electricity consumption more visible and salient, and empowered electricity consumers to take action with respect to lowering their energy consumption.”
The literature reveals that various information measures may have different effects on energy savings. Measures referred to as feedback tend to work better with respect to energy savings than to antecedent information [
14]. Feedback is a way of making the consequences of behavior more salient, and it may be provided in two forms. Direct feedback is real-time information provided by the electricity meter and displayed on a screen or monitor, referred to as in-home displays, while indirect feedback has been processed in some way before reaching the energy user.
A review by Fischer [
15] showed that feedback might result in savings in the range of one to more than 20%, with typical savings in the range of five to 12%. There seems to be a difference in effectiveness between direct and indirect feedback. A review by Darby [
16] found that savings from direct feedback normally range from five to 15%, and Fischer [
15] concluded that direct feedback studies were overrepresented within “best cases”. Recent studies confirm the positive effects of direct feedback on energy savings. Faruqui
et al. [
17] indicate that consumers who actively use in-home displays reduce their consumption of electricity by about seven percent on average. Savings of electricity of 11%–17% are reported by Gans
et al. [
18] in their study of real-time usage information in Northern Ireland. Finally, Grønhøj and Thøgersen [
13] find that the average electricity savings in Danish households from a display is 8.1%, compared with 0.8% savings in their control group.
The above mentioned studies point to the general effects of displays without relating the effects of feedback to the socio-economic, material and cultural context in which the technology is implemented. Hargreaves
et al. [
6] point out that “context is fundamental for understanding the extent to which change effects will be negotiated and realized”. For instance, Carlsson-Kanyama and Linden [
19] indicate that the users’ age and gender influence how they become involved with in-home displays. Murtagh, Gatersleben and Uzzell [
20] find a high degree of variation in terms of the use of energy and displays and discuss the role of people’s previous experience with energy savings. Schleich
et al. [
21] analyzed the effects of feedback on electricity consumption in Austria, and found that the effects are dependent on the total electricity consumption of the households. Middle consumption households seem to be more responsive to feedback than households with either low or high levels of consumption. The authors indicate that the reason for this might be that low consumption households already have exhausted their saving potential, while high consuming households are not willing to reduce their consumption because electricity costs constitute a small share of household income. Moreover, studies have found that users have varying degrees of motivation and engagement with the display [
22,
23].
Other studies have also shown how the socio-technical and cultural context might affect energy savings. Winther and Bouly de Lesdain [
24] compare the extremely different energy saving cultures that have evolved in France and Norway by providing an analysis that encompasses both the socio-material contexts and people’s values and ideas about the good life. Westskog and Winther [
25] found that many Norwegian end-users consider electricity to be a common good. This perception is not congruent with the principle underlying the liberal market pricing system, and the mismatch in “logics” reduces people’s willingness to engage in energy savings. Finally, Darby [
26], focusing on the socio-economic context discusses how smart metering could affect fuel-poor households. She finds that the effects are ambiguous. On the one hand, the restricted access to new technology, know-how and resources might affect the fuel-poor negatively by creating hindrances that prevent them from becoming involved in smart metering technology. On the other hand, the use of smart meters might increase awareness through the potential to develop clear, accurate information by, for instance, deploying energy in-home displays.
The contextual understanding of the effects of in-home displays coincides with an understanding of the uptake of technologies as a socio-technical process in which the interactions between the technology and socially positioned individuals produce the given outcomes. This process is termed “appropriation” (see e.g., [
27]), and describes how users integrate technology into their own lives. It is a matter of reciprocity; individuals influence technology and technology influences individuals. On this basis, Wallenborn
et al. [
27] argue that in-home displays may generally change people’s perceptions of electricity, but only households that are already interested or involved in energy savings are willing to use them actively and learn from the display. These perspectives nuance the picture of the effects of in-home displays. To date there has been much research based on behaviorist models of social change with a simple understanding of the relationship between the object and the individual (see Introduction). As Darby [
28] indicates, more research on contextual differences is needed to understand the potential effects of in-home displays.
Our study contributes to filling this knowledge gap by focusing on two contextual factors that together influenced the effects of displays: respondents’ socio-economic position which affects their motivation for saving and their previous experiences with feedback systems.
3. The Norwegian Context
The Norwegian context is peculiar compared to the situation in other countries which have a high proportion of electricity produced by fossil or nuclear sources (e.g., [
24]). The high proportion of hydropower production (99%) makes most Norwegians think of electricity as renewable per se while in reality the electricity system and markets are closely interwoven with countries producing electricity from fossil and nuclear sources. Because electricity in this view is detached from environmental problems, most people do not see the purpose of reducing electricity consumption for environmental reasons. In addition, given the generally high level of affluence in Norway, the two most often noted reasons for people’s motivation for saving electricity—reducing costs and environmental concerns—often do not apply. Further, as Westskog and Winther [
25] point out, many Norwegians seem to consider electricity to be a common good, not a market commodity. This is due to the high proportion of electricity supplied from hydropower. Historically, hydropower was developed in Norway by building dams and regulating rivers, which many people argue belong to the people of Norway.
Another distinction between Norway and other countries is the large volume of electricity consumed by residential customers because electricity is commonly used for space and water heating. (Approximately 64% of the yearly electricity consumption in Norwegian residences is used for space heating and 15% is used for water heating [
29].) The annual, average electricity consumption of households is approximately 16,000 kWh [
30]. This relatively high volume indicates that Norwegian households have considerable potential to reduce electricity consumption.
Today Norwegian households have a mechanical meter which they read manually four, six or 12 times per year [
31]. The meter value is reported to the electricity utility via web, SMS, mail,
etc. A bill is sent to the customer after every reporting period.
In the Norwegian deregulated power system, the distribution system operator (DSO) and the power retailer are two separate entities. This implies that all customers have two separate contracts: one tariff for their use of the grid and one contract for their energy use [
32]. Both the network tariff and the energy price are flat in that household consumers pay a given price per kWh irrespective of their level of consumption, in addition to constant costs. In the planned rollout of smart meters in Norway there is no requirement that in-home displays must be provided to households. The Norwegian regulations only specify that smart meters must provide a standardized interface to accommodate for the use of in-home displays. The regulations require electricity consumption to be metered at least every 60 min, and the meter data must be made available to the customers via a website within 09:00 am the next day. However, it is unclear to what extent end-users will actively access information about their electricity consumption.
4. Method
This paper presents the results from two pilot projects in which in-home displays were installed and used in a number of Norwegian households. The displays may be used in combination with both smart and conventional meters. The material is based on in-depth interviews with 33 of these families in their homes. Below we present the selected technologies and recruitment procedures for each of the qualitative experimental trials, before accounting for the process of data collection and analysis.
4.1. Selection of Technology and Sample, Pilot Project One (eWave)
The first experimental trial was carried out in the period 2010–2012 in Follo (the eastern part of Norway) and Askøy (the western part of Norway). The participating households were self-recruited through advertisements which focused on the display’s capacity to provide consumers with better control of their electricity consumption and bills. The advertisements were published on the grid companies’ website and in the local newspapers. Eligible families had to have an annual electricity consumption of at least 20,000 kWh, which implied that mainly owners of detached houses participated. This lower limit of 20,000 kWh per year was chosen because the pilot project wanted to focus on customers that had a great potential for energy efficiency. An upper limit of 40,000 kWh per year was also set because the pilot project should not include customers with an abnormally high consumption due to outdoor heating cables, swimming pool, etc. Further, the participants in the test group got the display for free.
A proto-type of the in-home display “eWave” was installed in 91 homes and electricity consumption was registered every second month. However, due to technical problems with the prototype, many displays did not function well and the results were not recorded properly. Therefore, the consumption data remains highly uncertain and are not included in this study.
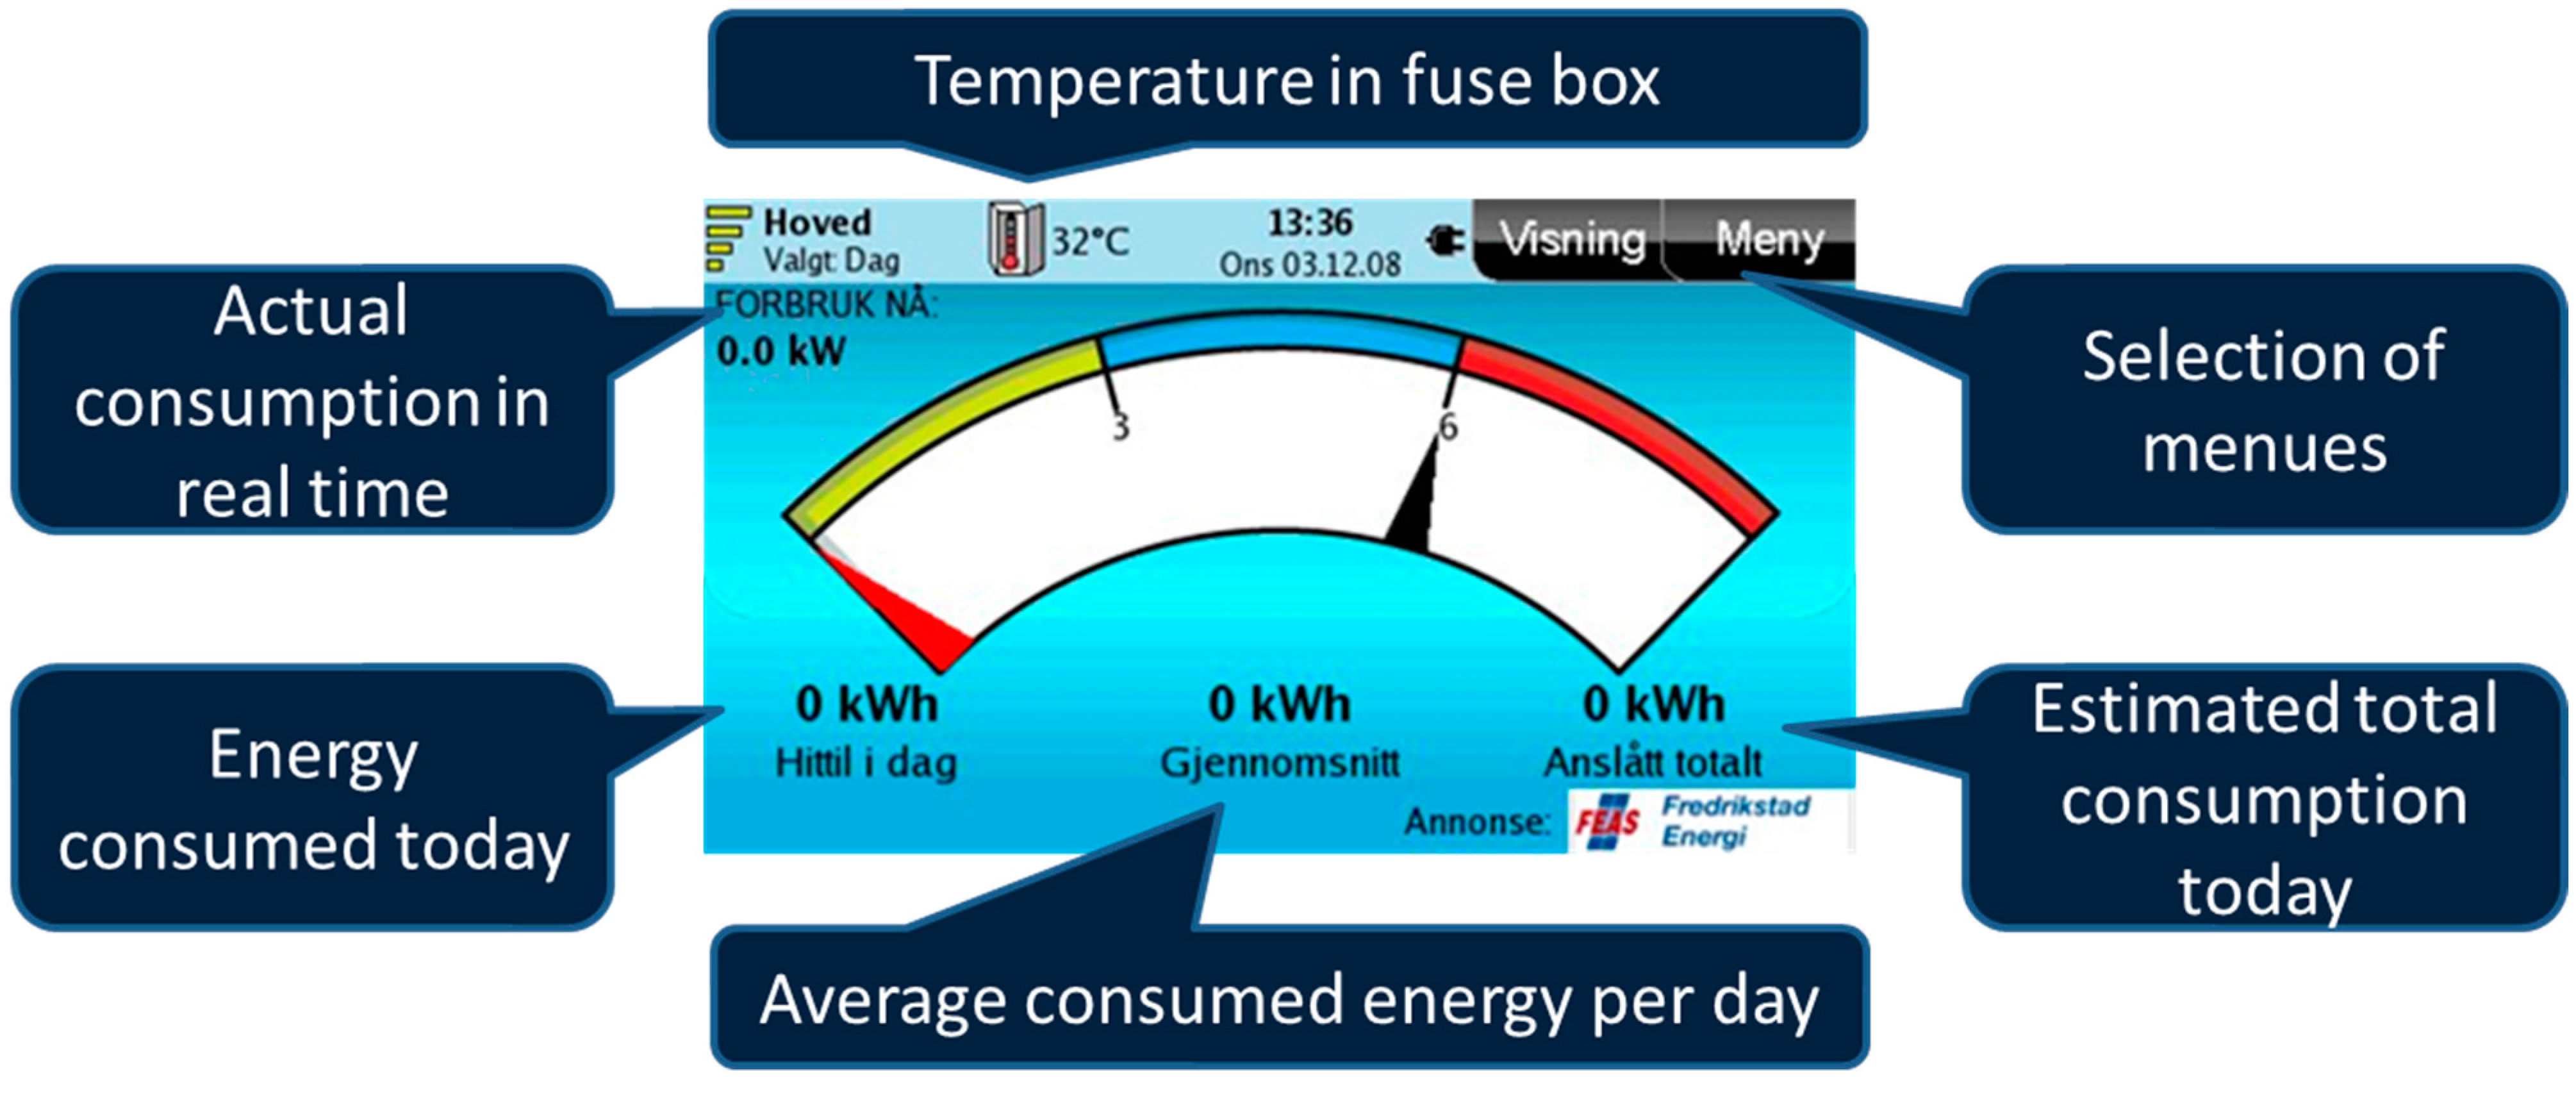
The screen of the eWave display is shown in
Figure 1.
Figure 1.
eWave in-home display.
Figure 1.
eWave in-home display.
Three customer surveys were carried out. One survey was carried out before the start-up of the pilot, one three months after the installation and one at the end of the pilot project. The survey results provide important background data for the present study. Approximately 80% of the test families lived in detached houses whereas 48% of Norwegian families live in detached houses [
30]. When the test families were asked why they had decided to join the study (the categories were pre-defined and respondents could give more than one reason), more than 90% said it was to obtain better overview and control of electricity consumption, and save costs, 60% said it was because they were “technically interested”, 70% gave environmental reasons and 35% said it was to obtain a display for free [
33].
To enhance a more detailed understanding of how the proto-type eWave display was used in people’s homes and how people perceived the effects of displays on electricity consumption, nine of the test families (five in Askøy and four in Follo) were recruited in 2012 for in-depth interviews which were conducted from one to 1.5 years after the families had received the display. Due to the mentioned technical challenges, two of the families interviewed had problems with the display.
4.2. Selection of Technology and Sample, Pilot Project Two (Solo II)
To obtain more families in the qualitative sample we selected another type of display, Solo II. The Solo II in-home display was chosen based on the technology available in the market, price and positive experiences from some Norwegian Distribution System Operators (DSOs). Solo II is produced by Green Energy Options in the UK, and had been on the market for a while, thus it represented a relatively mature technology. For comparative purposes it would have been ideal to have the same display tested in the total sample, but due to the technical problems faced by the first generation of eWave this was not a fruitful path.
A preliminary analysis of the data from the first pilot (survey and in-depth interviews) indicated that the participants were more affluent than the average Norwegian family (see further details below). Finally, the families in the first pilot were self-recruited through a publicly announced campaign in two municipalities, which increased the possibility of engaging people who were particularly interested in energy consumption [
27]. Such sampling bias constitutes a challenge in empirical energy research, and by collaborating with a housing association we aimed to recruit ordinary people in terms of people’s level of affluence and interest in energy consumption.
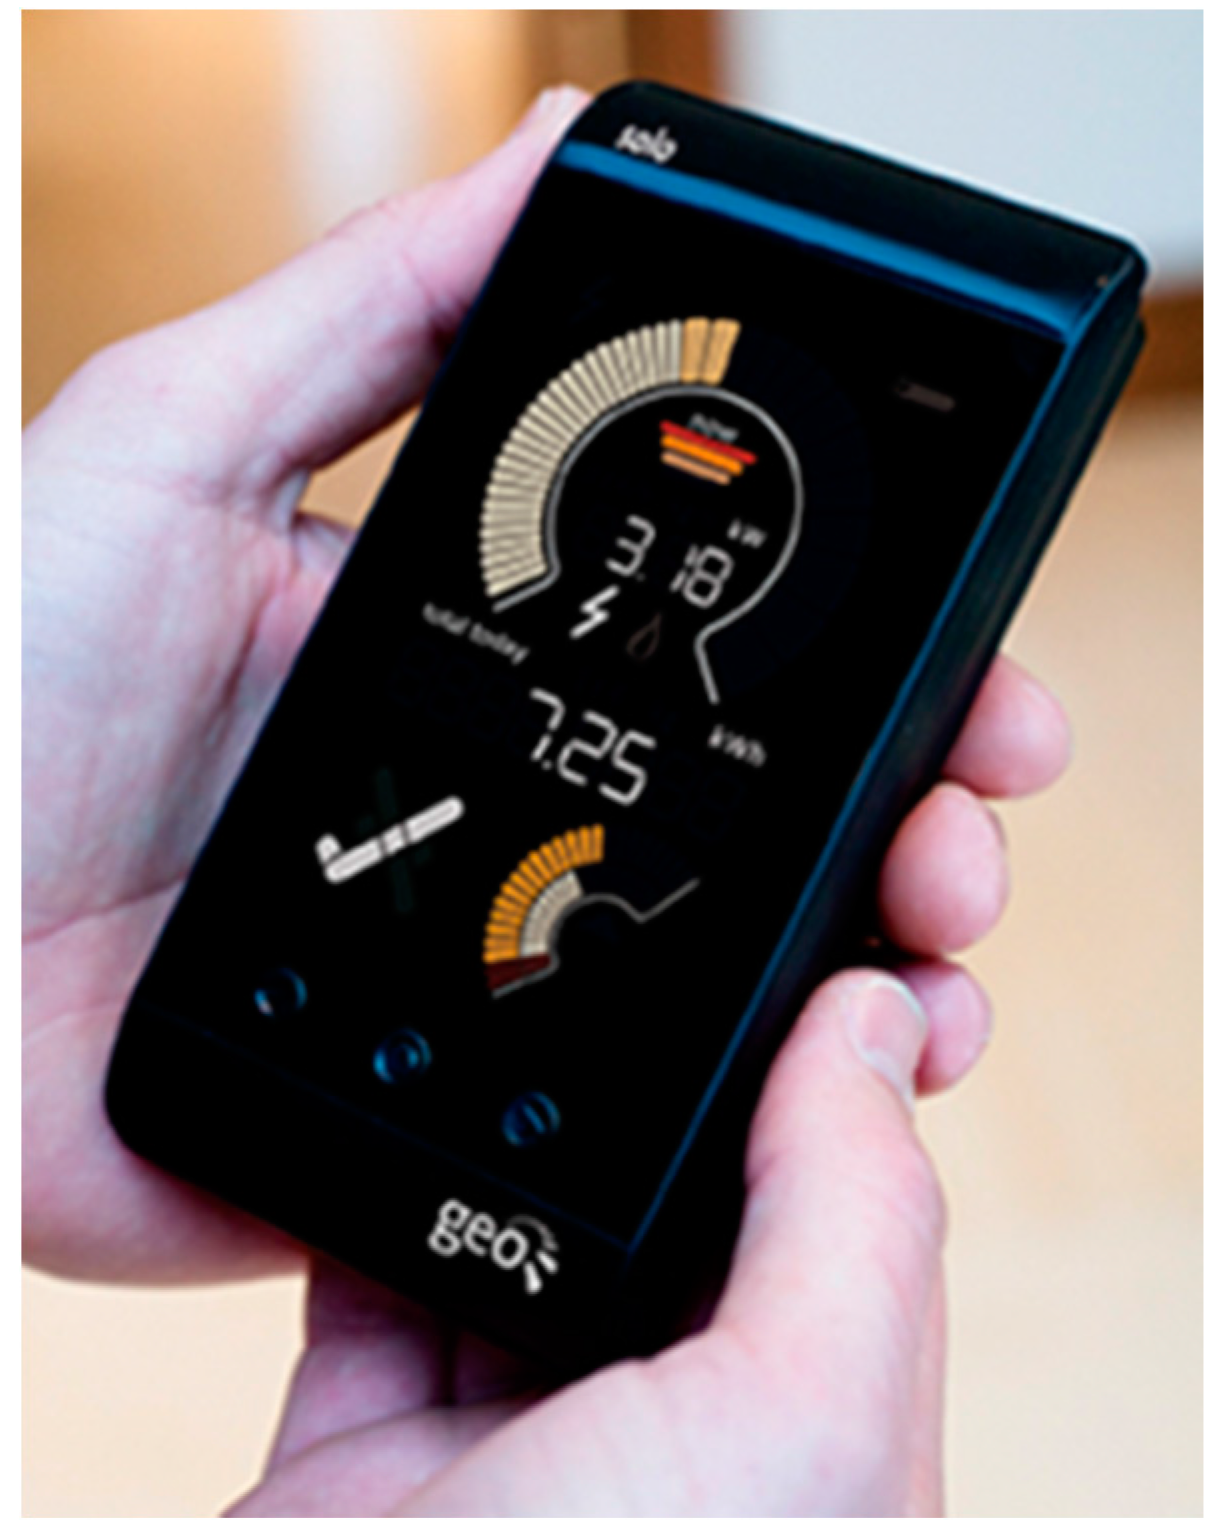
To obtain spread in the total sample we therefore decided to include a number of flats in a housing association in Oslo (Røverkollen) where the Board had a positive attitude towards collaborating and facilitating the recruitment of families. In addition to the above mentioned reasons, this housing association was selected because the flats were heated with electricity (electric resistance ovens), thus we expected the households to have higher electricity consumption (potentially increasing the effect of displays) than what would be the case in housing associations with water carried district heating as their primary heating source. The display Solo II is shown in
Figure 2.
Figure 2.
Solo II in-home display.
Figure 2.
Solo II in-home display.
The building construction in Røverkollen was established in 1974 and consists of five blocks with either four or nine floors, 15 separate entrances with 238 apartments (ranging from two to five rooms in addition to kitchen and bathroom). There are restrictions on energy-related practices in that inhabitants are not allowed to install heat pumps or use certain machines (e.g., washing machines) after eight p.m.
In September 2013, the Board of the Røverkollen housing association sent out a letter to all 125 families living in selected parts of the association, with an invitation to participate in the study to be carried out by the researchers. Seven blocks were included because they had relatively recently had their hot water system changed from individual water heating (running on electricity) to joint metering of hot water consumption. The remaining entities were in the process of changing hot water supply, thus forthcoming changes in consumption due to this change would have been expected during the research period, and they were therefore avoided.
A total of 26 families responded, and shortly after (November 2013) they received a display; 24 of the families were interviewed, from one to three months after installation of the display. Although this study is based on qualitative data obtained through people’s own assessments and accounts of changes in daily practices, we also measured the participating families’ actual electricity consumption before the displays were introduced (October 2013), during the test phase (January 2014), and one year after installation (November 2014). We compared these figures with consumption data of 108 families living in the same blocks who were not included in the study. The association has a joint agreement with an electricity supplier and pays the electricity charges in bulk to the company. Flat owners are billed monthly for a nominal level in advance of consumption, whereupon the balance is issued for payment once a year (February). As mentioned, measuring physical consumption was not an option in the other pilot (eWave) due to poorly functioning displays.
4.3. Data Collection
Prior to recruitment, the participating families in the pilot projects were promised that they could keep the test displays as a gift and that those willing to participate in an interview would receive a gift card worth 60 Euros as compensation. The opportunity to obtain a gift card was announced to the families in the Røverkollen housing association as part of the recruitment process to motivate families to participate and reduce the chance that only households with a high interest in technology and energy would join the study. In Follo and Askøy, respondents had already agreed to have a display and had been using it for a while when we asked for interviews and offered a gift card for their participation in an interview.
The eWave and Solo II are similar in that they show real-time consumption through a speedometer dial with different colors as well as accumulated consumption (compared to a set norm) which is displayed in either monetary or technical values. Solo II also visualizes accumulated consumption in the form of a “fuse” which varies in color from green (below norm) to red (above norm). Both types allow users to access their electricity data through the web. The displays communicate wireless and can be used together with conventional meters as well as with smart meters.
The displays are relatively easy to install, but both pilots provided personal assistance during installation, in one case (eWave) through the supplier of the display, and in the other case (Solo II) by a research assistant. The families were given a short explanation of the different functionalities of the display and the families in Røverkollen received a written manual. With input from the family members present, the installer recommended where to place the display. Based on the families’ stated monthly consumption in the past, the installer set the norm for electricity consumption. This level, the value either displayed per month or per day, according to the family’s preferences, would then be the reference level against which performance (electricity consumption) would be measured. The families received information about how to adjust their reference level, but few reported that they had done so. This means that the reference level was not regularly adjusted according to changes in weather conditions (e.g., summer versus winter) or other reasons for changes in energy use. The users nonetheless seemed to be aware of such causes for changed energy use, and they related and responded to the various types of information offered by the display in a variety of ways, as we elaborate below.
The interview guide included the following topics:
- -
Family composition and socio-economic background
- -
About the display—how they used it, how they assessed it and the perceived effects of the in-home display on electricity use
- -
Interactions with others (family and friends) related to the display
- -
Possible reasons for saving electricity
- -
Views on monitoring, data privacy and security and possible responses to shifting electricity prices during the day
- -
Electricity and the good life
The interviews were recorded and transcribed. Subjects of importance for the analysis were coded in NVivo (NVivo is a qualitative data analysis computer software package intended to facilitate organizing and analyses of non-numerical or unstructured data). The themes for coding followed the topics of the interview guide. In addition, new themes arose from the material, such as the respondents’ childhood family practices related to energy savings, their awareness of energy saving measures from earlier experience with watt meters (see below) and the extent to which they had become aware of the link between the level of electricity consumption and the use of different appliances after receiving the display. In addition, we systematized the data and made profiles of each family in Excel-sheets.
Table 1 shows the main characteristics of the 33 families interviewed, of which nine were included in the first pilot using eWave—living in Follo (F) and Askøy (A)—and 24 families were included in the second pilot using Solo II—living in Røverkollen (R). 33 of the homes were owner occupied and two were tenants (R7, R21). The respondents using eWave were mainly of Norwegian origin, whereas 11 of the families using Solo II had at least one member who had immigrated to Norway (from Asia, Africa and Europe).
Table 1.
Characteristics of the sample: Family composition, type of dwelling and gender of respondent. The respondent codes refer to the geographic location of the pilot (eWave: A = Askøy, F = Follo, Solo II: R = Røverkollen) and the interview number in the two pilots (pilot 1 with nine interviews and pilot 2 with 24 interviews).
| Family composition | Number of respondents | Respondent codes |
|---|
| Two or more adults | 8 | A6, F2, R2, R3, R10, R14, R23, R26 |
| Couple with child(ren) | 16 | A7, A8, A10, F1, F4, F5, R5, R7, R9, R11, R13, R15, R17, R18, R21, R25 |
| Single parent | 4 | R1, R4, R8, R12 |
| Single person household | 5 | A9, R6, R19, R22, R24 |
| Income groups | | |
| Financially constrained | 11 | A9, R1, R6, R7, R11, R12, R13, R15, R18, R19, R23 |
| Middle income | 16 | A10, F1, F5, R14, R17, R2, R3, R4, R5, R8, R9, R21, R22, R24, R25, R26 |
| Well off | 6 | A6, A7, A8, F2, F4, R10 |
| Type of dwelling | | |
| Detached house | 7 | A6, A7, A8, A9, A10, F2, F4 |
| Semi-detached | 1 | F5 |
| Flat | 25 | F1, R1-26 |
| Gender of respondents present during interview | | |
| Only female | 9 | A9, R1, R6, R12, R13, R19, R22, R23, R25 |
| Only male | 10 | A8, F1, R2, R4, R5, R8, R10, R15, R21, R24 |
| Both female and male | 14 | A6, A7, A10, F2, F4, F5, R3, R7, R9, R11, R14, R17, R18, R26 |
For reasons of discretion, the two pilot studies did not ask respondents about their level of income, but instead collected banded income data. We base the income categories on the following criteria:
“Financially constrained” families have one member with low-income employment or they receive social support.
“Middle income” implies that the family has one or two members with middle-income employment.
“Well off” implies that the family has at least one member with high-income employment.
To illustrate the monetary value of these income levels, we draw on statistics on the average income levels for various types of occupations in Norway [
34,
35]. Social support for a single parent with one child: 11,600 Euro, unskilled worker: 43,400 Euro, craftsmen: 50,600 Euro; academic professions: 72,300 Euro, general director: 107,000 Euro. This indicates that the “financially constrained” have an annual household income of less than 40,000 Euro, the “middle income” families make between 50,000 and 100,000 Euro per year and the “well off” families have an annual income above 100,000 Euro. The average income in Norway is 56,230 Euro per person [
34].
The table shows that respondents in Røverkollen are more often financially constrained; one household could be characterized as well off, 13 had a middle income and 10 were financially constrained. This would be expected based on the type of housing in which they live; flats tend to be smaller in size and less expensive than detached houses which are common in the other sample. The families interviewed in Askøy and Follo were quite well off; five were well-off, three were in the middle income group and one family was financially constrained according to how we define the income groups (see above). The impression that respondents in Askøy and Follo were relatively affluent corresponds to what was found in the eWave survey which asked respondents to state their level of income and which included these respondents. In the survey, more than half of the participating households had an income larger than 86,200 Euro [
33], thus far higher than the average income level in Norway. The registered annual electricity consumption in Røverkollen varied from 7000–18,000 kWh, with 8500 kWh being the most common level, whereas 18,000 kWh was a typical level in Askøy and Follo.
6. Discussion and Conclusions
In a study of smart metering, displays and fuel-poor households, Darby [
26] finds that the effects are ambiguous. On the one hand, fuel-poor households have limited access to new technology, know-how and resources, and this might affect them negatively by creating hindrances that prevent them from becoming involved in smart metering technology. On the other hand, when smart meters are used in combination with in-home displays that provide clear and accurate information, this may increase people’s awareness of their electricity use and empower fuel-poor households. Darby’s study points to the importance of examining the socio-economic context when studying and projecting the effects of displays.
The study presented here contributes to the understanding of how contextual factors such as people’s affluence and previous experience might influence the effects of information measures. The project looked at two fairly similar technologies for monitoring electricity consumption which were introduced in households with various levels of affluence and previous experience with monitoring consumption. Our data allow for recognition of potential differences in the way various types of households interact with the in-home displays. The affluent respondents living in detached houses tended to be accustomed to monitoring consumption before the display was introduced. Nevertheless, they appreciated the way the new display monitored consumption, and after one and a half years in operation, most of the families continued to keep the device in a central place and watch it regularly. They let it report on irregularities and remind them to adjust various electricity consuming items, and in this way it provided them with control over consumption. These families had a clear picture of the baseline [
6], that is, their normal or usual level of consumption. In short, families accustomed to monitoring their consumption used the display for controlling that nothing was wrong. They did not think they had reduced consumption due to the display and they did not use the information provided by the display to initiate new energy saving measures. This was because the potential for savings was already tapped when the display was introduced. Due to the limited sample size, we are not in a position to identify the relative significance of affluence
versus previous experience. However, in our previous empirical work in Norway in which we studied people’s attitudes towards energy savings [
25,
36], relatively well-off respondents tended to show limited interest in energy saving measures. Therefore, our impression is that the most important feature of the “eWave” sample is people’s keen interest in and experience with monitoring, which makes them a rather untypical sample of the Norwegian population, regardless of wealth category.
Among the less affluent flat owners, the notion of “control” was also commonly referred to, but in these cases, being “in control” was specifically linked to the family’s management of finances. They felt the display provided important information which would prepare them for the next bill. Instead of waiting for the yearly balance, which could either be a pleasant surprise or a major problem (high bill), they felt they were in control when they received continuous information about performance and how much money they would spend. This finding partly contradicts the conclusions from the study by Hargreaves and colleagues [
6] who found that some of the financially constrained UK customers became disempowered from using the display. When poor UK households observed the specific monetary value associated with various types of consumption, this would create anxiety and frustration for them. In the present study from Norway, one of the central findings is that people, in particular those with financial constraints, appreciated the detailed information which gave them control over their finances, and in this sense the displays empowered them. An explanatory factor for the difference between the UK and Norway might be that the Norwegian families who are defined in this study as “financially constrained” might have been less materially deprived than the poorest UK families.
Regardless of their financial capacity, all the flat dwellers had gone through a specific process of learning which had the following sequence. First, they tested out and learned about the consumption of individual appliances, which often triggered a comparison between various appliances and how much they consumed. This confirms the monitor’s potential for making energy-use visible and “relational” [
6]. Second, the testing phase resulted in various kinds of responses (behavioral changes). Appliances and heating devices which consumed more than what they considered to be normal were replaced with new ones. With regard to future purchases, respondents said they would look for electrical appliances labelled as energy efficient. Hence the display affected people’s investments in energy saving measures. Furthermore, the display motivated people to make reductions. The families modified their daily consumption patterns (habits) in various ways, especially with regard to cooking, heating and lighting. In comparison, the families who were already experienced with monitoring consumption had gone through this learning process before the display arrived, which is the main reason they thought the display had not affected their electricity use. In contrast, most of the flat owners expressed the expectation that the completed adjustments had led to reduced consumption. This perception was supported by the physical measurement. It is interesting to see that these evaluations of effects largely contrast with their stated rationale for joining the pilot project, which was mainly to “learn about” their own electricity consumption.
Much of the research on the effects of information measures such as direct feedback mechanisms and in-home displays presupposes that through conscious or reflexive processes and increased knowledge people will change their behavior based on the information provided. However, as critiques of this information-deficit model have argued [
5,
6,
20], information measures and their projected effects need to be considered within the socio-cultural and material context in which they are implemented. Our results show that the information-deficit model had considerable relevance in the case of low income households without previous monitoring experience. We argue that the reason why the observed dynamics in this case fitted with the model was, firstly, that the users were in fact concerned about their costs and were motivated to reduce them. Secondly, their lack of previous experience with electricity monitoring implied that they considered the information to be useful for understanding and thereafter potentially reducing consumption. The users perceived the information to be clear and the feedback was immediate and user-specific, which observers point out is a criteria for success [
16]. To the other group of households, the information-deficit model was clearly not relevant. This was partly because people were already accustomed to monitoring consumption, thus they already had access to the knowledge provided by the display. In addition, due to their higher level of affluence, they were not compelled to focus on savings. Our results confirm the findings of Schleich
et al. [
21] that the effects of displays differ across household groups and the degree of affluence. We nuance these results by also showing the importance of previous experience with monitoring of electricity for the effects of feedback.
Related to the ignorance of the differences across household groups, the information-deficit model might both overestimate and reduce the potential effects of in-home displays. One risks overestimating the effects of displays on energy consumption by generalizing the effects across household groups. Other factors which are not explored in the present discussion are likely to come into play, such as the type of building and the regulations that apply (e.g., for detached houses versus flats) and other material aspects (e.g., type of heating device).At the same time, because the model is focused on energy savings only, other effects such as learning and control of finances (and life), are overlooked. Correspondingly, the value of these side effects is underestimated.
This study has pointed to potential differences between various types of households in their interactions with in-home displays. For less advantageous groups without previous monitoring experience, the display can provide social benefits and energy savings at the same time. According to Norwegian regulations, households are not required to be provided with in-home displays in the planned rollout of smart meters. Instead, the authorities expect that the introduction of smart meters will enhance the development and promotion of feedback solutions offered by commercial actors. Our study indicates that groups who could benefit substantially from using displays will not be willing to invest in them. This policy might therefore lead to increased invisibility of electricity consumption, less control over consumption, reduced potential for electricity savings and increased differences across socio-economic groups. Hence, we might see a situation where those already interested in monitoring electricity consumption purchase in-home displays or access information about the electricity consumption through web pages or other sources, while for the ordinary non-engaged customer electricity ends up being a completely invisible good. In the UK, energy suppliers are required to provide their customers with in-home displays together with the smart meters. Based on the findings from this study, consideration should be given to implementing this policy elsewhere.


