1. Introduction
The Danube region consists of member states, candidate countries and countries in the process of obtaining candidate status for EU membership. This region is characterized by an increase in the number and the migration of the population, in international trade and demand for high quality agricultural and food products, in industrialization and in urbanization. The differences in development levels are significant, and therefore, it is necessary to mobilize all potentials, ideas and projects in order to “overcome the unbalanced degree of development, strengthen the economies of member states, conserve and protect the environment, develop transport and education” [
1],
i.e., apply the so-called “integrated approach”. In recent years, the Danube region countries have implemented both individual and common interests “in order to more efficiently exploit natural potentials”, as stated by Gajić
et al. [
2], without infringing on the sovereignty of the countries by doing so. If we start from the fact that the goal of every company is long-term survival, profitability, cost effectiveness and positive financial results, it is clear that companies must continually work on the sustainable development of trade by applying new technologies for management.
By comparing the similarities and differences of the trade structure of the Danube region countries, it is possible to examine the characteristics and qualitative changes in the production structure of the countries. In the achievement of the goals of the common comprehensive strategy for the Danube region countries, the inclusion of the Republic of Serbia in the preparation of this strategy is of special significance. “Its subsequent application shall contribute to: strengthening the economy, integrating sector policies of the Republic of Serbia in the development plans of the EU, facilitating bilateral and multilateral cooperation of the Republic of Serbia with all countries of the Danube River basin” (position of the Republic of Serbia for participation in the design of a comprehensive EU strategy for the Danube region, 2010). The countries of the Danube region, under the pressure of globalization, have in front of them the challenge of creating favorable conditions for investment and development of new forms of business, in order to be more competitive. Creating a good business environment and its continuous improvement, in a word, sustainable business, are a prerequisite for sustainable engagement in international trade.
This paper intends to perceive the structural characteristics of international trade in the Danube region countries. The main goal of this paper is to recognize the level of comparative advantage of export in the processed food sector in international trade between Serbia and the Danube region countries.
2. Literature Overview
In the literature, we may find a number of research projects dealing with the competitiveness of the food industry. Study approaches in this research are methodologically quite similar, but differ in fields,
i.e., the industries and countries involved in the research. The significance of pricing factors of competitiveness or the price of agricultural food products of countries in Central and Eastern Europe differs considerably, which was indicated by Orbane [
3]. Prices in Hungary are 20% and 50% higher than in Germany [
4] and call into question the level of competitiveness. Ferto and Hubbard [
5] have pointed out in their research the comparative advantage of agricultural food products in the earlier period between 1992 and 1998. In the following research [
6], the authors have extended their research and highlighted the importance of government support measures for the livestock sector. Evidence on the competitiveness of the food industry in the international market may be found in [
7]. Use of the Balassa index has indicated the high competitiveness of fruit juice and olive oil in the EU market. Ylmaz and Ergun [
8] have also dealt with competitiveness issues. Measuring comparative advantage is based on the application of the Balassa index with a different approach to product classification. Their analysis has indicated a decline in the comparative advantage of Bulgaria and improvement in Hungary for easily imitable products, which also include food products.
Buturac [
9] has investigated the competitiveness of the processing industry of Croatia and has concluded that there is a decline in the competitive advantage of the processing industry as a whole. A modest growth of export competitiveness is present in the tobacco industry. Most of the countries of the Western Balkans has obtained macroeconomic stability and, within that, price stability and improvement of public finances. However, the level of trade competitiveness has declined. In the period between 2000 and 2010, there was positive comparative advantage of Serbian and Croatian food, which highlighted the relevance of a compatible export structure and strengthening mutual cooperation [
10].
Bojnec, Majkovič and Turk [
11] have analyzed the importance of food products in the trade of Slovenia. Briefly said, the results of their research have indicated that the efficiency of Slovenian integration into the EU market depends on the degree of structural changes, or as they say, “this may only be caused by internal restructuring at the company and industry level, and new investments for the improvement of product quality”. In the following study of the competitiveness of the agricultural and food sector of Slovenia, Majkovič, Turk and Chevassus–Lozza [
12] have performed a comparative analysis of the competitiveness of Slovenia and nine new candidate countries for EU membership. In the period between 1999 and 2003, Slovenia had a positive comparative advantage in the export of meat, dairy products and beverages. The authors pointed out the positive effect of restructuring the agricultural and food sector of Hungary, the Czech Republic, Slovakia and other countries in the group.
The assessment of the competitiveness of various European countries at the level of the food industry sector in the period between 1995 and 2011 was performed by Carraresi and Banterle [
13]. The results of their research showed a similar tendency during the last 15 years in most countries. A significant increase of competitiveness is present in Germany and Austria. Bojnec and Ferto [
14] have used the Balassa index in order to investigate the level of competitiveness of Hungary, Croatia and Slovenia’s food industry. They claim that “the empirical research seeks to explain how revealed comparative advantages have developed across countries, main product groups and over time and what are likely their implications for multifunctional rural development in the enlarged EU” (p. 3). The authors have concluded that the greatest comparative advantage in the export of food products in the EU market has been achieved by Hungary and, to a slightly lesser extent, Croatia. Slovenia is in the inferior position in relation to these countries. This research has highlighted the problem of serious competition and the need for continued research, which would make the food sector more significant for rural development.
The research of Vološin [
15] has pointed to the low share of export of agricultural and food products of the Czech Republic in total exports and the alteration of the export structure upon accession to the EU-27. It was the export of processed food products with increased added value that gained importance. Dynamic development of the Czech food industry and positive adjustment of the export structure of the Czech Republic to the needs of the EU market have been investigated by Svatoš and Smutka [
16]. They have shown limited and negative comparative advantage of the export of the food sector as a whole, but also a positive advantage of the export of milk and dairy products, livestock, cereals, beverages and tobacco. Smutka and Ishchukova [
17] have applied the Balassa and Lafay indices to measure the comparative advantage of the export of agricultural and food products of Russia, in order to discover and measure the level of competitiveness and dynamic changes in the period between 1998 and 2010. In addition to products with stable comparative advantage, primary products have positive comparative advantage in the EU market and byproducts in relation to the entire world.
Comparative analysis of the comparative advantage of the export of agricultural and food products in Romania, in the period before and after joining the EU, has been performed by Rusali [
18]. Research results have indicated a declining trend of specialization in international trends for the majority of Romanian products, except for cereals and tobacco. Prochazka and Smutka [
19] have used the Balassa index in order to examine the market position of the Czech Republic’s production and export share of poppy in the global market. In short, they have indicated the traditional presence of Czech poppy in the EU market and the increase in production and export. Belova
et al. [
20] have investigated the impact of crisis on the competitiveness of the Czech export of agricultural products. The main sectors have maintained a positive level of competitiveness in the markets of EU and third world countries. When it comes to traditional export markets (Germany, Slovakia and Poland), there has been no significant deterioration in competitiveness due to the global economic crisis. In the period of expansion of the EU economy, primarily national agri-food trade, 12 new member countries have experienced significant transformation. In the majority of countries, there has been a violation of comparative advantage, and trade specialization among member countries has become apparent. As Török and Jambor [
21] have pointed out, foreign trade of food products in Hungary has become more dynamic after accession. Concentration by country and by products is expressed and has not changed significantly after joining the EU. The final conclusion is that the long-term goal of developing the food sector of associated EU members should be to improve the production and export of processed products with increased added value. Following the example of the research of Bojnec and Fertö [
22], Qineti, Rajcaniova and Matejkova [
23] have investigated the comparative advantage and competitiveness of Slovakia and the EU-27 in the markets of Russia and Ukraine. The use of the Balassa index has established a declining trend of trade specialization and the decline of comparative advantage in several product groups.
The competitiveness of the Serbian economy has been the subject of the work of several authors, and certainly one of the earliest studies was the research of Gagović [
24]. Although he pointed out the flaws of “
ex post” analysis, as he described the comparative advantage analysis, the results of his research have indicated the improvement of export supply and the need to harmonize production and export with global demand. The author lists a number of agricultural and food products in whose exports Serbia has comparative advantages. Following the example of said research, Raičević, Ignjatijević and Matijašević [
25] have pointed out that Serbian food industry has partly integrated into the international market. The sectors that have a high index of comparative advantage are: production of sugar, mineral water, beer, ice cream and other frozen compounds, soft drinks, biscuits, production and preservation of fruit and vegetables, raw oils and fats and the production, processing, cooling and freezing of poultry and rabbit meat. Negative comparative advantage is a consequence of lags in investing, developing the assortment of the processing industry and the lack of research of international markets and is present in: the production of finished pet food, processing tea and coffee, other non-distilled fermented beverages, malt, processing and preservation of fish and fish products, distilled alcoholic beverages and wines from fresh grapes. The basic problems faced by the Serbian food industry are low utilization of processing capacities, over-dimensioned and outdated processing capacities, lack of investments, lack of implementation of achievements and innovations in processing, product quality oscillation due to the lack of implementation of product quality standards and slow adjustment to market criteria. The authors have pointed out the necessity of improving business conditions and the restructuring of the food industry. A similar study dedicated to competitiveness and comparative advantage of food exports of the Danube region countries has been carried out by Ignjatijević and Milojević [
1]. Via application of the Balassa and Lafay indices, they have shown a positive comparative advantage of food exports in Moldova, Hungary, Ukraine, Serbia, Bulgaria and Romania in the period between 2004 and 2009. In the following study, Ignjatijević
et al. [
26] have dealt with the competitiveness and comparative advantage of the export of primary products of the Danube region countries. A study by Figiel and Kufel [
27] has indicated a relationship between the macroeconomic performances and competitiveness of food industries of the EU countries. The results of this study are as expected and point out the differences in the competitiveness of the agricultural and food sector of the EU countries. They claim that it is productivity that represents a key factor of comparative advantage.
3. Methods
The research subject of this paper is the analysis of the competitiveness of the processed food sector products in the Danube region countries, in order to measure the comparative advantage of exporting, to recognize the level of correlative dependence of exporting and to highlight the sectors with a stable position in the international market. The concept of comparative advantage was set by Balassa [
28], and its logarithmic form is in use. Following the example of Buturac [
9], the comparative advantages of the export of processed food sector products in the Danube region countries in the period between 2005 and 2012 have been analyzed also through using the Balassa RCA index. The form for calculating explicit comparative advantage is:
In the above form, X represents export value and M stands for import value. Index i represents the industry sector of each of the Danube region countries.
Share in world market (% share of world exports): the world market share tells us how important a particular country is in terms of the global export profile for a specific sector. The ratio of the selected country’s exports to the total world’s exports is expressed as a percentage. Product diversification (No. of equivalent products): the equivalent number (EN) is a theoretical value that represents the number of markets of identical size that would lead to the degree of export concentration exactly equal to the observed one. The value of per capita exports indicates the level of outward looking of a country and the extent to which a country’s population produces for the world market. Market diversification: the equivalent number shows the degree of market diversification; diversifying partner countries reduces a country’s dependence on a small number of export markets and, hence, the vulnerability to shocks within destination countries. “The competitiveness effect represents a quota of the “relative change of world market share”. The competitiveness effect in fact shows the percentage change in competitiveness of a country’s exports in the world market for the selected sector in the period under review.
It corresponds to hypothetical gains or losses of a country’s aggregate market share that would occur if changes were only due to variations in the country’s market share in import markets, regardless of the structure of the country’s exports. According to the definition of ITC (International Trade Center): a change in the exporting country’s share in destination markets’ imports times the initial share of partner countries’ imports in world trade (weighted average of the variation in the country’s position on elementary markets). The range of values is between −∞ and +∞ (percent), with positive values indicating a gain in market due to increased competitiveness of a selected country sector on the world market [
29] (pp. 37–38).
The form for calculating the explicit competitiveness effect is:
where
t is the current year,
t0 is the first year considered,
d is the country under study,
j is the partner country,
s is the selected sector and
X are the exports (
Xs are world exports for sector
s).
is the variation in the country’s market share in import markets, and
is the initial share of world markets in world imports.
In the study, we analyzed the distribution of the RCA index and the existence of correlations of the obtained values of RCA indices of the Danube region countries. In the analysis of the normality of the distribution of RCA indices, we used the D’Agostino and Pearson normality test. The D’Agostino and Pearson omnibus normality test is a test for the normality of a distribution, which is based on the moments of the distribution. It takes into account the curvature and flattening of the distribution. The ANOVA test (analysis of variances) allowed us to determine whether the arithmetic means of the dependent variable vary in relation to a larger number of groups. In our case, the dependent variable is the value of the RCA index, while the independent variable is the country. In this research, we have values of the RCA index for 13 countries, and we have tried to establish whether the average values of this index vary between these countries. For the purpose of variance analysis, the countries have been grouped into three categories. The first group consists of Serbia, Bosnia and Herzegovina, Ukraine and Moldova, countries that are not in the EU; countries that have recently joined the EU are Croatia, Romania, Bulgaria and Slovenia. The third group consists of countries that are the most developed countries of the Danube region and that were among the first to join the EU: Germany, Austria, Czech Republic, Slovakia and Hungary.
Table 1.
Share in world market, product and market diversification, export per capita and the competitiveness effect of the Danube region countries.
Table 1.
Share in world market, product and market diversification, export per capita and the competitiveness effect of the Danube region countries.
| | | Share in World Market (% Share of World Exports) | Per Capita Exports US$/inhabitant | Product Diversification (No. of Equivalent Products) | Market Diversification (No. of Equivalent Markets) | Competitiveness Effect, per annum (%) |
|---|
| | | Processed Food | Processed Food | Processed Food | Processed Food | Processed Food |
|---|
| Austria | 2005 | 1.56 | 695 | 15 | 7 | –0.003 |
| | 2012 | 1.16 | 990.8 | 19 | 7 | 0.49 |
| Bosnia & Herzegovina | 2005 | 0.03 | 32 | 25 | 4 | 0.310 |
| | 2012 | 0.04 | 84.1 | 17 | 5 | 1.65 |
| Bulgaria | 2005 | 0.15 | 71 | 23 | 21 | 0.011 |
| | 2012 | 0.24 | 241.6 | 23 | 12 | 6.1 |
| Croatia | 2005 | 0.21 | 172 | 14 | 6 | 0.048 |
| | 2012 | 0.15 | 252.6 | 19 | 7 | –0.45 |
| Czech Republic | 2005 | 0.57 | 203 | 30 | 7 | 0.033 |
| | 2012 | 0.70 | 475.4 | 29 | 8 | 1.31 |
| Germany | 2005 | 8.97 | 400 | 43 | 15 | 0.007 |
| | 2012 | 7.71 | 683 | 48 | 18 | 0,11 |
| Hungary | 2005 | 0.52 | 189 | 26 | 15 | –0.012 |
| | 2012 | 0.60 | 430.5 | 30 | 14 | 1.43 |
| Romania | 2005 | 0.08 | 31 | 21 | 13 | 0.114 |
| | 2012 | 0.25 | 85.1 | 8 | 10 | 10.22 |
| Moldova | 2005 | 0.12 | 118 | 4 | 3 | –0.114 |
| | 2012 | 0.07 | 134.3 | 12 | 10 | 1.62 |
| Slovakia | 2005 | 0.26 | 180 | 34 | 6 | 0.033 |
| | 2012 | 0.35 | 470.2 | 24 | 5 | 3.62 |
| Slovenia | 2005 | 0.12 | 213 | 26 | 9 | 0.013 |
| | 2012 | 0.11 | 380.9 | 18 | 10 | –1.35 |
| Ukraine | 2005 | 0.66 | 52 | 15 | 4 | 0.010 |
| | 2012 | 1.18 | 184 | 5 | 13 | –0.37 |
In this paper, we have used the Prism-GraphPad program in order to calculate the level of correlation of the obtained indices of comparative advantages of the Danube region countries. This paper has used data from ITC, World Bank, the Statistical Office of the Republic of Serbia and UN Comtrade for the corresponding years. According to the ITC methodology, the products have been classified into 14 sectors, and we have dealt with processed food sector and products that at the two-digit aggregation (sections) level fall under the processed food sector.
4. Results and Discussion
For the Danube region countries, we have analyzed the following TPI indices: share in world market, product diversification, market diversification, export per capita and competitiveness effect. High shares in the world market in the analyzed period belong to Germany and Austria. A high level of product diversification is present in Germany, the Czech Republic, Slovakia (2012) and Hungary. A high coefficient of product diversification indicates a favorable production structure of the said sectors. High values of export per capita are present in Austria, the Czech Republic, Germany, Hungary (2012), Slovakia (2012) and Slovenia (2012). We have noticed an increase in the value of exports per capita in 2012 when compared to 2005, which is consistent with the increase in RCA values in the Czech Republic and Hungary. A high value of market diversification is present in Bulgaria and Germany, whereas an increase of the competitiveness effect is present in Bosnia and Herzegovina, Moldova, Slovakia, Bulgaria, Hungary and Romania,
Table 1.
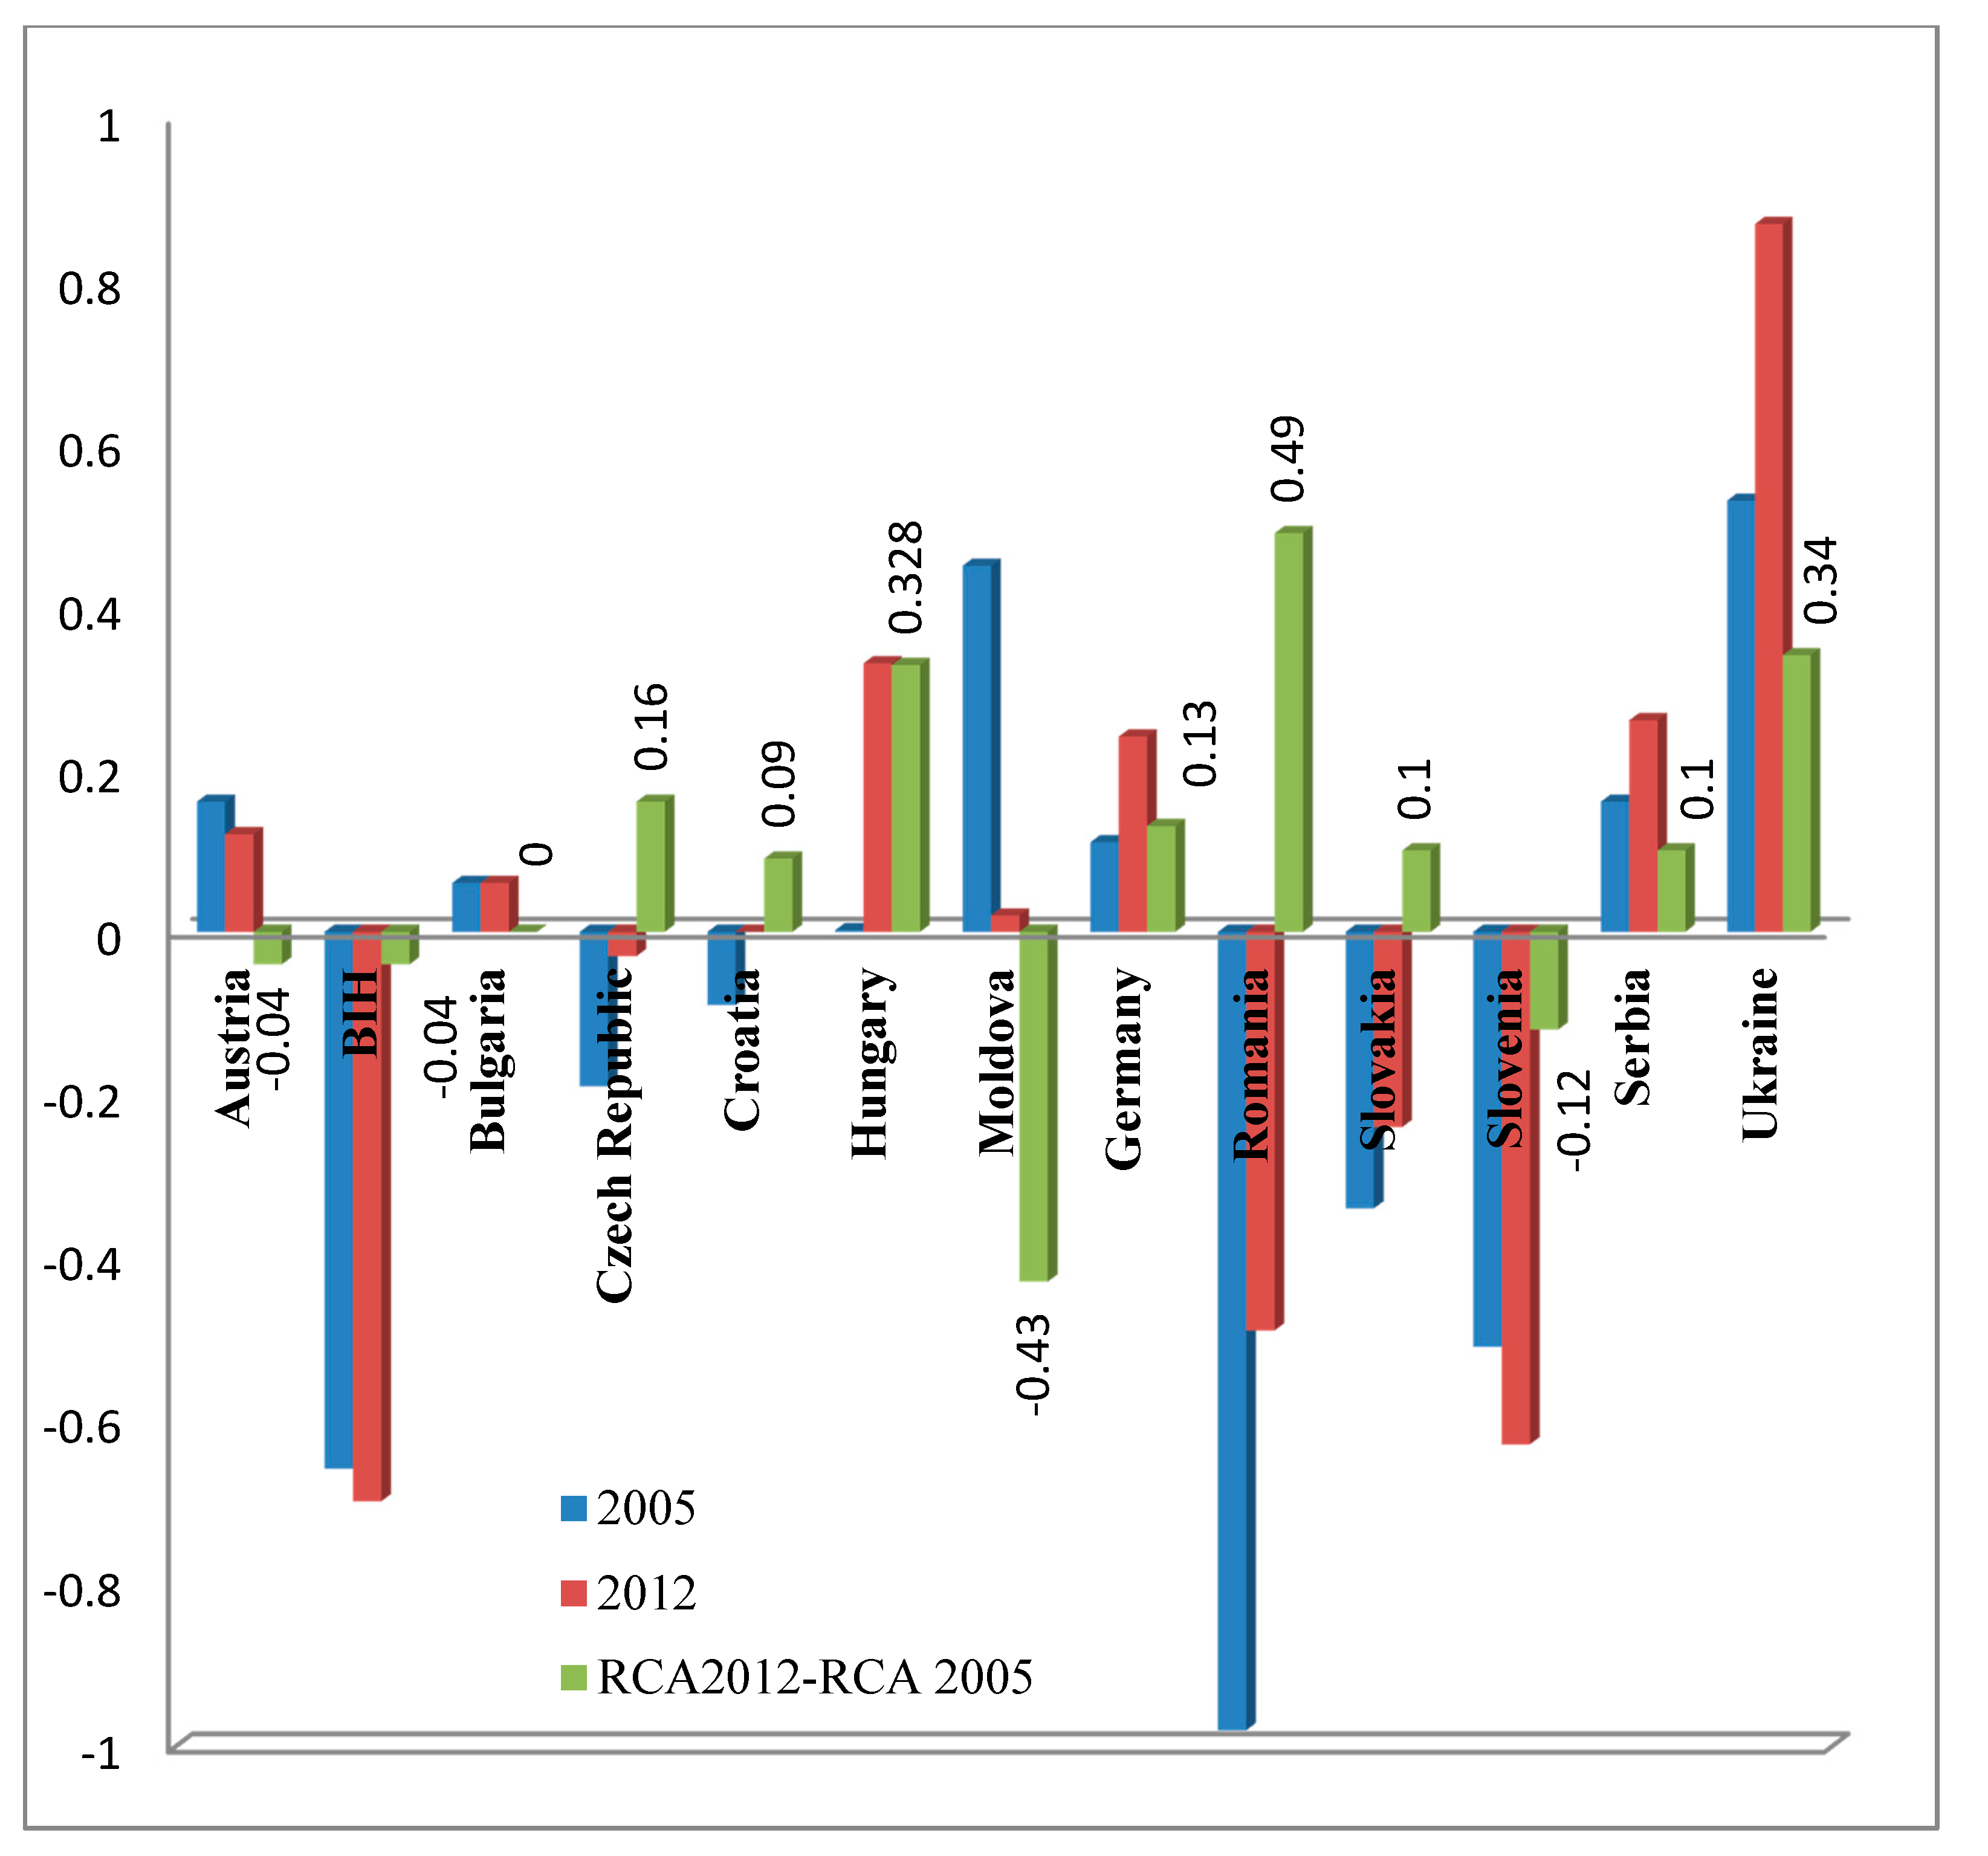
In an effort to recognize the level of competitiveness in international trade, we have measured the level of comparative advantage of the export of products and the processed food sectors in the Danube region countries. The empirical results of the export comparative advantage research, measured by the Balassa index, are shown in
Figure 1.
Export research results of the Danube region countries have indicated that there is a correlation of the obtained indices. Countries with a high share of export of the processed food sector in total export, as well as countries that are net exporters of processed food products have positive values of the comparative advantage index (RCA).
From the view point of our interest, there is a significant increase in comparative advantages of exports in Serbia, the Ukraine, Germany and Hungary. A confirmation of our research results in regard to the increase in the comparative advantage of Hungary in the analyzed period can be found in [
12], as well as their conclusion regarding the positive effects of restructuring the agricultural sector in Hungary. We have also confirmed the statement that Hungary has a comparative advantage in the export of agricultural food products, as evidenced by the research in [
14,
21]. The positive and increasing comparative advantage of food industry exports in Germany is shown by [
13] and confirmed by the results of our research. The calculated positive value of the comparative advantage of food industry exports in Serbia is consistent with the results of the prior research of Gagović [
24,
26]. The results of our research are in accordance with the research results of Qineti, Rajcaniova and Matejkova [
23] regarding the declining competitiveness and comparative advantage of the food industry exports of Slovakia. A negative value of the index of comparative advantage of processed food sector exports in Romania and Slovenia, indicated by Rusali [
18] and Majkovič, Turk and Chevassus-Lozza [
12], has been confirmed by our research, as well. The Ukraine has achieved a high coefficient of comparative advantage in the exports of the processed food sector.
Figure 1.
RCA- revealed comparative advantage indicator of exports of processed food sectors in Danube region countries. Source: ITC, Trade Competitiveness Map, Analyze country and product competitiveness with trade flows, for the corresponding countries and years [
29], taken on 4 February 2014 and 5 July 2010.
In Austria’s exports, the processed food sector participates with an average of 5.14%, but achieves positive comparative advantage. Exports of Bosnia and Herzegovina include resource-intensive products, and a negative value of comparative advantage of the processed food sector exports indicates a very unfavorable structure of the exports of Bosnia and Herzegovina. Therefore, exports include primary semi-finished products with low added value. Moldova has a very unfavorable export structure. Earlier research by Ignjatijević
et al. [
26] has indicated that the exports of Moldova are dominated by fresh food and processed food sector products, which is in line with the obtained results. It was the low level of competitiveness of the food sector of Moldova that resulted in the loss of the battle with competitive exporters of the EU and the decline of comparative advantage in 2011, with improvement in 2012. In the analyzed period, there has been a reduction of the competitiveness of the processing industry in Croatia, which is consistent with the results of Buturac [
9]. A significant increase in the export of food products in Serbia in the period after 2005 resulted in the increase of the RCA index. The research results are in line with the research of Ignjatijević [
26].
Below, we shall determine the minimum and maximum values of RCA by country. Extreme negative values of the RCA index are present in Slovakia, Slovenia, Hungary and Moldova. The highest positive value of the RCA index is present in the Ukraine.
Before calculating the correlation of the RCA indices for different countries, we have examined the normality of the RCA index distributions in different countries. We have used the D’Agostino and Pearson normality test. The results show that the RCA index distributions of the following countries deviate from normality: Bosnia and Herzegovina (K2 = 13.11 and
p < 0.05); Hungary (K2 = 11.58 and
p < 0.05); Moldova (K2 = 7.57 and
p = 0.023) and Slovenia (K2 = 27.67 and
p < 0.05); the D’Agostino and Pearson omnibus normality test shows that the RCA value distribution in Austria does not deviate significantly from normality (K2 = 2.55 and
p = 0.28). In Croatia, the D’Agostino and Pearson omnibus normality test shows K2 = 2.57 and
p = 0.28; in the Czech Republic K2 = 2.94 and
p = 0.23; in Germany K2 = 1.13 and
p = 0.57); in Romania K2 = 2.46 and
p = 0.29; in Bulgaria K2 = 1.58 and
p = 0.45; in Serbia K2 = 0.88 and
p = 0.64); and in the Ukraine K2 = 3.49 and
p = 0.17,
Table A1.
We have further analyzed the existence of the correlation of the obtained RCA index values in the Danube region countries.
Table A2 shows the Pearson correlation of the RCA indices of two countries,
i.e., we have determined how much the RCA indices of various countries are mutually co-variant.
The RCA of Austria is in medium correlation with the RCA of Hungary and Serbia. A low correlation is found between Austria and Germany, Moldova, Slovakia and Slovenia. The
p-value of the correlations of said countries is below 0.05; thus, we have concluded that the correlation among these countries exists and that the variables are co-variant. The analysis of the Pearson correlation of the RCA indices of Bosnia and Herzegovina and other countries established a medium correlation with Bulgaria, with a value below 0.05, which leads to the conclusion that there is a correlation between these two variables. A positive low correlation of data is present in Croatia and the Czech Republic (
p < 0.05) and Germany (
p < 0.05) which, by
p < 0
.05, indicates that the variables are co-variant. There is positive low correlation of the Czech Republic with Hungary, which is confirmed by
p < 0.05. There is a medium correlation between Hungary and Moldova, Bulgaria and the Ukraine and a low one with Slovakia. A low correlation in Moldova is present with Serbia and the Ukraine. In Romania, there is a low positive correlation with Serbia and a negative one with Slovenia. The RCA of Bulgaria has a medium correlation with the Ukraine, and
p < 0.05 confirms that these variables are correlated. In Serbia, there is a medium correlation of the RCA with Slovakia and the Ukraine, and in Slovakia, there is a low correlation with Slovenia and the Ukraine,
Table A2.
Table A3 shows the Spearman correlation of the RCA indices of two countries. We have used this coefficient for the distributions that are not normal, and thus, this form of connection is relevant to our example. The RCA of Austria has a medium correlation with the RCA of Hungary. The
p-value of the correlations of said countries is below 0.05; thus, we have concluded that the correlation among these countries exists and that the variables are co-variant. The analysis of the Spearman correlation of the RCA indices of Bosnia and Herzegovina and other countries established a medium correlation with the Ukraine, with a value below 0.05, which leads to the conclusion that there is a correlation between these two variables. A positive medium correlation of the data is present in Croatia and Romania (
p < 0.05). The analysis of the Spearman correlation of the RCA indices of the Czech Republic and other countries has established a medium correlation with Moldova and a high correlation with Romania, which is confirmed by
p < 0.05. There is a high correlation of Hungary with Moldova and Serbia. A medium correlation in Moldova is present with Bulgaria and Slovenia and high with Serbia. In Romania, there is a medium positive correlation with Slovakia. The RCA of Bulgaria is in high correlation with the Ukraine, and
p < 0.05 confirms that these variables are correlated,
Table A3.
Table 2.
ANOVA test results.
Table 2.
ANOVA test results.
| Effect | SS | df | MS | F | p |
|---|
| Year | 1.169 | 1 | 1.169 | 1.736 | 0.188 |
| Countries | 17.606 | 2 | 8.803 | 3.092 | 0.047 |
| Year × Countries | 1.619 | 2 | 0.809 | 1.201 | 0.302 |
| Error | 239.135 | 355 | 0.674 | | |
Through subsequent
post hoc analysis, we have carried out subsequent comparisons in order to compare the countries that are different. Variance analysis with repeated factor “year” and non-repeated factor “countries” has indicated that the value of the RCA index has not changed significantly between 2005 and 2012. However, there is a marginally significant effect of the countries factor,
i.e., various groups of countries differ in terms of the RCA index values—
Table 2.
Table 3.
Post hoc test.
| Measure: | MEASURE_1 | | | |
|---|
| Group of countries | Mean | SE | 95% Confidence Interval |
|---|
| Lower Bound | Upper Bound |
|---|
| 1.00 | −0.387 | 0.116 | −0.615 | −0.159 |
| 2.00 | −0.750 | 0.113 | −0.972 | −0.528 |
| 3.00 | −0.436 | 0.101 | −0.634 | −0.237 |
| Measure: | MEASURE_1 | Multiple Comparisons: Least Significant Difference (LSD) |
| Group of Countries | Mean Difference | Std. Error | Sig. | 95% Confidence Interval |
| Lower Bound | Upper Bound |
| 1.00 | 2.00 | 0.3633 * | 0.16169 | 0.025 | 0.0453 | 0.6813 |
| 3.00 | 0.0490 | 0.15362 | 0.750 | −0.2531 | 0.3511 |
| 2.00 | 1.00 | −0.3633 * | 0.16169 | 0.025 | −0.6813 | −0.0453 |
| 3.00 | −0.3143 * | 0.15126 | 0.038 | −0.6118 | −0.0168 |
| 3.00 | 1.00 | −0.0490 | 0.15362 | 0.750 | −0.3511 | 0.2531 |
| 2.00 | 0.3143 * | 0.15126 | 0.038 | 0.0168 | 0.6118 |
| Based on observed means. The error term is mean square (error) = 1.424. |
The Least Significant Difference (LSD) test of subsequent comparisons has been performed in order to determine the structure of these differences.
The test has shown that there are significant differences among the first and the second group of countries (
p = 0.025), as well as among the second and the third (
p = 0.038). The RCA index is lower in the second group (
M = –0.75,
SD = 0.11) than in the first (
M = –0.39,
SD = 0.12) and the third group of countries (
M = −0.44,
SD = 0.10). There have been no significant differences in the average value of the RCA index among the first and the third group (
p = 0.750),
Table 3.
5. Conclusions
Through application of the Balassa index, we have measured the level of comparative advantages in international trade. The results of the TPI index research in the Danube region countries have indicated wide variations in the level of development of the processed food sector. A high share in the global market, the coefficient of diversification of the products and markets, as well as a high export per capita is present in Germany, which is in line with the positive value of the RCA index. In Austria, there is a high export per capita and share in the global market, resulting in a positive comparative advantage of export. A significant increase in export per capita, as well as product and market diversification has influenced the increase in the competitiveness effect and the positive RCA of Hungary. A high degree of product diversification and export per capita is also present in the Czech Republic and Slovakia. There is also an increase in market diversification and the competitiveness effect in Bulgaria. The research has found an increase in the comparative advantage of the export of processed food sector products in Serbia, the Ukraine, Germany and Hungary, as measured by the Balassa index.
We have examined the normality of the distributions of the RCA indices of processed food sector products in the Danube region countries. Through application of the D’Agostino and Pearson normality test, we have demonstrated that the distributions of the RCA indices in Bosnia and Herzegovina, Hungary, Moldova and Slovenia deviate from normality. The correlation of the obtained values of the RCA indices of the processed food sectors of the Danube region countries, through application of Pearson correlation, indicates that there is no high correlation among the analyzed countries. Since there are data that deviate from normality, we have applied the Spearman coefficient. The analysis of the Spearman correlation of the RCA indices of the Czech Republic and other countries has established a high correlation with Romania, which is confirmed by p < 0.05. There is a high correlation of Hungary with Moldova and Serbia. A high correlation in Moldova is present with Serbia. The RCA of Bulgaria is in high correlation with the Ukraine, and p < 0.05 confirms that these variables are correlated.
The analysis has found the existence of significant differences among the RCA indices, and subsequent post hoc analysis has been carried out for subsequent comparison in order to compare the countries that differ. Subsequent variance analysis has indicated that the value of the RCA index has not changed significantly between 2005 and 2012. However, there is a marginally significant effect of the countries factor, i.e., various groups of countries differ in terms of the RCA index values. The LSD test of subsequent comparisons has showed that there are significant differences among the first and the second group of countries, as well as among the second and the third. The RCA index is lower in the second group than in the first and the third group of countries. There have been no significant differences in the average value of the RCA index among the first and the third group.
By observing economic branches, agriculture and industry, in fact, the processed food sector of the industry, we conclude that they could be valuable for ensuring socio-economic development of countries in the Danube region. For the realization of sustainable economic development, of particular importance is the quality of international trade. Sustainable agricultural production is a prerequisite for sustainable production of the food industry and, as such, ensures the respect for local natural resources, through trade and the overall capacities of the areas. Starting from the strategic objective of constituting the Danube region, we should bear in mind that natural resources are important, perhaps the most important resources that local communities need to sustainably use in order to ensure comprehensive economic growth.


