1. Introduction
Ghana is vulnerable to climate change in at least three areas that are crucial for the country’s long-term economic development. First, agriculture is a major sector of the economy. It accounts for about a third of national income and export earnings and employs almost two thirds of the workforce [
1]. The sector is already exposed to climate variability, particularly in its northern regions, and this could worsen under climate change [
2]. Second, hydropower accounts for about two-thirds of total electricity supply in Ghana. Recent shortages revealed the country’s vulnerability to fluctuations in energy supply [
3]. Despite planned diversification, hydropower is expected to remain a major energy source over the coming decades and this raises concerns about the effect of climate change on river flows and generation capacity. Finally, Ghana has a large infrastructure deficit, particularly roads in the rural areas, and many households have poor access to markets and public services. Ten percent of the government’s budget is already allocated to maintaining roads, and so if climate change damages road surfaces it could further widen the infrastructure gap.
Investments in agriculture, energy and infrastructure require long planning horizons. Thus, while climate change is expected to unfold gradually over the coming decades, it is imperative that climate is already considered within national planning processes [
4]. Yet a major constraint to mainstreaming climate change within development policies is the lack of empirical evidence to inform decision making. While sector studies are crucial for determining specific vulnerabilities, individual impact channels often interact with each other, either offsetting or amplifying final outcomes. A multi-sector approach is therefore essential for evaluating climate impacts. Moreover, there is considerable uncertainty surrounding climate change, with a wide range of climate projections for Ghana. It is essential to consider the range of potential climate realizations in order to identify major risks and to avoid incurring large opportunity costs if certain projections are not realized.
There are a number of studies that measure the economic costs of climate change for developing countries like Ghana. A majority of these studies focus on agriculture and measure impacts using either historical econometric analysis or process-based crop models. A study by Schlenker and Lobell [
5] estimated that maize crop yields in Ghana are expected to decline by about 18 percent by 2050. Crop models may overstate the economic cost of climate change because, by focusing only on production, they tend to exclude market-based adaptation mechanisms that operate within an economic system. To address this limitation, crop models are sometimes combined with partial equilibrium models that capture demand and supply responses via product markets. A recent study that covered Ghana used a global partial equilibrium model linked to high resolution crop models [
6]. The authors found that climate change reduced food production in two of the four climate scenarios considered.
While partial equilibrium models can address some of the limitations of studies that rely solely on crop models, they are often limited by their exclusion of spillovers between agriculture and the rest of the economy. As a result, partial equilibrium models tend to underestimate the economy-wide impacts of climate change, be they positive or negative. Ideally, given the scale of climate change, studies should consider general equilibrium mechanisms. Finally, the effects of climate change are likely to extend beyond crop yields and agriculture. Unfortunately, there are, to our knowledge, no studies for Ghana that jointly and systematically analyze multiple impact channels.
In this paper we use an economy-wide model to measure the economic impacts of climate change in Ghana. Our multi-sector framework draws on the findings from sector studies covering four major impact channels: agriculture, energy, infrastructure, and coastal inundation from sea level rise. As mentioned above, these four channels are expected to be among the most important for Ghana, given the country’s dependence on agriculture, hydropower and an unpaved road network. We simulate impacts for four climate projections that span the distribution of potential global and local climate changes. Finally, our economy-wide framework allows us to evaluate distributional impacts across sectors, subnational regions, and household population groups.
The next section describes the climate change projections for Ghana and summarizes the main findings from the sector studies used in the economic analysis.
Section 3 describes the economy-wide model and the design of the climate change simulations.
Section 4 presents our results, and we conclude in
Section 5 by discussing climate change’s implications for economic development in Ghana and identifying areas for further research.
2. Climate Change in Ghana
Ghana is primarily an agrarian economy, with most of the population earning their livelihoods as smallholder farmers. These farmers typically rely on traditional technologies and so crop yields are low and rural poverty is high. Ghana is also well endowed with mineral resources, including gold and offshore crude oil. However, despite its large contribution to export earnings, mining does not generate many jobs in Ghana. Most of the workers in the nonfarm sector live in the country’s burgeoning urban centers where they are employed in light industrial activities and informal services. Ghana’s economy is growing rapidly, with most of the country’s expanding and higher-value industries located in or near to the coastal capital city, Accra. Urban growth has placed considerable pressure on the country’s energy supplies, which depend heavily on the Akosombo hydropower dam within the Volta River Basin.
Agricultural conditions vary widely across Ghana, with rainfall generally declining from south to north. The wettest area is the extreme southwest where annual rainfall in the forests is over 2000 mm. In contrast, annual rainfall in the extreme northern savannah is less than 1100 mm [
7]. In our analysis we separate Ghana into four agro-climatic zones that move from the south to the north of the country,
i.e., Coastal, Forest, Transitional, and Savannah zones.
Virtually all of Ghana’s major agricultural exports,
i.e., cocoa and timber, are produced in the Forest zone, where farmers’ incomes are often higher than elsewhere in the country [
8]. In contrast, the drier northern Savannah zone grows mainly subsistence crops, such as drought-resistant sorghum, and some higher value crops, such as irrigated vegetables. Livestock is also important for pastoralists in the extreme northern areas. The Transitional zone lies between the forest and savannah areas and is Ghana’s main food producing region. Finally, the Coastal zone grows mainly cereals and horticulture for the southern urban markets. Given this diversity of agro-climatic conditions, the impacts of climate change are expected to vary considerably within the country.
2.1. Climate Change Projections
General Circulations Models (GCM) simulate the earth-atmosphere relationship and estimate the impact of greenhouse gas (GHG) levels on climate variables, including temperature and precipitation. Part of the uncertainty surrounding climate change is due to differences in the way GCMs specify this relationship. Even with the same level of GHGs, the GCMs can generate different climate projections, particularly at the country and sub-national levels. There are also a range of possible global development scenarios, which determine the level of GHG emissions in the atmosphere. Various “emissions scenarios” were identified in the Intergovernmental Panel on Climate Change’s Special Report on Emissions Scenarios (SRES). To capture the distribution of climate projections it is necessary to consider the full set of GCM and SRES pairings.
We selected four projections representing the maximum variation in precipitation outcomes at the global and country levels. The first two scenarios are the wettest and driest global projections chosen from all GCM/SRES pairings (NCAR-CCSM30/A2 and CSIRO0MK30/A2, respectively). We call these the “global wet” and “global dry” scenarios. However, the driest global scenario is not necessarily the driest scenario for Ghana. Thus, in the second two scenarios we selected the wettest and driest projections for Ghana (NCAR-PCM1/A1b and IPSL-CM4/B1, respectively). We call these the “local wet” and “local dry” scenarios.
The first row of
Table 1 reports projected changes in Ghana’s climate moisture index (CMI) for 2046–2050 relative to a “no climate change” baseline or reference scenario. The CMI is a composite measure of climate change derived from changes in both temperature and precipitation. This baseline is calculated using historical monthly climate data (0.5° × 0.5°) from the Climate Research Unit at the University of East Anglia for 1951–2000. It assumes that future weather patterns will retain the characteristics of historical climate variability. The CMI falls by 66 percent in the “local dry” scenario and increases by 49 percent in the “local wet” scenario. This reflects the high degree of uncertainty associated with future climate change and also underscores the need to consider the full range of climate projections.
Table 1.
Climate and biophysical impacts, 2045–2050.
Table 1.
Climate and biophysical impacts, 2045–2050.
| Change from baseline (%) |
|---|
| Global wet | Global dry | Local wet | Local dry |
|---|
| Climate moisture index | −17.0 | 9.0 | 49.0 | −66.0 |
| Crop yields (mt/ha) | | | | |
| Maize | 1.09 | 1.09 | 1.11 | 1.05 |
| Sorghum and millet | 1.70 | 1.72 | 1.55 | 1.96 |
| Rice | 0.57 | 1.29 | 1.43 | −1.40 |
| Horticulture | −12.70 | −2.20 | −6.92 | −13.88 |
| Coastal zone | −3.35 | −2.92 | −1.94 | −4.84 |
| Forest zone | −1.10 | −1.83 | 0.82 | −3.82 |
| Transitional zone | −1.26 | −1.81 | 0.87 | −3.22 |
| Savannah zone | −16.22 | −2.28 | −9.27 | −17.16 |
| Cassava | 1.60 | 2.68 | 2.55 | 0.90 |
| Ams | 3.94 | 4.01 | 4.19 | 3.54 |
| Cocoa | 3.63 | 0.76 | 4.37 | −4.34 |
| Hydropower supply (GWh) | | | | |
| Without adaptation | 2.09 | −2.00 | −2.22 | −4.05 |
| With adaptation | 1.28 | −1.22 | −1.36 | −2.48 |
| Road network length (km) | | | | |
| Without adaptation | −7.17 | −14.02 | −7.78 | −0.11 |
| With adaptation | −3.34 | −10.05 | −3.19 | −0.44 |
| Farm land cultivation (ha) | −0.26 | −0.26 | −0.26 | −0.26 |
| Coastal zone | −3.79 | −3.79 | −3.79 | −3.79 |
2.2 Biophysical Impacts
The climate projections for Ghana are translated into biophysical impacts via a series of sector models. We draw on the findings from three separate studies that examine individual sectors or transmission channels. These include the impact of climate change on: (i) agriculture and water resources [
9]; (ii) road infrastructure [
10]; and sea level rise [
2].
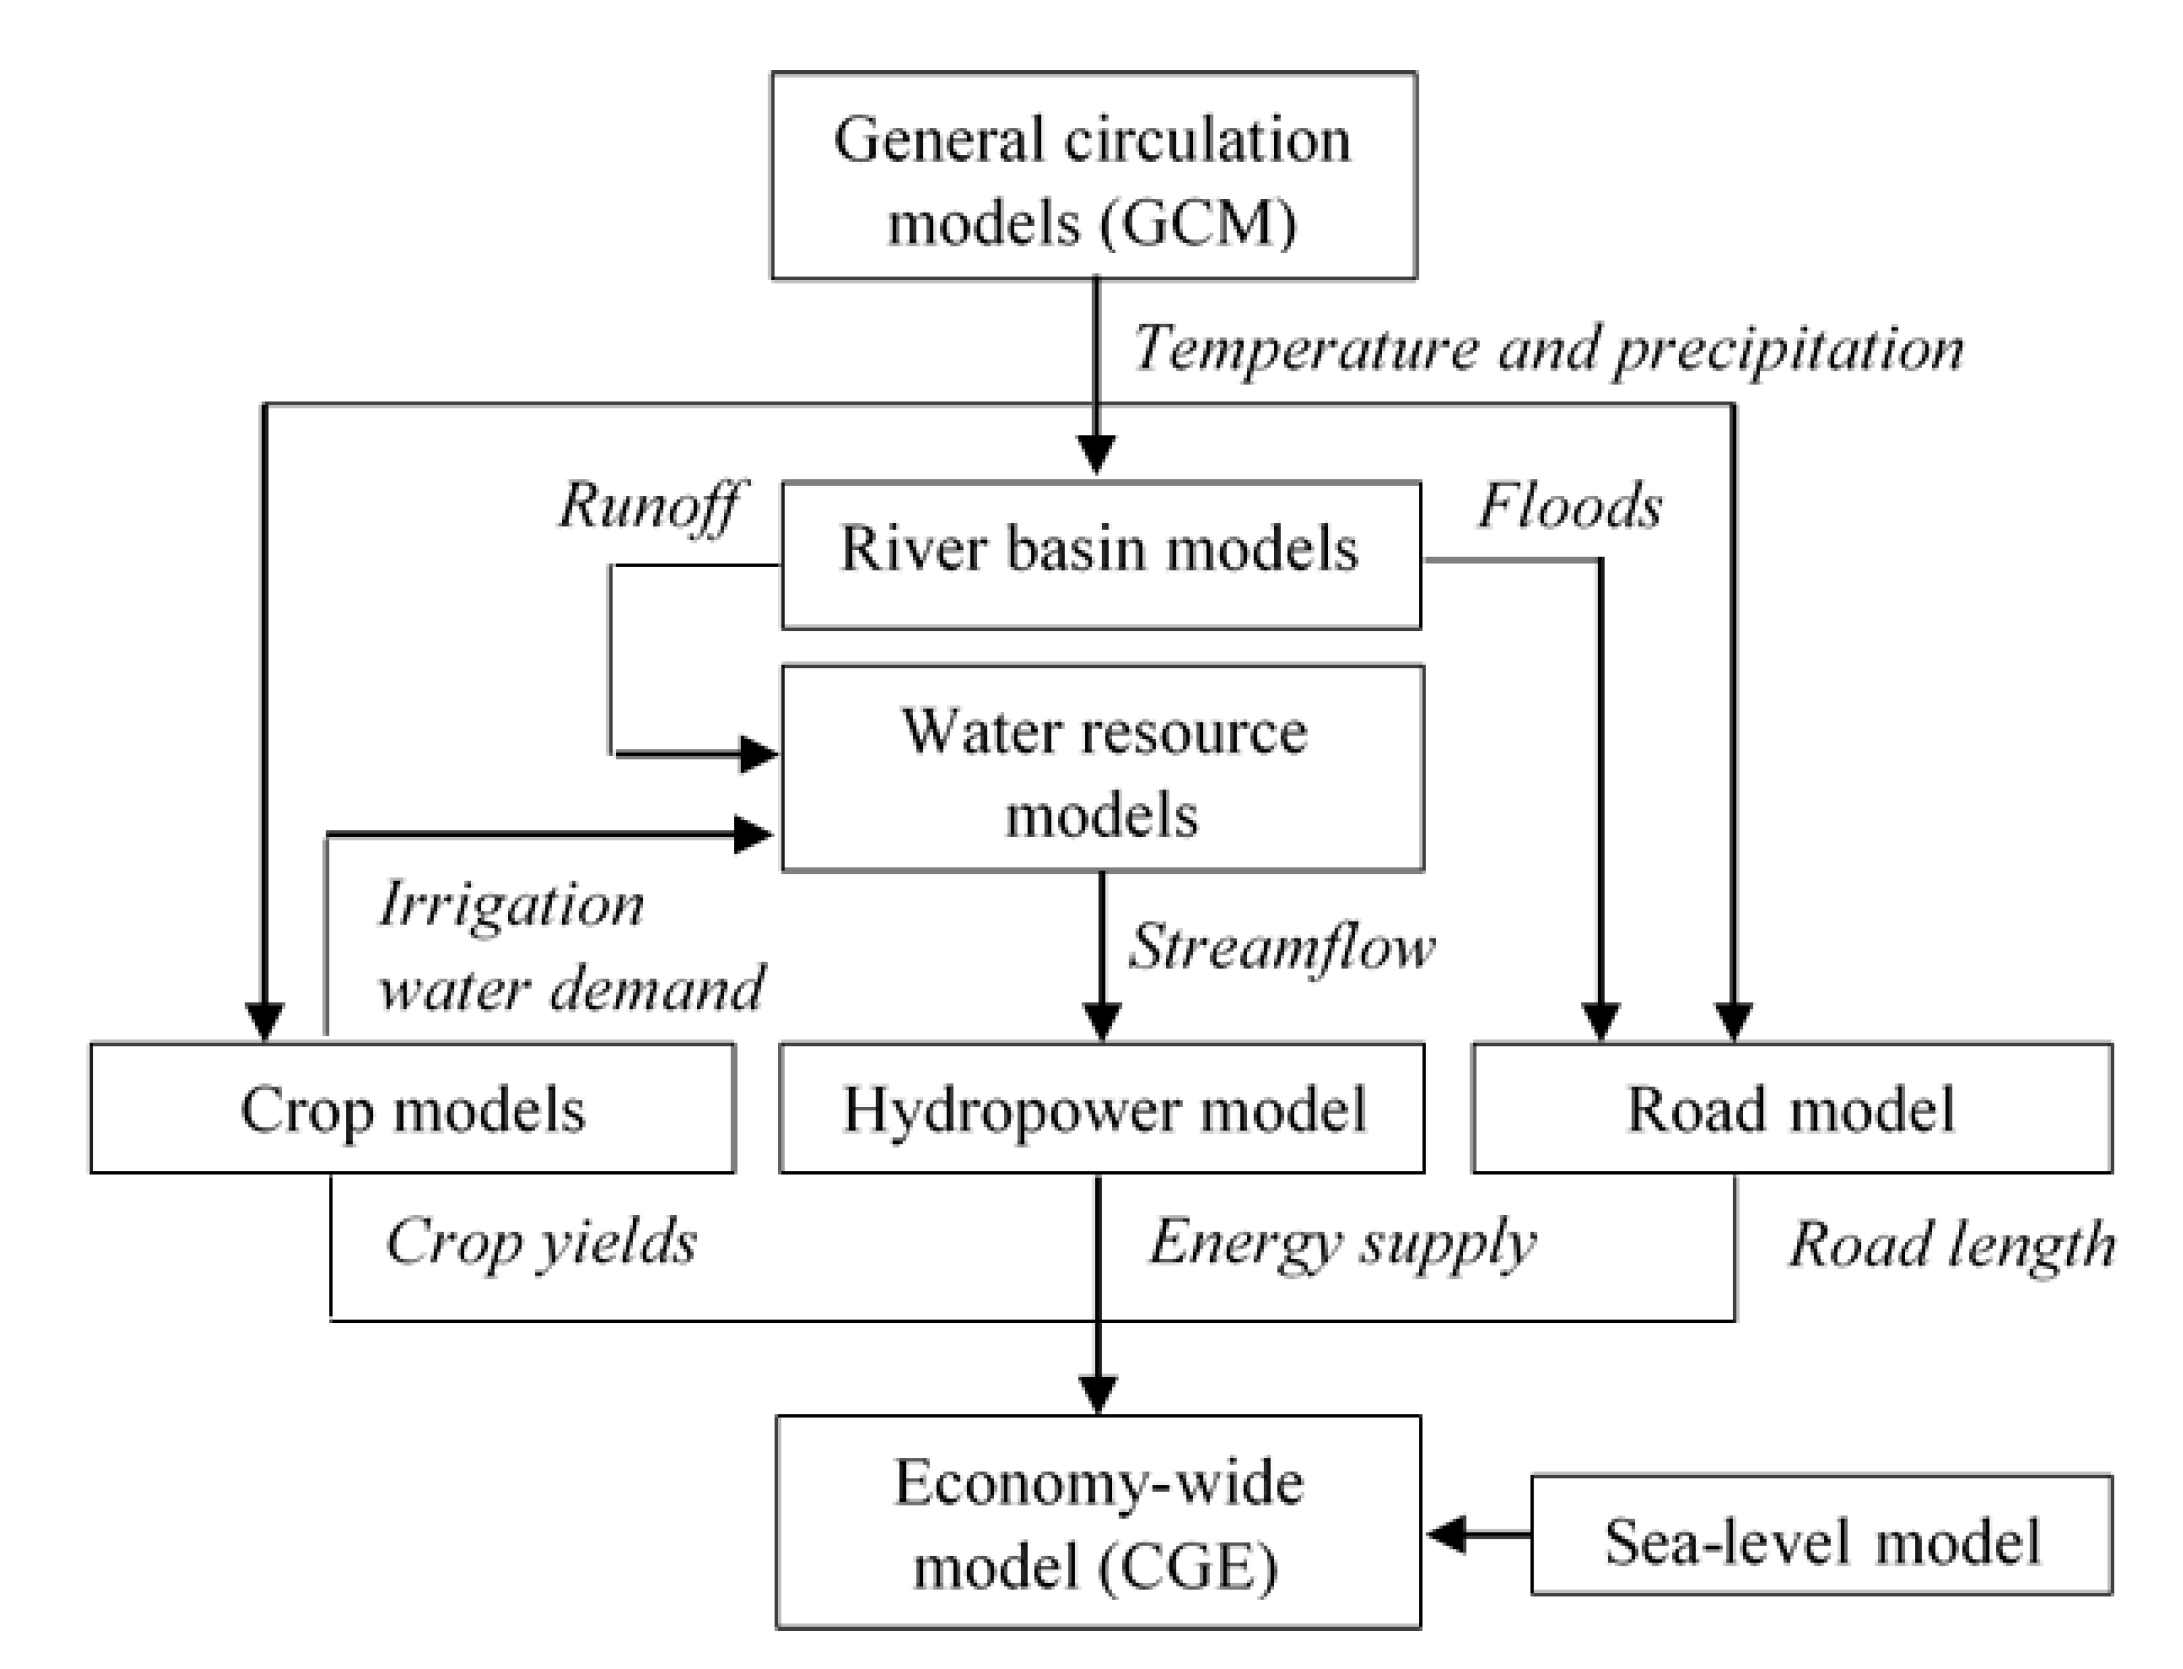
Figure 1 shows the flow of information from the GCMs through river basin and water resource models down to the three sector models that estimate impacts on agriculture, energy and infrastructure. Trans-boundary river basin models determine streamflow in major rivers, including the Volta River that originates within Burkina Faso and ends in southern Ghana. Changes in streamflow enter water resource models that determine water availability for irrigation and hydropower generation. The river basin model also predicts changes in flood frequency and severity, which, together with precipitation and temperature, determines road surface damages in the infrastructure model. Climate projections directly affect agricultural yields in the crop models. Finally, we include a fourth impact channel that incorporates sea level rise (SLR). These biophysical results are passed down to a multi-sector economic model that estimates the economy-wide impacts of climate change.
Figure 1.
Nested modeling framework.
Figure 1.
Nested modeling framework.
Table 1 summarizes the key findings from the sector studies that will be used later for the economic analysis. National crop yields are expected to increase on average for the main staple food crops (
i.e., maize, sorghum and cassava) in all four climate projections. This is the result of improved climate conditions, particularly precipitation, during crucial periods of these crops’ growing cycles. However, following Amisigo
et al. [
9], we do not consider the effects of CO
2 fertilization on crop yields. These yield increases are largest in the “local wet” scenario and smallest in the “local dry” scenario. In contrast, yields are expected to decline for horticultural crops (
i.e., fruits and vegetables) in all four scenarios. The yields for the remaining crops, including cocoa, decline only in the “local dry” scenario. There is regional variation in yield responses to climate change, with the Savannah experiencing more pronounced yield declines, particularly for horticulture (shown in the table). Overall, the “local dry” scenario produces the largest declines (or smallest increases) in crop yields and represents the worst-case scenario for Ghana’s agricultural sector.
Hydropower in Ghana is expected to be adversely affected by climate change, except in the “global wet” scenario, where average generation during 2046–2050 is two percent above the baseline. The selection of the “global wet” scenario took into account precipitation levels beyond Ghana’s borders, which is important since the Volta river—on which Ghana’s main dams depend—extends into Burkina Faso. The “global wet” scenario reflects greater upstream rainfall, which has a positive effect on river flow and downstream hydropower generation. Again, the “local dry” scenario is the worst-case for Ghana’s energy sector.
The road infrastructure model in Twerefou
et al. [
10] was adapted following the approach described in Chinowsky and Arndt [
11]. Rather than estimate the incremental costs of maintaining a given road network, the adapted approach maintains a fixed projection of the government’s road budget until 2050. Increases in precipitation, temperature and flooding increase the rate of surface deterioration and require larger allocations of the budget to road maintenance, as well as to road replacement in the case of wash-outs caused by flooding. Higher maintenance costs means that there are less funds available for constructing new roads.
Table 1 indicates that climate change will increase maintenance and replacement costs in all four climate scenarios, leading to a shorter average national road network length in 2046–2050 than in the baseline. The “global dry” scenario is the worst-case for road infrastructure, since, despite being dry at the global level, it is in fact a more flood-prone scenario for Ghana. It is important to note that a dry year may still include short periods of intense rainfall. In contrast to earlier sector results, the “local dry” scenario is the best-case for road infrastructure because it involves the smallest increases in flood frequency and severity.
Finally, the extent of agricultural land losses from SLR is based on results from the “DIVA” global model [
2], which is an integrated model of coastal systems that assesses the biophysical impacts of SLR taking into account coastal erosion, coastal flooding, wetland change and salinity intrusion into deltas. DIVA uses information on land use and coastal population and economic growth to determine the lands permanently lost to SLR. The model predicts that 20,100 hectares of land will be permanently inundated if the sea level increases by 30.7 centimeters by 2050 (relative to 2010 sea levels). Assuming that all land inundation occurs on farm land, this implies a 3.8 percent decline in farm land availability in the coastal zone by 2050 relative to the baseline (or alternatively a 0.3 percent decline in total cultivated land in the whole of Ghana). Since the DIVA model is not linked to any particular GCM/SRES pairing, we assume that the same SLR occurs in each of the four climate scenarios.
3. Modeling Economic Impacts
3.1. Economy-Wide Model
The biophysical impacts in each sector are passed down to a static computable general equilibrium (CGE) model of Ghana, which estimates the economic impact of each climate projection, including indirect or economy-wide linkages between sectors, regions and households. CGE models are well-suited to analyzing climate change. First, they simulate the functioning of a market economy, including markets for labor, capital, and commodities, and can therefore evaluate how changing economic conditions are mediated via prices and markets. Secondly, CGE models ensure that all economy-wide constraints are respected, which is crucial for long-run climate change projections. Finally, CGE models provide a “simulation laboratory” for examining quantitatively how the various impact channels of climate change influence the performance and structure of the whole economy. We use the “Standard CGE Model” developed by the International Food Policy Research Institute [
12]. The model’s parameters are calibrated to a social accounting matrix (SAM), which captures Ghana’s detailed economic structure. This is an updated version of the 2005 SAM described in Breisinger
et al. [
13], though it does not incorporate rebased national accounts released in 2011. This means that, while the share of agriculture in GDP is broadly consistent with current estimates, the SAM underestimates the size of the services sector, particularly informal urban trade. Our analysis, however, focuses on agriculture, energy and rural roads. As discussed in the next section, the 2007 SAM is updated to projected 2050 SAM using a recursive dynamic version of the static model used to measure climate change’s economic impacts.
The CGE model identifies 37 sectors, 14 of which are in agriculture and 15 in industry. Agriculture is further disaggregated across four agro-climatic regions using crop production and livestock data from the Ministry of Agriculture. This regional detail captures subnational variation in climate conditions as well as rural livelihood patterns. Producers in each sector and region maximize profits when combining intermediate inputs with land, labor and capital. We use nested constant elasticity of substitution (CES) production functions that reflect region-specific technologies (i.e., factor and intermediate inputs) and allow for imperfect substitution between factors. Based on the 2005/06 Ghana Living Standards Survey (GLSSV), labor markets are segmented into three groups (i.e., family farmers, unskilled workers, and skilled nonfarm workers). Family farmers and agricultural crop land are disaggregated across the four regions. Given low unemployment levels in Ghana and limited investment levels, we assume that capital and unskilled and skilled workers are fully employed, i.e., their supply is fixed at baseline levels and the real wage adjusts to maintain equilibrium. Family farm workers, on the other hand, are underemployed, i.e., their supply is elastic at a fixed real wage. Labor and capital are mobile across sectors but not regions. The allocation of agricultural land across crops is fixed at baseline levels.
The impact of climate change is influenced by trade and movements in market prices. For example, a decline in food production caused by declining crop yields might be offset with an increase in food imports. We assume that producers in each region supply their output to national product markets (using a CES aggregation function), which avoids having to model inter-regional trade flows for which no data is available. International trade is captured by allowing production and consumption to shift imperfectly between domestic and foreign markets depending on the relative prices of imports, exports and domestic products. We employ CES functions for imports and constant elasticity of transformation functions for exports. Trade function elasticities are from Dimaranan [
14]. Since Ghana is a small economy, world prices are fixed, and the current account balance is maintained by a flexible real exchange rate.
Households in the model are separated across the four agro-climatic regions as well as a fifth region representing Accra, the capital city. Households in each region are also disaggregated across rural and urban areas and per capita expenditure quintiles. In total there are 45 representative households in the model. Factor incomes are distributed based on households’ factor endowments. Households save and pay taxes and the balance of income is used for consumption expenditure. The latter is based on a linear expenditure system (LES) of demand, which allows for non-unitary income elasticities. These were estimated using GLSSV for urban and rural quintiles [
15].
The government is a separate agent in the model. Government revenues (mainly from taxes and foreign aid) are used to purchase services, such as public administration, health and education. To balance the government budget, we assume that indirect tax rates adjust, through additive increases in sales tax rates across commodities, to ensure that revenues equal total spending and borrowing.
In equilibrium, factor returns adjust such that, for each factor, total factor supply equals the sum of sectoral factor demands. Product market equilibrium requires that the total supply of each good equals total private and public consumption, investment demand and total intermediate use. Market prices for commodities adjust to maintain this equilibrium. Finally, we adopt a “balanced” closure in which private and public consumption and investment spending are fixed shares of total nominal absorption [
12]. This closure spreads macroeconomic adjustments across the components of absorption, which is a likely adjustment mechanism for long-run analysis. Finally, the national consumer price index is the numéraire.
3.2. Simulating Climate Impacts
Climate change affects agricultural production in the CGE model via predicted annual yield deviations estimated by crop models (see
Table 1). More specifically, we shock the shift parameter on the crop production functions, thus simulating a change in total factor productivity (TFP). The CGE model then determines how much labor and capital resources should be devoted to each farm and non-farm activity based on their relative profitability. This reallocation of resources permits some autonomous adaptation by farmers and nonagricultural producers. For example, representative farmers in each region can reallocate their labor and capital between crops in response to climate change based on relative price changes. However, by fixing the crop land allocation, agricultural producers in our model lie somewhere between the “smart” and “dumb” farmer assumption. In other words, while our farmers do not anticipate climate changes, they are able to partly adjust their crop production levels in response to climate change.
Similar autonomous adaptation mechanisms operate in the non-agricultural parts of the economy, e.g., through the reallocation of labor between detailed industrial and service sectors, or the mediation of supply shocks through product market and price adjustments. The model also allows Ghana’s economy to adapt to climate-induced changes in domestic production by adjusting the level of imports and exports (subject to a foreign exchange constraint). While our model contains a rich treatment of autonomous economic adaptation, our static specification does not capture the adjustment path and so should be interpreted as a final assessment of impacts after the climate projections are realized and have worked their way through the economic system.
It is also worth noting that the autonomous adaptation mechanisms in the general equilibrium model incur economic costs. For example, climate change may reduce crop yields and require that additional resources be reallocated to agriculture in order to offset rising food prices. Since agriculture is one of Ghana’s least productive sectors (in terms of value-added per worker), redirecting resources to agriculture reduces average GDP per worker. The ability to capture these kinds of trade-offs incurred when adapting to climate change is one of the main features of CGE models relative to other methods for measuring the economic impacts of climate change.
Changes in hydropower generation are directly imposed on the level of electricity produced in the CGE model. Capital stocks in the model’s hydropower sector are fixed and it is difficult to substitute this with additional labor. This means that when changes in annual productivity from the hydropower model are imposed on the CGE model, it leads to proportional changes in hydropower electricity generation. Hydropower’s contribution to overall electricity supply in Ghana declined from around 74 percent in 2007 to 66 percent in 2011 [
1]. We assume that hydropower’s share of total electricity use in Ghana continues to fall by half a percentage point per year, until it accounts for only 48 percent of total electricity supply in 2050. We rescale hydropower’s impact on Ghana’s total energy supply to reflect its declining contribution. We assume that there is no change to the supply of non-hydropower electricity as a result of climate change.
Damages to Ghana’s road networks lead to changes in the productivity of the CGE model’s transport sector (following the above approach used for the hydropower sector). The model includes trade and transport margins that are imposed on all marketed goods,
i.e., both domestic and foreign. These margins generate demand for the services produced by traders and transporters. If climate change reduces the productivity of the transport sector then it increases the cost of supplying goods to domestic and foreign markets. Its effect on individual sectors depends on how high their initial transaction costs are. Following Arndt
et al. [
16], we assume that a percentage change in the road network length leads to an equal percentage change in the TFP parameter in the transport sector’s production function. Simply put, damages to the road network reduce the productivity of traders and transporters (e.g., by increasing travel time) and this increases the gap between producer and consumer prices,
i.e., producers earn less for their goods and consumers pay more.
SLR reduces the supply or availability of agricultural land in the coastal zone. This reduces the productive capacity of this region of the country and will directly affect the incomes of local farmers as well as the welfare of households who consume agricultural products. It may also raise agricultural prices, thereby benefiting those farmers in other regions who are able to supply coastal markets.
4. Simulation Results
4.1. Baseline “No Climate Change” Scenario, 2007–2050
Before measuring the impacts of climate change, we must first adjust our base year equilibrium to reflect the structural changes that are expected to take place in the Ghanaian economy over the period 2007 to 2050. This adjustment is important for measuring long-term climate change impacts. For example, during 2006–2013, agricultural gross domestic product (GDP) grew at a slower pace than industry and services, causing the share of agriculture in total GDP to decline [
17]. This declining share of agriculture is consistent with the experiences of other countries during their development processes and so is likely to continue in Ghana into the future. If we do not account for agriculture’s declining importance we could overestimate the economy-wide consequences of crop yield changes in 2050. Conversely, industrial growth is expected to increase Ghana’s electricity requirements in the future. Overlooking industry’s rising importance in the economy may underestimate the effects of changes in hydropower generation.
Given the importance of structural change, we run a recursive dynamic variant of the CGE model for the period 2007–2050 [
18]. We then calibrate the static model to the final year solution from the dynamic model. Our dynamic model captures the observed unevenness of sectoral productivity growth and changes in factor supplies in Ghana. The latter includes faster growth for better-educated workers and a declining rural population to crop land ratio, both of which are continuations of observed trends. Overall, national GDP in the dynamic model grows at just under five percent per year until 2050. Agriculture’s share of total GDP falls by a third from 35.1 percent in 2007 to 20.1 percent in 2050. In contrast, services’ GDP share rises from 34.4 percent to 47.0 percent over the same period. All of the impacts reported below for our climate change scenarios are relative to this new projected 2050 benchmark year.
4.2. Climate Change Impacts
Table 2 reports the combined effect of the four climate change impact channels on Ghana’s GDP. As discussed earlier, the “local dry” scenario represents the worst-case for the agricultural sector since it leads to largest overall decline in crop yields. This is reflected in the decline in agricultural GDP by 1.9 percent by 2050 relative to a “no climate change” baseline. Some of the largest economic losses occur within the important export crop sector, especially cocoa. In contrast, the positive crop yield changes associated with the “local wet” scenario lead to an increase in agricultural GDP of 0.1 percent. Overall, Ghana’s agricultural sector contracts in three of the four climate scenarios considered in our analysis. Changes in national agricultural GDP hides variation in outcomes across sub-national regions. For example, while national agricultural GDP increases slightly in the “local wet” scenario, this is driven by large positive impacts in the Forest and Transitional zones, which outweigh sharp declines in the Coastal and Savannah zones. This underscores the vulnerability of particular regions and population groups as well as the need for sub-national climate change impact analysis.
Table 2.
National and sectoral GDP impacts.
Table 2.
National and sectoral GDP impacts.
| Shares (%) | Change in GDP by 2050 (%) |
|---|
| 2007 | 2050 | Global wet | Global dry | Local wet | Local dry |
|---|
| Real GDP at market prices | 100.0 | 100.0 | −1.03 | −2.54 | −1.00 | −0.83 |
| Absorption | 121.4 | 102.9 | −1.00 | −2.47 | −0.98 | −0.80 |
| Private consumption | 85.6 | 72.5 | −1.24 | −2.86 | −1.16 | −1.11 |
| Exports | 33.6 | 56.3 | −2.38 | −6.33 | −2.57 | −0.64 |
| Imports | −55.0 | −59.2 | −2.26 | −6.02 | −2.44 | −0.61 |
| Real GDP at factor cost | 100.0 | 100.0 | −0.66 | −1.52 | −0.59 | −0.83 |
| Agriculture | 35.1 | 20.1 | −1.03 | −0.20 | 0.09 | −1.86 |
| Cereal crops | 3.3 | 1.7 | 0.11 | 0.63 | 0.79 | 0.59 |
| Root crops | 8.4 | 5.5 | 1.63 | 1.72 | 1.99 | 1.26 |
| Export crops | 7.3 | 0.8 | 0.51 | −1.42 | 1.46 | −3.89 |
| Other crops | 8.2 | 6.6 | −4.64 | −2.23 | −2.02 | −6.02 |
| Other agriculture | 8.0 | 2.0 | 0.02 | 0.22 | 0.27 | −0.46 |
| Coastal zone | 3.4 | 3.1 | −1.98 | −2.78 | −1.74 | −1.98 |
| Forest zone | 14.9 | 6.6 | 1.41 | 0.86 | 2.01 | 0.07 |
| Transitional zone | 9.8 | 5.7 | 0.99 | 0.64 | 1.78 | −0.24 |
| Savannah zone | 7.0 | 4.6 | −6.44 | −1.02 | −3.54 | −6.58 |
| Industry | 30.5 | 33.0 | 0.82 | 1.01 | 0.30 | −0.78 |
| Agro-processing | 3.6 | 2.6 | −0.42 | 0.96 | 0.67 | −2.40 |
| Electricity | 2.9 | 3.4 | 1.86 | −1.67 | −1.89 | −3.68 |
| Services | 34.4 | 47.0 | −1.53 | −3.86 | −1.49 | −0.43 |
| Transport | 3.5 | 4.7 | −2.95 | −7.35 | −3.07 | −0.71 |
Changes in agricultural production have spillover effects on production in downstream nonagricultural sectors. For example, agro-processing in the manufacturing sector is indirectly affected by a reduction in the supply of raw materials, with losses for this subsector occurring in the “local dry” scenario, which is the worst-case for agriculture. Agro-processing is also adversely affected by a deterioration in the road network and the decline in electricity supply. The former increases the cost of accessing raw agricultural inputs and supply markets, while the latter reduces the supply of a crucial intermediate input for many manufacturing firms. In contrast, nonagricultural sectors, like agro-processing, benefit somewhat from a decline in agriculture, which releases labor to work in other sectors. For example, there is an increase in agro-processing GDP in the “local wet” scenario despite a slight contraction of agricultural GDP and a large deterioration of the road network caused by major flooding. The variation in the relative importance of different impact channels for different sectors underscores the importance of a multi-sectoral approach. Reliance on single-sector analysis may lead to an incorrect assessment of which areas of the economy are most vulnerable to climate change. Similarly, the spillovers between sectors, such as through product and labor markets, emphasizes the importance of economy-wide analysis of climate change impacts.
The combined effect of the four climate impact channels considered in our analysis leads to a lower level of total GDP in Ghana by 2050 than would have been achieved in the absence of climate change. The decline in total GDP at factor cost ranges from 0.6 percent in the “local wet” scenario to 1.5 percent in the “global dry” scenario. The decline in GDP at market prices—a more important indicator for national welfare—is significantly larger. This is because climate change has implications for indirect taxes, most of which are collected on petroleum and trade services. Both commodities depend heavily on the transport sector, which is a major demander of petroleum and a major intermediate input for traders. The deterioration of the road network causes transport productivity to fall and transport prices to rise. This reduces demand for products that are heavily traded, with knock-on effects for petroleum and trade services, and hence real indirect tax collections. The gap between GDP at factor cost and market prices is therefore largest in the “global dry” scenario, which is the worst-case for Ghana’s transport sector (see
Table 1). Overall, the decline in total GDP at market prices ranges from 0.8 percent in the “local dry” scenario to 2.5 percent in the “global dry” scenario.
Lower GDP at market prices leads to lower levels of total absorption, which is the total value of all goods and services consumed in the economy. Absorption, for example, includes both private and public spending on social services, such as health and education. It also includes public investment in schools and clinics. Absorption is therefore an aggregate measure of national welfare and is more comprehensive than private consumption alone. In our model we assume that changes in total nominal absorption are distributed proportionally across each of its components,
i.e., private and public consumption and investment demand. In real terms, however, changes in these components may vary due to relative price changes. For example, climate change has a larger detrimental effect on private household consumption because of its negative impact on agricultural production, which leads to higher consumer prices. In contrast, investment, which mainly consists of demand for imported machinery, is more insulated from climate change’s effects on local production. As a result, the decline in private household consumption is larger than the decline in total absorption.
Table 3 disaggregates the effect of climate change on household consumption levels.
Table 3.
Household welfare impacts.
Table 3.
Household welfare impacts.
| Per capita income (US$) | Change in real incomes by 2050 (%) |
|---|
| 2007 | 2050 | Global wet | Global dry | Local wet | Local dry |
|---|
| All households | 774 | 1693 | −1.50 | −3.35 | −1.44 | −1.17 |
| Accra | 1708 | 4444 | −1.25 | −2.34 | −0.86 | −1.71 |
| Coast | 582 | 1179 | −1.72 | −4.17 | −1.84 | −1.20 |
| Forest | 482 | 964 | −0.89 | −2.32 | −0.90 | −0.57 |
| Transitional | 2127 | 3989 | −1.89 | −5.33 | −2.28 | −0.55 |
| Savannah | 333 | 767 | −2.99 | −4.94 | −2.94 | −1.90 |
| Urban households | 1119 | 2768 | −1.60 | −3.34 | −1.35 | −1.67 |
| Rural households | 550 | 992 | −1.30 | −3.37 | −1.62 | −0.25 |
| Quintile 1 | 213 | 446 | −2.90 | −6.80 | −3.43 | −0.76 |
| Quintile 2 | 359 | 664 | −1.81 | −4.74 | −2.22 | −0.38 |
| Quintile 3 | 509 | 1014 | −1.98 | −4.78 | −2.19 | −0.92 |
| Quintile 4 | 878 | 2033 | −0.91 | −1.76 | −0.66 | −1.21 |
| Quintile 5 | 1912 | 4306 | −1.47 | −3.20 | −1.31 | −1.38 |
All households are adversely impacted in each of the four climate change projections. However, distributional effects are unevenly felt across household groups. Urban households are the worst affected in the “local dry” scenario because they are net buyers of food products, whose prices rise as a result of climate change. For rural farmers, this adverse effect is partly offset by higher agricultural incomes. However, rural households in lower expenditure quintiles are also typically net buyers of food and also allocate a larger share of their incomes to food consumption [
19]. As a result, lower income households in both rural and urban areas are the worst affected in three of the four climate change scenarios considered here. This uneven distributional outcome is pronounced in the “global dry” scenario. This is because the deterioration of the road network disproportionately hurts agricultural producers, whose products face the highest transaction cost margins. Finally, the Savannah zone is generally the worst affected region in Ghana, due to its greater reliance on agricultural incomes and consumption and its greater remoteness and hence higher transaction costs.
Table 4 decomposes the contribution of the four climate impact channels to the overall decline in total absorption caused by climate change. Rising sea levels has a modest impact on national welfare because its effects are localized within the Coastal zone. The effect of reduced energy supply is also small. This is because climate change’s impact on hydropower generation is quite modest (see
Table 1) and hydropower’s contribution to overall energy supply declines over time. Instead, the main impact channels are either agriculture in “local dry” scenario or road infrastructure in the “global dry” scenario. In fact these two impact channels tend to offset each other,
i.e., drier local conditions hurt agriculture but are less detrimental to road surfaces, whereas higher rainfall damages road surfaces but (in moderation) favors agricultural production. Again, this underscores the importance of considering multiple impact channels, which may offset or compound each other.
Table 4.
Decomposition of climate change impacts.
Table 4.
Decomposition of climate change impacts.
| Contribution to change in total absorption by 2050 (%-point) |
|---|
| Global wet | Global dry | Local wet | Local dry |
|---|
| Total absorption change | −1.00 | −2.47 | −0.98 | −0.80 |
| Sea level rise channel | −0.03 | −0.03 | −0.03 | −0.03 |
| Agriculture impact channel | −0.04 | 0.08 | 0.25 | −0.63 |
| Energy impact channel | 0.06 | −0.06 | −0.07 | −0.13 |
| Roads impact channel | −0.99 | −2.45 | −1.13 | −0.01 |
4.3. Adaptation Policies
We consider four adaptation policy responses to avoid some of the impacts of climate change on Ghana’s economy. First, we increase public investment in the agricultural research and extension system. More specifically, we raise the productivity of all crops by four percent by 2050 relative to the baseline. This is equivalent to a 0.1 percentage point increase in Ghana’s annual agricultural TFP growth over the period 2010–2050, which falls well below the yield improvements targeted by Ghana in its commitment under the Comprehensive African Agricultural Development Program (CAADP) [
15]).
Second, we extend the use of irrigation in agriculture by increasing the share of total crop land that it is irrigated by 15 percentage points (from 3 percent in the baseline). New irrigation investments in the model are directed towards maize, rice, pulses and horticulture. Amisigo
et al. [
9] estimated smaller yield losses and larger yield gains for irrigated crops than for rain-fed crops. Rain-fed rice yields, for example, decline by 1.4 percent in the “local dry” scenario, but by only 0.1 percent when rice is irrigated. Similarly, rain-fed maize yields increased by 1.1 percent in the “local dry” scenario, but by 1.4 percent when irrigated. Expanding irrigation coverage therefore reduces the negative effects of climate change and increases its positive effects.
Third, we accelerate the pace of energy diversification away from the current dependence on hydropower. Previously we assumed that hydropower gradually declines in importance until it accounts for 48 percent of electricity supply in 2050. We now reduce this further to 28 percent in 2050. Since we assume that climate change does not affect non-hydropower energy sources, this more rapid diversification away from hydropower reduces the weighted impact of climate change on the energy sector.
Finally, we improve road surfaces by sealing unpaved roads such that they become more resilient to stress from precipitation, temperature and flooding. This is the only adaptation scenario not incorporated in Ghana’s national development plan and thus we explicitly consider the cost of adaptation. In particular, we do not include investment costs in our analysis of agricultural research, irrigation and non-hydropower energy supply because these investments are already intended to be part of Ghana’s national development plan. Our adaptation scenarios therefore consider how effective these forthcoming investments will be in mitigating the effects of climate change. Sealed roads are more expensive than unsealed roads and so this increases the cost per kilometer of building new roads. On the other hand, the greater resilience of sealed roads implies lower damages from climate stress. It is therefore a trade-off between either higher construction costs or higher maintenance costs, with the climate projection ultimately determining whether sealing roads leads to a longer or shorter road network by 2050.
Table 5 reports changes in total real absorption for the “with” and “without adaptation” scenarios (the latter corresponds to results reported earlier in
Table 2). Both sets of scenarios are relative to the “no climate change” baseline. Each of the four adaptation options tends to reduce the decline in absorption caused by climate change. For example, a four percent increase in baseline crop yields in 2050 is enough to offset all of the absorption losses incurred in the “local dry” climate projection. Even in the “global dry” scenario, the increase in yields reduces national welfare losses by a quarter,
i.e., from 2.5 to 1.9 percent. Given the relatively small size of the yield improvements needed to offset climate change damages, we conclude that raising crop yields is likely to be an effective adaptation option for Ghana. Moreover, this adaptation option is consistent with Ghana’s existing development objectives of reducing rural poverty [
20].
Table 5.
Adaptation policy impacts.
Table 5.
Adaptation policy impacts.
| Change in absorption by 2050 (%) |
|---|
| Global wet | Global dry | Local wet | Local dry |
|---|
| Without adaptation policies | −1.00 | −2.47 | −0.98 | −0.80 |
| With adaptation policies | - | - | - | - |
| Agricultural extension | –0.30 | –1.86 | –0.30 | 0.08 |
| Irrigation investment | –0.85 | –2.38 | –0.08 | –0.61 |
| Energy diversification | –1.03 | –2.44 | –0.95 | –0.75 |
| Road improvements | –0.41 | –1.53 | –0.24 | –0.83 |
There are more modest reductions in the welfare losses caused by climate change when adaptation policy is directed towards either increasing irrigation coverage or diversifying energy supply. Irrigation is less effective than agricultural research and extension (with the exception of the “local wet” scenario). This is not because of irrigation’s higher costs, which are not considered here, but rather because irrigation does not substantially reduce yield losses for those crops that are worst affected by climate change, such as cocoa. One exception is horticulture, which benefits significantly from irrigation but which is a relatively small agricultural subsector in the baseline (included within “other crops” in
Table 2).
The limited effect of reducing Ghana’s dependence on hydropower is primarily due to the initially small impact of climate change on hydropower generation. Accelerating energy diversification reduces absorption losses, albeit only slightly. Note that diversification reduces the small positive effect of climate change on hydropower generation in the “global wet” scenario, causing total absorption losses to increase slightly in this adaptation scenario.
Finally, sealing unpaved roads reduces the absorption losses caused by climate change in three of the four climate projections considered here. The benefits of sealing roads are largest in the “global dry” scenario, which is the worst case climate projection for road infrastructure. In contrast, absorption losses increase very slightly in the “local dry” scenario, which is the best case climate projection for road infrastructure. This increase highlights the importance of taking costs into account when evaluating adaptation options. In the “local dry” scenario, there are only very modest infrastructure damages caused by climate change (see
Table 1). This means that the reduction maintenance costs relative to the baseline is also quite modest, and is more than offset by the higher construction costs of sealing unpaved roads. The net effect is a shorter road network by 2050. However, this is a very small effect, and our overall results suggest that sealing unpaved roads is a cost-effective means of reducing climate change damages in Ghana.
5. Conclusions
Analyzing the economic impacts of climate change is complicated by its multiple impact channels and high degree of uncertainty. In this paper we examined the implications of climate change for economic development in Ghana until 2050. Drawing on detailed sector studies, we imposed estimates of biophysical impacts on agriculture, energy, road infrastructure and coastal farm land on an economy-wide, multi-sector model of Ghana. To account for uncertainty, we used four climate change projections that spanned the full distribution of predicted changes in Ghana’s climate moisture index.
Our results indicate that climate change will reduce Ghana’s national welfare or total absorption in 2050 relative to a “no climate change” baseline. Estimates of these damages range from 0.8 to 2.5 percent of baseline absorption depending on which climate projection is considered. However, in some sectors there are benefits from climate change, particularly within agriculture. These results therefore underscore the importance of accounting for multi-sector impact channels and climate uncertainty. Climate change’s adverse impacts are also unevenly distributed across households and subnational regions in Ghana. In most climate scenarios, it is poorer and urban households and those located in the northern Savannah zone that are the worst affected. It is important to include distributional and subnational analysis in order to identify vulnerable groups and adaptation responses. Our analysis suggests that investments in agricultural research and extension and in sealing road surfaces are likely to be cost-effective means of reducing the damages from climate change in Ghana.
Our estimated GDP impacts are consistent with those from other recent studies. Mendelsohn
et al. [
21] come closest to adopting an economy-wide perspective and estimate GDP losses for Ghana of between two and five percent by 2100. This is broadly consistent with our lower estimates for 2050. Nutsukpo
et al. [
6] also find that climate change has positive implications for agriculture in Ghana under certain climate change scenarios. These authors conclude that other factors, such as population and long-term economic growth, are likely to be more important than climate change in determining future economic development in Ghana.
To our knowledge, ours is the most comprehensive study to date of the economic implications of climate change for Ghana. However, there are a number of areas in which our study could be extended and strengthened. First, while we simulated four climate projections, we cannot infer which of these is most likely to occur. It would be preferable to base our analysis on probabilistic GCMs that attach likelihoods to climate projections. Second, while we covered four major impact channels, our sector coverage is incomplete. We did not, for example, consider the effect of climate change on human health. Finally, we used a static economy-wide model, whereas climate change is a dynamic phenomenon. We may therefore have over- or underestimated Ghana’s ability to adapt to climate change as it gradually unfolds. Recognizing these limitations, our analysis suggests that climate change will adversely affect Ghana’s economic development prospects. However, we also find that these adverse climate change effects are likely to cause only a small deviation from Ghana’s current development trajectory. Moreover, our analysis of road infrastructure suggests that there are cost-effective adaptation options that can be used to offset climate damages without detracting from the country’s overall development objectives.
Acknowledgments
This work was conducted within the framework of the Development Under Climate Change (DUCC) at the World Institute for Development Economics Research at the United Nations University (UNU-WIDER). UNU-WIDER gratefully acknowledges core support from the governments of Denmark, Finland, Sweden, and the United Kingdom.
Author Contributions
All authors contributed substantially to all aspects of this article.
Conflicts of Interest
The authors declare no conflict of interest.
References
- Institute of Statistical, Social and Economic Research (ISSER). The State of the Ghanaian Economy in 2011; Institute of Statistical, Social and Economic Research, University of Ghana: Accra, Ghana, 2012. [Google Scholar]
- World Bank. Economics of Adaptation to Climate Change: Ghana Case Study, Country Report of the Economics of Adaptation to Climate Change Study; World Bank: Washington, DC, USA, 2010. [Google Scholar]
- World Bank. Energizing Economic Growth in Ghana: Making the Power and Petroleum Sectors Rise to the Challenges; World Bank: Washington, DC, USA, 2013. [Google Scholar]
- National Development Planning Commission (NDPC). Ghana Shared Growth and Development Agenda, 2010–2013; Ghana’s medium term development agenda; National Development Planning Commission: Accra, Ghana, 2010.
- Schlenker, W.; Lobell, D. Robust Negative Impacts of Climate Change on African Agriculture. Environ. Res. Lett. 2010. [Google Scholar] [CrossRef]
- Nutsukpo, D.K.; Jalloh, A.; Zougmoré, R.; Nelson, G.C.; Thomas, T.S. West African Agriculture and Climate Change: A Comprehensive Analysis; Jalloh, A., Nelson, G.C., Thomas, T.S., Zougmoré, R., Roy-Macauley, H., Eds.; International Food Policy Research Institute: Washington, DC, USA, 2013. [Google Scholar]
- Environmental Protection Agency (EPA). Ghana’s Second National Communication (GSNC) to the UNFCCC; Environmental Protection Agency: Accra, Ghana, 2011. [Google Scholar]
- Ghana Statistical Service (GSS). Ghana Living Standards Survey, Round V Report; Ghana Statistical Service: Accra, Ghana, 2008.
- Amisigo, B.A.; McCluskey, A.; Swanson, R. Modeling Impact of Climate Change on Water Resources and Agricultural Demand in the Volta Basin and Other Basin Systems in Ghana; WIDER Working Paper 2014/033; United Nations University World Institute for Development Economics Research: Helsinki, Finland, 2014. [Google Scholar]
- Twerefou, D.K.; Adjei-Mantey, K.; Strzepek, N.L. The Economic Impact of Climate Change on Road Infrastructure in sub-Saharan Africa Countries: Evidence from Ghana; WIDER Working Paper 2014/032; United Nations University World Institute for Development Economics Research: Helsinki, Finland, 2014. [Google Scholar]
- Chinowsky, P.; Arndt, C. Climate Change and Roads: A Dynamic Stressor-Response Model. Rev. Dev. Econ. 2012, 16, 448–462. [Google Scholar] [CrossRef]
- Lofgren, H.; Robinson, S.; El-Said, M. A Standard Computable General Equilibrium (CGE) Model in GAMS; International Food Policy Research Institute: Washington, DC, USA, 2002. [Google Scholar]
- Breisinger, C.; Thurlow, J.; Duncan, M. A 2005 Social Accounting Matrix (SAM) for Ghana. Accra: Ghana Statistical Services; International Food Policy Research Institute: Washington, DC, USA, 2007. [Google Scholar]
- Dimaranan, B.V. Global Trade, Assistance, and Production: The GTAP 6 Data Base; Purdue University: West Lafayette, IN, USA, 2006. [Google Scholar]
- Breisinger, C.; Diao, X.; Thurlow, J.; Benin, S.; Kolavalli, S. Strategies and Priorities for African Agriculture: Economywide Perspectives from Country Studies; Diao, X., Thurlow, J., Benin, S., Fan, S., Eds.; International Food Policy Research Institute: Washington, DC, USA, 2012. [Google Scholar]
- Arndt, C.; Chinowsky, P.; Strzepek, K.; Thurlow, J. Climate Change, Growth and Infrastructure Investment: The Case of Mozambique. Rev. Dev. Econ. 2012, 16, 463–475. [Google Scholar] [CrossRef]
- World Bank. World Development Indicators 2014; World Bank: Washington, DC, USA, 2015. [Google Scholar]
- Diao, X.; Thurlow, J. A Recursive Dynamic Computable General Equilibrium Model. In Strategies and Priorities for African Agriculture: Economywide Perspectives from Country Studies; Diao, X., Thurlow, J., Benin, S., Fan, S., Eds.; International Food Policy Research Institute: Washington, DC, USA, 2012. [Google Scholar]
- Cudjoe, G.; Breisinger, C.; Diao, X. Local Impacts of a Global Crisis: Food Price Transmission, Consumer Welfare and Poverty in Ghana. Food Policy 2010, 35, 294–302. [Google Scholar] [CrossRef]
- Breisinger, C.; Diao, X.; Thurlow, J.; Al Hassan, R.M. Potential Impacts of a Green Revolution in Africa: The Case of Ghana. J. Int. Dev. 2011, 23, 82–102. [Google Scholar] [CrossRef]
- Mendelsohn, R.; Dinar, A.; Williams, L. The Distributional Impact of Climate Change on Rich and Poor Countries. Environ. Dev. Econ. 2006, 11, 159–178. [Google Scholar] [CrossRef]
© 2015 by the authors; licensee MDPI, Basel, Switzerland. This article is an open access article distributed under the terms and conditions of the Creative Commons Attribution license (http://creativecommons.org/licenses/by/4.0/).


