1. Introduction
Smart cards are widely used for several applications. The learning environment offers one of the best opportunities for adopting smart card technology [
1,
2,
3]. Smart card development at universities has happened for quite a few years. Many universities in the USA, for example, Washington University, issue multipurpose “campus” cards that serve as an ID card for access to campus facilities and use as a stored value card for small-value applications, e.g., vending machines and laundry [
4,
5]. University smart card integrated financial cards and can be a type of electronic purse for university staff and students. After loading cash to the card, it can be used to purchase goods and services around the university, e.g., photocopying materials, student parking, Internet access, and public transportation with smart card interfaces [
2,
6,
7].
Currently in Taiwan, some elementary schools and high schools have issued digital student ID cards to control the access to campus buildings and manage students’ registrations for attendance. Meanwhile, since 2010, six universities (including Feng Chia University, Overseas Chinese University, etc.) in the Great Taichung City (the biggest metropolitan area in the Central Taiwan) cooperate together with EasyCard system, which is one of the biggest and most popular smart card systems, to launch a University Smart Card. In this half decade, the University Smart Card provides not just only for in-campus services (e.g., access controlled, financial service in-campus, library service, sport facility service, registration, photocopy, information applications), but also off-campus service, e.g., e-purse service in the shopping area, micro-payment application, and public transportation (e.g., Taichung BRT, Bus, bicycle) services. Therefore, this research focuses on the user’s general opinion-acceptance and examines university students’ behavioral intentional to use University Smart Cards, as well as to propose factors which influence their intention to use.
Dishaw and Strong [
8] mentioned that an integrated model might present more explanatory power than either model alone [
9]. Hence, this research proposes a model that integrates TAM and TRA as a fundamental framework with a component of environmental concern in order to explore the factors that affect students’ adoption intention towards university smart cards. The study uses TRA to explore students’ intended behavior towards the adoption of university smart cards. TAM and environmental concern are applied as the constructs to measure attitude towards the adoption of university smart cards.
2. Literature Review and Hypotheses
2.1. Smart Card
Smart cards were invented 33 years ago by Roland Moreno in France in 1974, but only in recent years they have started to be used more widely by consumers throughout the world [
10]. These cards are commonly used in Europe, particularly in France and England; however, their acceptance in the United States has been more tepid [
11]. In Asia, the highest adoption of smart cards are in Hong Kong, Taiwan, Singapore, Malaysia, Japan and Korea, where the cards are used largely for transit, payphone and e-cash schemes [
12]. The smart card is a technology that is able to store and protect relatively large amounts of data [
13]. The same card can be used for multiple services and among multiple service-providers [
14]. Thus, this single card has the potential to replace all the cards carried in the wallet [
15]. It can simplify the environment by eliminating cash-handling and paperwork problems with some security features.
The range of smart card applications is growing for many reasons, such as security, multiple application and portability [
16,
17]. Smart cards are used in many different applications around the world, particularly for electronic payment, security and authentication, transportation, telecommunications, health care, loyalty programs and education. This paper will focus mainly on smart cards in education.
Colleges and universities have seen the pioneering of smart card use with their closed campus communities [
18]. Over time, the university and many similar organizations have introduced smart cards for a variety of different purposes (e.g., [
10]). The contributions of university smart cards are to organize and transfer information, simplify and accelerate operations such as organization of student data (personal, educational, financial and others), organization of teaching staff data (position of the staff, salary status, authorities and activities), organization of the administrative personnel data (working position, salary status, holidays and overtime) and access to other facilities or services offered by the institute (libraries, university club, student dormitories and others) [
19]. From the whitepaper of [
20], the University of Arizona migrated from magstrip to contactless smart cards in 2007, and on to smart cards with higher security encryption technology in 2012. According to Stephanie Perez, the university’s assistant director for Smart Card Services in the Financial Services Office, moving to smart cards has eliminated the problem of magnetic-strip damage and demagnetization that is common with high usage. As a result, most of the students and staffs carry up to five cards for one purpose or another such as library cards, student identity cards, cards for electronic access control to buildings and secure locations, cards for vending which is typically for photocopying, telephone cards, sports hall passes and computer user cards [
21]. Therefore, university smart cards act as multi-purpose, multi function and smart ID cards which have a multitude of applications and which also support banking and electronic wallet facilities in both on and off-campus shops [
15].
2.2. Technology Acceptance Mode (TAM)
The technology acceptance model (TAM) was introduced to the academic world by Davis [
22] in his paper: “Perceived Usefulness, Perceived Ease of Use, and User Acceptance of Information Technology” in MIS Quarterly. Some studies have indicated that TAM is the revised version of the main concepts of Theory of Reasoned Action [
23]. Davis [
22] defined perceived usefulness (PU) as “the degree to which a person believes that using a particular system would enhance his or her job performance” (p. 985). Numerous empirical researches supports that perceived usefulness is the primary predictor of technology use [
1,
9,
22,
24,
25,
26,
27,
28,
29].
Perceived ease of use (PEU) is defined as “the degree to which the prospective user expects the target system to be free of effort”. (p. 985) Many empirical results demonstrate that the perceived ease of use is positively correlated with behavioral intention directly [
22,
24,
25,
28] and indirectly (through perceived usefulness) [
22,
26,
28,
29,
30]. PE and PEU are the independent variables that explain the relationship between users and a new technology system and ascertain the determinants of technology acceptance. The dependent variables are users’ attitudes (A) and behavioral intentions (BI).
In the context of University Smart card adoption, perceived usefulness refers to the degree to which a user believes that using smart cards will enhance his or her learning performance.
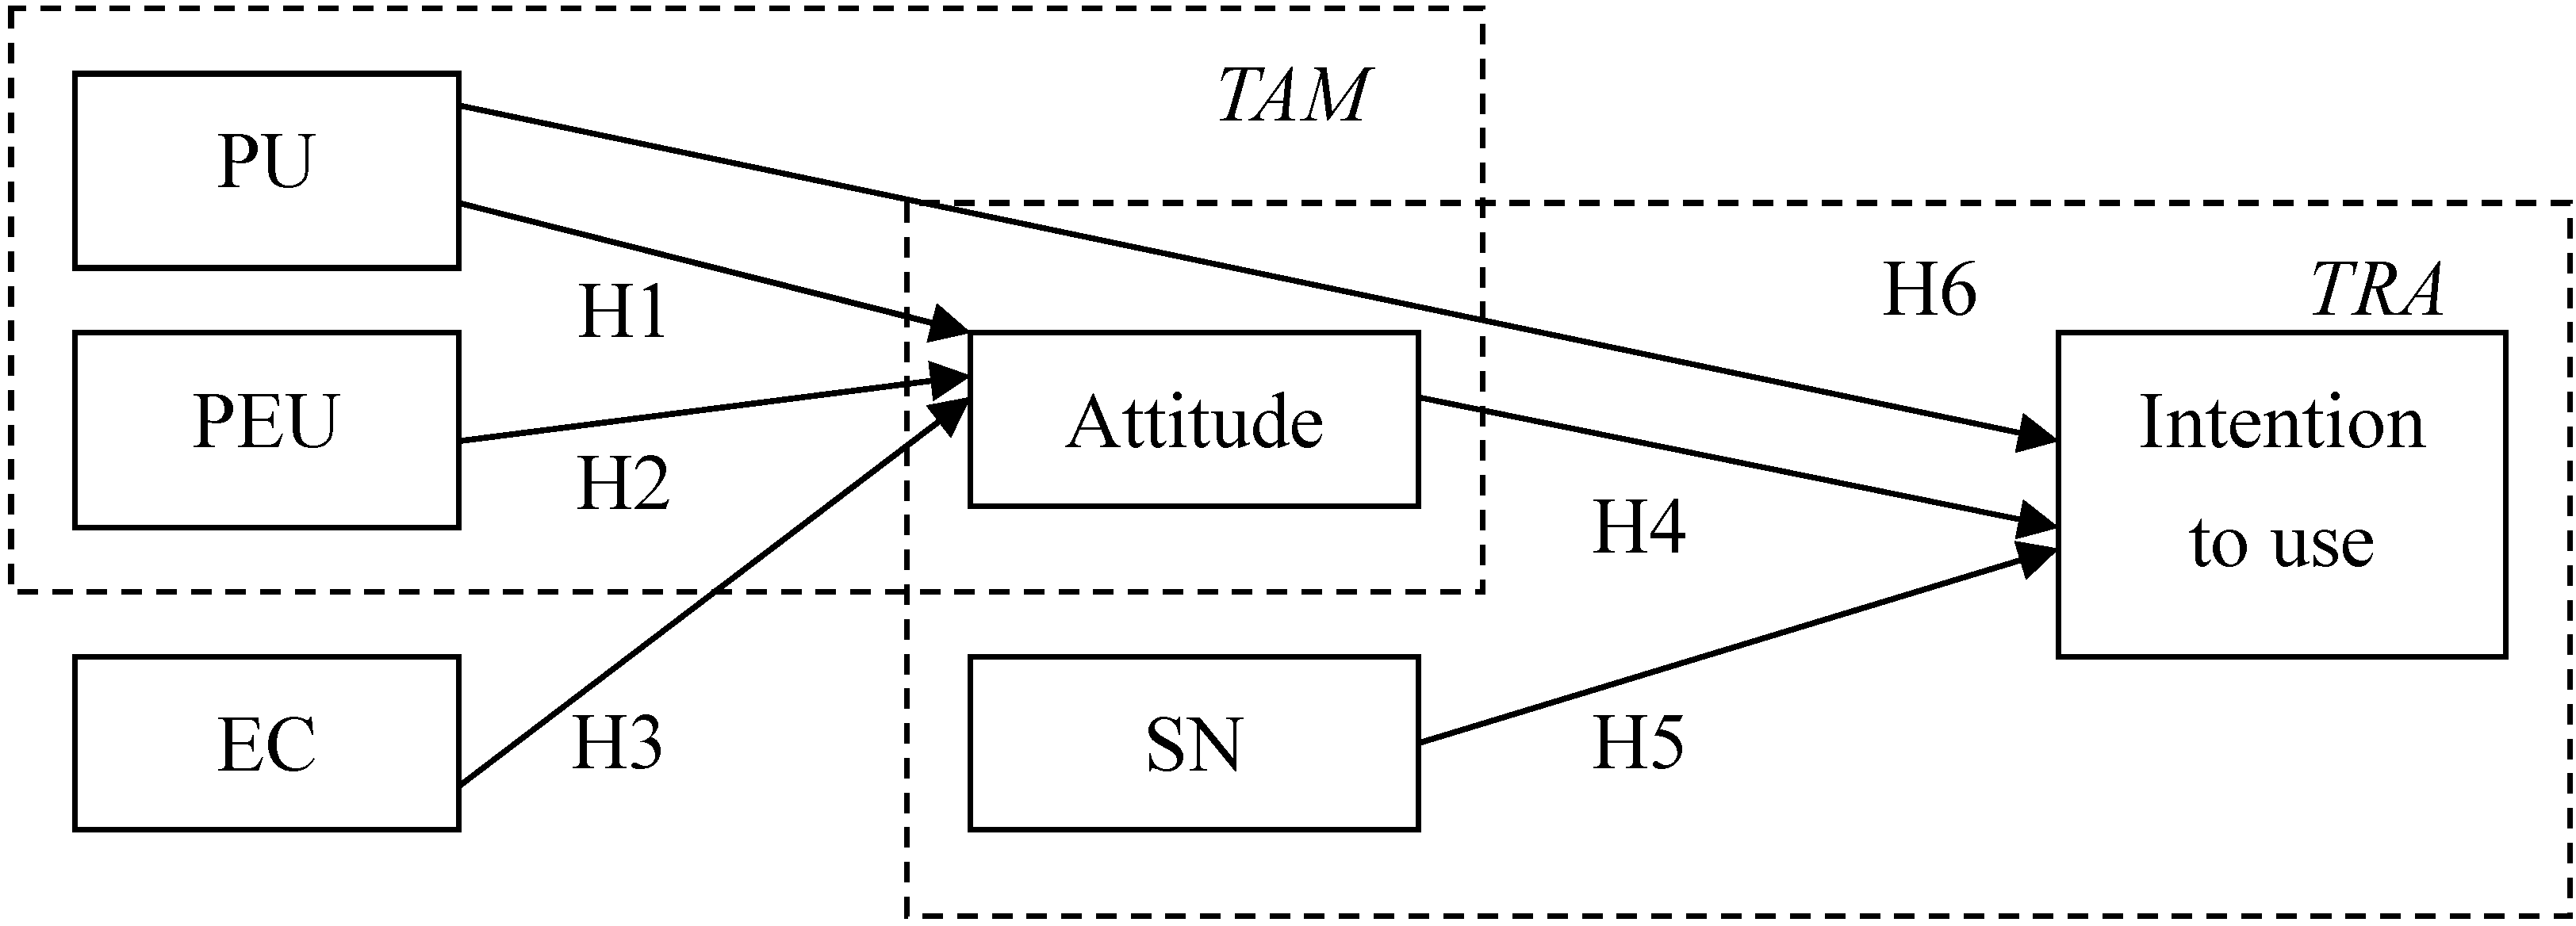
From the research framework shown in
Figure 1, the H1 and H2 are based on the Technology Acceptance Method (TAM) model. The TAM predicts that user acceptance of any technology is determined by two internal beliefs: perceived usefulness (PU) and perceived ease of use (PEU) [
22], which are the outside factors that can influence intention to use a technology. The Technology Acceptance Method (TAM) theory suggests that information system usage is determined by behavioral intention, which is viewed as being jointly determined by the user's attitude toward using the system and the perceived usefulness of the system [
22]. Attitude is defined as an individual’s positive or negative evaluation on performing a particular behavior.
Figure 1.
The integrated research framework.
Figure 1.
The integrated research framework.
H1:
Perceived usefulness of university smart card has positive influence on attitude towards university smart card.
H2:
Perceived ease-of-use of university smart card has positive influence on attitude towards university smart card.
2.3. Environmental Concern—Green University
The 1980s witnessed the rise of international awareness of serious environmental problems arising from human development and the urgent need to remedy the situation. Institutions of higher education therefore began to seek an appropriate role in the drive towards sustainable development. Universities in the United States and Europe started a renewal movement centered on the concept of improving campus sustainability, or the so-called “Green University” movement [
31].
A common value shared among green universities around the world is their ultimate goal of taking sustainable development for human society as a direction in developing higher education. This means the incorporation of appropriate steps to university administration, development plans, teaching and research, environmental maintenance and student life. From the perspectives of the functions and missions inherent to universities, this demands from institutions of higher learning more dedication towards the training of global citizens, orientation towards developing a reformed human society, and a determination towards ensuring sustainability for human civilization. The concept of green university includes the incorporation of a spirit of sustainability into university operations, curriculum planning and daily life on campus; it likewise means providing assistance to the university itself, the community, the society in general, the country and the entire human race in ensuring a sustainable future through teaching, research, innovation and campus activities [
31].
As such, smart card applications in universities would avoid the waste of resources (e.g., over-used plastic cards and paper) and have more environmental considerations in order to achieve the spirit of sustainability in university operations. According to [
32], environmental concern reflects the commitment by an organization to respect and protect the natural environment. In this study, the construct of environmental concern which is applied from [
17] means the prestige and value attributed the use of smart cards and the image of a university in relation to the environment. Accordingly, the following hypothesis is proposed:
H3:
Environmental concern positively influences attitude toward university smart cards.
2.4. Theory of Reasoned Action (TRA)
Theory of reasoned action is a commonly discussed model from social psychology concerned with the determinants of consciously intended behaviors [
22,
23,
33]. In accordance with TRA, a person’s behavioral intention is jointly determined by his/her attitude and subjective norms. Behavioral intention is a measure of the strength of one’s intention to perform a specified behavior [
33] (p. 288). As stated by Sanchez and Hueros [
34], TRA is a general system designed to explain almost every type of human behavior, and the importance of individual belief, in order to predict human conduct. Therefore, this study applies TRA to explore students’ intended behavior towards university smart cards.
According to TRA, attitude is classified as an individual’s positive or negative feelings about performing the target behavior [
33] (p. 216). Attitude explains a person’s favorable or unfavorable assessment regarding the behavior in question. Moreover, a favorable or unfavorable attitude directly affects the strength of the behavior and beliefs regarding possible outcomes [
35]. Ajzen and Fishbein [
23] also mentioned that attitude towards behaviors positively influences behavioral intention. In the past, several researchers have found a positive association between attitude and behavioral intention, such as [
36,
37,
38,
39,
40,
41]. From those literatures, some possible dependent variables from these kinds of models could be “adoption intention”, “intention to use” or “continued intention to use”. This study would tend to name the dependent variable as “intention to use”. Therefore, based on TRA and the previous researches mentioned above, this research defines attitude as a student’s positive or negative assessment of the university smart card and proposes that attitude affects their intentions to use. Accordingly, the following hypothesis is suggested:
H4:
Attitude towards university smart card has a positive influence on the intention to use university smart cards.
Subjective norms note the person’s perception that most people who are important to him/her think he/she should or should not perform the behavior in question [
33] (p. 302). A subjective norm expresses the perceived organizational or social pressure of a person who intends to perform the behavior being considered. In other words, it is related to normative beliefs about the expectations of other people [
35]. Ajzen and Fishbein [
23] also showed that subjective norms towards behaviors positively influence behavioral intention. In the past, a number of researchers have explored the relationship between subjective norms and behavioral intention, such as [
36,
37,
38,
39,
40,
41]. Moreover, many studies have verified that subjective norms have directly influenced behavioral intention [
42]. Therefore, based on TRA and the previous researches mentioned above, this research defines subjective norms as a student’s perception that most people who are important to him/her think he/she should or should not use university smart cards and proposes that subjective norms affect a person’s use intention. Accordingly, the following hypothesis is suggested:
H5:
Subjective norms have a positive influence on the intention to use university smart cards.
Pervious researches utilizing TAM has recognized the importance of PU and attitude toward the technology when investigating intentions to use a technology [
43], in this case, the university smartcard. According to TAM, PU can positively influence usage intentions through the exploitation of goal achievement or rewards [
22]. Therefore, in this study, the authors proposed the target audiences of university smart cards are able to recognize their usefulness as a means of helping their life, which is likely to result in greater usage intentions. Accordingly, the following hypothesis is suggested:
H6:
Perceived usefulness has a positive influence on the intention to use university smart cards.
In summary, the integrated theoretical framework is represented by H1–H6, as shown in
Figure 1.
3. Materials and Methods
3.1. Sample and Data Collection
This study employs a quantitative method for primary data collection via a structured questionnaire survey with university students. Due to the limitation of the place and time costs, the sample for the study was selected from Feng Chia University that is one of the six universities with the University Smart Card and is the member of Green University Union of Taiwan [
44]. University smart card in Feng Chia was launched in 2010 and all participants in this study are already active users of this card. Simple random sampling was applied. All participants were randomly selected on the campus and were asked to participate in a face-to-face questionnaire. Of the total number of 320 responses, 18 were discarded due to missing values or inappropriate responses, which left 302 in the sample, which represents a valid response rate of 94.38%.
3.2. Measurement of Variables
The survey of questionnaire was developed by adapting measurements from various studies, all items for measuring these constructs were obtained through a five-point Likert scale for respondents to point out the extent to which they agreed or disagreed with the item (1 = strongly disagree and 5 = strongly agree). The items for each construct and their scales of measurements are presented in
Table 1.
Table 1.
Measurement items.
Table 1.
Measurement items.
| Constructs | Item | Sources |
|---|
| Perceived Usefulness (PU) | Using University Smart Card supports a critical part of my student life (e.g., vendor machines) | [35,42,45] |
| Using University Smart Card enables me to access a lot of facilities (e.g., photocopy, library loan) within my student life |
| Using University Smart Card will improve services (fast speeds) and save time |
| Using University Smart Card improves my student life in the university |
| Overall, University Smart Card is useful |
| Perceived Ease-of-Use (PEU) | It is easy for me to use University Smart Card | [35,45] |
| It is easy to learn how to use/reload University Smart Card |
| It is easy to remember how to use University Smart Card |
| It is easy to remember to bring University Smart Card with me |
| Overall, University Smart Card is easy to use |
| Environmental Concern (EC) | Using University Smart Card means I care for the environment | [46] |
| Using University Smart Card means I am sensitive to ecological issues |
| Launching University Smart Card means university cares for the environment |
| Launching University Smart Card means university is sensitive to ecological issues |
| Launching University Smart Card means university has well established environmental concern |
| Attitude (AT) | I always enjoy using University Smart Card | [34,47,48] |
| I am positive about using University Smart Card |
| I think that using University Smart Card is a good idea |
| I want to be among the first people to try out new functions of University Smart Card |
| I always consider University Smart Card as my first choice |
| Subjective Norms (SN) | People who are important to me would think that I should use University Smart Card | [9,47,49] |
| People who are influential to me would think that I should use University Smart Card |
| People whose opinions are valued by me would prefer that I use University Smart Card |
| People around me have encouraged me to use University Smart Card |
| Most people in my group/community use University Smart Card frequently |
| Intention to use (INT) | I will definitively keep using University Smart Card | [42,45,47] |
| I’ll use University Smart Card on a regular basis in the future |
| I’ll always use University Smart Card in the future |
| I expect that University Smart Card will make everything easier in the future |
| It is worth using University Smart Card |
4. Results
This final section summarizes the study’s results and discusses major implications. From the 302 valid samples, 27% were males and 73% were females, which are similar to the demographics of the population (36% males and 64% females [
50]). Also, 68% were from College of Business, 21% were from College of Finance and 11% were from College of Humanities & Social Sciences, which are close to the demographics of the population (70% College of Business, 20% College of Finance and 10% College of Humanities & Social Sciences [
50]). Therefore, the samples are representative of the population. In total, 95% of respondents were less than 20 years old and 5% in the 20–24 age range. Under 20-year-old students are freshman and sophomores who need to take more courses in class and almost come to school everyday. However, juniors and seniors (20–24 years old students) have fewer courses at school. That is why the majority of respondents were less than 20 years old in this research. All the findings for each research question and hypothesis are discussed in detail.
4.1. Structural Equation Modeling (SEM)
Structural equation modeling (SEM) is a multivariate technique combining aspects of multiple regressions (examining dependence relationships) and factor analysis (representing unmeasured concepts/factors with multiple variables) to estimate a series of interrelated dependence relationships simultaneously [
51].
The main objective of this research was to investigate the factors influencing Taiwan’s students’ behavioral intentions to use University Smart Cards. Structural equation modeling was considered to be suitable to achieve this research objective because the causal relationships of determinants (predictors) and behavior could best be analyzed by using SEM [
52]. Because of this, SEM was used to analyze the data using IBM SPSS Amos 19. With AMOS 19, users can specify, estimate, assess, and present the model in an intuitive path diagram to show hypothesized relationships among variables [
53].
4.2. Reliability and Validity Testing
Confirmatory factor analysis (CFA) can be used to measure three types of reliability—internal consistency reliability, item reliability, and construct reliability [
54,
55]—and two types of validity—convergent validity and discrimination validity—of a measurement model. Internal consistency reliability is tested using Cronbach alpha coefficients calculated using SPSS 19.0. For unidimensional scales, according to the research of Multivariate Data Analysis [
56], a significant loading could still be fairly weak; a good rule of thumb is that standardized loading estimates should be 0.5 or higher. Therefore, the author deleted the constructs with factor loading below 0.7.
The construct reliability is tested using composite reliability measures that assess the extent to which items in the construct measure the latent concept. A commonly acceptable threshold value for composite reliability (CR) is 0.7 or more, although values below 0.7 have been considered acceptable [
44].
Table 2 below shows that the composite reliability (CR) of the latent variable was higher than 0.7, which indicated that all measures had a good reliability [
55,
57].
Moreover, the completely standardized factor loadings all reached the level of significance. All the latent variables had a CR above 0.70 and an average variance extracted (AVE) above 0.5.
Discriminant validity measures the extent to which conceptually similar constructs are distinct. Discriminant validity is examined by comparing the correlation between the construct and the square root of AVE. AVE represents the overall amount of variance in the indicators accounted for by the latent construct. The AVE should be greater than the square of correlations between the construct for satisfactory discriminant validity [
58].
For a more stringent test, examine whether the average variance explained (AVE) in the indicators by their underlying latent construct is greater than the squared correlation between the focal construct and conceptually similar constructs [
43]. This will be equal to the square of the sub-dimension’s completely standardized loading on the second-order construct in the typical case where each sub-dimension is hypothesized to load on only one-second order construct; and its value should be greater than 50.
Table 2.
Confirmatory Factor Analysis (CFA) results for the constructs.
Table 2.
Confirmatory Factor Analysis (CFA) results for the constructs.
| Construct | Measurement Items | Standardized Loading | α | CR | AVE |
|---|
| Perceived usefulness (PU) | Using University Smart Card enable me to access a lot of facilities (e.g. photocopy, library loan) in my student life | 0.875 | 0.892 | 0.892 | 0.733 |
| Using University Smart Card will improve services (fast speeds) and save time | 0.870 |
| Using University Smart Card improves my student life | 0.823 |
| Perceived ease-of-use (PEU) | It is easy for me to use University Smart Card | 0.744 | 0.830 | 0.831 | 0.622 |
| It is easy to learn how to use/reload University Smart Card | 0.824 |
| It is easy to remember to bring University Smart Card with me | 0.795 |
| Environmental (EN) | Using University Smart Card means I care for the environment | 0.764 | 0.851 | 0.853 | 0.593 |
| Using University Smart Card means I am sensitive to ecological issues | 0.707 |
| Launching University Smart Card means the university cares for the environment | 0.836 |
| Launching University Smart Card means the university is sensitive to ecological issues | 0.767 |
| Attitude (AT) | I am positive about using University Smart Card | 0.854 | 0.857 | 0.863 | 0.679 |
| I think that using University Smart Card is a good idea | 0.890 |
| I want to be among the first people to try out new functions of University Smart Card | 0.718 |
| Subjective Norms (SN) | People who are influential me would think that I should use University Smart Card | 0.702 | 0.809 | 0.813 | 0.592 |
| People whose opinions are valued by me would prefer that I should use University Smart Card | 0.836 |
| Most people in my group/community use University Smart Card frequently | 0.765 |
| Intention to use (INT) | I’ll use University Smart Card on a regular basis in the future | 0.855 | 0.945 | 0.948 | 0.858 |
| I’ll frequently use University Smart Card in the future | 0.971 |
| I expect that University Smart Card will make everything easier in the future | 0.949 |
As shown in
Table 3, diagonal was AVE of constructs and the other were two dimensions of correlation coefficients. All correlation coefficients were less than AVE.; therefore, the discrimination validity was adequate.
Table 3.
Discriminant validity.
Table 3.
Discriminant validity.
| Construct | PU | PEU | ENV | AT | SN | INT |
|---|
| PU | 0.733 | | | | | |
| PEU | 0.066 | 0.622 | | | | |
| ENV | 0.063 | 0.126 | 0.593 | | | |
| AT | 0.213 | 0.106 | 0.105 | 0.679 | | |
| SN | 0.165 | 0.095 | 0.106 | 0.092 | 0.592 | |
| INT | 0.174 | 0.030 | 0.077 | 0.122 | 0.210 | 0.858 |
However, in this section, an issue is still worth a discussion, which is the correlation between PU and INT is only 0.25, and between PU and ATT it is 0.28. It is not frequent in literature on IT services or smart card adoption fields. However, after exploring the literature, the authors believed that the concept of environmental protection in relation to the University Smart card is becoming more and more popular and students are already aware of the advantages of University Smart Cards. Therefore, participants gave fairly low differentiation feedback about the perceived usefulness, attitude and intention of the University Smart Card.
4.3. Hypotheses Testing and the Research Findings
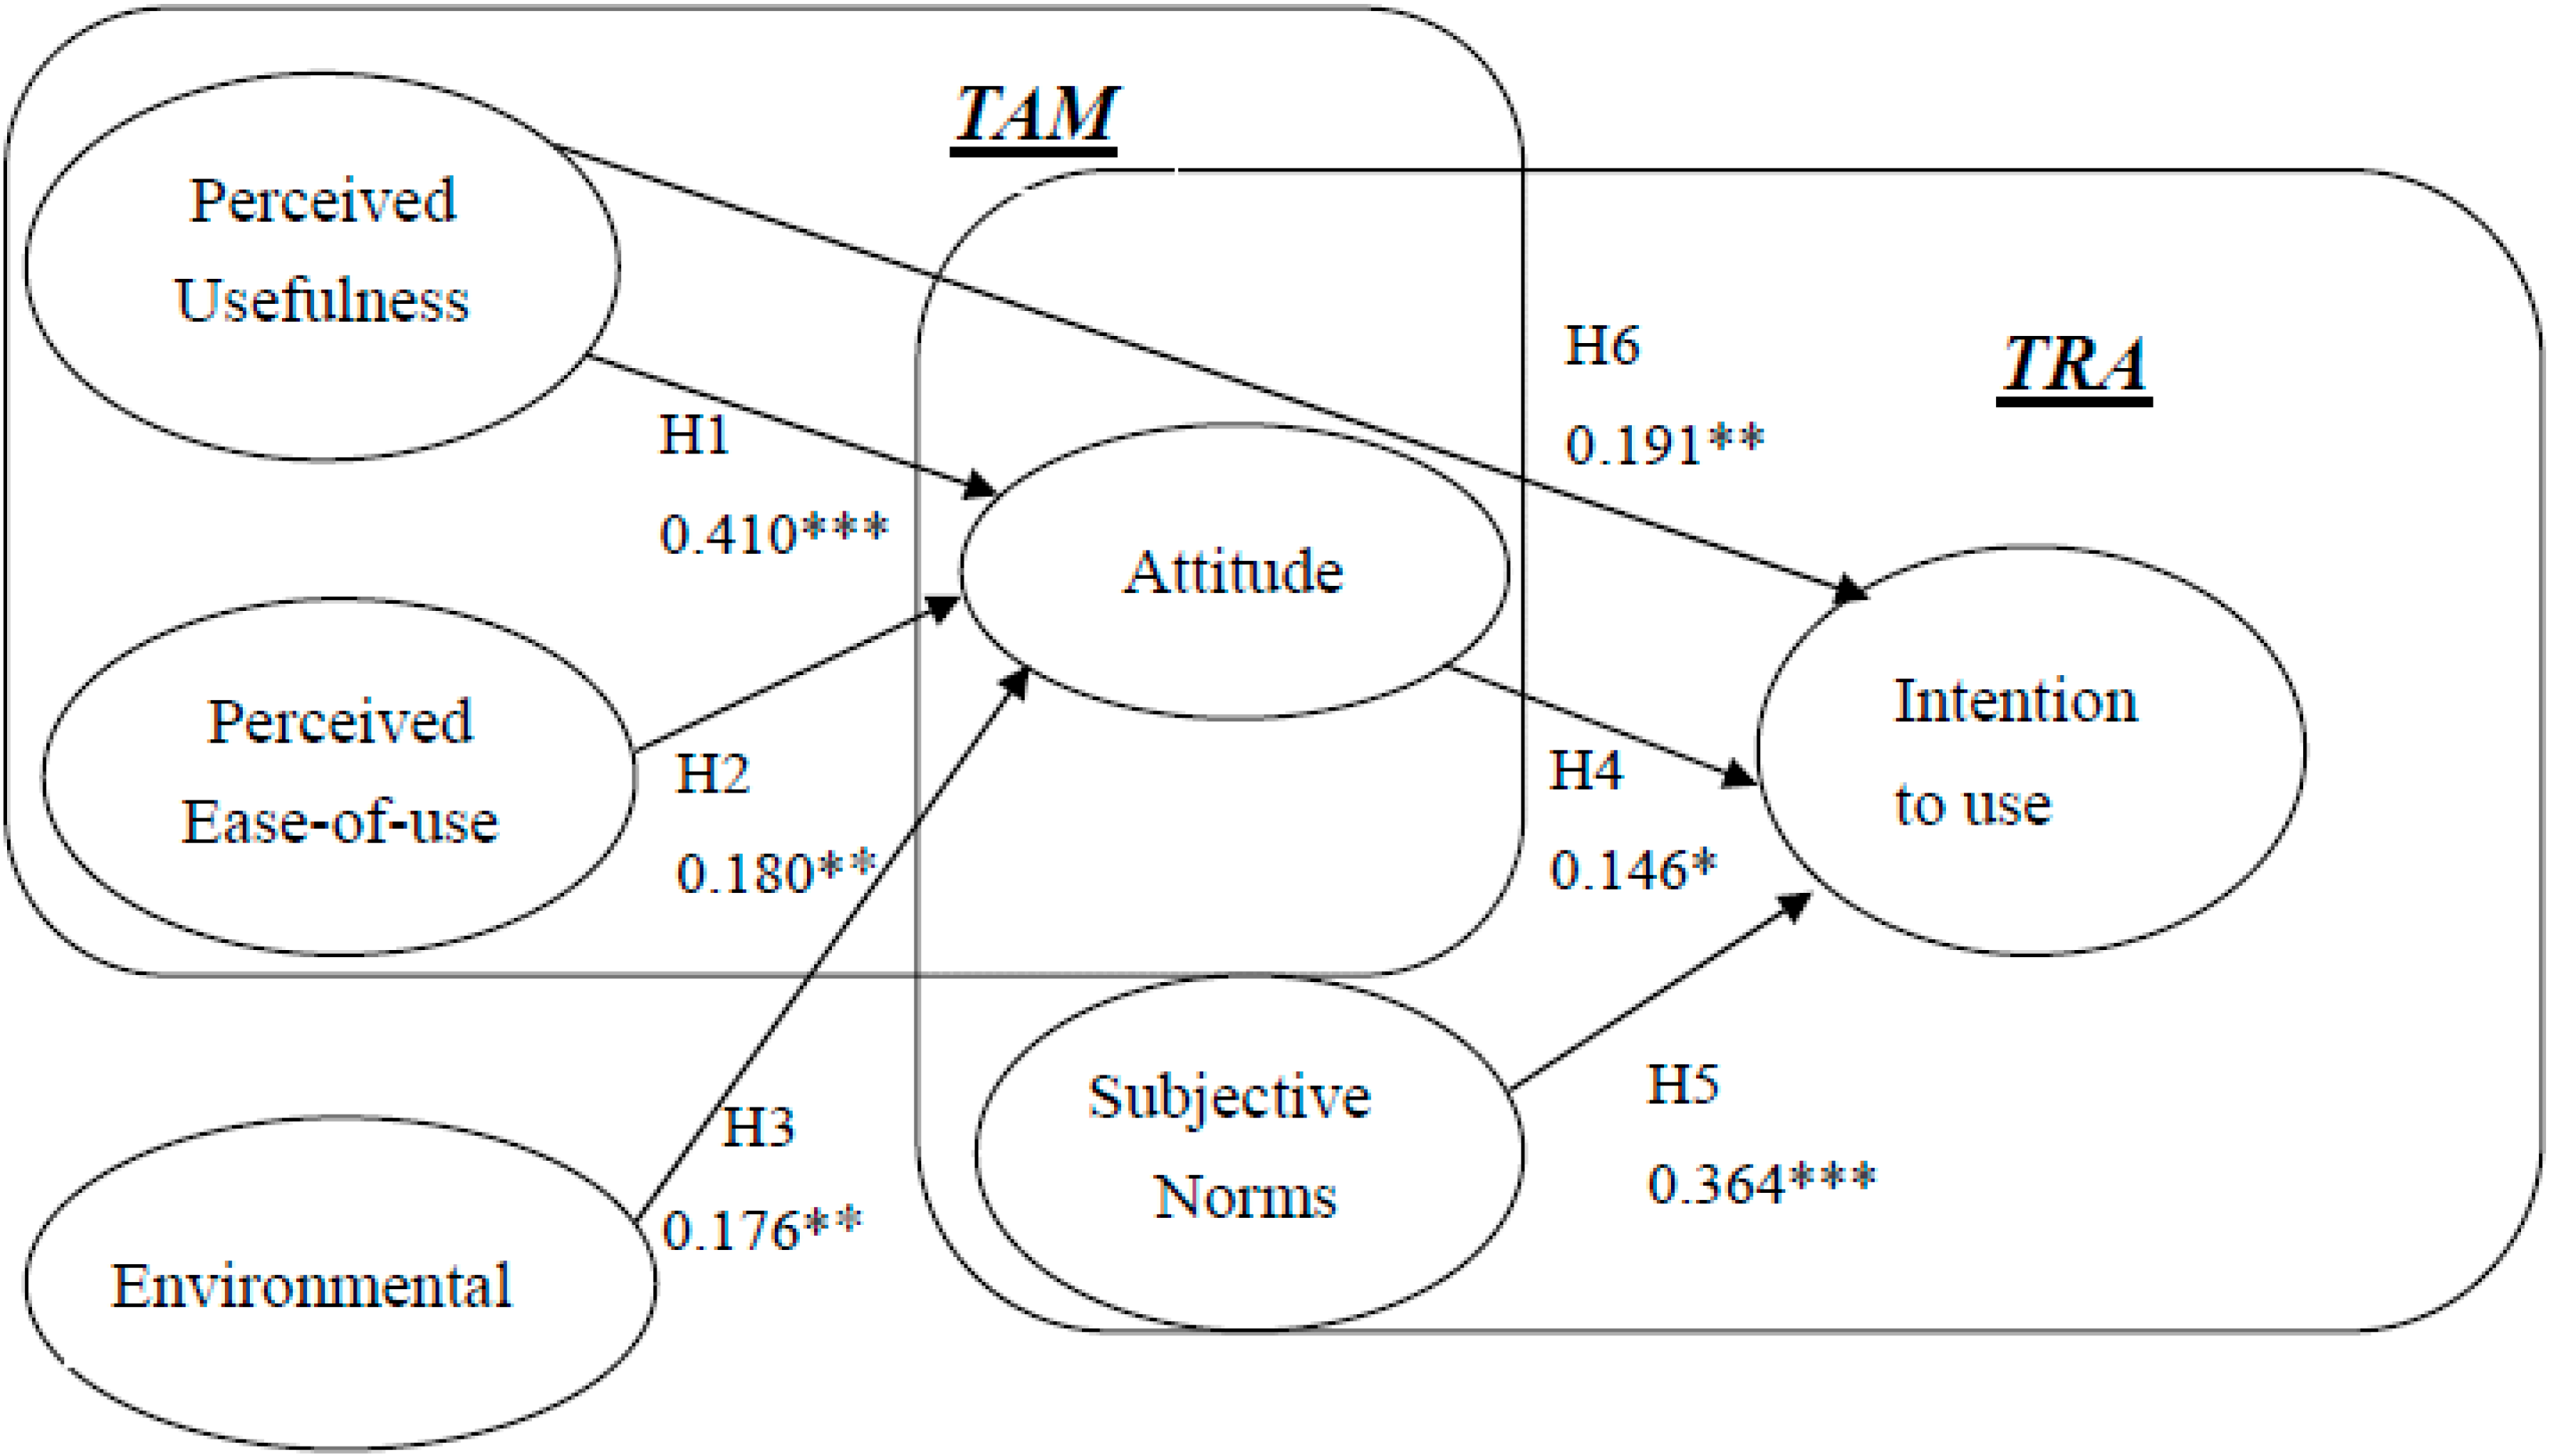
As the hypotheses testing (
Table 4) above and
Figure 2 shown below: the Statistical results supported Hypotheses 1 and 2 (H1 and H2): the perceived usefulness, and perceived ease of use are the influencing factors for University Smart Card adoption in Taiwan. These results are consistent with findings from previous studies regarding the reasons why people accept or reject new technologies, namely [
59], which proposed two determinants that are especially important among the many variables that may influence system use: perceived usefulness and perceived ease of use. In terms of environmental factors, Hypothesis 3 (H3) was accepted by the statistical analysis, which means participants in this research were willing to adopt university smart cards for the eco-protection and environmental purposes. Based on the statistical results of this study, Hypothesis 4 and Hypothesis 5 (H4 and H5) were confirmed. Ajzen & Fishbein [
23] found that intention toward a behavior is the best predictor of the actual behavior. In the context of this research on the adoption of university smartcards, behavioral intention was seen to be the best predictor for the actual implementation of the smart card system, and included two determinates: the individual’s attitude (A) toward the new application, and the individual’s subjective norm (SN). For Hypothesis 6, the results are consistent with findings from previous studies in accurately predicting the acceptance likelihood of the smartcard users: the more the perceived usefulness, the higher the intention to use. Based on the statistical results, Hypothesis 6 was confirmed. Lv [
60] noted in 2013 that the “University Smart Card” is an important part of the “digital campus”. It is useful for general consumption, identity authentication, financial services, public information services and other functions, providing powerful data for excavating various information and security. Owing to these diverse uses outlined in Lv [
60]’s research, the determination of the card’s perceived usefulness by users could greatly assist in its marketing.
Table 4.
Results of the hypotheses and the practical path.
Table 4.
Results of the hypotheses and the practical path.
| | Hypothesis | Expected Result | Standard Regression Coefficient | t-Value |
|---|
| PU → AT | H1 | + | 0.410 | 6.538 *** |
| PEU → AT | H2 | + | 0.180 | 2.687 ** |
| ENV → AT | H3 | + | 0.176 | 2.693 ** |
| AT → INT | H4 | + | 0.146 | 2.282 * |
| SN → INT | H5 | + | 0.364 | 5.255 *** |
| PU → INT | H6 | + | 0.191 | 2.715 ** |
| Fit Index | Threshold | Goodness-of-fit |
| χ2/df | <0.3 | 1.254 |
| GFI | >0.9 | 0.944 |
| AGFI | >0.8 | 0.923 |
| NFI | >0.9 | 0.952 |
| CFI | >0.9 | 0.990 |
| RMSEA | <0.08 | 0.029 |
Figure 2.
Results of the structural model analysis. Note: * p < 0.05; ** p < 0.01; *** p < 0.001.
Figure 2.
Results of the structural model analysis. Note: * p < 0.05; ** p < 0.01; *** p < 0.001.
5. Discussion and Conclusions
The purpose of this study was to propose a model that integrates TRA and IDT into a fundamental framework also incorporating environmental concern in order to explore the factors that influence students’ adoption intentions towards University Smart Cards. Specifically, TRA aims to explore students’ intended behavior towards the adoption of University Smart Cards, TAM aims to measure attitudes towards the adoption of University Smart Cards, and environmental concern is considered in order to examine its relationship with attitude as well. It was concluded that attitude and subjective norms towards university smart cards positively and significantly affect their usage intentions. Meanwhile, the two characteristics of TAM (i.e., usefulness and ease-of-use) incorporating environmental concern all positively and significantly affected attitude towards the adoption of University Smart Cards. The concept of the University Smart Card is still new for Taiwanese students and the results gained from this study offer important contributions and implications for both academia and practitioners.
Firstly, the results of this study have demonstrated the value and the feasibility of University Smart Card adoption for university students in Taiwan. The technology acceptance model (TAM) of Davis in this study also revealed the importance of the attitudes toward smart card adoption and usage intension in terms of potential users’ perceptions of attributes of the University Smart Card.
Subsequently, this study proposed a unique model to explore students’ intended behavior towards the adoption of University Smart Cards by TRA and then measured attitude towards the adoption of University Smart Cards via TAM and factoring in environmental concern. The findings from the sections of TRA and TAM are consistent with previous studies that show a positive and significant relationship across a wide variety of domains.
Thirdly, based on the research findings from the data analysis, the perceived usefulness and subjective norm of the University Smart Card system have the most significant predictive power on potential users’ attitudes and intentions of adopting the card. One of the key findings is that at this stage, the University Smart Card is still seen as the student ID card by students, as there are still very few suitable sites for its “Smart” function; in other word, it has not yet become a critical part of student life. In addition, the present research was conducted in Taiwan and there may be some cultural issue related to the subjective norm (SN). Based on [
61] cultural dimensions, the Taiwanese culture are known to be more collective than individualistic. Therefore, it may be said that subjective norm has the most significant predictive power on intentions.
Therefore, students have not experienced its innovative functions and did not see it as an innovative new product. However, there is still opportunity to develop this new product, as in line with the findings of this research, when students have the behavioral intention to use University Smart Cards, there is a positive trend that they would use it. However, there are a few universities already developing smart phone Apps to make university service functions smarter, and the authors believe the smartcard can be combined with the smartphone Apps in the very near future. Therefore, it is strongly suggested to conduct a questionnaire in six months for further re-examining students’ PU and PEU to intention to use and innovation issues in relation to students’ actual use in order to obtain more accurate results.
Additionally, the concept of environmental concern is rarely mentioned within this topic in previous literature. The findings of this study indicated that environmental concern has a positive effect on the attitude towards university smart cards. Therefore, environmental sustainability plays a role in the adoption of smart card technology at universities in Taiwan. This result could be viewed as a benchmark for future research.
Finally, the study has some limitations that should be noted for further research. First, this research used samples from three of eight Colleges in Feng Chia University. The results from this sample might be different from other Colleges or Universities. Secondly, a longitudinal approach is suggested as this study was conducted with a snapshot research approach. Thirdly, respondents in this study were already adopters of the university smart card. A study on continued use, specifically considering its antecedents, e.g., satisfaction [
62], could be better-explained with continuance intentions. Finally, the use of the proposed research framework could be altered (e.g., a possible interaction effect between EC and SN) in order to re-examine the trend of behavioral intentions.
Acknowledgments
On behalf of the research team, Ching-Wei Ho and I, we would like to thank the reviewers for their valuable comments.
Author Contributions
Conception and design: Ching-Wei Ho and Yu-Bing Wan.
Analysis and interpretation: Ching-Wei Ho, Yu-Bing Wang, and Neil Y. Yen.
Data collection: Ching-Wei Ho and Neil Y. Yen.
Writing the article: Ching-Wei Ho and Yu-Bing Wang.
Critical revision of the article: Ching-Wei Ho and Yu-Bing Wang.
Statistical analysis: Ching-Wei Ho and Yu-Bing Wang.
Conflicts of Interest
The authors declare that they have no competing interests.
References
- Davis, D. Card Technology magazine. Available online: http://www.mondotimes.com/2/topics/5/20/6873 (assessed on 10 August 2015).
- Funck, G. Armed with the basics. Am. School Univ. 1999, 72, 38–44. [Google Scholar]
- Robinson, B. It is too late for smart cards? Informationweek 2001, 829, 81–84. [Google Scholar]
- Farrell, J.J., III. Smartcards become an international technology. In Proceedings of the 13th TRON Project International Symposium, Tokyo, Japan, 4–7 December 1996; IEEE Computer Society: Washington, DC, USA, 1996; pp. 134–140. [Google Scholar]
- Turban, E.; McElroy, D. Using smart cards in electronic commerce. In Proceedings of the Annual Hawaii International Conference on System Sciences, Kohala Coast, HI, USA, 6–9 January 1998; pp. 62–69.
- Bimm, P. University tests smart card technology. Comput. Deal. News 1999, 15, 31. [Google Scholar]
- Everett, D. Cowry shell to smart card. IEE Rev. 1997, 43, 59–62. [Google Scholar] [CrossRef]
- Dishaw, M.; Strong, D. Extending the technology acceptance model with Task-Technology Fit constructs. Inf. Manag. 1999, 36, 9–21. [Google Scholar] [CrossRef]
- Hsu, C.L.; Lu, H.P. Why do people play on-line games? An extended TAM with social influences and flow experience. Inf. Manag. 2004, 41, 853–868. [Google Scholar] [CrossRef]
- Mohamad, L.; Rosll, K.; Ahml, A. Awareness and adoption of university smart card: The case of UUM. J. Adv. Sci. Arts 2011, 2, 40–55. [Google Scholar]
- Bull, B. Getting Smarter? Progress. Grocer 1999, 78, 131–132. [Google Scholar]
- Leng, A.B. E-Commerce Card Capers. Available online: http://www.cio-asia.com/pcio.nsf/6eabcc3aca096d5448256b1700395a48?OpenForm&ParentUNID=54477A31DF640BC248256B4100355169 (accessed on 15 June 2015).
- Fowler, D.C.; Swatman, P.M.C.; Welikala, J. Issues Affecting the Implementation of Multiple Application Smart Card Systems. In Proceedings of the “CollECTeR USA”—4th CollECTeR Conference on Electronic Commerce, Breckenridge, CO, USA, 11 April 2000.
- Nakamura, T.; Inenaga, S.; Ikeda, D. An Identifiable Yet unlinkable Authentication System with Smart Cards for Multiple Services. Available online: http://str.i.kyushu-u.ac.jp/~inenaga/papers/ICCSA2010.pdf (accessed on 10 August 2015).
- Welikala, J.; Fowler, D.C.; Swatman, P.M.C. Introducing Multi-purpose, Multifunction Smart Cards to Australian Universities. In Proceedings of the “CollECTeR’97”—1st Annual CollECTeR Workshop on Electronic Commerce, Adelaide, Australia, 3 October 1997; pp. 104–112.
- Chadwick, D. Smart cards aren’t always the smart choice. Computer 1999, 32, 142–143. [Google Scholar] [CrossRef]
- Husemann, D. The smart card: Don’t leave home without it. IEEE Concurr. 1999, 7, 24–27. [Google Scholar] [CrossRef]
- Zalud, B. New smart cards, but still old door controls. Security 2000, 37, 65. [Google Scholar]
- Lambrinoudakis, C. Smart card technology for deploying a secure information management framework. Inf. Manag. Comput. Secur. 2000, 8, 173–183. [Google Scholar] [CrossRef]
- Smart Card Solutions for Higher Education—Helping Universities Maximize the Value of Their “One Card” Solution. Available online: http://nodaccess.com/wp-content/uploads/2014/08/hid-smart-card-higher-ed-wp-en-1.pdf (assessed on 10 July 2015).
- Burbridge, L. Experience with the Use of a Multi-Purpose Smart Card (No. 019); University of Exeter: Exeter, UK, 1998. [Google Scholar]
- Davis, F.D.; Bagozzi, R.P.; Warshaw, P.R. User acceptance of computer technology: A comparison of two theoretical models. Manag. Sci. 1989, 35, 982–1003. [Google Scholar] [CrossRef]
- Ajzen, I.; Fishbein, M. Understanding Attitudes and Predicting Social Behavior; Prentice-Hall: Englewood Cliffs, NJ, USA, 1980. [Google Scholar]
- Gefen, D.; Straub, D.W. Gender difference in the perception and use of e-mail: An extension to the technology acceptance model. MIS Q. 1997, 2, 389–400. [Google Scholar] [CrossRef]
- Gefen, D.; Straub, D.W. The relative importance of perceived ease of use in IS adoption: A study of e-commerce adoption. J. Assoc. Inf. Syst. 2000, 1, 1–28. [Google Scholar]
- Igbaria, M.; Zinatelli, N.; Cragg, P.; Cavaye, L.M. Personal computing Acceptance factors in small firms: A structural equation model. MIS Q. 1997, 21, 279–302. [Google Scholar] [CrossRef]
- Ong, C.-S.; Lai, J.-Y.; Wang, Y.-S. Factors affecting engineers’ acceptance of asynchronous e-learning systems in high-tech companies. Inf. Manag. 2004, 41, 795–804. [Google Scholar] [CrossRef]
- Venkatesh, V.; Davis, F.D. A theoretical extension of the technology acceptance model: Four longitudinal field studies. Manag. Sci. 2000, 46, 186–204. [Google Scholar] [CrossRef]
- Venkatesh, V.; Morris, M.G.; Davis, G.B.; Davis, F.D. User acceptance of information technology: Toward a unified view. MIS Q. 2003, 27, 425–478. [Google Scholar]
- Igbaria, M.; Guimaraes, T.; Davis, G.B. Testing the determinants of microcomputer usage via a structural equation model. J. Manag. Inf. Syst. 1995, 11, 87–114. [Google Scholar]
- Green University Initiative Committee at NTNU Green University. Available online: http://greenuni.ntnu.edu.tw/en_about01.html (accessed on 15 June 2015).
- Perrini, F.; Vurro, C.; Constanzo, L.A. A process-based view of social entrepreneurship: From opportunity identification to scaling-up social change in the case of San Patrignano. Entrep. Reg. Dev. 2010, 22, 515–534. [Google Scholar] [CrossRef]
- Fishbein, M.; Ajzen, I. Belief, Attitude, Intention and Behavior: An Introduction to Theory and Research; Addison-Wesley: Boston, PA, USA, 1975. [Google Scholar]
- Sanchez, R.A.; Hueros, A.D. Motivational factors that influence the acceptance of Moodle using TAM. Comput. Hum. Behav. 2010, 26, 1632–1640. [Google Scholar] [CrossRef]
- Lee, M.C. Factors influencing the adoption of internet banking: An integration of TAM and TPB with perceived risk and perceived benefit. Electron. Commer. Res. Appl. 2009, 8, 130–141. [Google Scholar] [CrossRef]
- Harrison, D.A.; Mykytyn, P.P., Jr.; Riemenschneider, C.K. Executive Decisions about Adoption of Information Technology in Small Business: Theory and Empirical Tests. Inf. Syst. Res. 1997, 8, 171–195. [Google Scholar] [CrossRef]
- Klobas, J.E. Beyond information Quality: Fitness for purpose and electronic information resource use. J. Inf. Sci. 1995, 21, 95–114. [Google Scholar] [CrossRef]
- Lynne, G.D.; Casey, C.F.; Hodges, A.; Rahmani, H. Conservation Technology Adoption Decisions and the Theory of Planned Behavior. J. Econ. Res. 1995, 16, 581–598. [Google Scholar] [CrossRef]
- Mathieson, K. Predicting User Intentions: Comparing the Technology Acceptance Model with the Theory of Planned Behavior. Inf. Syst. Res. 1991, 2, 173–191. [Google Scholar] [CrossRef]
- Taylor, S.; Todd, P.A. Decomposition and Cross Effects in the Theory of Planned Behavior: A Study of Consumer Adoption Intentions. Intl J. Res. Mark. 1995, 12, 137–155. [Google Scholar] [CrossRef]
- Taylor, S.; Todd, P.A. Understanding Information Technology Usage: A Test of Competing Models. Inf. Syst. Res. 1995, 6, 144–177. [Google Scholar] [CrossRef]
- Yu, J.; Ha, I.; Choi, M.; Rho, J. Extending the TAM for a t-commerce. Inf. Manag. 2004, 42, 965–976. [Google Scholar] [CrossRef]
- Davis, F.D. Perceived Usefulness, Perceived Ease of Use, and User Acceptance of Information Technology. MIS Q. 1989, 13, 319–340. [Google Scholar] [CrossRef]
- GUUT List of Member. Available online: http://www.guut.org.tw/about_people.php (accessed on 15 June 2015). (In Chinese)
- Moon, J.W.; Kim, Y.G. Extending the TAM for a world-wide web context. Inf. Manag. 2001, 38, 217–230. [Google Scholar] [CrossRef]
- Perrini, F.; Castaldo, S.; Misani, N.; Tencati, A. The impact of corporate social responsibility associations on trust in organic products marketed by mainstream retailers: A study of Italian consumers. Bus. Strategy Environ. 2010, 19, 512–526. [Google Scholar] [CrossRef]
- Lopez-Nicolas, C.; Molina-Castillo, F.J.; Bouwman, H. An assessment of advanced model services acceptance: Contributions from TAM and diffusion theory models. Inf. Manag. 2008, 45, 359–364. [Google Scholar] [CrossRef]
- Mandhachitara, R.; Poolthong, Y. A model of customer loyalty and corporate social responsibility. J. Serv. Mark. 2011, 25, 122–133. [Google Scholar] [CrossRef]
- Wu, I.L.; Chen, J.L. An extension of trust and TAM model with TPB in the initial adoption of on-line tax: An empirical study. Intl J. Hum. Comput. Stud. 2005, 62, 784–808. [Google Scholar] [CrossRef]
- Ministry of Education (Taiwan) Statistical Summaries. 2014. Available online: http://www.edu.tw/pages/detail.aspx?Node=3752&Page=26208&Index=7&WID=31d75a44-efff-4c44-a075–15a9eb7aecdf (accessed on 2 July 2015). (In Chinese)
- Hair, J.F.; Hult, G.T.M.; Ringle, C.M.; Sarstedt, M. A Primer on Partial Least Squares Structural Equation Modeling (PLS-SEM); Sage: Thousand Oaks, CA, USA, 2013. [Google Scholar]
- Hair, J.; Black, B.; Babin, B.; Anderson, R.; Tatham, R. Multivariate Data Analysis, 6th ed.; Prentice-Hall: Upper Saddle River, NJ, USA, 2006. [Google Scholar]
- Arbuckle, J.L. AMOS 6.0 User’s Guide; Amos Development Corporation: Endicott, NY, USA, 2005. [Google Scholar]
- Fornell, C.; Larcker, D.F. Evaluating Structural Equation Models with Unobservable Variables and Measurement Error. J. Mark. Res. 1981, 18, 39–50. [Google Scholar] [CrossRef]
- Hair, J.F., Jr.; Anderson, R.E.; Tatham, R.L.; Black, W.C. Multivariate Data Analysis, 5th ed.; Prentice-Hall: Englewood Cliffs, NJ, USA, 1998. [Google Scholar]
- Hair, J.F. Multivariate Data Analysis, 7th ed.; Prentice Hall: Upper Saddle River, NJ, USA, 2009. [Google Scholar]
- Bagozzi, R.P.; Yi, Y. On the Evaluation of Structural Equation Models. J. Acad. Mark. Sci. 1988, 16, 74–94. [Google Scholar] [CrossRef]
- Bhattacherjee, A.; Premkumar, G. Understanding changes in belief and attitude toward information technology usage: A theoretical model and longitudinal test. MIS Q. 2004, 28, 351–370. [Google Scholar]
- Rogers, E.M. Diffusion of Innovations, 3rd ed.; Free Press: New York, NY, USA, 1983. [Google Scholar]
- Lv, W.C. Design of Campus Smart Card System. Appl. Mech. Mater. 2013, 347–350, 3915–3918. [Google Scholar] [CrossRef]
- Hofstede, G. Culture’s Consequences: Comparing Values, Behaviors, Institutions, and Organizations across Nations, 2nd ed.; SAGE Publications: Thousand Oaks, CA, USA, 2001. [Google Scholar]
- Bhattacherjee, A. Understanding information systems continuance: An expectation-confirmation model. MIS Q. 2001, 25, 351–370. [Google Scholar] [CrossRef]
© 2015 by the authors; licensee MDPI, Basel, Switzerland. This article is an open access article distributed under the terms and conditions of the Creative Commons Attribution license (http://creativecommons.org/licenses/by/4.0/).


