1. Introduction
Moving towards sustainable economies puts pressure on countries to meet the targeted objectives. In the European Union, a great effort is being made to quantify the overall effects of this transition process to a green energy-based, low-carbon economy.
From the continuous commitment and concern of the European Commission of this transition process, the 2030 climate and energy framework was presented in January 2014, a communication that set out a framework for EU climate and energy policies for the 2020–2030 period. The framework is intended to launch discussions on how to give these policies continuity to the end of the current 2020 framework.
The 2030 framework proposes new targets and measures to make the EU’s economy and energy system more competitive, secure, and sustainable. It includes targets for reducing greenhouse gas emissions and for increasing the use of renewable energies. It proposes a new governance system and performance indicators. In particular, it proposes improved energy efficiency via possible amendments to the energy efficiency directive.
European guidelines and energy efficiency investment objectives are based on the work of subject matter experts. Thus, in this context of the transition towards a low-carbon economy, methodologies and studies such as the one we present in this work are desirable. We are facing the need to carry out reasonable planning of the use of resources in accordance with the energy savings required to meet the targets.
If we are to bring European Union targets to real economies, it would be of great help to be able to count on analytic tools to assess and quantify the investment effort required by the Spanish production system. Such an approach provides a valuable insight into the cross-nature of energy efficiency through a multisector economic model. Firstly, we will consider the effects of the investments required to achieve energy efficiency targets, in terms of both production and employment effects. Improvements in energy efficiency will lead to energy consumption savings, and such savings will be quantified taking into account that electricity demand is expected to fall. In addition, the overall scale of the impact will be weighted.
The input–output analysis gives a deep insight into the socio-economic framework of a certain region or economy. Through the application of an input–output model, the intersectoral linkages of the economy, within a mathematical framework, are disentangled. This way, the effects of a demand-side shock, such as increasing investments or lowering demand for certain goods and services, can be assessed. This kind of analytic method is useful when estimating the socio-economic effects of programs prior to their implementation. Therefore, it can be considered a powerful prospective tool given that it provides all types of agents involved in the matter, either policy makers or energy planners, with useful information.
This paper is organized as follows. In the next section, a brief review of some of the more recent debates on energy efficiency will be provided. Thereafter, the input–output methodology will be presented and interpreted through the use of the field of influence. Then, the database is presented and the major empirical application will occur: here, a mathematically founded analysis of energy efficiency improvements for a more sustainable Spanish economy will be made clear in reference to a set of tables containing simulation results. The paper concludes with some policy implications in light of the results.
2. Literature Review
There is a lengthy body of literature on the input–output methodology that provides a strong theoretical background to the model constructed and developed in this work. Leontief’s inverse matrix notions have been the objects of widespread application and significant scientific research contributions. Since the input–output approach is a methodology with a strong foundation, in this paper, the focus will begin with a more recent exchange centering on combining both the theoretical foundations and the empirical application that, to the best of the authors’ knowledge, has not been developed yet for such an analysis. Essentially, the concern of the present paper is to direct attention to an alternative perspective on the measurement of energy improvement investment impacts. The macro-economic approach of this economic study focuses on three major issues, as part of the overview analysis, which are productivity, employment, and CO2 emission impacts. By taking into account the fact that energy is strategic for the economy and society, a thorough knowledge about the possible impacts that energy-related investments would have over time is essential for meeting the economic and social challenges regarding energy.
The residential building sector is a major driver of current and future energy consumption and associated emissions, which can be potentially mitigated through significant energy-efficiency improvements in both emerging and developed countries. Yet there are several persistent barriers that hinder the attainment of energy-efficiency improvements in this area. Ramos et al. (2015) [
1] use data from a 2008 national representative survey of Spanish households, their paper is interested in the determinants of energy-efficiency-related decisions. In particular, a discrete-choice model empirically analyzes whether pro-environmental households are more likely to invest in energy-efficiency and to adopt daily energy-saving habits. They show that households with eco-friendly behaviors are more likely to invest in well-differentiated energy-efficiency measures as well as to steer daily habits towards energy savings. However, no effects were found for households with environmental attitudes based on a stated willingness to pay to protect the environment.
López-Peña et al. (2012) [
2] concluded that energy efficiency is cheaper than renewables for reducing carbon emissions. They state that energy efficiency measures could have saved more than €5 billion per year in Spain, and savings could have reached higher levels, avoiding overcapacity in gas combined cycles.
To Backlunda et al. (2012) [
3], the discrepancy between optimal and actual implementation of energy efficient technologies has been illustrated in numerous articles and is often referred to as the energy efficiency gap. However, efficient technologies are not the only way to increase energy efficiency. Empirical studies have found that a cost-effective way to improve energy efficiency is to combine investments in energy-efficient technologies with continuous energy management practices.
According to data from the European Commission [
4], by using energy more efficiently, Europeans can lower their energy bills, reduce their reliance on external suppliers of oil and gas, and help protect the environment. Energy efficiency has to be increased at all stages of the energy chain from generation to final consumption. At the same time, the benefits of energy efficiency must outweigh the costs, such as those involved in renovations. Therefore, measures promoted by the European Union focus on sectors where the savings potential is greatest, such as those linked to a building’s efficiency. According to the Energy Efficiency Communication dated July 2014 [
5], the European Union is expected to achieve energy savings of 18%–19% by 2020—missing the 20% target by 1%–2%. However, if European Union countries would implement all of the existing legislation on energy efficiency, the 20% target could be reached without additional measures.
To Ryan and Campbell (2012) [
6], improving energy efficiency can deliver a range of benefits to the economy and society as a whole. However, energy efficiency programs are often evaluated only on the basis of the energy savings they deliver. As a result, the full value of energy efficiency improvements in both national and global economies may be significantly underestimated. This also means that energy efficiency policies may not be optimized to reach the potential of the full range of possible outcomes. Moreover, when the merit of energy efficiency programs is judged solely on reductions in energy demand, programs are susceptible to criticisms related to the rebound effect when the energy savings are less than expected due to other welfare gains.
In line with this idea about the rebound effect, there is an ongoing debate now. Sorrell and Dimitropoulos (2007) [
7] state that the economy-wide rebound effect from energy efficiency improvements may be expected to be larger than the direct rebound effect. Their report on energy productivity and economic growth points towards a potential “backfire” effect. This could be the result of an overall increase in energy consumption due to energy efficiency improvements. However, the mechanisms involved are complex, interdependent, and difficult to conceptualize, and the magnitude of this effect is extremely difficult to estimate empirically. These authors reviewed a wide range of specialized literature in their report and found very few studies providing quantitative estimates for the size of the economy-wide rebound effect. Indeed, the great majority of the studies make no reference to the rebound effect at all and instead provide “suggestive” evidence on issues such as the importance of energy in economic growth.
The Khazzoom–Brookes postulate states that, although energy efficiency improvements are economically justified at the microlevel, they lead to higher levels of energy consumption at the macrolevel. Nevertheless, for this idea to gain widespread acceptance, it would require strong supporting evidence. Therefore, the main conclusion from Sorrell and Dimitropoulos (2007) review in relation to the rebound effect is that such evidence does not exist. The theoretical and empirical evidence cited in favor of the postulate is suggestive rather than definitive, only indirectly relevant to the rebound effect and flawed in a number of respects.
Furthermore, EEFIG (Energy Efficiency Financial Institutions Group) [
8] develops the following actions and recommendations for policy makers and participant markets sorted out by activity sectors: it identifies a very strong economic, social, and competitive rationale for the up-scaling of energy efficiency investments in buildings and industry in the EU; it sees a strong economic opportunity that is deliverable by boosting both the drivers of demand for and supply of energy efficiency investments in buildings and industry sub-segments.
While there is no single solution, EEFIG identifies a framework of cross-cutting measures as well as individual requirements to support investments for each market segment. It notes national differences especially in low income countries; in its analysis of the different tools and approaches, EEFIG identifies those which can be led by market stakeholders and those which must be policy-led. Both require working in parallel to deliver the targeted increase in energy efficiency investments.
Within this international context, when having a look at the measures taken in Spain, to enhance energy efficiency, it is observed that they are scarce, and the general public is barely aware of them. This fact makes studies like the one we develop here interesting because the focus is placed on the positive impact that the required energy efficiency investments would have on society as a whole, due to the benefits of economic activity and to the savings in energy consumption.
Furthermore, the objectives targeted in the European Union context are leading Spain’s decisions on energy efficiency matters. In October 2014, European Union leaders agreed on a 2030 policy framework [
9] to make the European Union’s economy and energy system more competitive, secure, and sustainable. The framework presented aims to build a competitive and secure energy system that ensures affordable energy for all consumers, increases the security of the EU’s energy supplies, reduces our dependence on energy imports, and creates new opportunities for growth and jobs. (European Commission, 2030 framework for climate and energy policies). Among their objectives it is to increase energy efficiency by at least 27% compared with the business-as-usual scenario; however, this EU level target will be reviewed by 2020 for a mid-term 30% target. Priority sectors will be proposed by the Commission so that the EU and the Member States would focus their regulatory and financial efforts on them.
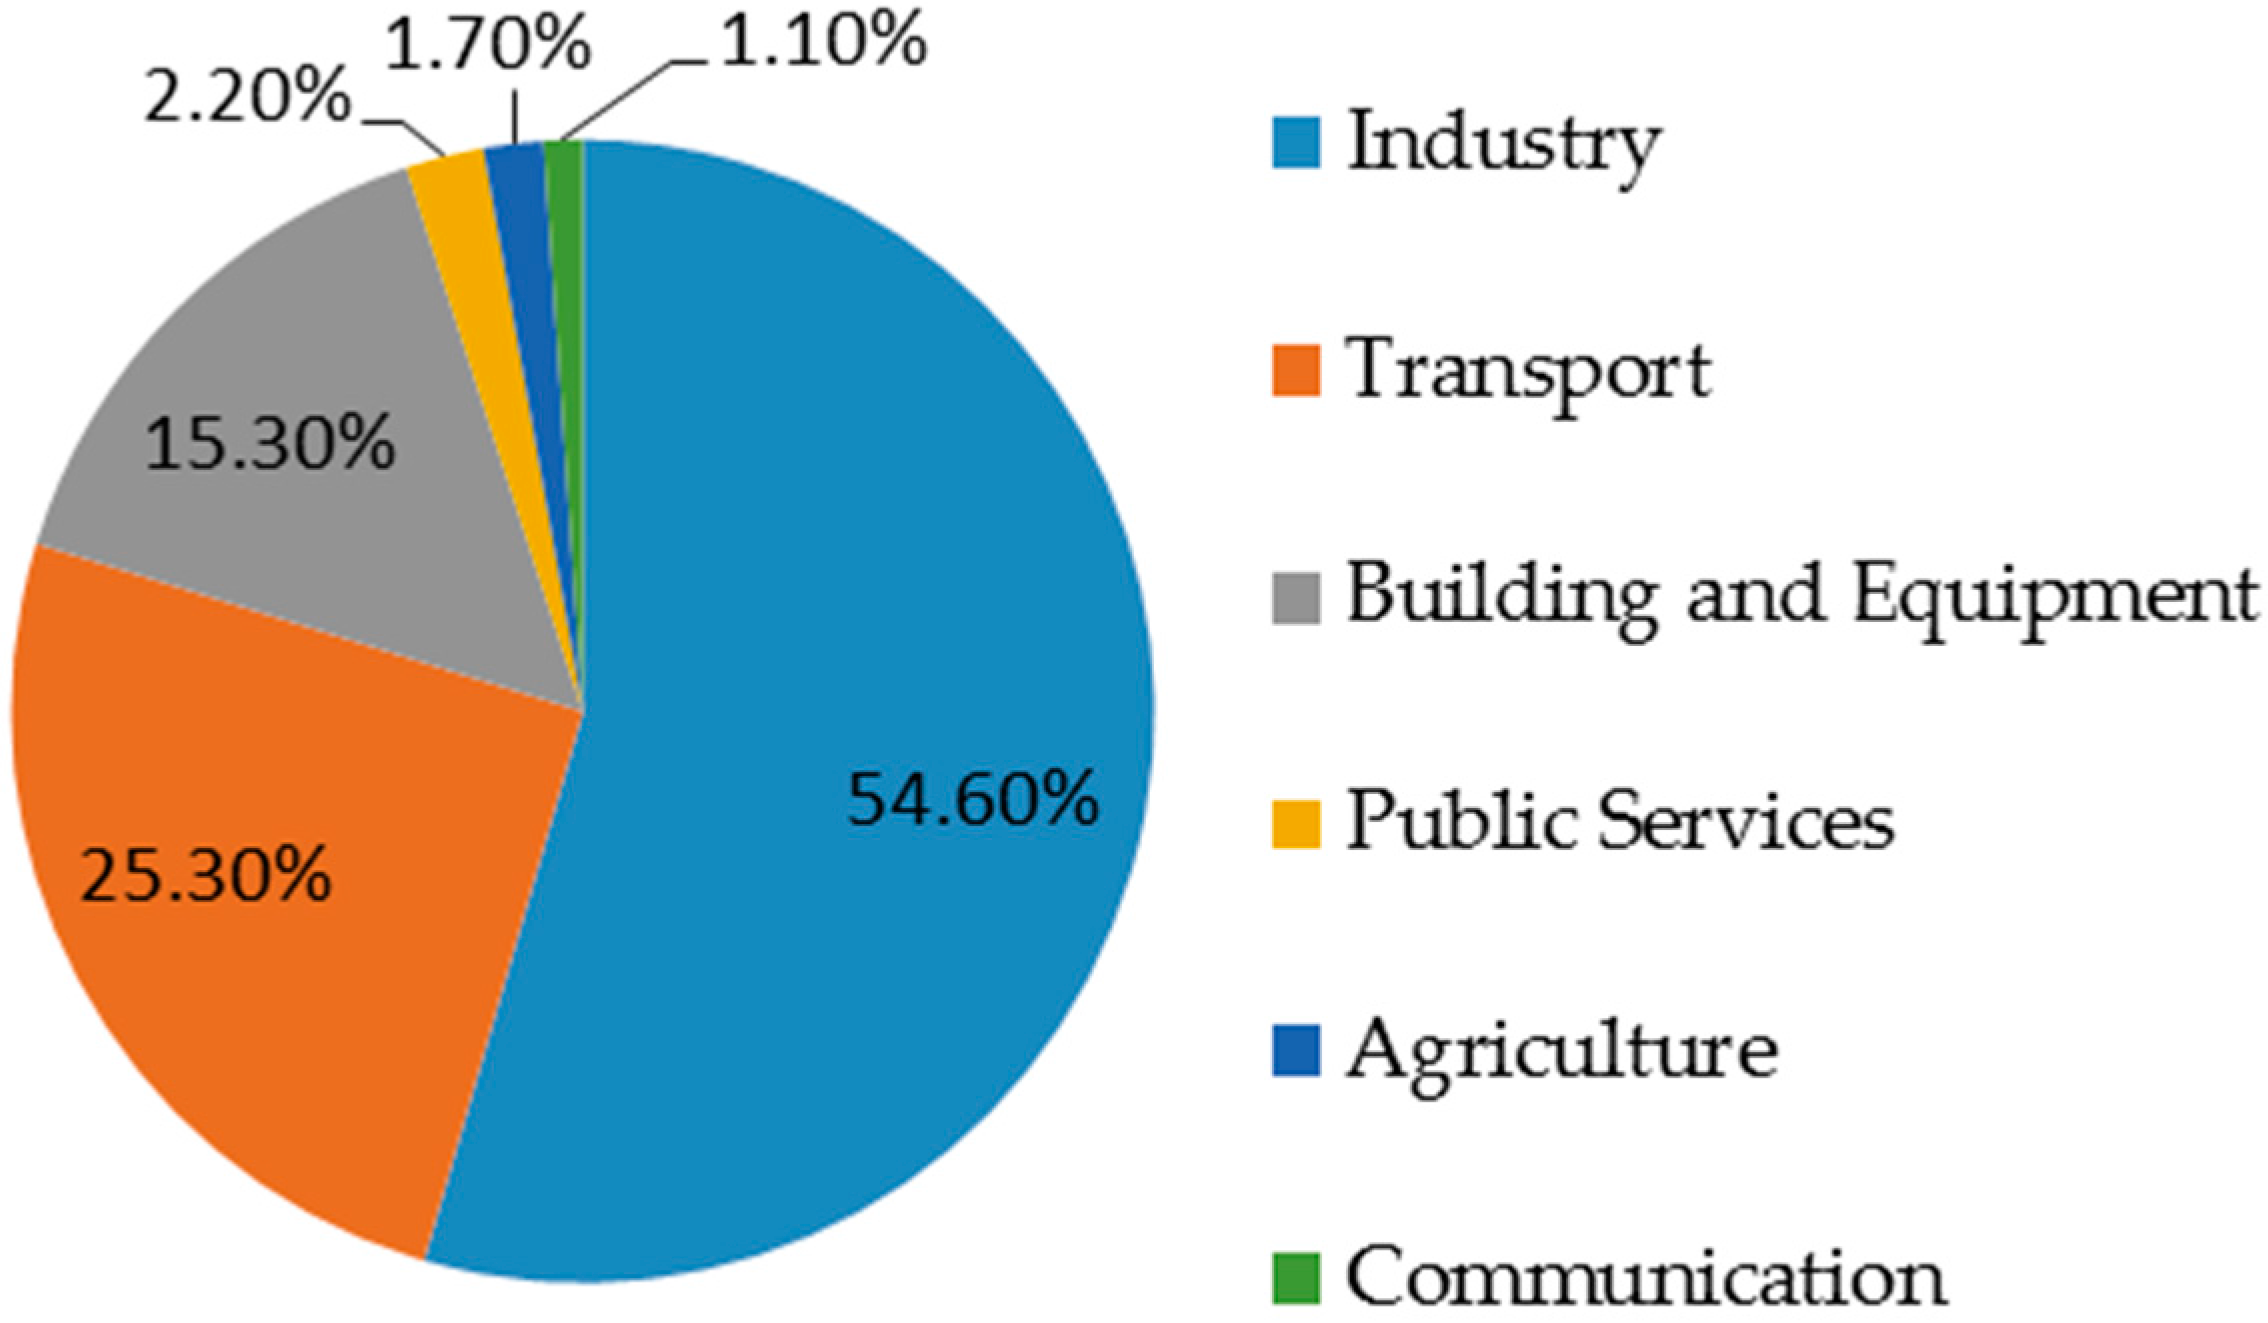
In this context, the Spanish energy situation is characterized by a high energy dependence, a high level of greenhouse gas emissions, and an intensity of energy consumption that is greater than the European average. In Spain, the National Energy Efficiency Action Plan 2014–2020 (NEEAP) [
10] was elaborated in 2014. In this plan, there were several established national energy efficiency targets and a final report with the results.
This plan mainly involves six activity sectors whose relative weight over the total is shown in
Figure 1. Below it can be observed that Industry, Transport, and Building and Equipment sectors concentrate most of the investment shock.
3. Methodology
By using the input–output methodology, this article measures how the growth of energy efficiency would affect the economy, employment, and energy savings in different sectors, from the perspective of the 2030 target.
The input–output analysis is a tool that has been largely applied in related literature, and its foundations have been deeply studied by Miller and Blair (2009) [
11] and Lahr et al. (2001) [
12]. Ansuategui et al. (2015) [
13] have explored the economic perspective for green energy and efficiency. The application of the input–output methodology developed in this work enables us to assess and evaluate the economic impact of some sectors on others and provides detailed information on the variation of an important number of macroeconomic variables, such as gross domestic product, employment, and CO
2 emissions. The database has been put together using the input–output tables (hereinafter referred to as “IOT”) published by the National Statistics Institute [
14], where 2012 is the baseline year and it is presented in
Appendix A. Furthermore, the energy efficiency sector has been subdivided into eight sectors.
The 2012 baseline year used as the reference was the most recent year for which all required data were available for the development of the IOT at the time of carrying out the work. We believe that the time lag of four years with relation to the year of simulation is not significant, given the macroeconomic data of the Spanish economy have not substantially changed over this time period.
The model used is of a linear multi-sector type in which productive sectors are expressed as lineal functions of the demand vector. Thus, the total output of any sector can be expressed as the sum of the transactions within other sectors and the transactions over the final demand. We thus obtain the following matrix equation:
where
is the matrix of order
(
m being the number of productive sectors) that contains the final demand,
is the matrix of order
formed by the total output of the sectors, and
is an
order square matrix containing the average spending propensities of the productive sectors.
We solve the previous matrix equation so as to yield the mathematical expression for
, the total output of each productive sector, resulting in
where the expression
is the so-called Leontief inverse matrix.
This matrix contains the linear model multipliers, which are denoted by
. Each of these elements shows the change in the level of output of the account
if the sector
receives an additional monetary unity of output from final demand. The resultant vector
is the matrix where each component indicates the extent to which an exogenous injection into the system affects the total income of the sectors. The expression
, which is the Leontief inverse matrix, includes all the linear effects activated throughout the production chain when there is a variation of final demand. A shift in final demand for a given sector will generate an increase on its production in order to satisfy its new level. Simultaneously, that sector will buy more input from the rest, and these transmission effects will spread on the overall economy until a new equilibrium is reached. Given this effect is known as the multiplier effect, any variation of a sector’s income will derive in an output vector variation, yielding
For simulation purposes, energy efficiency investments have been quantified in light of real economic data. Since investment is a component of aggregate demand, a variation on it (in this case an investment shift) has been mathematically introduced in the new demand vector, reading . This way, the demand-side shock is introduced into the economic structure. Each selected sector would receive a monetary injection according to the necessary investment for its development. The mathematical problem is then solved by using matrix equations and the new production levels after the shock are shown in the next section.
In a similar way, the input–output analysis can also be applied to estimate the employment effects due to changes in energy demand. By building a diagonal square matrix
containing the employment generated in each sector per unit of sector output, we obtain
where
shows the employment growth as a result of a demand increase in the renewable energy related sectors.
In the same way, we can estimate the impact on CO
2 emissions by building a diagonal matrix
containing the emissions generated per unit of sectoral output:
4. Database
The database used for modelization purposes consists of 26 sectors listed in
Table 1, which classify all the economic sectors of activity of the Spanish economy of the year 2012. Such classifications have been made following homogeneous criteria according the National Classification of Economic Activities (NCEA-2009).
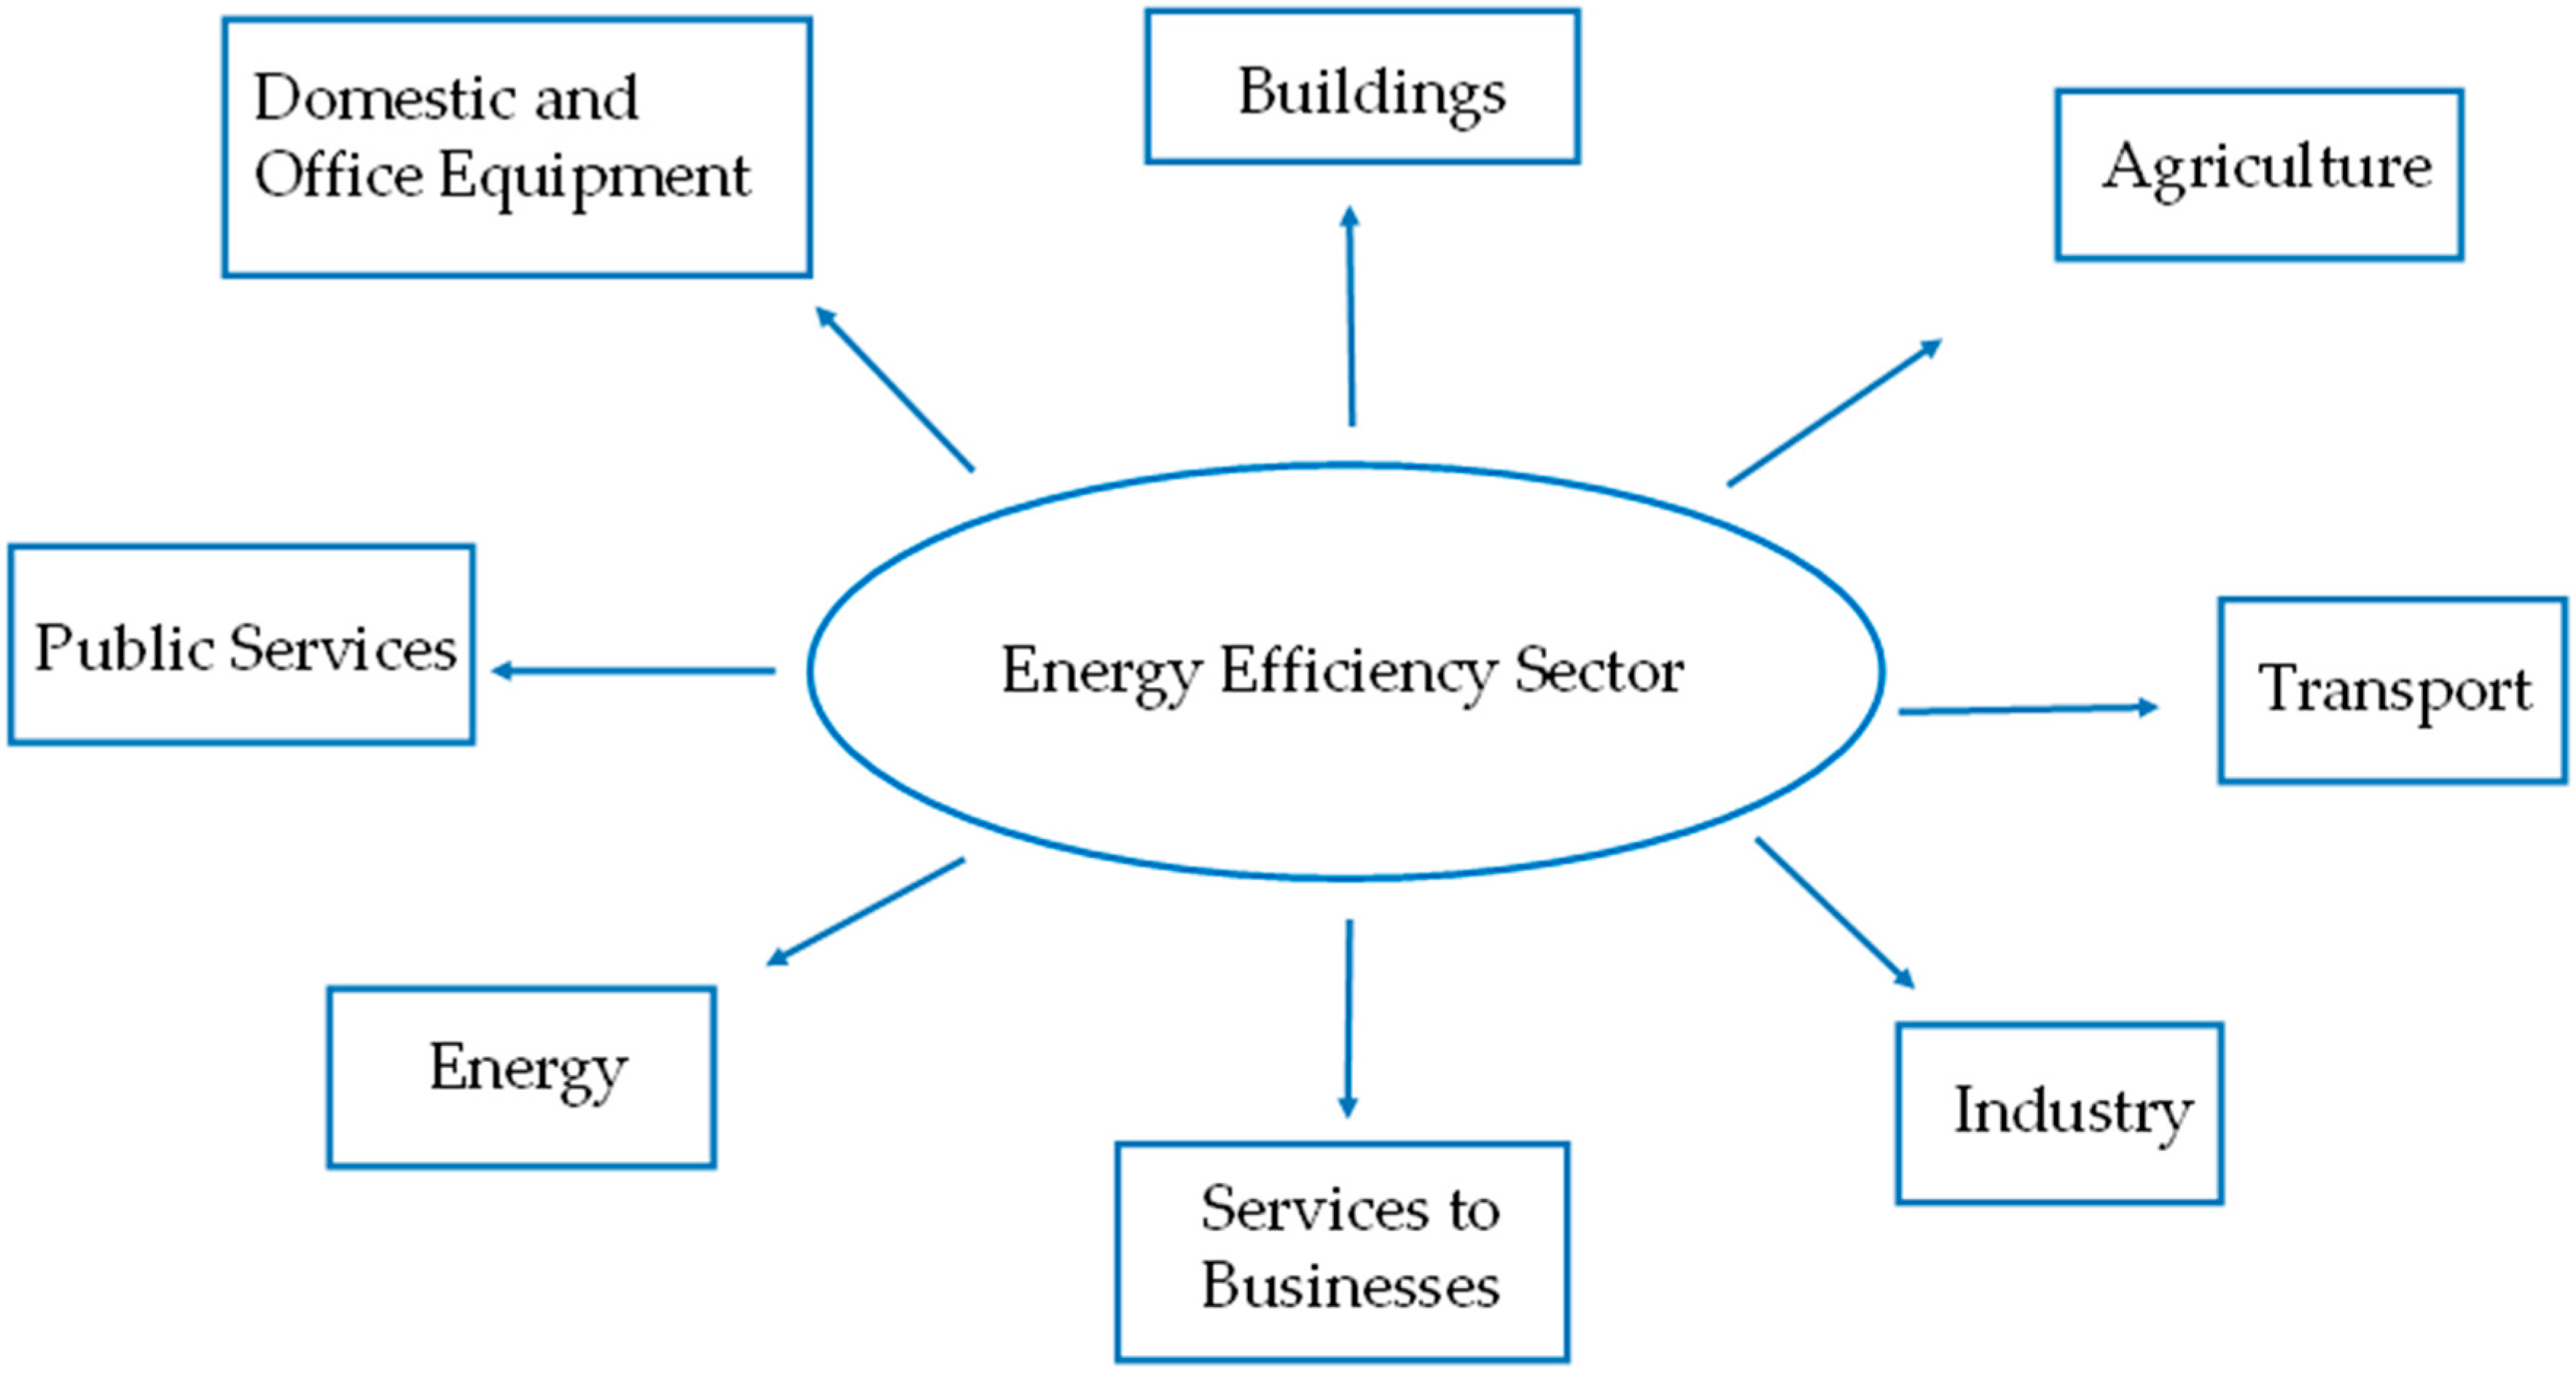
The energy efficiency sector has been identified as a cross-cutting sector for its effects over the others. It has been observed that its cross-sectoral nature embraces most production sectors. For this reason, in this work, we follow the classification of sectors linked to energy efficiency established by National Energy Efficiency Action Plan 2014–2020 (NEEAP). In
Figure 2, it is shown that the Energy Efficiency Sector is cross-disciplinary in nature.
Detailed below are descriptions of products and services included in the sectors related to energy efficiency:
Agriculture: harvesters, seeders, and tractors of high energy efficiency; irrigation equipment; management systems, control, and regulation of air conditioning in greenhouses.
Transport: electric vehicles; low-emission vehicles; promoting the use of bicycles; high-speed trains; charging stations for electric vehicles; Information and Communications Technologies (ICT) applied to public transport and efficient tires.
Industry: isolations of equipment; energy-efficient water chillers, boilers, and motors; absorption machines.
Services to businesses: Energy Service Companies (ESCOs); services provided by public administration and advertising services on energy efficiency; engineering, consulting, auditing, installation, and so on.
Energy: cogeneration systems; electric motors with high energy efficiency; absorption machines.
Public Services: lighting and traffic lights of low consumption; efficient management systems of public lighting and water treatment.
Domestic and office equipment: home appliances and IT equipment with high energy efficiency; remote management systems.
Buildings: thermal insulation; energy-efficient lighting; energy-efficient air conditioning; energy-efficient elevators; management systems of lighting and air conditioning.
The aforementioned eight sectors, which are related to energy efficiency improvement, correspond to fourteen sectors of the IOT-2012 database as presented in
Appendix A. As this database presents the economy in a more disaggregated level, it is necessary to establish the relationship between both levels of aggregation in order to clearly state which of them belong to each of the eight sectors. This can be observed in the following table. The left column of
Table 2 lists the eight sectors related to energy efficiency, while the right column shows the correspondence with IOT-2012 database activity sectors.
5. Empirical Application
As already mentioned before, according to data from the European Commission, the EU 2030 target is to reach at least a 27% increase in energy savings compared with the business-as-usual scenario. If we value the objectives outlined in terms of energy consumption, an energy efficiency target of 27% represents 1369 Mtoe (Million of tonnes of oil equivalent) of primary energy consumption in 2030, and an energy efficiency target of 30% represents 1307 Mtoe of primary energy consumption in 2030. The baseline year figure for primary energy consumption in 2012 is estimated to be 1775 Mtoe, so the targeted 27% savings implies a reduction of 406 Mtoe (22.8%), and the target of 30% savings implies a reduction of 468 Mtoe (26.3%).
5.1. Objectives for Energy Savings in Spain
Spain’s contribution to these objectives is found in the National Energy Efficiency Action Plan 2014–2020 (IDAE, 2014) [
15]. The national objective of primary energy consumption for 2020 is 121.6 Mtoe. This should lead to a reduction of 41.2 Mtoe with respect to the energy consumption trend expected for 2020. According to NEEAP, savings in consumption of final energy in 2020 compared with 2007 is 22.5%. This objective is equivalent to 571 ktoe/year, assuming a linear distribution of savings throughout the 2014–2020 period.
If we are to achieve the objectives previously described, the sharing rule of the savings related to the various sectors involved in energy efficiency is shown in the table below (
Table 3). The contribution in final energy savings is based on the promotion of energy efficiency.
According to the National Statistics Institute, final energy consumption in Spain in 2012 was 89,388 ktoe. A 27% increase in energy savings leads to savings of 24,135 ktoe. If we achieve these savings in 2030, we would have to save 1340 ktoe/year; therefore, the aim of the NEEAP remains well below the objectives of the European Union.
In order to contextualize our model and to offer some macroeconomic data on the energy efficiency sector, in
Table 4, we can see the contribution of energy efficiency to the Gross Value Added and Employment of the Spanish economy.
As aforementioned, energy efficiency is a cross-cutting sector that comprises a group of subsectors whose economic weight within the so-called energy efficiency sector is shown in the following table (
Table 5).
According to the Navigant Research (Energy Efficient Buildings: Europe), in about ten years, investment in energy efficiency in Europe will double. The report expects the European market for energy efficient products and services for buildings to increase from €41,400 million in 2014 to €80,800 million in 2023. In the political field, the creation of the Energy Efficiency National Fund by the Spanish government will imply the investment of €350 million per year (35% of the amount needed, according to the opinion of experts in energy efficiency). Following Couchí and Sweatman (2013) [
16], €350 million per year represents a small supply compared with the volume of investment that needs to be done to generate energy savings to comply with the European directive, a volume estimated at €1 billion annually. We believe that this is a conservative scenario, taking into account the results obtained.
The aforementioned estimate of a €1 billion investment leads us to interpret it as an annual mean. Therefore, the way we introduce the total amount of €15 billion (for the 15 years of simulation) into the model is by applying a learning curve approach. Under this approach, we establish the transition to an energy efficient model in which investments are gradually decreasing. Nevertheless, we keep them constant for every three-year period.
Table 6 shows the distribution of the total investment that we propose to simulate through the mathematical linear model. Figures are presented with absolute values.
Taking a closer look at
Table 6, we can observe that the annual investments would follow a decreasing pattern that we have calculated for simulation purposes. The initial annual 1500 has been lowered in the percentages shown in
Table 7.
These annual investments will lead to a progressive decrease of electricity consumption over the 15 years covered by this process. Electricity consumption estimates are presented in the following table (
Table 8).
It is considered that, during the first three years (2016–2018), electricity consumption will decrease by 9% from €3662.07 million in the base year to €3333.30 million per year during this first period. This decline will progressively increase to reach a 30% reduction in electricity consumption, as has been established by the EU set of goals for 2030.
5.2. Production Impact
As shown in the methodology previously explained (
Section 3), investments made in the energy efficiency subsectors would have a positive impact on the Spanish economy as a whole. The way this occurs derives from a sequence of transmission effects which can be analyzed through the input–output methodology underlying the linear model. The final demand vector,
, appearing in Equation (2), absorbs demand changes and drives the impact into rest of the economy. For simulation purposes, we have shocked vector,
, including both the investments made in each year of the period (
Table 7) and the fall in electricity consumption (
Table 8).
The demand shock is reflected in the final demand vector as a variation,
. Moreover, by solving Equation (3), we obtain the variation in the vector of production by sectors,
. The final impact on the demand-driven shock occurs via Leontief multipliers, as explained in
Section 3. These changes are reflected in
Table 9. These effects are shown in the following table expressed as the total and percentage variation in the production of each of the industries in which the Spanish productive sector has been classified.
We note that sectors with the greatest increase in production are Construction, Transport and communications, Other services (financial activities, real state, information technology, I + D, …), Manufacture of motor vehicles, Other transport equipment, Machinery, and Metallurgy. All of these are sectors that, to a greater or lesser extent, have received investments intended to improve energy efficiency. Furthermore, we also note that sectors that have not been subject to such direct investments have also experienced a significant increase in production, as is the case of Trading and catering, Other manufactures (furniture, recycling, ...), Building materials, and Chemical industry.
By contrast, sectors experiencing a progressive decrease in production due to the fall in electricity consumption belong to the energy sector: production and distribution of electricity, extraction of crude oil, natural gas, uranium, manufacture of coke, petroleum, nuclear, extraction of coal, lignite and peat, and production and distribution of gas.
5.3. Employment Impact
According to the National Institute of Statistics, the number of full-time equivalent jobs (in thousands of jobs) in 2012 was 16,350.8, distributed among the sectors of the Spanish economy as follows in
Table 10:
In the next table (
Table 11), we can see the annual increase estimate that energy efficiency investments would cause in employment numbers.
From these results, we can observe that the largest increases in employment are concentrated in the following sectors: Construction, Trading and catering, Transport and Communications and Other services (financial activities, real state, information technology, R + D, etc. Notably, whereas the trading and catering sector is not a direct recipient of investments, due to its ability to create jobs, it benefits more than others that have directly received investments; we can also observe that the same occurs in other sectors belonging to tertiary sectors for their high capacity to create employment. Furthermore, there are other non-direct recipient sectors whose investments show a significant increase in employment: Other manufactures (furniture, recycling), Building materials, Metallurgy, and Wood and Cork.
By contrast, sectors experiencing a decline in employment due to the fall in electricity consumption are as follows: production and distribution of electricity, extraction of coal, lignite and peat, production and distribution of gas, manufacture of coke, petroleum, nuclear, extraction of crude oil, natural gas, uranium and water distribution, and wastewater treatment.
5.4. CO2 Emission Impact
These measures leading to improve energy efficiency also have a significant environmental impact due to the reduction of CO2 emissions achieved in the long-term efficiency when the investment measures are implemented in the various economic sectors involved.
According to the National Institute of Statistics, CO
2 emissions in 2012 amounted to 221,910,785 Toe, distributed among the sectors of the Spanish economy as shown in
Table 12.
It can be observed that, during the first three years, CO2 emissions show an increase as a consequence of the production increase linked to investments made. In these early years, the emission reduction due to the fall in electricity consumption is still small. Sectors leading to a fall in CO2 emissions are related to the energy sector and water sector: production and distribution of electricity, production and distribution of gas, manufacture of coke, petroleum, nuclear, extraction of coal, lignite and peat, water distribution, and wastewater treatment.
One important finding is the detection of the most polluting sectors, this information is provided by
Table 13. These sectors read as follows: Transport and communications, Building materials, Metallurgy, Manufacture of motor vehicles and trailers, and Other transport equipment. This indicates that, besides the necessary measures to be taken in the energy sector, other economic sectors require significant economic measures to mitigate these emissions.
All the simulation results obtained in this work as explained in
Table 9,
Table 11 and
Table 13 are compiled into more detail, for every three-year period, in
Appendix B.
6. Conclusions
The necessity to understand the mechanisms involved in decision-making processes, specifically of those related to contemporary energy systems, lead to the proposal of quantitative tools, with proven mathematical foundations, like the one proposed in this paper. The input–output methodology has been applied on this occasion to explore the economic impact of investing in several energy-efficiency-related sectors in Spain. The idea of a governance of energy at a national level combines in this work the mathematical modeling based on the input–output methodology with the real socio-economic Spanish framework to scale the impacts.
Bringing the input–output methodology into practice has enabled us to simulate the macroeconomic impact of energy efficiency improvements up to 2030. Literature review confirms that there is consensus, both nationally and internationally, about the need to promote energy efficiency if we are to achieve the objectives of reducing emissions and combating climate change and global warming. Through the linear model presented here, it has been proven that there are quantitative tools for carrying out analysis on sustainability measures, subject to data availability. Despite the static feature of input–output models, they are a good tool to trace the flow of resources between sectors.
The ultimate goal of this paper was evaluating the macroeconomic impact due to the application of several energy efficiency measures at the Spanish national level. These measures represent an investment shock on the Spanish economic system that will subsequently cause some electricity energy savings. In light of the simulations carried through the model together with the database, the main findings are in relation to a sector-by-sector breakdown of the total production variation for the 2016–2030 period, effects over employment figures, and CO2 emissions.
One of the most notorious effects is one observed in the production variation of the energy sectors. Specifically, those sectors experiencing a production decay are as follows: production and distribution of electricity, extraction of crude oil, natural gas, uranium, manufacture of coke, petroleum, nuclear, extraction of coal, lignite and peat, and the production and distribution of gas. We interpret these results as a consequence of the fall in electricity consumption and its indirect effects over the rest of the energy-related sectors. The present work has focused on measuring direct and indirect effects of improving energy efficiency linked to energy consumption. Therefore, this approach involved simulating a lowering on electricity demand in line with the recommendations made by the International Energy Agency [
17]. Their estimates on the effects of improving the efficiency of electricity consumption are up to a 12% cumulative reduction in the requirements of electricity sector’ installed capacity.
The input–output linear model yields a notable figure of an 11.22% cumulative reduction in the production and distribution of electricity after running the simulation. This fact confirms that figures have been properly adjusted to meet the objectives. Furthermore, job creation amounts to a figure of 147,745 full-time equivalent jobs in the 15 years that investments would last, representing a moderate 1% cumulative rise from the baseline year. With regard to the reduction of 4,066,665 Toe of CO2 emissions over the period, we must highlight that this figure represents a 1.83% cumulative reduction over the period. For this reason, we believe that stronger political and legislative initiatives would be necessary for this energy model transition to take place. Despite the fact that the simulation made is of a conservative amount, European Commission directions in terms of greenhouse gas emissions, renewable energy consumption, and energy savings lead to enhancing sustainability in the overall system up to a higher extent. However, through this work, it has been proven that all the efforts made to meet these targets would have the desired effects over the main aggregate variables. Furthermore, the influence that energy-related policies would have over economic and social aggregates depend not only on the direct effect over those sectors directly receiving the investments. It has been depicted that, through the multiplier effect there is an indirect effect over the rest of sectors and agents involved in the socio-economic structure of a certain economy.
Finally, we would like to stress that energy efficiency and electricity savings should not be considered as ends in themselves, but as a means of implementing environmental improvements. It has been shown in this work that economic improvements have significant effects on the productive sector due to the shift in energy efficiency. However, in addition to policies aimed at improving energy efficiency, decision-makers, communities, or governments would also have to establish policies to address market failures related to environmental impact. They all have their roles to play if we are to address climate change. Besides, the private sector could be encouraged by fiscal or regulatory measures to undertake actions directed towards promoting sustainability. Moreover, economic policies such as a CO2 tax or an equivalent system of tradable emission permits would exert pressure on certain behavioural patterns that could be smoothly improved leading to an increase in sustainability targets.
The results achieved in this paper show us how necessary investments are if we want to improve energy efficiency in the long run. Such investments would directly and indirectly represent an impulse for the economy and the employment in Spain, in addition to the fact that they would lead to considerable savings on energy, so it will quickly compensate the investment required at a first stage.
The need to invest in energy efficiency is undisputed, as shown by the data provided by the International Energy Agency (2014). Energy efficiency (58%), renewable energy (17%), and carbon capture and storage (19%) arise as the main technological options for climate change mitigation.


