1. Introduction
The claim for an increased level of
sustainability in all areas of society has remained unchallenged since its introduction into scientific literature by the German Carl von Clausewitz in 1713 regarding a sustainable management of forest areas (“Nachhaltigkeit” [
1]). Even more emphasis was placed on the concept in milestone publications including the “Limits of Growth” by the Club of Rome [
2,
3,
4,
5] and the Brundtlandt report with its modern-day definition of sustainability [
6,
7]. Today, the triple-bottom-line-approach focusing on
economic,
ecological and
social implications and interaction areas is widespread and academically accepted as the main route towards improved sustainability [
8,
9,
10,
11,
12].
For the area of
logistics and transportation, this approach is appropriate, even though expressions such as “green logistics” or “green transportation” seem to place more impetus on the ecological (“green”) dimension [
13,
14,
15,
16]. Nevertheless, concepts regarding improving the sustainability—
i.e., “greening”—of logistics and supply chains around the globe do adhere to the three impact areas. However, for the sake of argument, the main analysis in this article is directed towards the
ecological question of
reduced energy demand as well as emission output by all transportation, warehousing and other logistics activities. It must be noted however, that especially the
social dimension of logistics activities should be the focus for sustainability research, given the fact that labor conditions as well as worker migration and increased customer awareness in Europe and elsewhere place
new social burdens and responsibilities on the logistics industry.
This contribution is structured as follows:
Section 2 provides a short status report regarding the developments and achievements of green logistics in the past up until the current state;
Section 3 describes the main hope of technology improvement for increased sustainability in logistics, especially propulsion technologies and energy concepts for transportation;
Section 4 outlines why technological improvement and efficiency gains have not brought about an increased level of sustainability in logistics, using an extended analytical concept of the Jevons paradox. The political and social level is addressed in
Section 5 in order to further explain the present failure of green logistics objectives. In order to remedy this failure,
Section 6 outlines two possible advances towards a worthwhile implementation of green logistics for the future. The last section then provides a short conclusion and outlook.
2. History and Status Quo
The objective of green logistics in terms of reduced energy consumption as well as emissions has not been successful within the European Union (EU-28); the share of greenhouse gas (GHG) emissions caused by the transportation and logistics sector has
risen from 16.6% in 1990 to 24.3% in 2012 [
17]. In total absolute emissions, this means an increase from 962.6 to 1173.3 million tons of
CO2 equivalents per annum (in itself an increase of 21.89%, or roughly 1% per year) as outlined in
Table 1.
Usually, for all reported data, the transportation sector includes passenger transport as well as cargo transport. Roughly half of the emissions are caused solely by cargo transport, though the overall trend towards an increase is similar in passenger transport. It is argued here that similar mechanisms as outlined below for cargo transport are also at play in the passenger transport sector.
Similarly, all relevant numbers have not been reduced as advertised (see
Table 1). A slight but recognizable downturn of consumption and emissions was experienced during the 2007–2009 global economic crisis due to a sharp decline in transportation demand. Interestingly, as experienced by many logistics companies, this recession decline started earlier compared to other economic indicators, contributing to the inclination of transportation as an “early-warning indicator” of economic downturns as companies, for example, stop ordering new materials or making investments before reducing production output and cutting back in other corporate decision areas such as labor and research and development. Moreover, although 2012 saw a small decline, recent data for 2013 and 2014 shows that this is not a trend change but a sign that traffic has been on the rise: For Germany, the
internal (national) cargo traffic increased from 633.2 billion tonkilometers (in 2012) to 646.0 (2013) and 654.6 tonkilometers in 2014 [
18] (p. 245), a further 3.38% increase in two years. The
international cargo traffic into and out of Germany increased from 196.3 billion tonkilometers in 2012 to 201.7 in 2014 [
18] (p. 183), an increase of 2.75% in the two years.
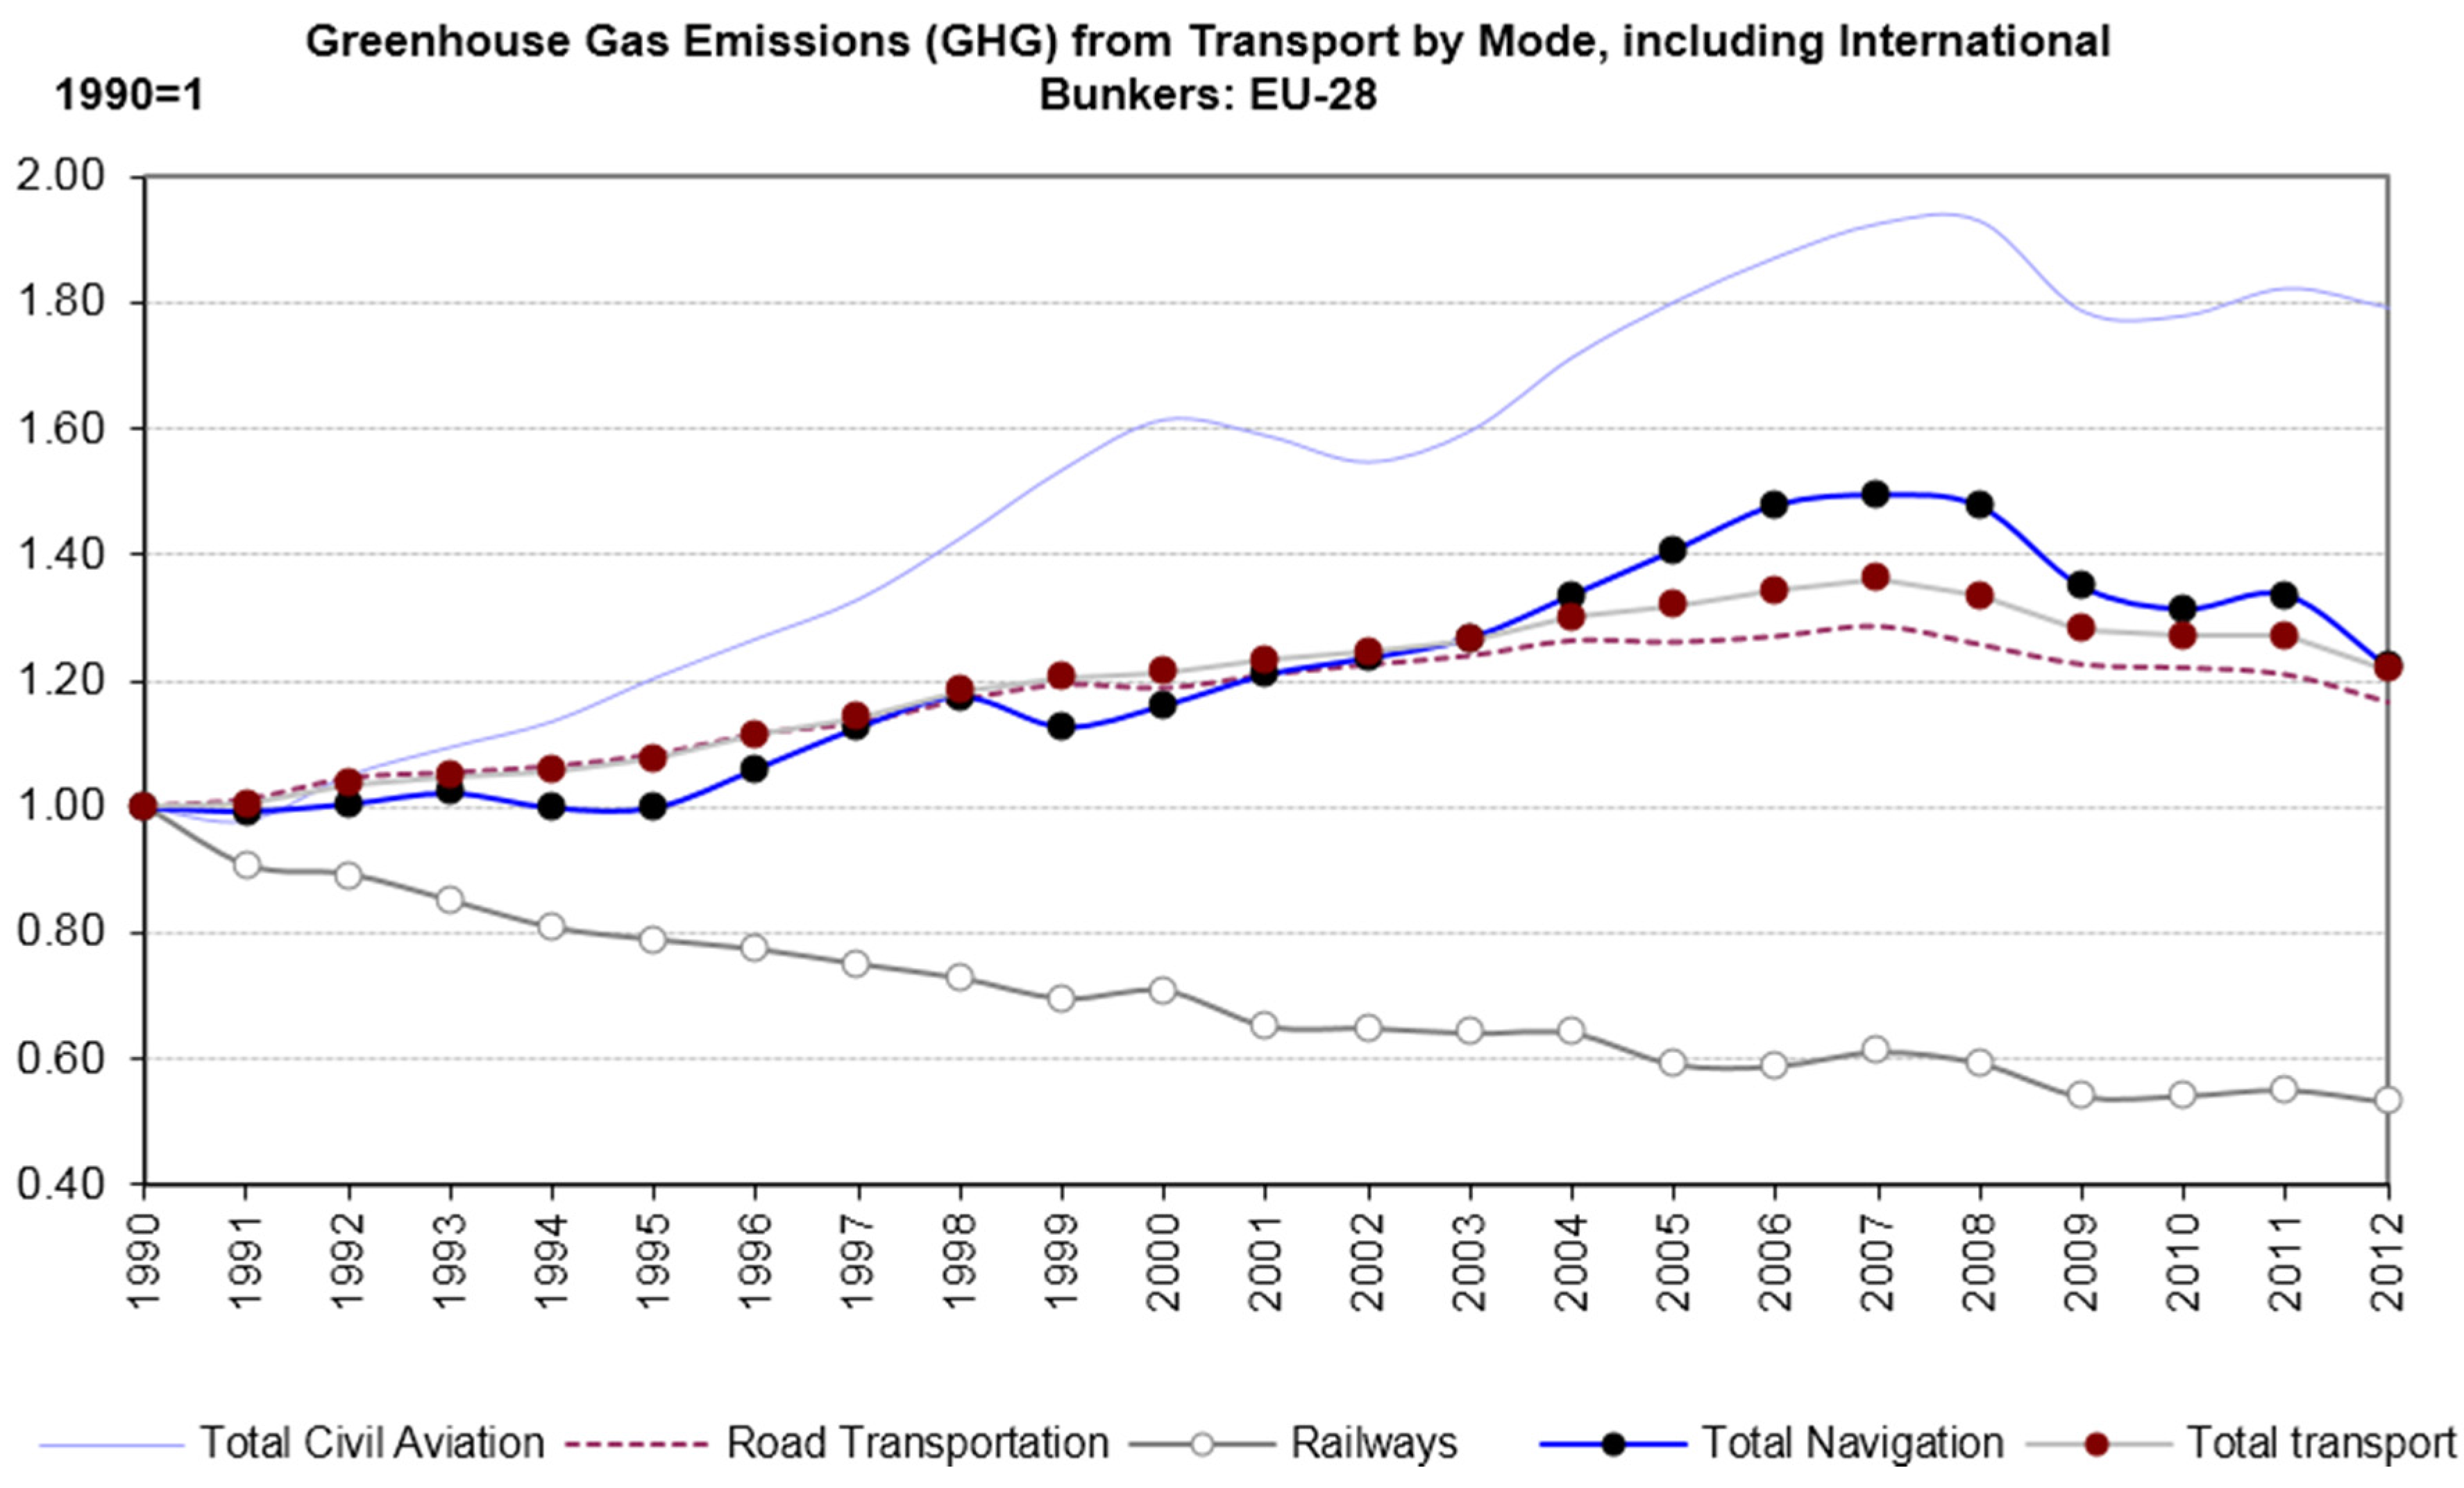
Furthermore, despite only carrying a small share of total weight and volume, the transport mode with the largest increases over the last 25 years has been the air cargo sector, as seen below in
Figure 1 (EU-28). This has severe implications, as this sector has not only the highest energy consumption as well as emission levels per tonkilometer, but is also thought to have an even higher environmental impact regarding climate change due to very high emissions during flight. (For the shipping sector, on the other hand, the carbon emissions are discussed in terms of impact on sea level and they are less severe or can even positive, partly due to cloud formation at a high or low altitude; this additional dynamic is referred to as “radiative forcing” (RF) impact, see [
19] (p. 331).)
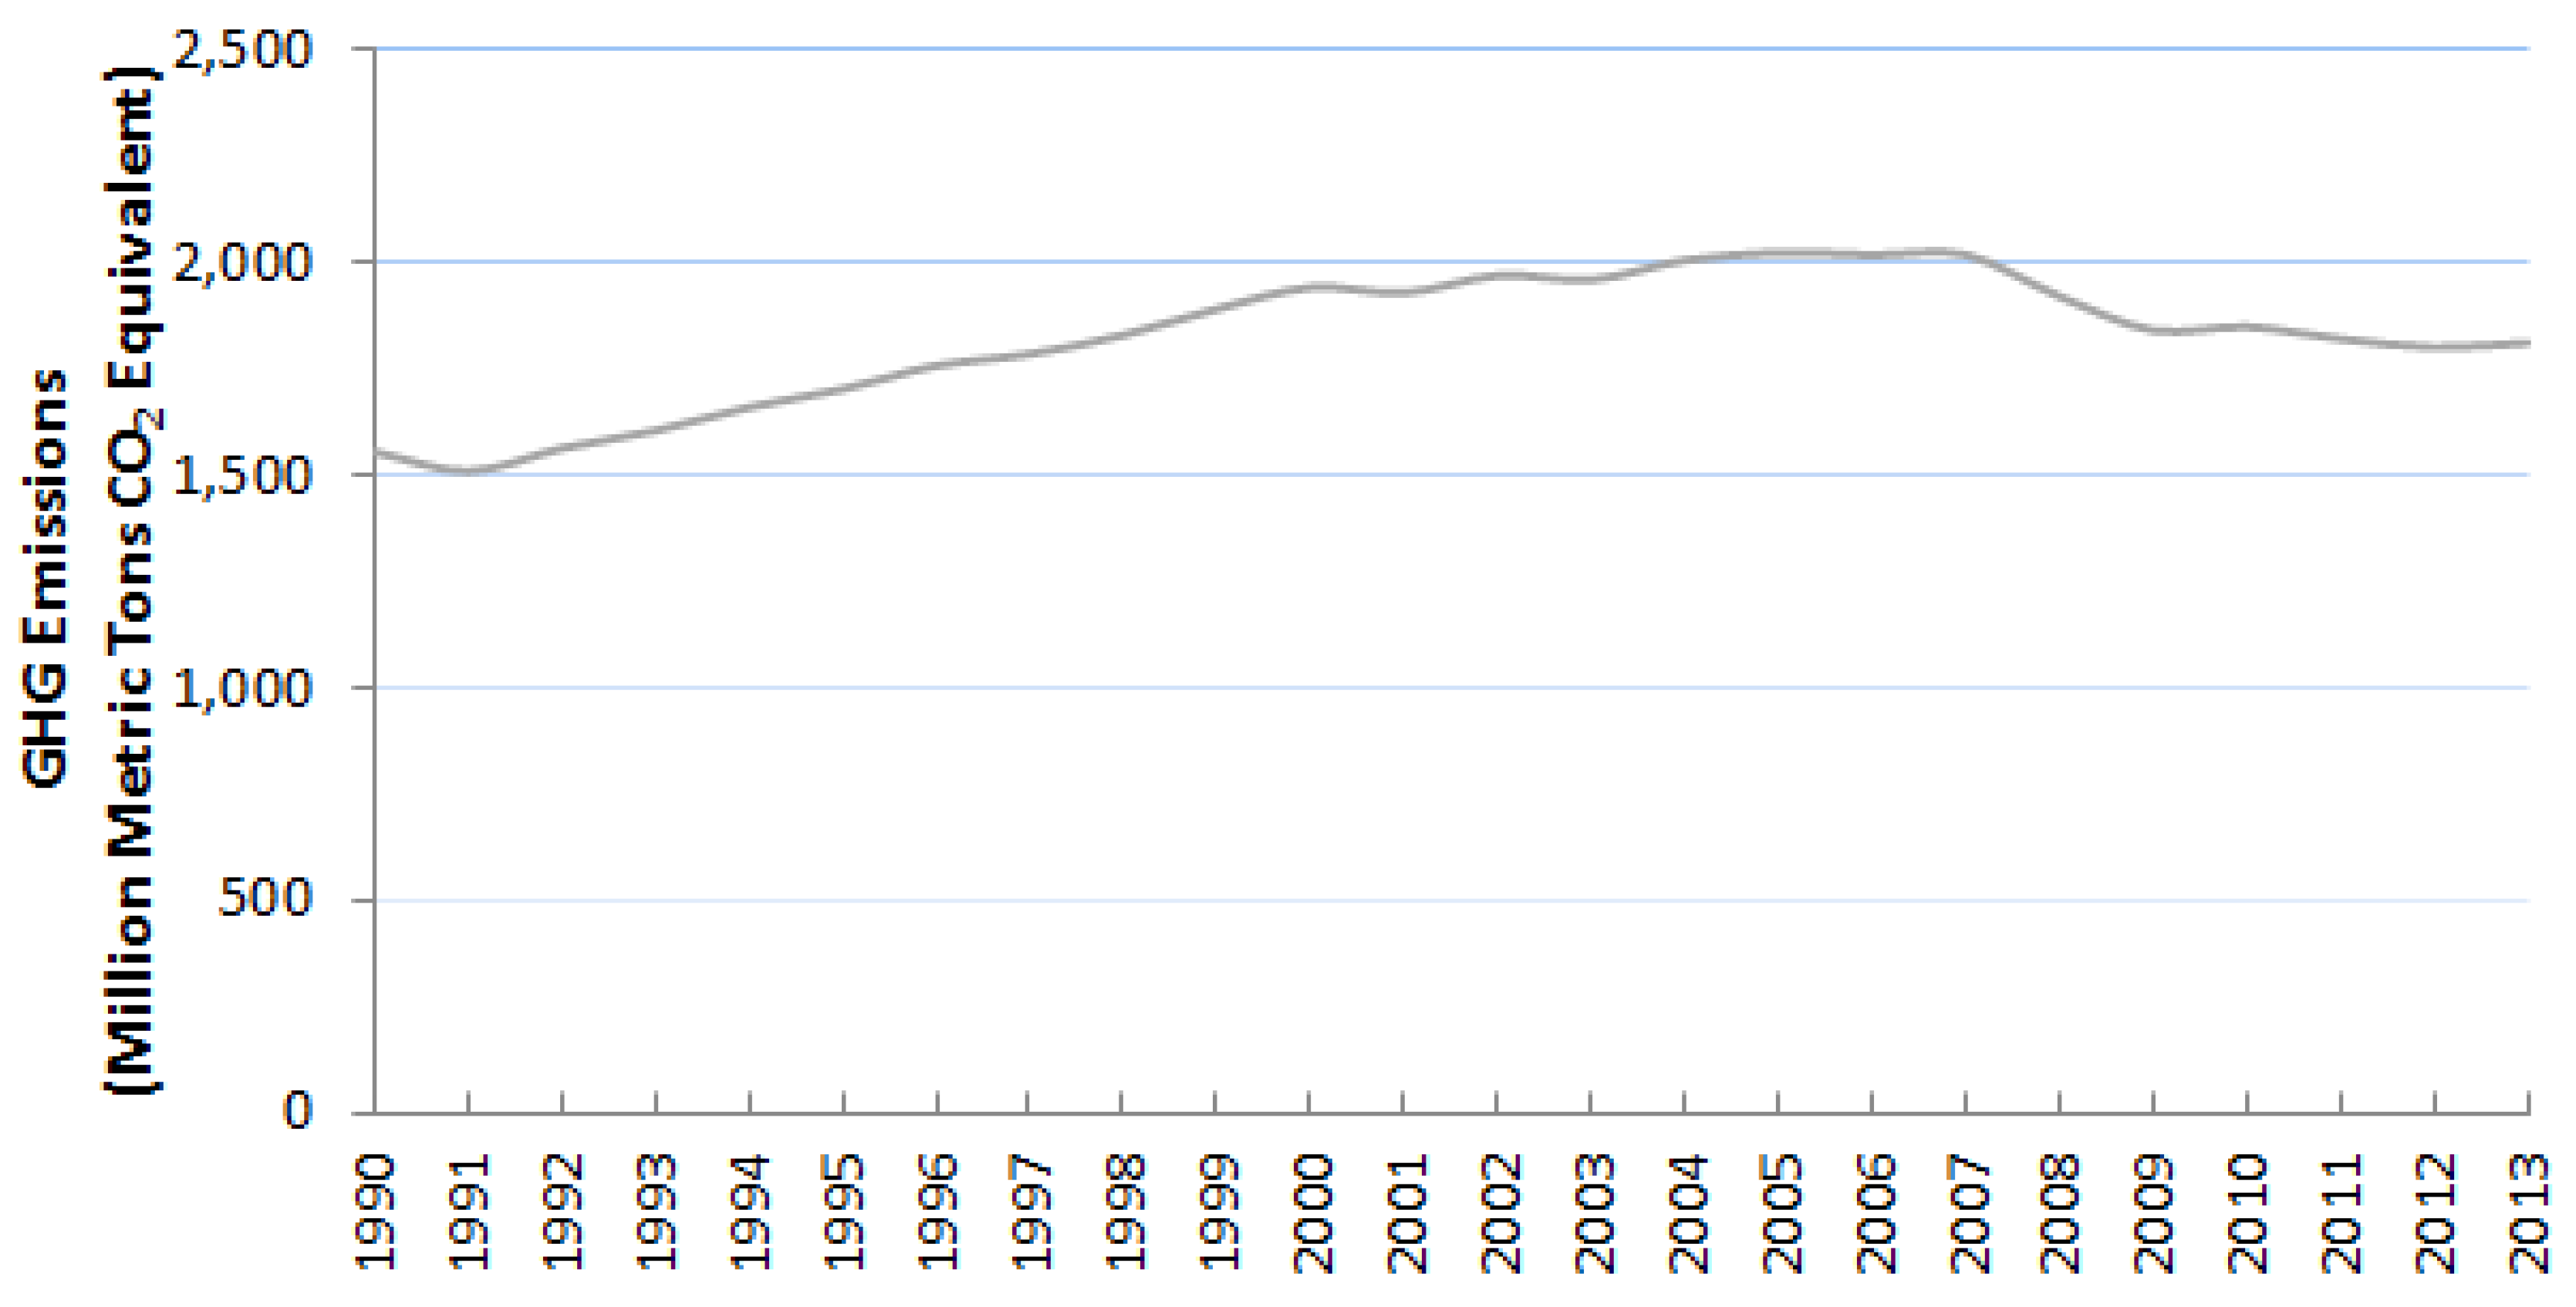
These numbers represent the historic development and status quo for
Europe, but other countries and regions in the world are faring no better: For the US, development is shown in
Figure 2 with a similar picture of a significant overall increase of GHG emissions from the transportation sector, halted only during the global recession of 2007–2009.
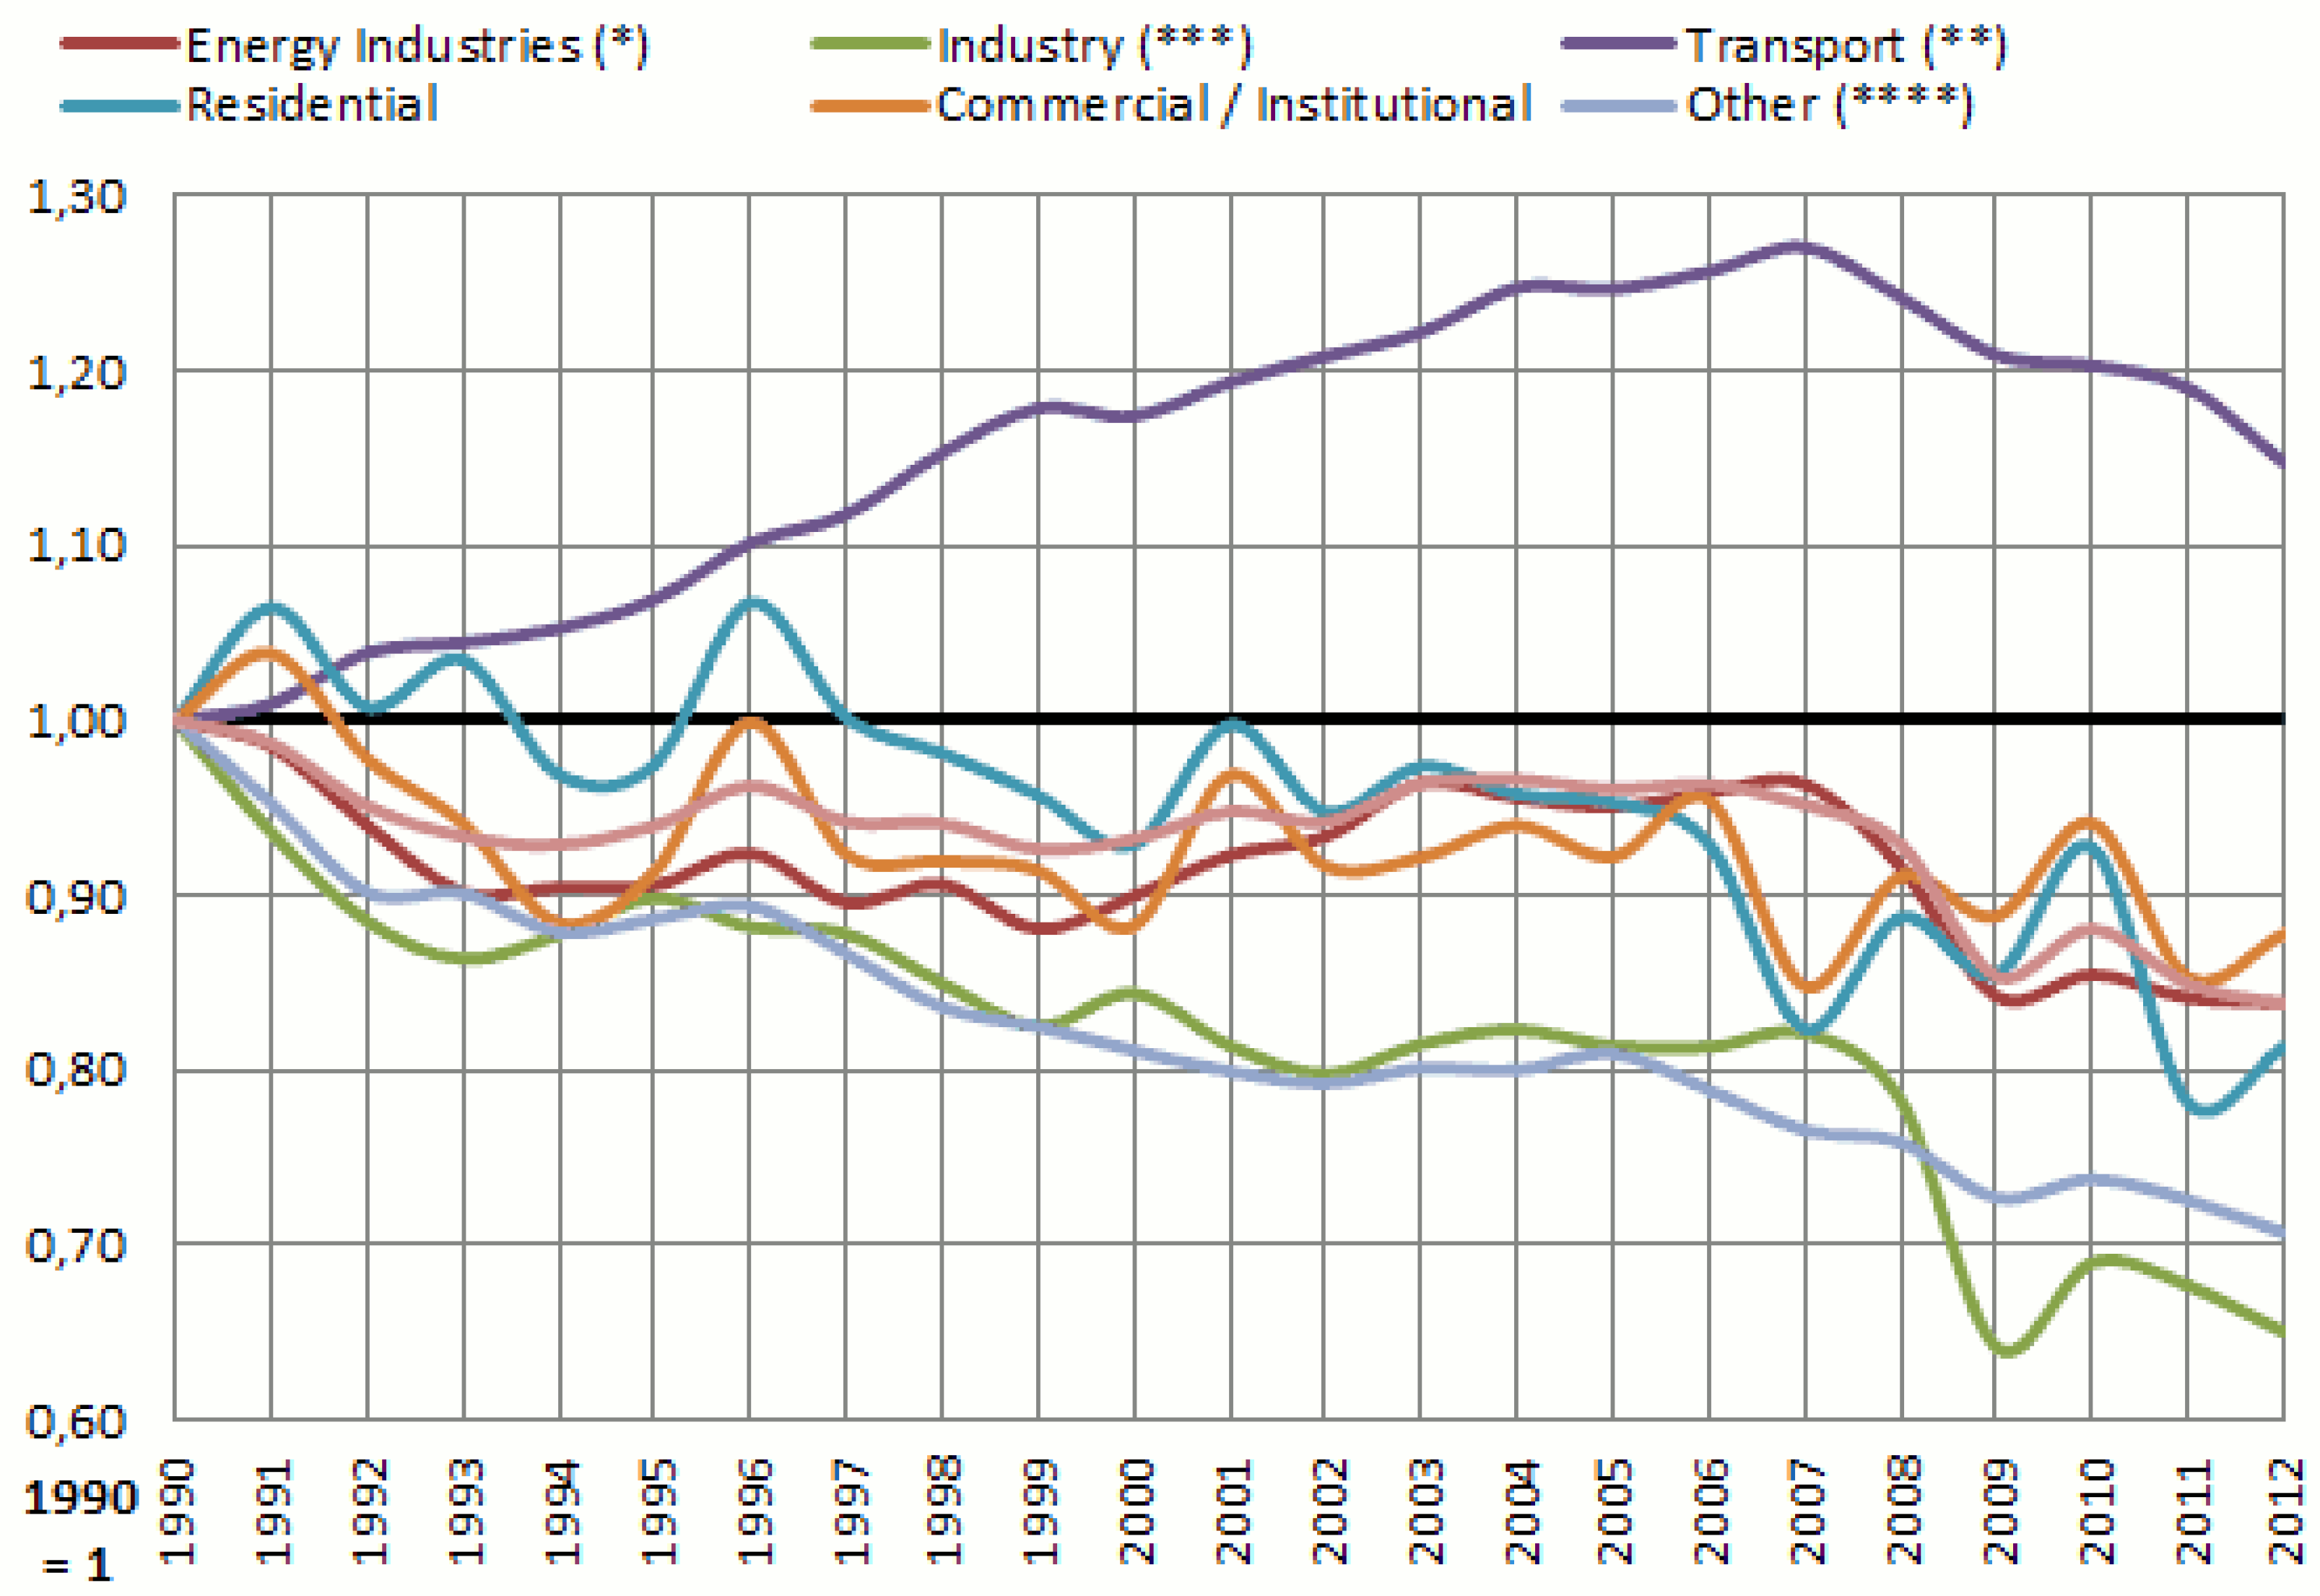
This leads to the historic as well as problematic development that the transportation sector is the only economic sector with a long-term increase of GHG emissions, whereas other sectors such as industry, private residents, as well as the energy sector have a reduction in their absolute emission levels. This is depicted in
Figure 3 for Europe (1990 to 2012).
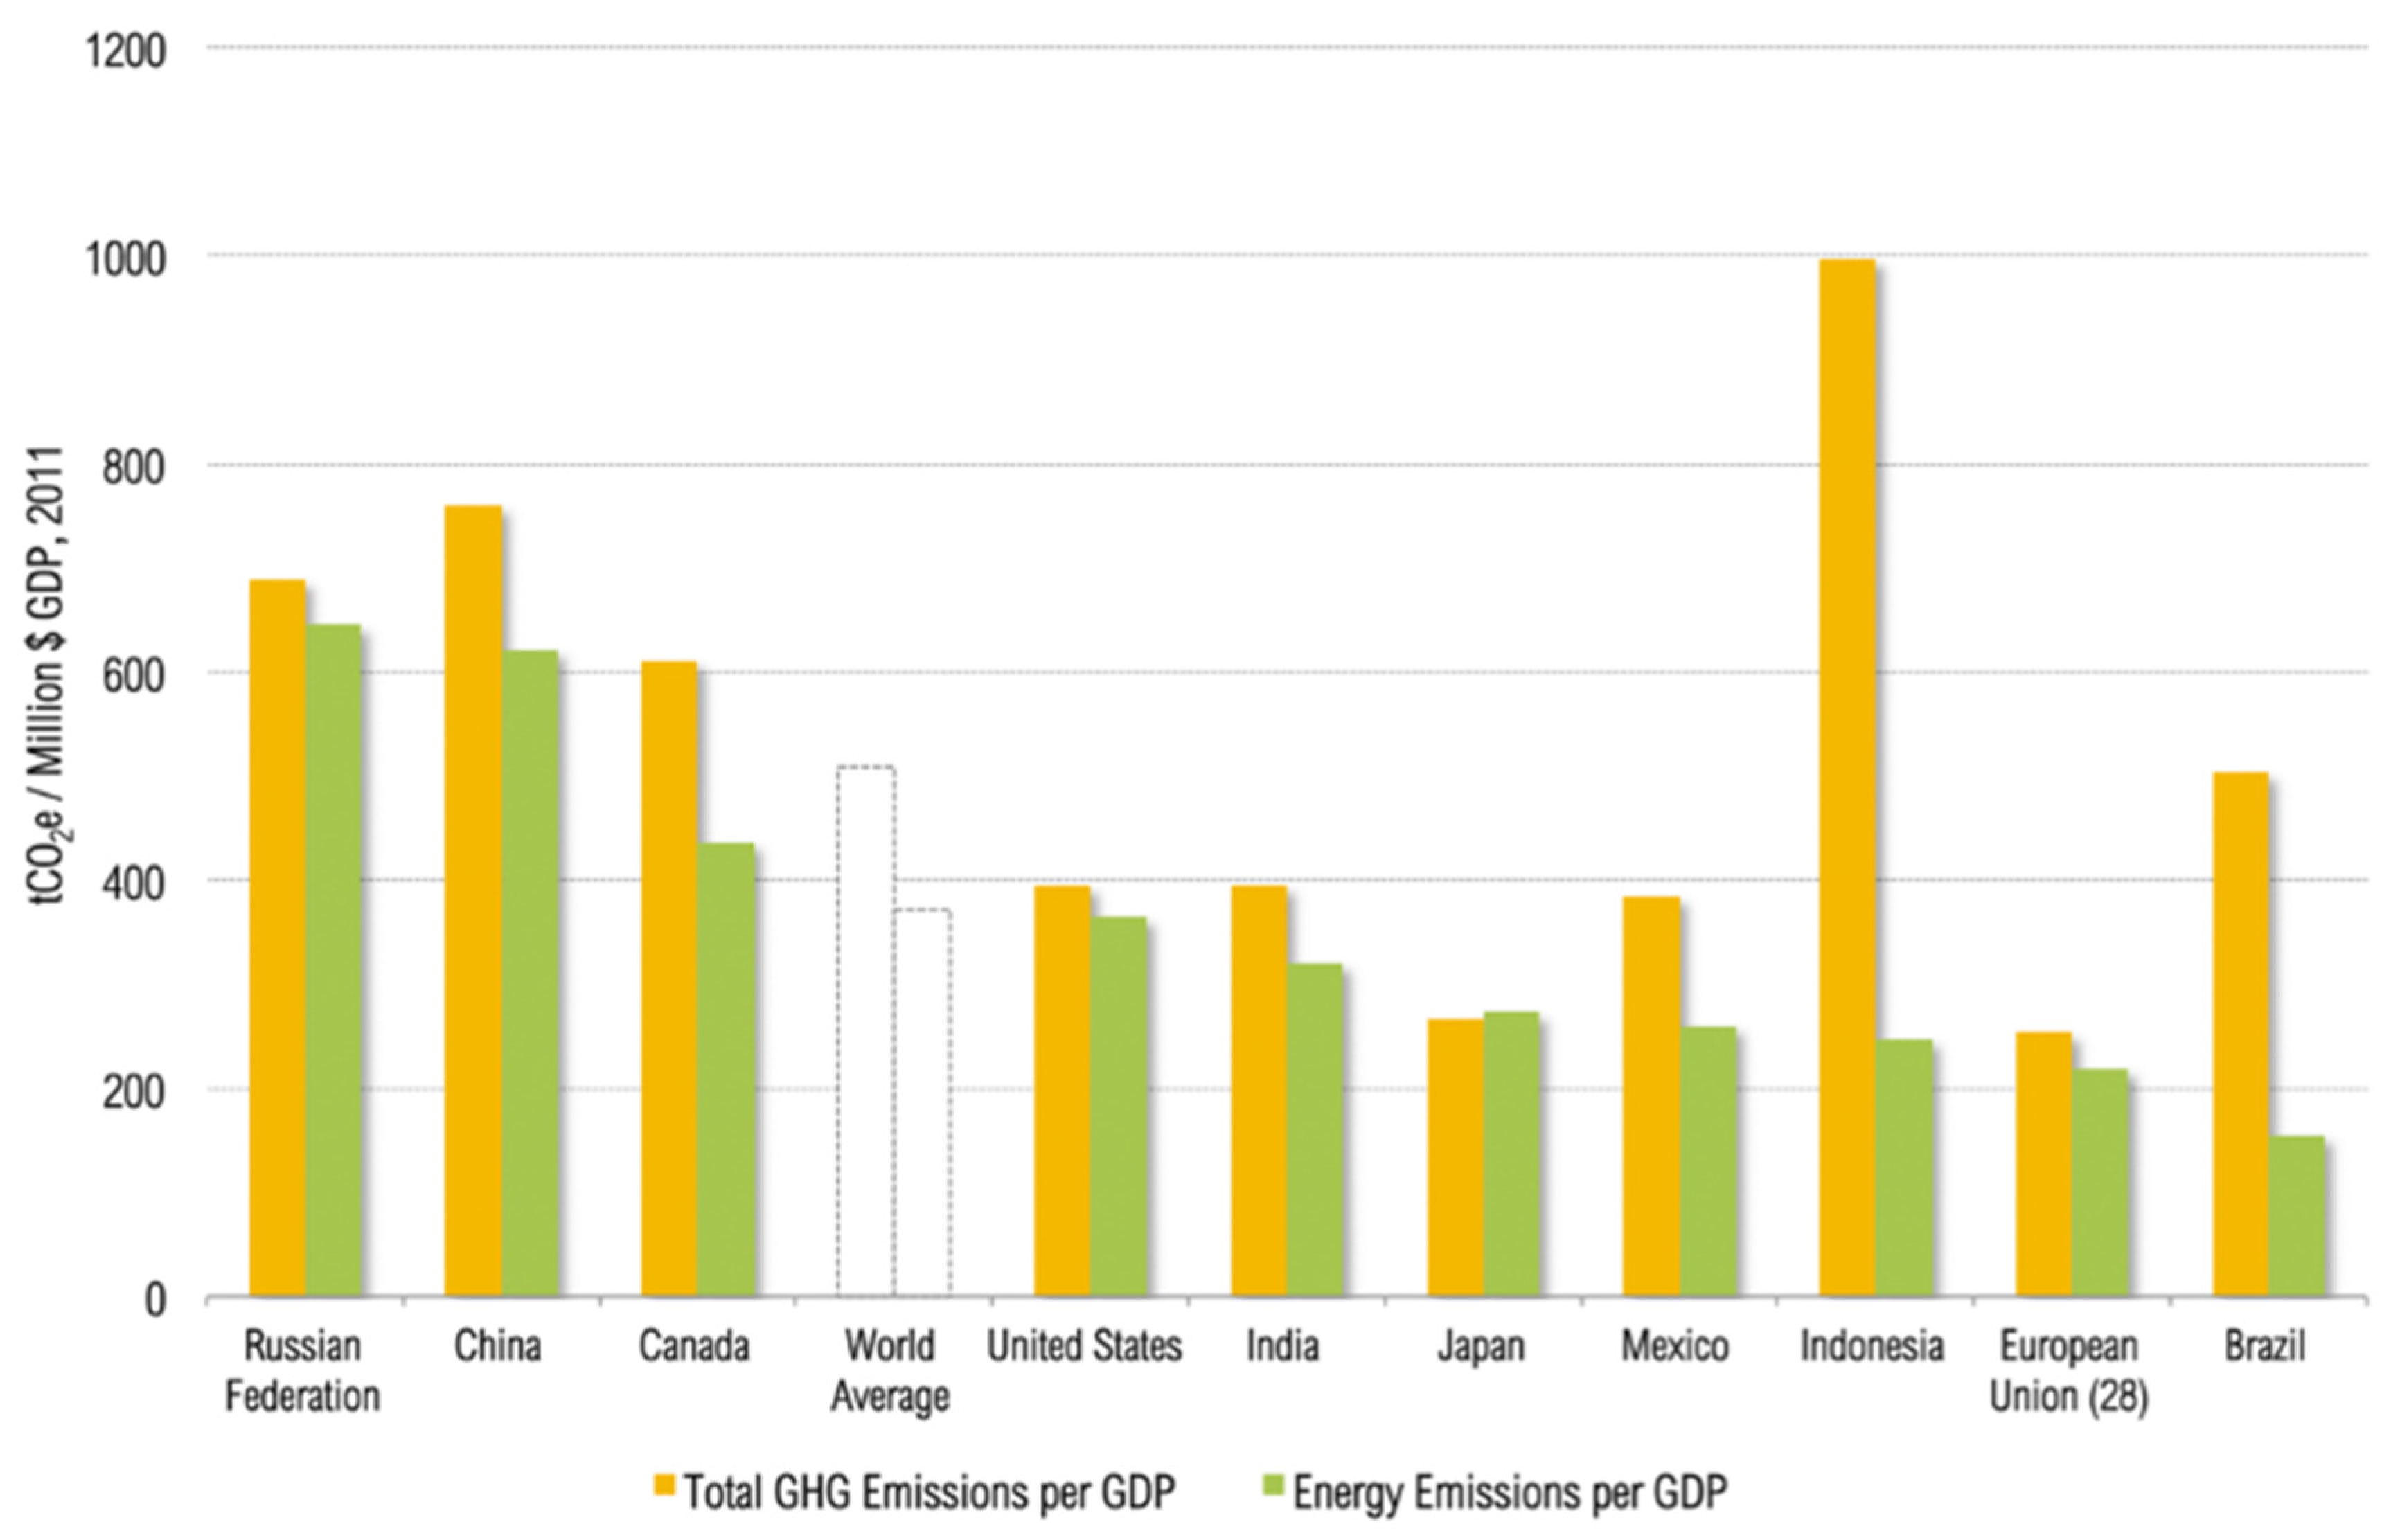
For global developments, it has to be kept in mind that Europe may be one of the larger economic regions and therefore also of energy consumers as well as GHG emitters (accounting for about 12% of GHG emissions 1990–2011, after the USA with 16% and China with 15%, [
20]). Nevertheless, the energy consumption as well as the emission levels
per GDP output are relatively low or efficient as shown in
Figure 4. Other countries including China, Russia, Canada or also Indonesia have much higher levels of emissions per GDP than Europe, Japan or India. This indicates that the global problem and especially the further
development on a global scale may be even more problem-ridden than illustrated by the more prominent European perspective and numbers.
Therefore, it can be concluded that the overall “mission” of green logistics and green transportation—reducing the energy consumption as well as the GHG emissions from logistics and transportation—has so far been a failure. Moreover, the prospects of a quickly approaching turning point are not imminent, especially with the increased economic development of larger parts of the world community, even if ethically and socially more than justified. Consequently, overall energy consumption and GHG emission levels in the transportation sector are likely to rise further.
This increase is in spite of the fact that—besides the quantitative numbers—the societal and corporate acceptance of the overall sustainability concept for logistics is assumed to be a given, though major concerns for e.g., customer
acceptance [
23,
24],
reach (
i.e., for governmental as well as non-governmental non-profit organizations, see [
25,
26]), as well as
control and monitoring [
15,
27,
28] resume. Still, the described research question of
why the concept of green and sustainable logistics failed in general, especially regarding emissions impact, remains open; but before diving deeper into it we must take a look in
Section 3 at the
technology development, which for many actors is the main source of hope for successful green logistics.
3. Technology in Road Transportation and Green Logistics
Usually one of the most encouraging areas for green logistics is development in
technology; the hope is to provide more transportation with less energy consumption and emission volumes. For example, the Intergovernmental Panel on Climate Change (IPCC) reports a high expectation towards such technology-based efficiency gains for GHG emission reduction in transportation:
“
The mitigation potential by 2030 for the transport sector is estimated to be about 1600–2550 Mt CO2 (…). This is only a partial assessment, based on biofuel use throughout the transport sector and efficiency improvements in light-duty vehicles and aircraft and does not cover the potential for heavy-duty vehicles, rail transport, shipping, and modal split change and public transport promotion and is therefore an underestimation” [
19] (p. 326). (The report itself warns consecutively: “This estimate of mitigation costs and potential is highly uncertain. (…)
low agreement, limited evidence” [
19] (p. 326)).
The part of this estimate regarding biofuels has clearly been unrealistic: biofuel use has never really met the reduction expectations for logistics and transportation due to different contributing factors and obstacles [
29,
30,
31,
32] (Although the life-cycle assessment (LCA) GHG emission potential is being discussed here, some studies posited a reduction of 80% while others only 40%). Moreover, the current
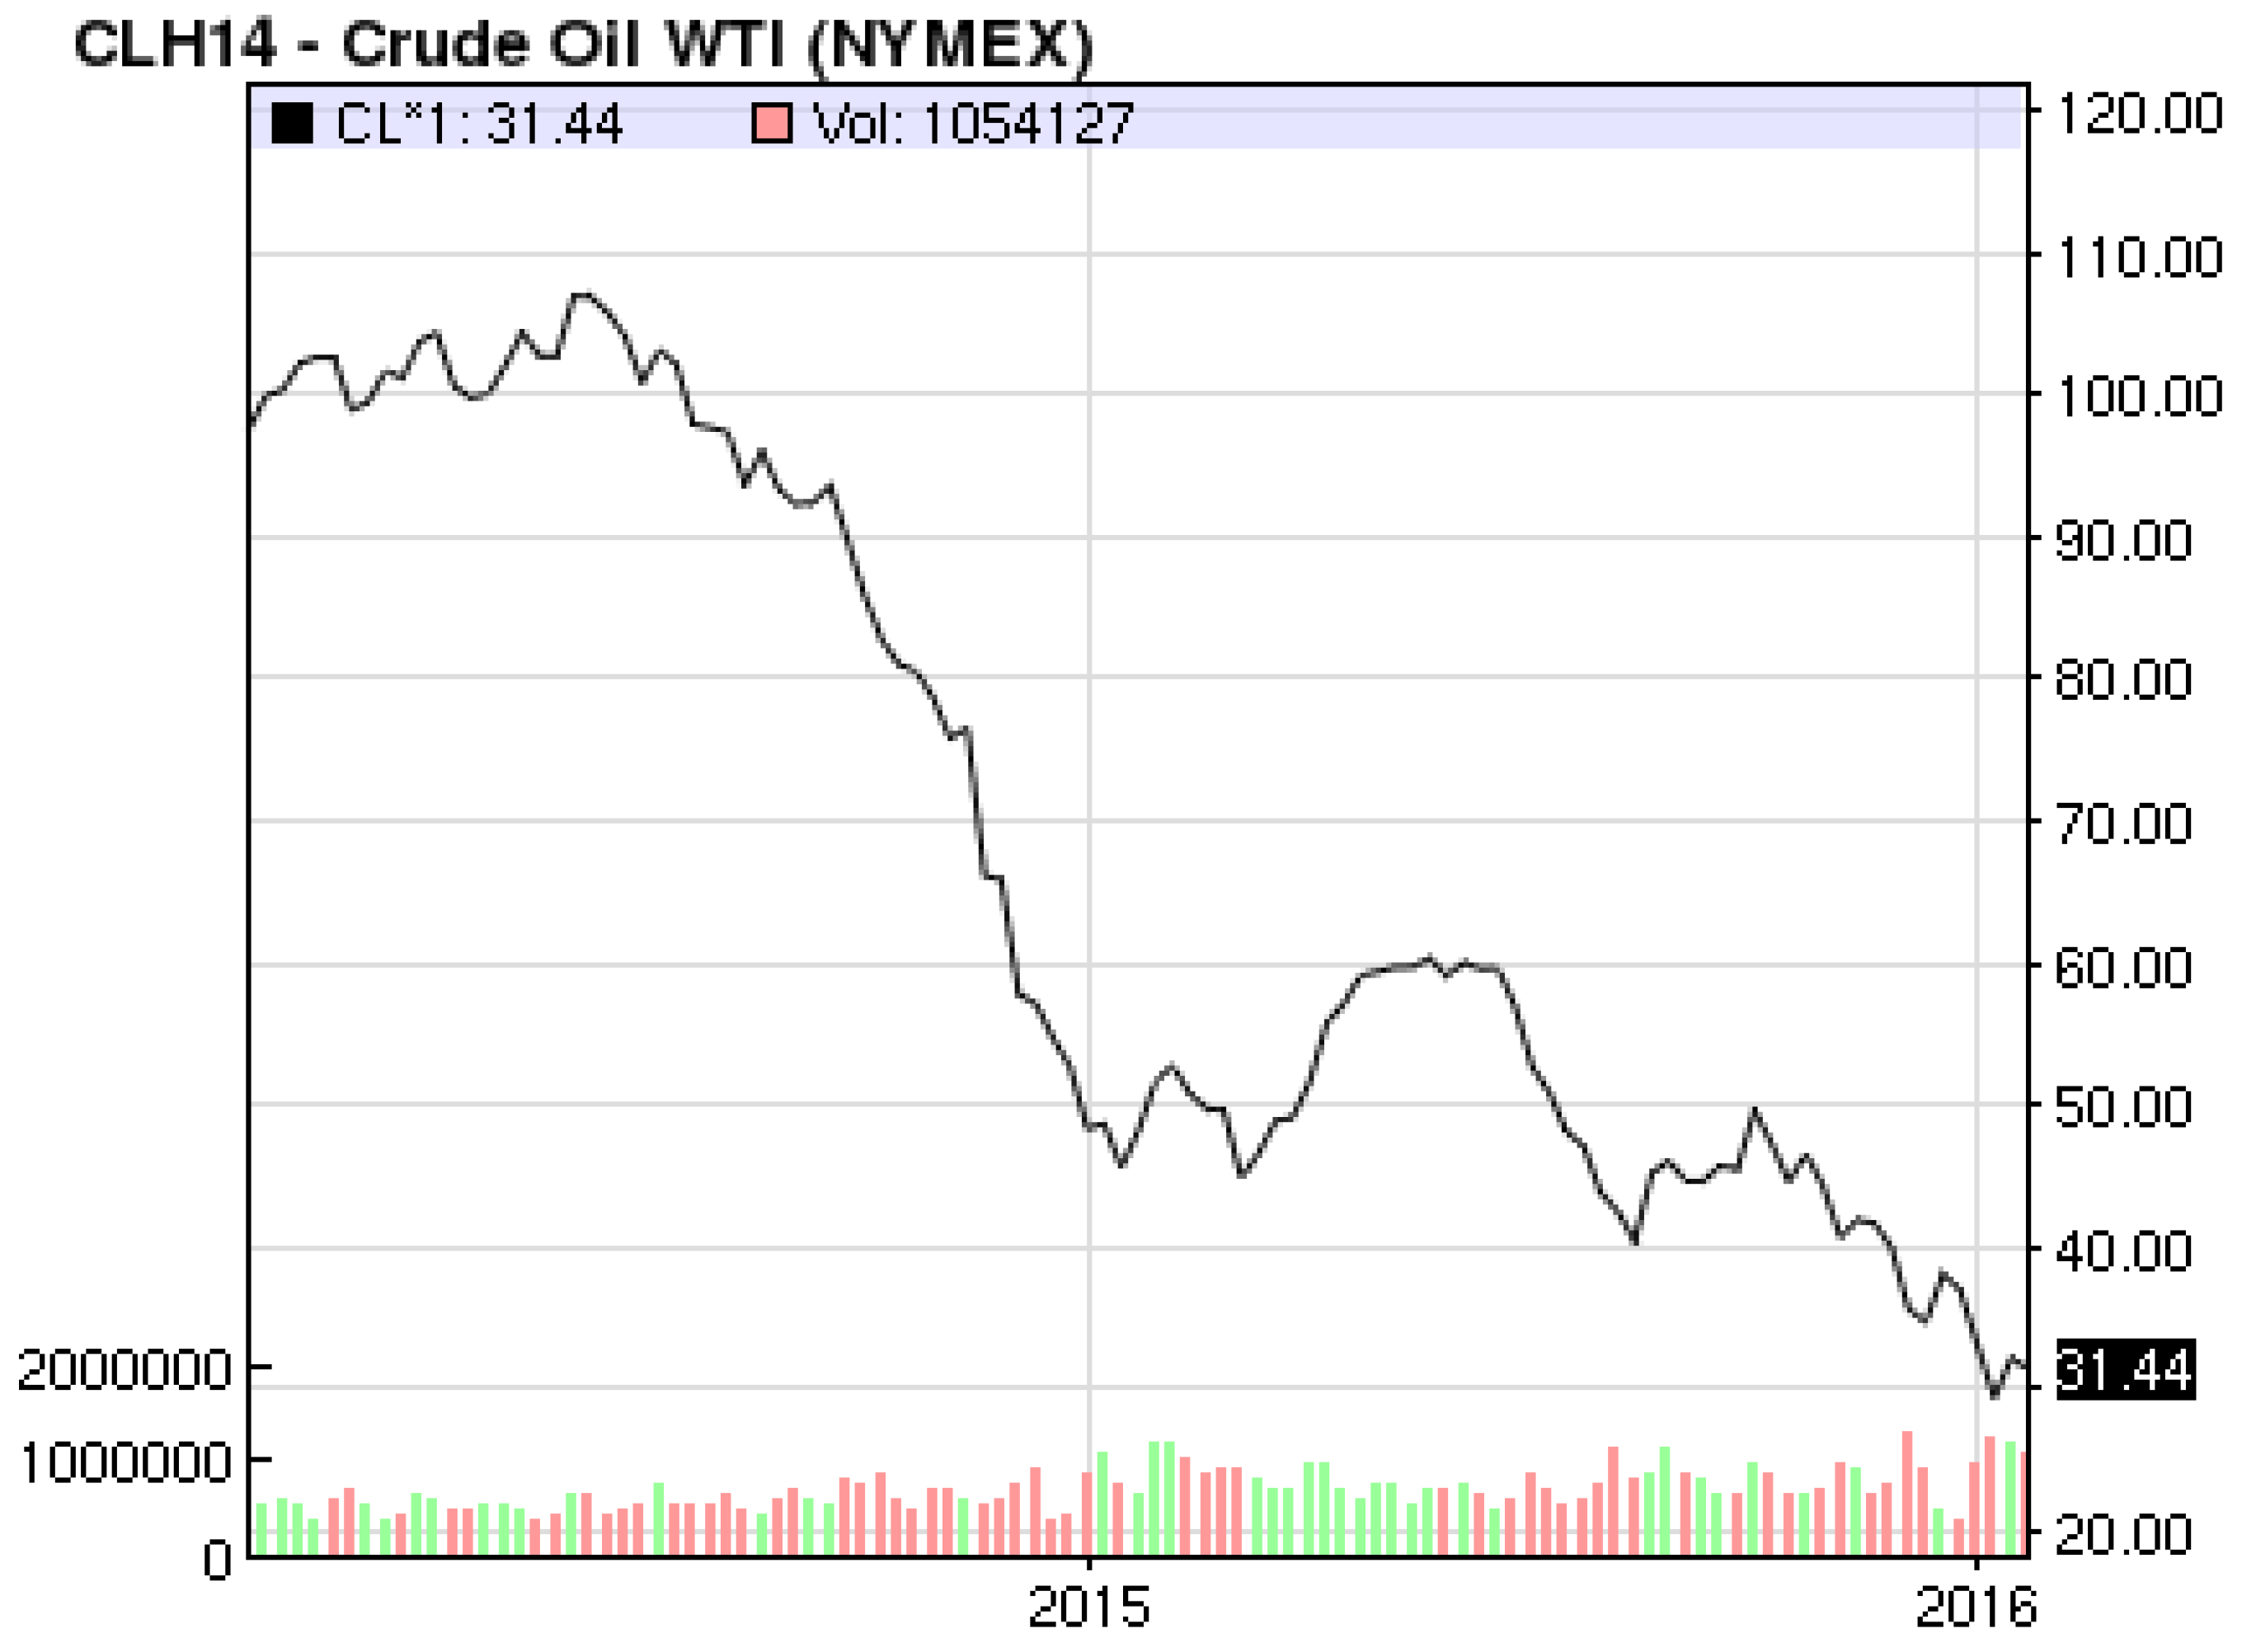
downward trend of the oil price will economically prohibit any further use of biofuels:
“The World Bank is lowering its 2016 forecast for crude oil prices to $37 per barrel in its latest Commodity Markets Outlook report from $51 per barrel in its October projections. The lower forecast reflects a number of supply and demand factors. These include sooner-than-anticipated resumption of exports by the Islamic Republic of Iran, greater resilience in U.S. production due to cost cuts and efficiency gains, a mild winter in the Northern Hemisphere, and weak growth prospects in major emerging market economies. Oil prices fell by 47 percent in 2015 and are expected to decline, on an annual average, by another 27 percent in 2016”.
This downward trend started in mid-2014 when the raw oil price already halved from around US$100 to about US$50 per barrel (see
Figure 5). This specific trend—if continued as forecasted by the World Bank—will singlehandedly
prohibit many political measures to curb GHG emissions. This will especially be the case in the transport sector as the drop in oil and diesel prices, the major cost factor, will in turn increase demand for transportation services, ultimately leading to increased GHG emissions.
We must therefore examine in the next section the real efficiency gains by technology improvement for road transportation over the last few years as the main hope for a significant GHG emission reduction in transportation.
3.1. The Efficiency Advance in Diesel Engines for Trucks
In recent decades, there has been a significant reduction of average diesel fuel consumption
i.e., with trucks. Whereas the average consumption per 100 kilometers for heavy-duty (HD) trucks reached about 50 L of diesel during the 1960s, during the rising oil prices of the 1970s, the average consumption fell to the level of about 40 L. Again, during the first half of the 1980s, average consumption of HD trucks further decreased to about 35 L [
35]. In the last 30 years, though, there has been no significant further reduction of average consumption; there were even smaller increases due to newly introduced emission limits (
i.e., NO
x, SO
x), where, in order to fulfill these regulations, increased burning temperatures as well as artificial after-burner technologies had to be engaged, thereby slightly increasing consumption [
36]. (The current levels of specific truck models are depicted in
Table A1/
Appendix A for more detailed information.) This leads to the assumption that at
reasonable operation costs, there may be a
physical limit regarding further reductions of diesel consumption for HD trucks. Though many technology and research contributions have theoretically shown further reduction potential in the fields of aerodynamics, powertrains, shifting as well as motor technology and driver training, reaching upwards of a further 60% [
37,
38,
39,
40], in real-life business transportation, however, these theoretical values have not been realized in the last 30 years.
Additionally, for further forecast endeavors, it has to be kept in mind that the average age and investment cycle for HD trucks rests between 10 and 15 years depending on the country, and is significantly longer in developing countries. This implies that changes in technology and consumption for new trucks have relevant overall effects on total fleet emissions in operation only with a
significant time and volume lag of about 15 years. For example, as illustrated by
Table 2,the current fleet mix in Germany of HD trucks in 2015 still has a share of more than 50% of trucks in lower emission classes than EURO IV (Emission classes for European trucks are regulated by different emission levels over time by the European Commission/EU, see [
41] and
Table B1/
Appendix B.) EURO IV was introduced in 2005, ten years earlier. In short: Emission values for 2050 are already defined by available—and practically also
bought by business customers, not only in theory—motor and truck technology.
It also has to be noted that not all improvements are as limited and bleak as those in the consumption and GHG emission case. For instance, regarding noise emissions, huge technology advances were realized in the last decades. As explained by the European Commission in regards to Europe:
“Today, 25 modern trucks make less noise than one built in 1980. Trucks have become much quieter over the last 30 years thanks to such technological innovations as special insulation, low-rolling resistance tyres and other noise control techniques. Further reductions could be made by using low-rolling resistant surfaces for new roads”.
Again, however, the time lag problem of investment cycles and usage timelines also applies here; the available technology today does not correspond with the average, overall impact. Technology is therefore a “future option” due to the long investment cycles in transportation—for the transport modes of navigation, rail and air cargo, this is even more severe as investment cycles are much longer. Ships even have cycles up to 50 years.
3.2. Alternative Propulsion Systems for Green Logistics—An Overview
As outlined in the previous section, diesel and combustion engines in general are not going to “save the day” in the near future of up to 2050. Therefore, we explore the alternative technologies available for transportation in this timeframe regarding the potential energy and emission reduction from the technology point of view.
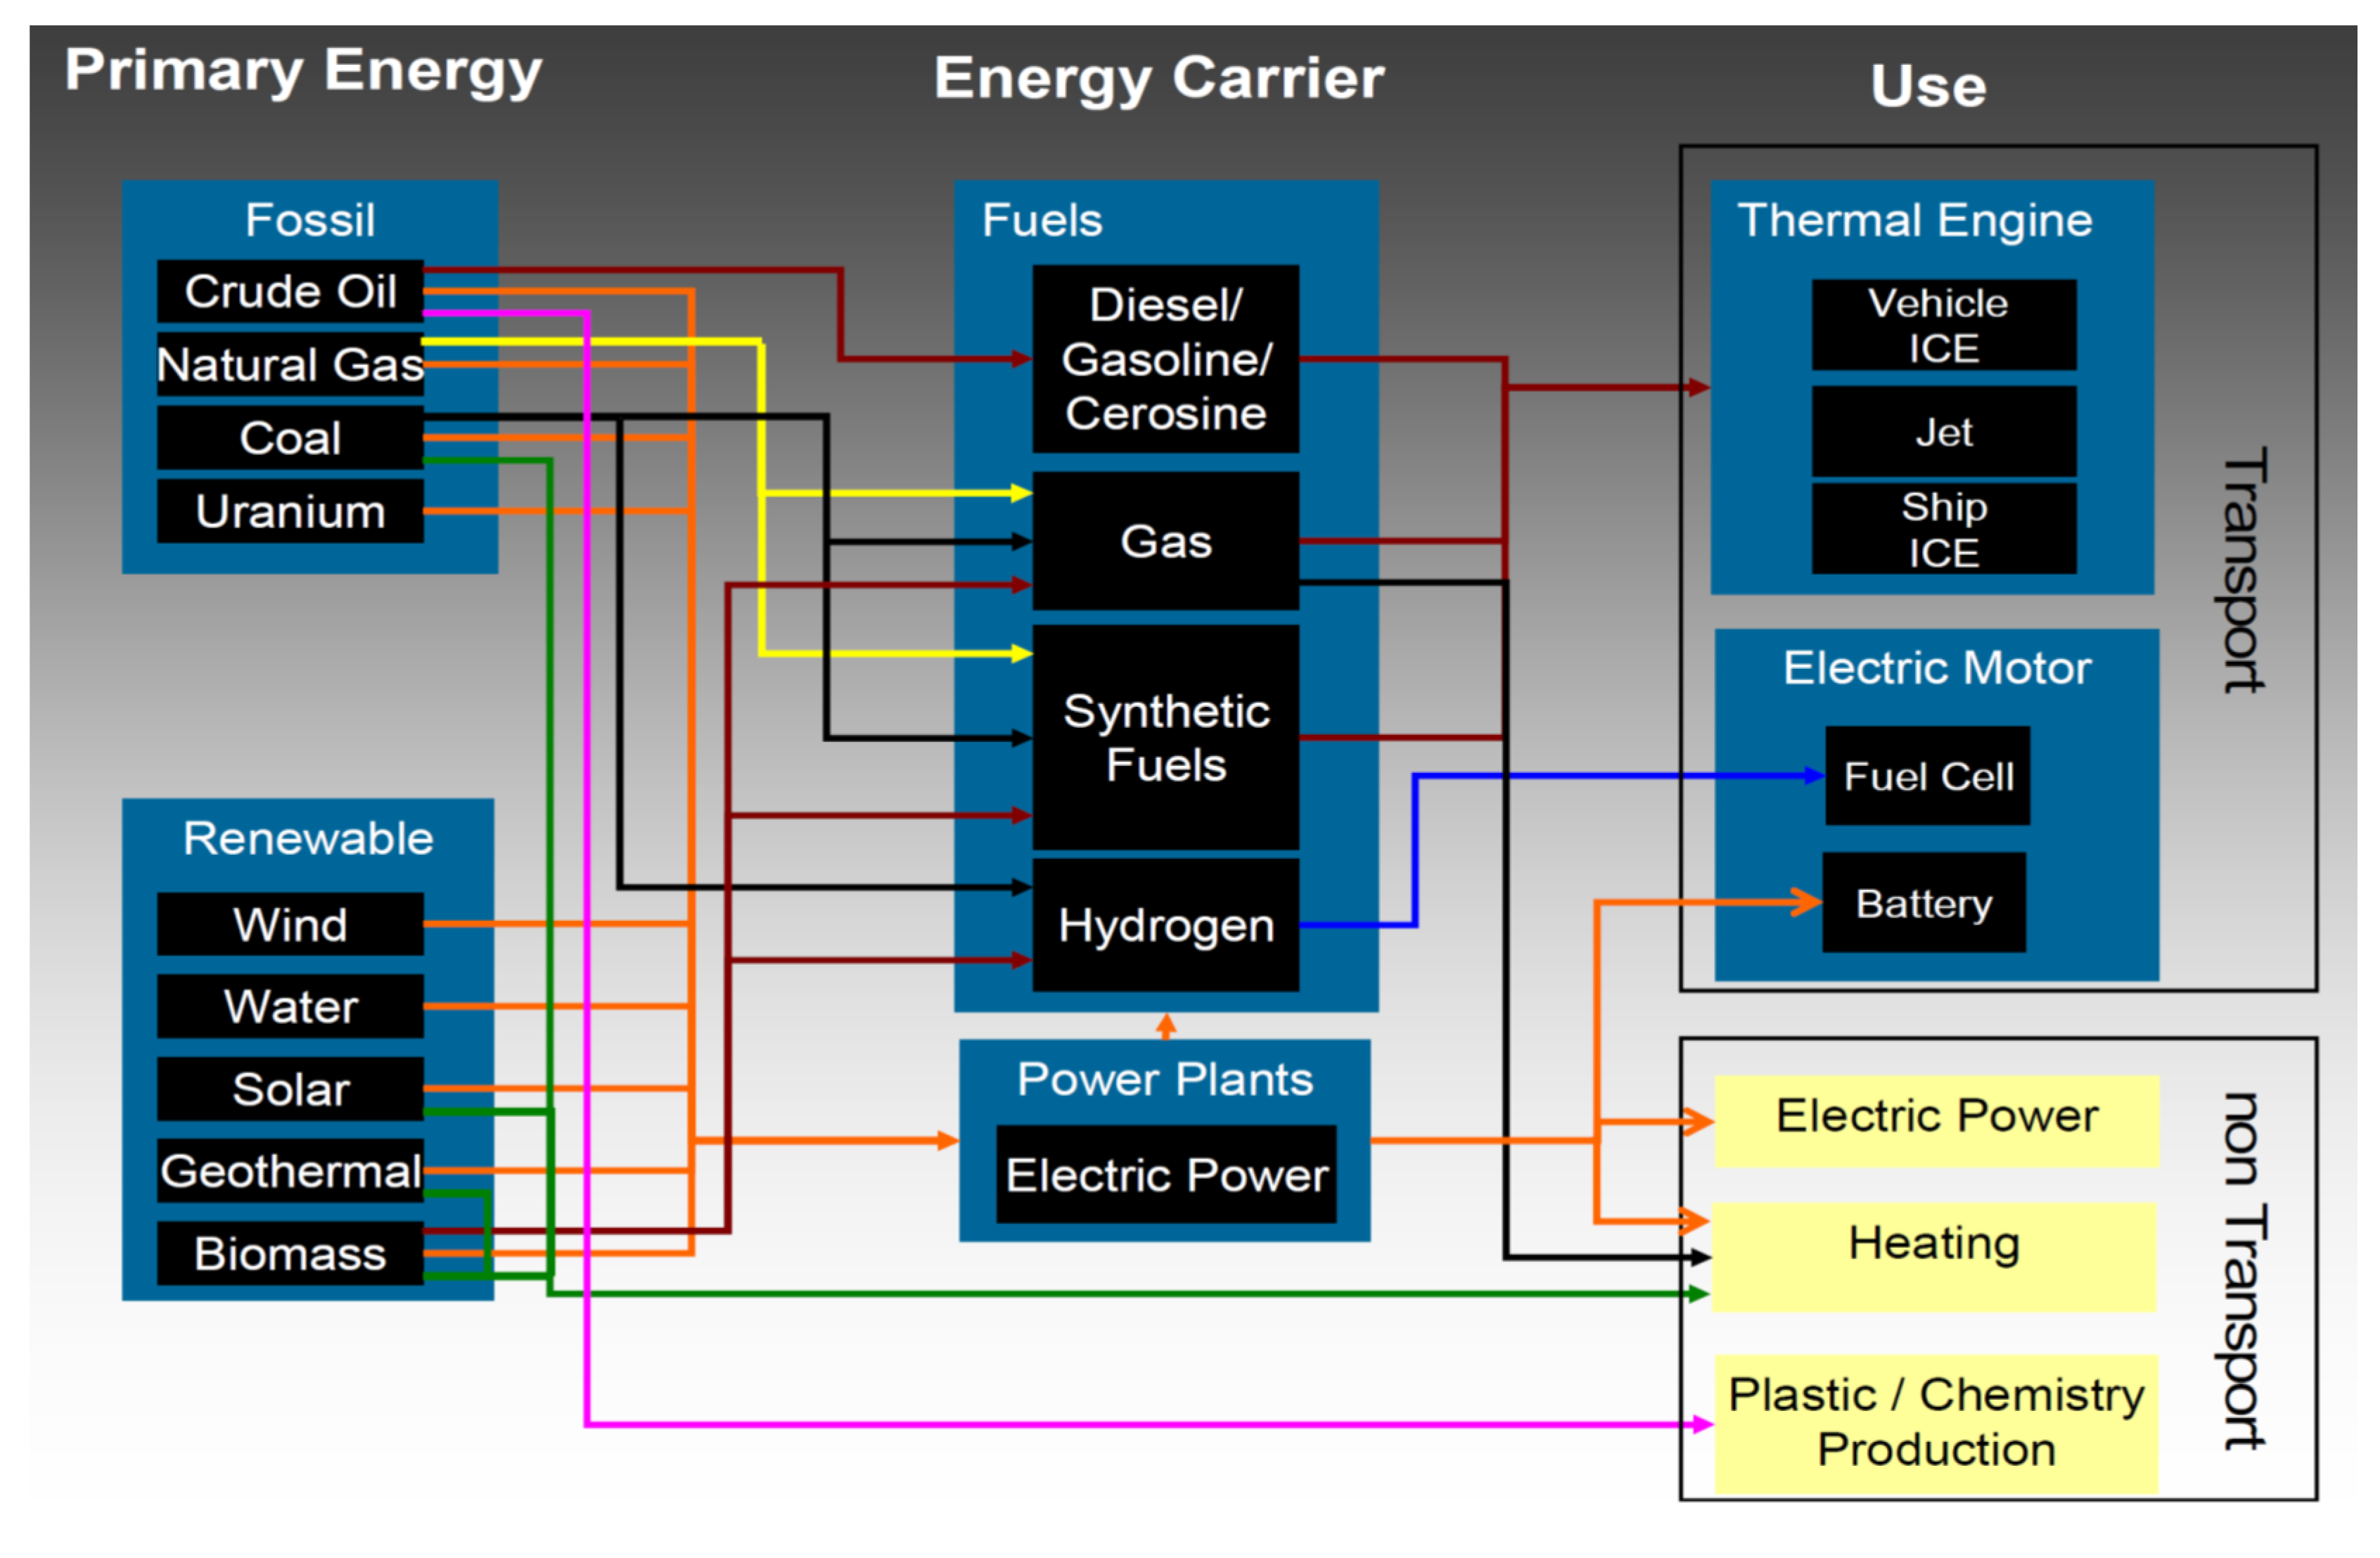
To begin, the viable segmentation of three important areas regarding energy use in transportation has to be recognized according to
Figure 6: For all means of energy pathways into transportation the selection of a
primary energy source is necessary, be it fossil or renewable. Second, an
energy carrier has to be used, choosing from a variety of options
i.e., diesel, gas, synthetic fuel, hydrogen or electricity. Finally, in the third
use section, different engine options can be applied (combustion, electric motor with fuel cell or battery) in addition to the unlisted electricity line networks used for railway transportation (electric motor with network supply of electricity) [
44]. As
Figure 6 outlines, a very high number of combinatory options arises from this distinction—and any informed person may recognize that there will likely be no single solution for all transport modes and applications.
From existing research, it can roughly be deduced that the shorter the transport range, the easier it is to replace combustion engines with electric drives. Conversely, for long-distance transportation, combustion engines with different carrier fuel options will be the mode of choice for a long time to come [
45,
46]. In any case, overall energy consumption as well as GHG emission levels do not so much depend on the second and third stage of the concept, as on the primary energy used. Therefore, a truck system using a combustion engine with synthetic fuel from renewable biomass production may be more sustainable than an electric truck supplied by electricity produced from fossil coal energy.
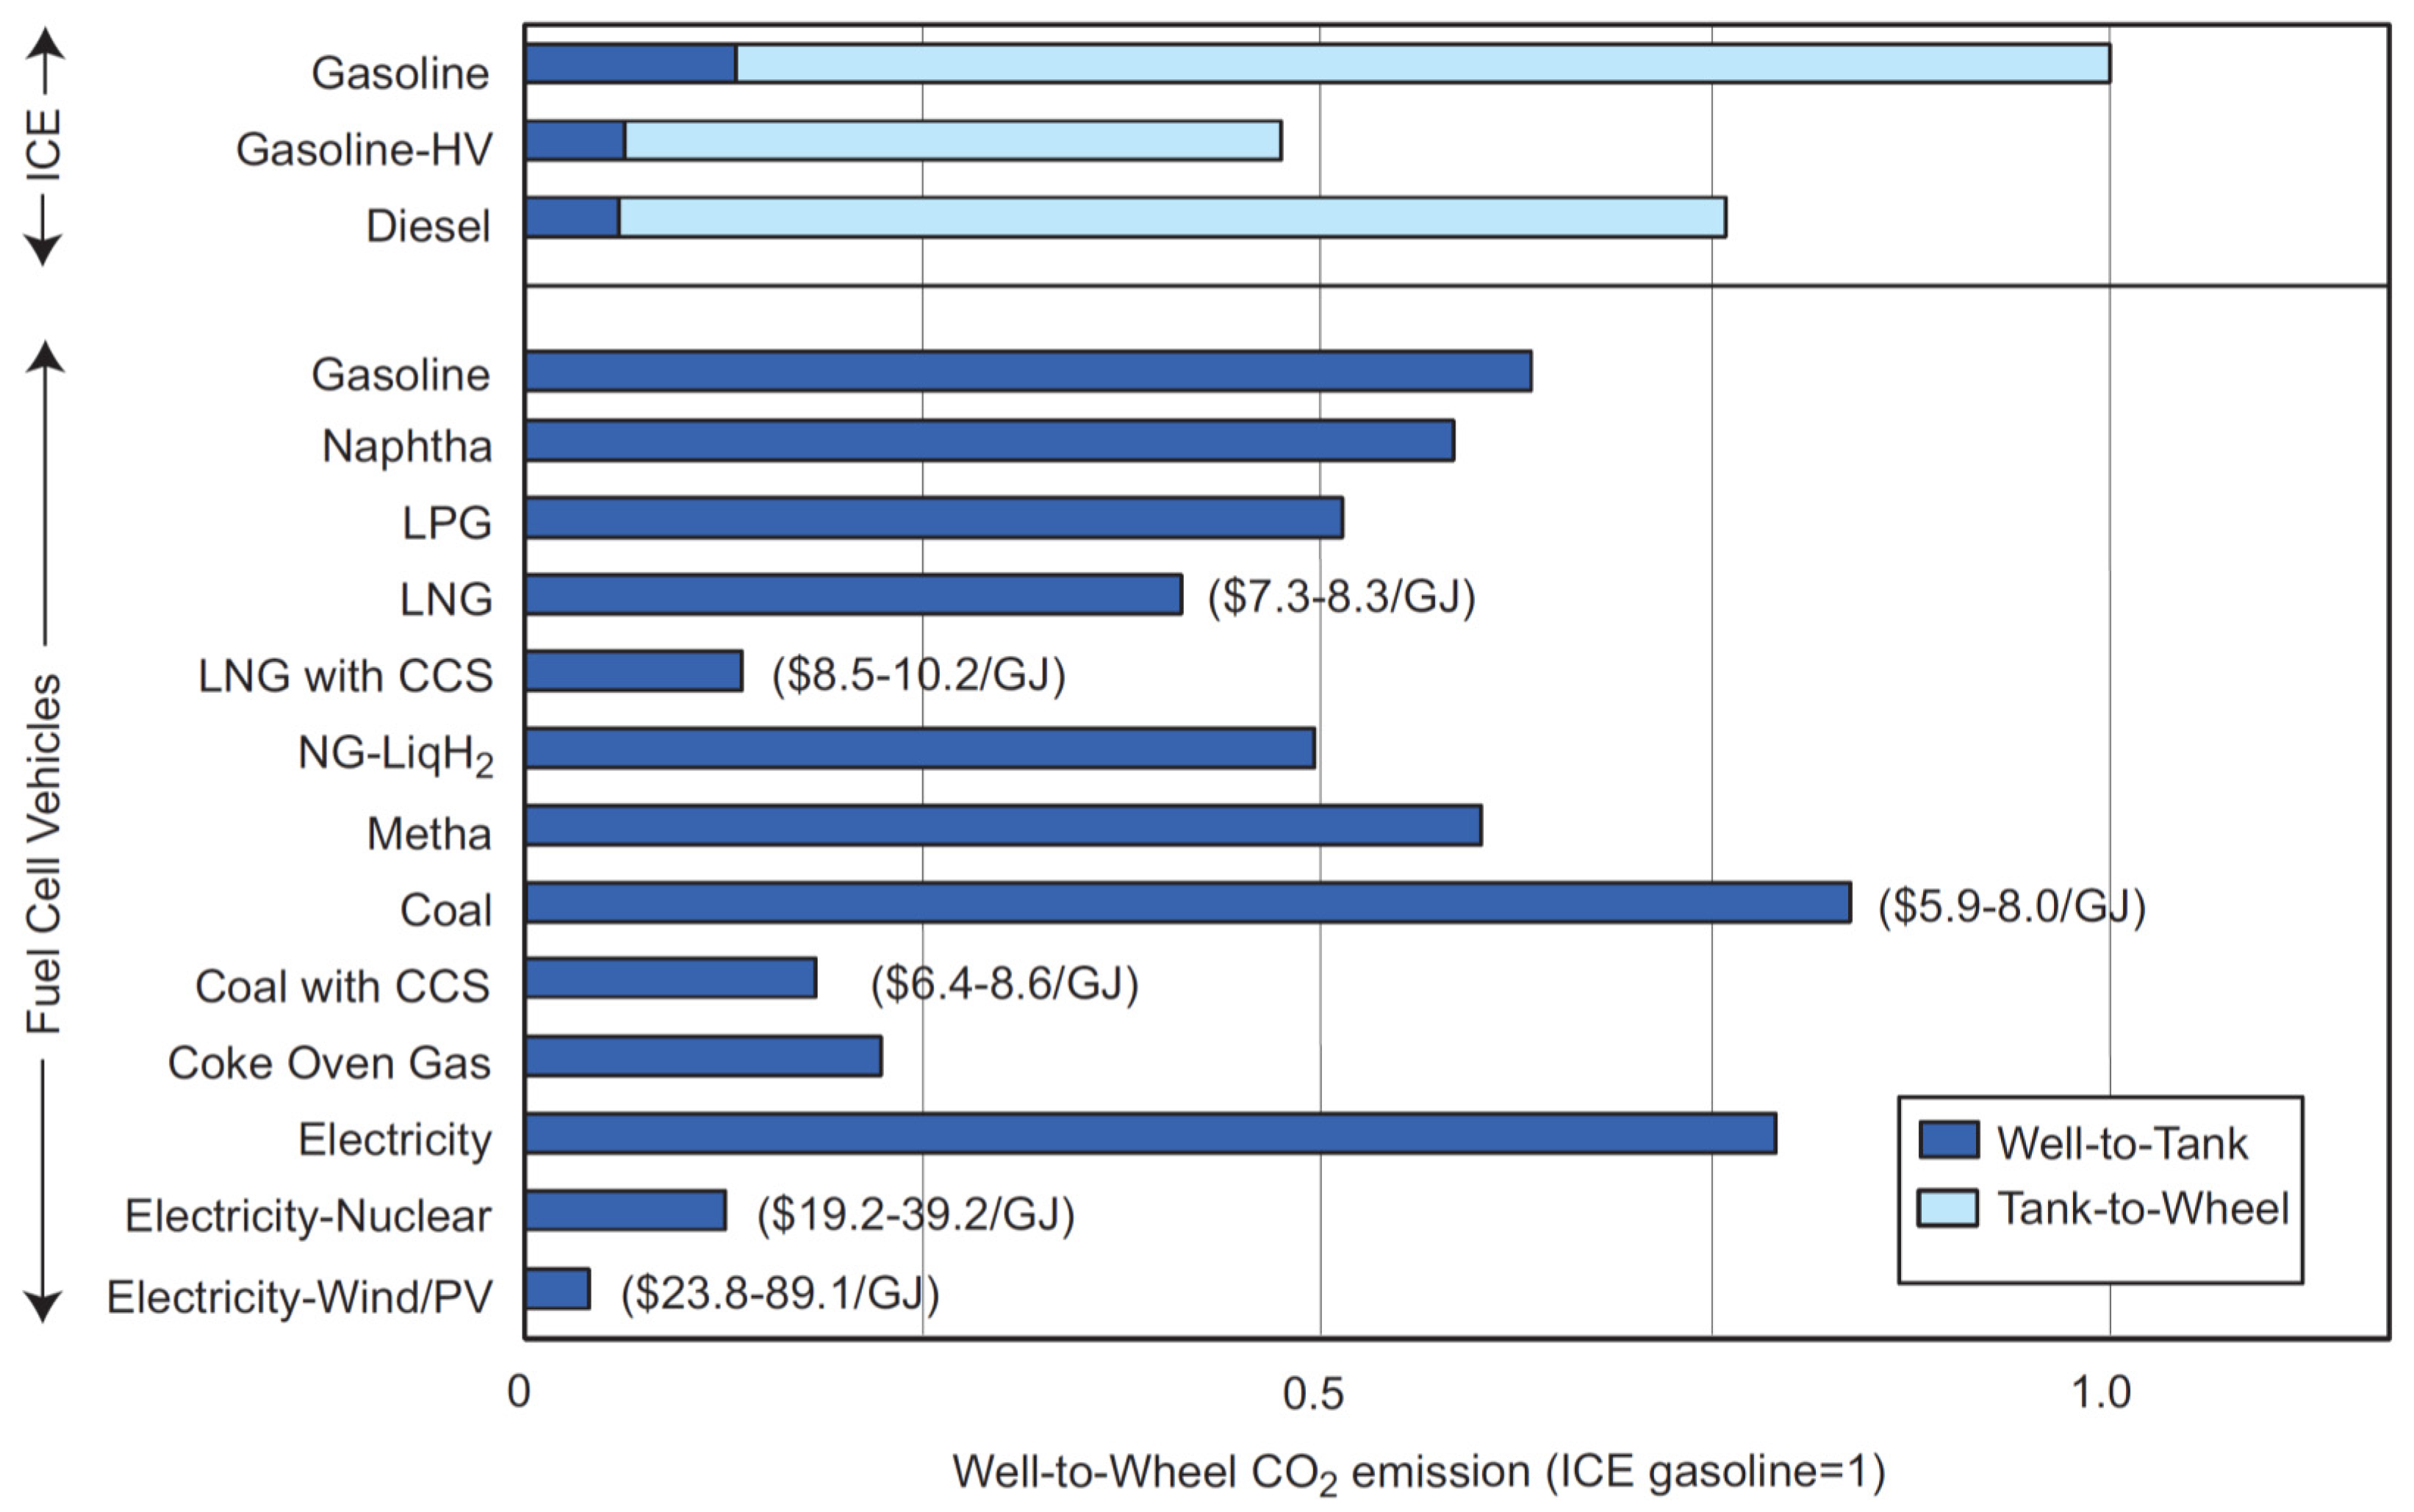
This is specifically outlined in
Figure 7 below for different propulsion systems based on hydrogen, showing that significant reductions of carbon emissions can be achieved compared to the gasoline combustion engine (index) with a variety of systems as e.g., liquified natural gas (LNG) or electricity supplied by wind or photovoltaic electricity. However, as is indicated by hydrogen production costs, significant investments in the technology and in the upstream energy production in a sustainable fashion are necessary in order to reach this objective.
This still huge investment and technology hurdle for the future development of green logistics and transportation has also been commented on by the European Commission regarding battery technology as follows:
“Greater efforts are needed to increase electro-mobility: today’s electric car would need a battery pack weighing 2500 kilos to provide the same energy as a diesel car with a 50-litre tank”.
Furthermore, as outlined, some transportation segments like high payload as well as long-distance transport will remain dominated by combustion engines due to physical limitations. Hopefully, however, we will be able to implement more sustainable energy and fuel concepts for these combustion engines in transportation based on renewable primary energy [
45,
46].
Why there has been no significant reduction in emission levels despite the technology improvements described is the question for the next section regarding the rebound effect.
5. The Median Voter and Time-Distorted Voter Preferences in Transportation Policy
This section is enlarging the analysis to the political and social field of political decisions in interaction with voter demands and preferences. Regarding green logistics, the field of transportation and traffic policies in general is addressed. According to the median voter theorem [
64,
65], politicians will rationally align their implemented policies with the view of the median voter in order to guarantee a majority vote or acceptance (
i.e., a majority share of votes in the next upcoming election). Therefore, policies regarding green logistics and transportation
—i.e., with a higher taxation on emissions from traffic and transportation or other measures for supporting a modal shift or even a reduction in traffic—have to face the test of consumer and voter preferences. Otherwise, no rationally acting politician would be found to support and put such policies to a vote nor support their implementation.
5.1. General Insights in Consumer and Voter Preferences Regarding Green Transportation
Basically, two important consumer and voter characteristics are intertwined and are at play in the field of green transportation:
First, all consumers are also affected by changes in transport policies and regimes via their consumer role in passenger transport. For example, cost increases via taxes for road or rail transportation will affect them personally when travelling by car or public rail transport. Therefore, the voter preference structure will tend heavily towards lesser taxation or regulation than possibly necessary for a real sustainable development in transportation.
Second, people have largely time-distorted as well as place-distorted preferences: Rationally, consumption and wellbeing today and in the personal environment is valued higher than the future. This leads to massive rejection of traffic restrictions and taxation today, incurring future transport and ecological cost tomorrow due to impacts of climate change, traffic jams or other feedback loops. Furthermore, in traffic and transportation politics, also the place-distortion is hugely important: According to the “St. Florian Principle,” people prefer external burdens like traffic routes to be placed away from their own vicinity, as far away as possible. This affects infrastructure projects as can be seen today in Germany, for example, with major rejection of much-needed electricity pathways from north to south in order to sustain the renewable energy boom network-wise. Though everybody supports green electricity from wind energy in general, single voters and consumers do not want to be affected by the specific burden of having an electricity line running through their neighborhood. This leads also to obstructions for planned railway lines which could enable a favorable modal shift in cargo transportation.
Both characteristics regarding voter and consumer preferences lead to a very restricted field of possible action and support in transportation politics, especially regarding sustainability—which will per definition restrict consumption and transportation today in order to sustain possible transport capacity in the future (“future generations” according to Brundtlandt).
5.2. The Example of German Truck Toll Policy
The German truck toll was introduced in 2005 based on a highly elaborate system with automatic GPS recognition of individual trucks. Besides very questionable political decisions regarding the operating private business consortium, a more recent decision will be analyzed for our research into green transportation policy: On 1 October 2015 for the first time since introducing the truck toll system, trucks with total payloads between 7.5 and 12 tons have to pay the toll too [
66] (see
Table 3). Historically, from the start, trucks up to 12 tons were exempt from the taxation system. Now, arguably in enlarging the income base for the toll system, the German political leadership has decided to enlarge the tolled truck fleet.
This has severe and, as will be shown, negative consequences for green logistics and transportation:
- (i)
First, from a business investment perspective, a large write-down of fleet business values has to be acknowledged since a large share of the last-mile and distribution truck fleet was specifically bought with an 11.99-ton payload to avoid the toll while still transporting as much payload as possible. This even led to the emergence of a new weight class of trucks, not existent before. Now all these investment calculations are void and logistics businesses have to face a significant write-down of corporate value regarding the truck fleet between 7.5- and 12-ton payloads—which is economically highly unsustainable and furthermore an undermining of general business trust in politics.
- (ii)
Second, transport companies may further use the same trucks with up to 12 tons of total payload but try to avoid the tolled streets (in Germany: motorways and four-lane highways), which will lead to longer transportation routes and therefore more travelled kilometers per shipment as well as higher emission volumes. This is clearly a negative consequence regarding sustainability as emissions per shipment will increase. Additionally, this will prevent the objective of internalization of external costs (road infrastructure, injuries, environmental impact) strived for in sustainability concepts as individual corporations may be forced to align their individual profit maximization with social cost and improvement objectives.
- (iii)
Third, as an alternative choice, logistics service providers may choose to soon replace the trucks with new, still toll-free trucks below 7.5 tons of total payload. This again will lead to a very negative effect on transportation-based emissions: As the same amount of shipments and shipment weights have to be transported, the average emission level per tonkilometer will increase. This is based on the physical fact that the share of cargo payload to total weight of the truck is increasing with size—and also the fact that fuel consumption is largely dependent on aerodynamic drag and not so much on total weight. For example, a 7.5-ton truck may transport about 2.5 tons with a fuel consumption of about 17–18 litres—whereas a 40-ton truck may transport about 25 tons of cargo payload with a fuel consumption of about 35 litres. Therefore, the smaller the truck, the more emissions per payload and shipment. Alas, also this third option means logistics companies are faced with comes with a negative effect on transport sustainability.
Altogether it has to be judged that the short-sighted incremental political decision to enlarge the truck toll fleet range by total weight has very huge and
negative sustainability consequences. A better political concept would have been to legislate a mandate for an enlargement of the truck toll to
all total weight classes (or even with increasing toll rates for smaller trucks as the above-depicted range for emission classes in
Table 3 is still very small and ineffective) for about 5–10 years down the road (
i.e., 2025). This would have left the companies with sufficient time to adapt and invest in sustainable truck fleets. But the median voter and politicians’ explanation models prevent such rational concepts because this regulation would be debated for the whole timeframe of anticipation; politicians thus aim for fast implementation. On the other hand, as implementation is some years ahead, the same politicians expect to not be the ones to profit from the increased toll income but rather their successors—which is not sufficient motivation to implement such ideas.
5.3. The Policy Example of Electric Vehicles and Trucks
A second example can be recognized in the political initiatives and programs regarding electric vehicles: Though scientifically the sustainability advantage of electric cars and trucks is highly questionable and, for the case of Germany, definitively negative (due to the specific electricity mix with a large share of coal-based electricity production, even increasing carbon emissions by electricity production due to the exit from nuclear electricity production), politicians still put money into supportive programs based on e-cars and e-trucks. This shows in addition to a specific lobbying success that politicians aim to “show off,” explaining to voters that they are doing something about climate change and green transportation—knowing that the average voter will not understand the complex scope of the three carbon balance sheets for necessary electricity production.
This is not negating the fact that there are local advantages of electric cars and trucks (less noise, less emissions locally)—but the global sustainability balance is dependent on the electricity production mix and, in countries like Germany (and China, also investing heavily in electric transportation) with a high share of coal, this energy mix is negative. This again is the median voter model at work: Politicians are looking for easy-to-communicate solutions to generally acknowledged problems of society—though such easy solutions are increasingly seldom as especially global sustainability interactions increase.
There is no easy-to-fix solution for this voter and politician interaction problem regarding green transportation. The only viable improvements may come from increased transparency, increased communication from science towards the general public (honestly pointing at such problems and not primarily looking for further research funding), as well as increased education and knowledge for the general population. From the median voter model, the future expectation is that, with the increased education and access to information of the median voter (for at least half of the population), politicians and policies may follow this enhanced and informed view.
6. What to Do About It: Possible Routes for Green Logistics and Green Transportation Policy
Though the outlined facts and concepts behind the current history of green logistics may look bleak compared to the expectations and the policies required for facing and fighting climate change, there are possible ways forward. It has to be recognized that technological improvements are feasible and the “How to do it?” question is not so much the problem. The more important problem is the “How to implement it?” question; it is hence more or less a policy question in combination with business actors in logistics. But as outlined in the previous section, individual actors (industry, logistics service providers, consumers) mainly need clear and especially long-term framework regulations in order to act individually as well as in a socially efficient manner, also in the sustainability domain. (This notion can be traced back to the “invisible hand” propagated by Adam Smith already in 1776—and we can assume it still holds today.) Though as the chapter on transportation from the IPCC report (2007) describes it, not much hope can be put into sheer price signals and taxation as the road to governmental action:
“While transport demand certainly responds to price signals, the demand for vehicles, vehicle travel and fuel use are significantly price inelastic. As a result, large increases in prices or taxes are required to make major changes in GHG emissions”.
As outlined above, such high taxation as is probably necessary is not popular with voters and therefore is not a viable option for rational policies and politicians. Also, many diversion and side effects are to be expected from any tax and pricing regimes in transportation [
68,
69]. Alas, two other roads towards a significant decrease in energy use and emissions from the transportation sector are explored below in order to provide an indication as to how even rational policies could implement real change for a green logistics and transportation future.
6.1. Supply Side Restrictions and Management of Raw Materials
One option may be the strict curbing of carbon primary energy like coal, oil and gas. As the international sources for these energy sources are limited, a tight control and rationing may be an option, though expectations for success may be limited due to negative experiences i.e., with the OPEC cooperation, to reach such an objective. Individual actors such as the EU, the US or China may complement this with an increased (and, as previously outlined, at best a known gradual increase over a longer period) customs taxation for inbound carbon primary energy. Though hard to implement politically, especially a long-term strategy with a gradual increase of taxation or restriction levels (e.g., as previously experienced with other products such as textiles) the market would be perfectly suited for an increase in technology development and use it to adjust to this restriction. Thus, for example, if a major player like the EU, US or China would ration the carbon primary energy import (on a decreasing level), prices may rise but not so steeply over the long term since technology adaption will allow for a larger decrease in specific consumption.
Therefore, such a solution may bring a real absolute reduction of carbon emissions, also from the transportation sector, without too much (though maybe some) restrictions to transportation. In any case, the necessary innovation may be supported and spurred in a long-term perspective. According to the political analysis outlined before, this way forward may still be problematic and “politically inaccessible,” due to voter rejection and also prohibitive cooperation necessities among states (“prisoner’s dilemma”). Therefore, a further productive way is outlined in the next section.
6.2. Supply Side Investment and Public Provision of Transportation or Fuel
In the past and indeed since the publications of Adam Smith, it was an established paradigm that the
public, hence the state, shall provide infrastructure as the central task for supporting a free market economy. Though until today many combination and cooperation models also with private and near-market provisions for public transport infrastructure such as toll systems and private management of motorways, rail tracks as well as sea and air routes have been implemented, still the majority vote goes for a
dominantly public provision of transportation infrastructure. This is a second option for significantly improving the sustainability of transportation and logistics, with the burden of large investments needed to green the public infrastructure as a basis for greener transportation and logistics systems in the day-to-day business. All solutions will have to integrate future information-based services and options [
70]. Chances of economic development depend heavily on such solutions as, otherwise, economic growth and wealth may be restricted [
71]. Specifically, public provision of green transportation may come about in two forms:
- (a)
For rail- and network-based services, the state may provide the network infrastructure (as done today in many ways, by paying for the railway networks, etc.). This could be undertaken in a sustainable way, as, for example, the state producing and providing renewable energy for electrified railway tracks. This would have to happen at market-bearable costs or even at subsidized cost levels in order to support a modal shift from truck to rail transport.
- (b)
For individual transportation i.e., road or sea, there might be an option for a publicly provided supply of biofuels. This has to be within the parameters of second-generation biofuels such as hydrogen produced from a renewable energy like wind energy. Also, the price would have to be heavily subsidized to be competitive with fossil fuels, at least for a start phase of 15 to 20 years. This has been performed successfully e.g., within the German renewable electricity production system from solar and wind sources. This could work in a productive and complementary manner to the first option of restricting or taxing carbon primary energy as then the subsidized price of the biofuels would not have to be so high—i.e., expensive for the taxpayer.
Both described provisions will necessitate a long-lasting and costly engagement of public policy and budgeting towards green transportation. In this way, however, there may be a real option for reducing absolute energy consumption and emissions from transportation in spite of growing transport volumes and alongside increased technological efficiencies.


